Present-day central African forest is a legacy of the 19th century human history
- University of Liège – Gembloux Agro-Bio Tech, Belgium
- Royal Museum for Central Africa, Belgium
- ISEM, Institut des Sciences de l'Évolution, UMR 5554-CNRS, Université Montpellier II, France
- Département Environnements et Sociétés du CIRAD, France
- FRM, France
Figures
Figure 1

Paleoenvironmental changes and human activities in the Sangha River Interval.
The 34 sites with paleoenvironmental data (fires) and the 38 dated archaeological sites and discoveries (pots) are indicated on a vegetation map modified from Gond et al. (2013) (http://www.coforchange.eu/products/maps). The seven sites used to monitor tree growth (trees) are also indicated (see Supplementary files 4, 5 and 6 for site names). Brown (three shades): savanna of the Sudano-Guinean domain; orange (three shades): savanna included in dense forest; yellow: savanna-forest edge; purple (two shades): very open forest; blue-green: open semi-deciduous forest; medium green (three shades): dense semi-deciduous forest; dark green (five shades): dense evergreen forest; light green (two shades): open evergreen forest; light blue (two shades): swamp forest and swamp. Map: QGIS 2.14 (http://www.qgis.org), CAD: Illustrator CS4 (https://www.adobe.com).
Figure 2 with 2 supplements
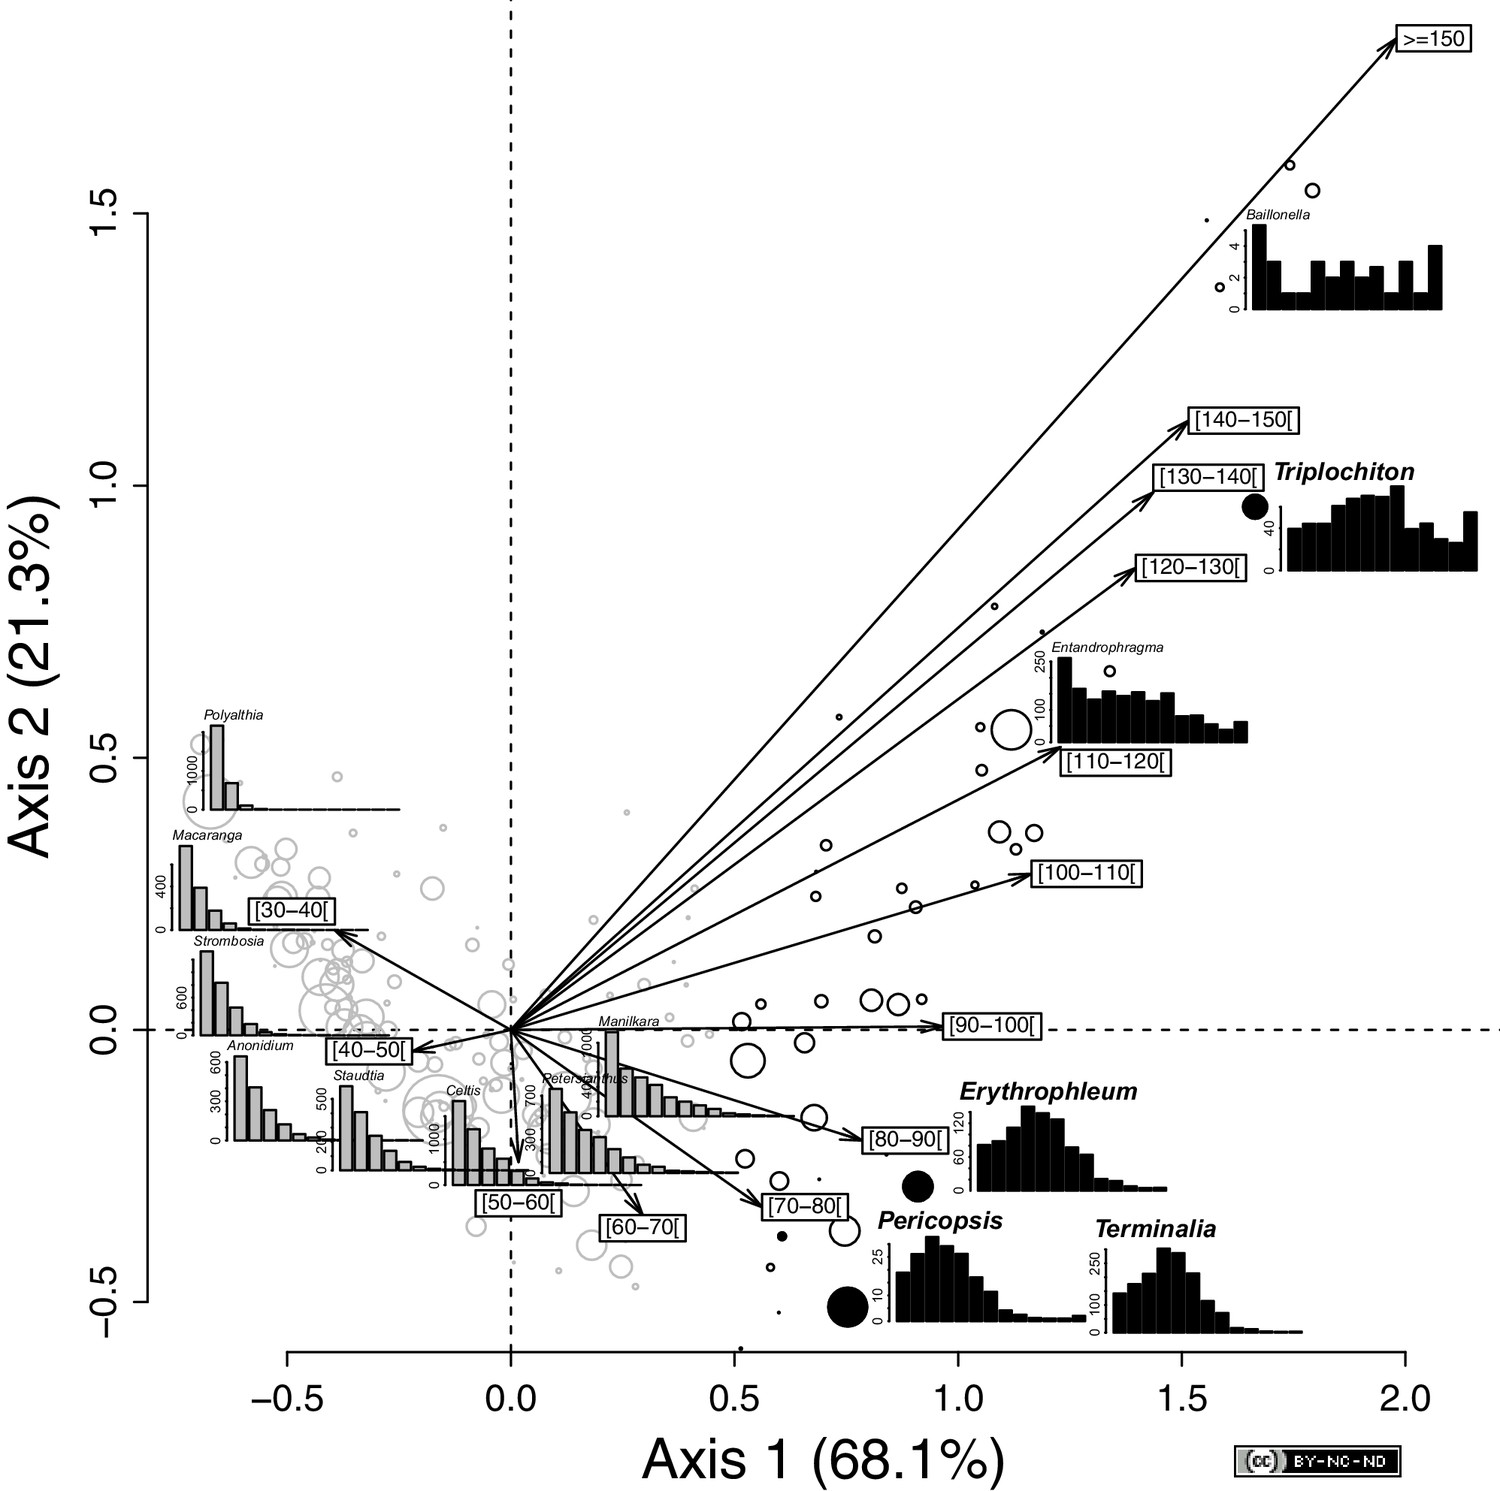
Variation in tree diameter distribution among the 176 genera across the SRI.
Projection of the genera and the 10-cm-wide diameter classes in the ordination space defined by the first two axes of a correspondence analysis of the abundance matrix, as defined by 176 genera and 13 diameter classes. The size of the circles is proportional to the square root of the genus abundance. The color of the symbol corresponds to the two groups identified with a clustering analysis (based on Euclidean distances and an average agglomeration method) on the species score on the first factorial axis. Genera that showed a reverse-J diameter distribution (n = 134) are indicated in gray and those genera that showed a deviation from the reverse-J distribution (n = 42) in black (e.g., Baillonella). Black filled circles indicate the four genera that are monospecific in the SRI and used for the age estimations. Diameter distribution of the 10 most abundant genera is shown in addition to that of the four selected genera: Celtis (gray), Polyalthia (gray), Strombosia (gray), Petersianthus (gray), Manilkara (gray), Entandrophragma (black), Terminalia (black), Anonidium (gray), Staudtia (gray), and Macaranga (gray). Statistics: R (https://www.r-project.org/), CAD: Illustrator CS4 (https://www.adobe.com).
Figure 2—figure supplement 1
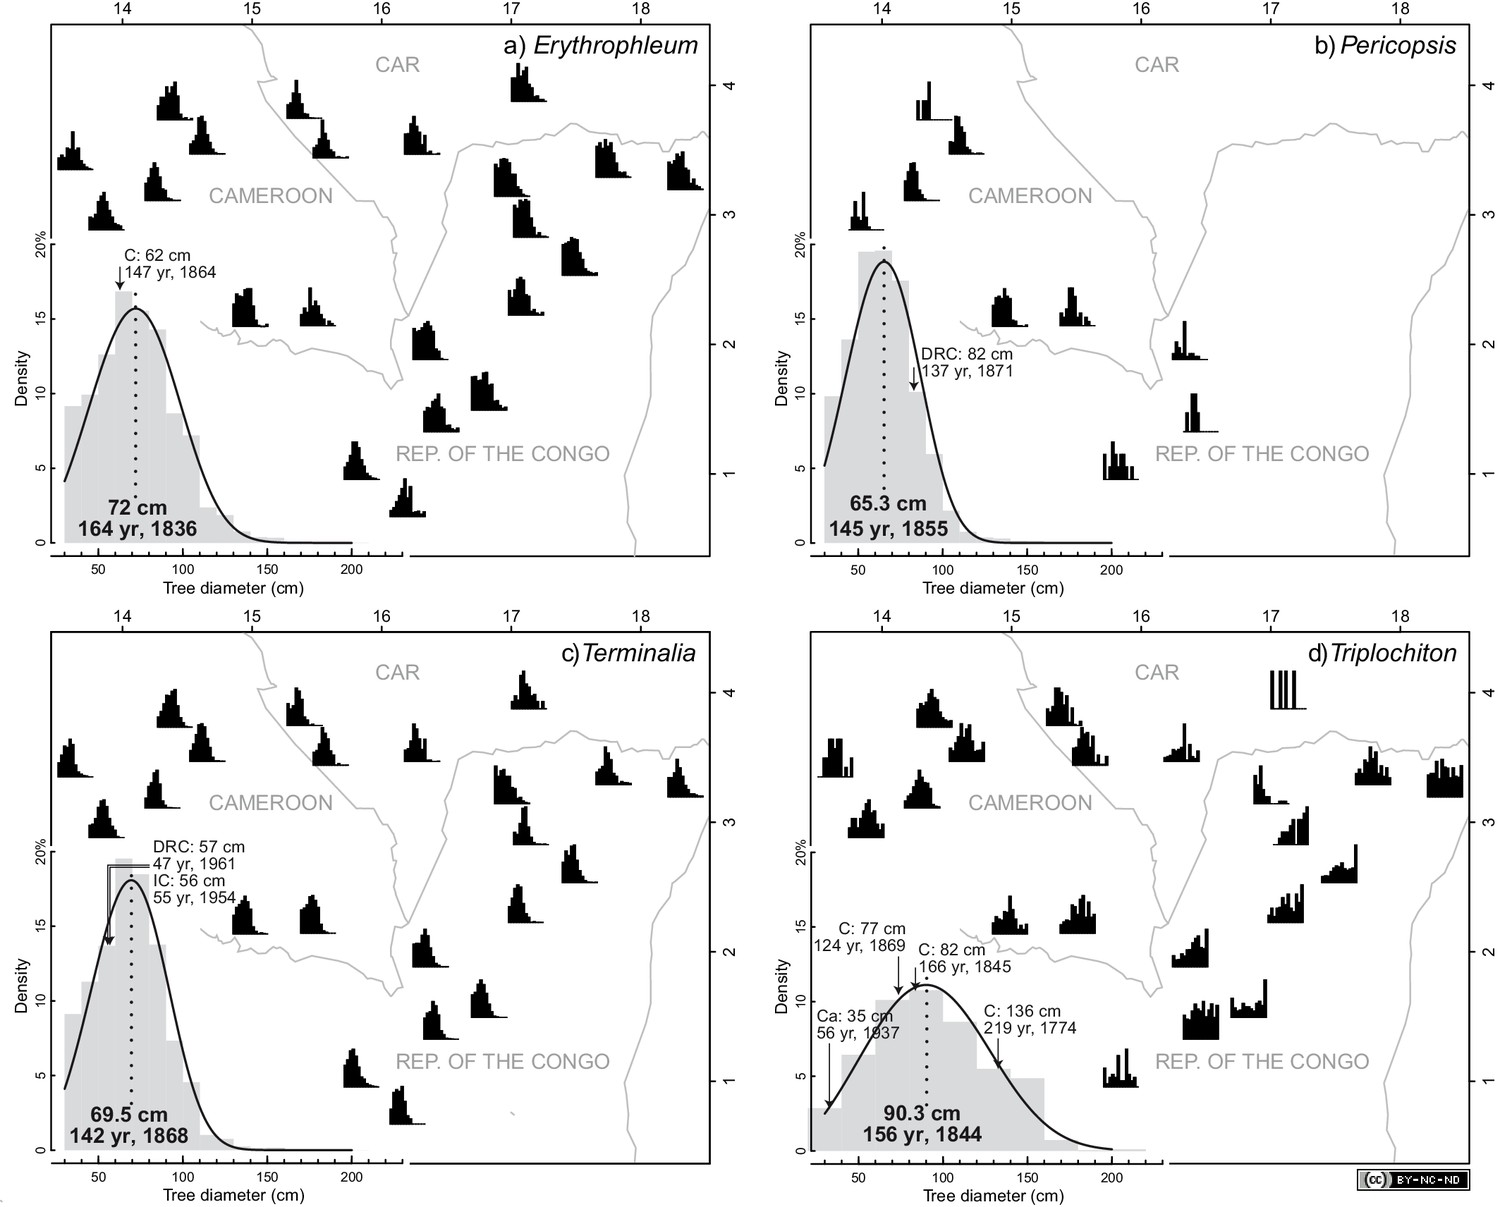
Distribution of diameters of the four study species in the 22 study sites (black).
The solid lines on the average diameter distributions (gray) correspond to the fitted parametric diameter distribution (Weibull), which was used to estimate the mode and corresponding age. Ages and dates (AD) in the Sangha River Interval were estimated using the mean annual increment of diameter of (a) 367 Erythrophleum suaveolens, (b) 199 Pericopsis elata, (c) 152 Terminalia superba and (d) 265 Triplochiton scleroxylon. Age estimations were validated with published tree-ring data for these four species in natural forests in Cameroon (C), the Democratic Republic of Congo (DRC) and the Ivory Coast (IC) (Supplementary file 3). Maps: QGIS 2.14 (http://www.qgis.org), CAD: Illustrator CS4 (https://www.adobe.com).
Figure 2—figure supplement 2

Growth models (a, c, e and g) and growth trajectories (b, d, f and h) for the four study species based on tree-ring data.
Eight growth models (i.e., Canham, Gompertz, Verhulst, Power, Power mult, Lognormal, Linear and Mean) were fitted to the data. Age estimations were obtained with numerical solutions to ordinary differential equations (ODE). Solid lines correspond to the model prediction on the observed range of diameters. Dashed lines correspond to the predictions for small trees (below the inventory threshold of ≤10 cm). For growth models, the color of symbols indicates access to light (light gray = emergent and dominant trees, Dawkins 5; gray = canopy and codominant trees, Dawkins 4; black = lower canopy and understory dominated trees, Dawkins ≤3). For growth trajectories, age/diameter values based on published tree-ring data are indicated in light gray. Statistics: R (https://www.r-project.org/), CAD: Illustrator CS4 (https://www.adobe.com).
Figure 3
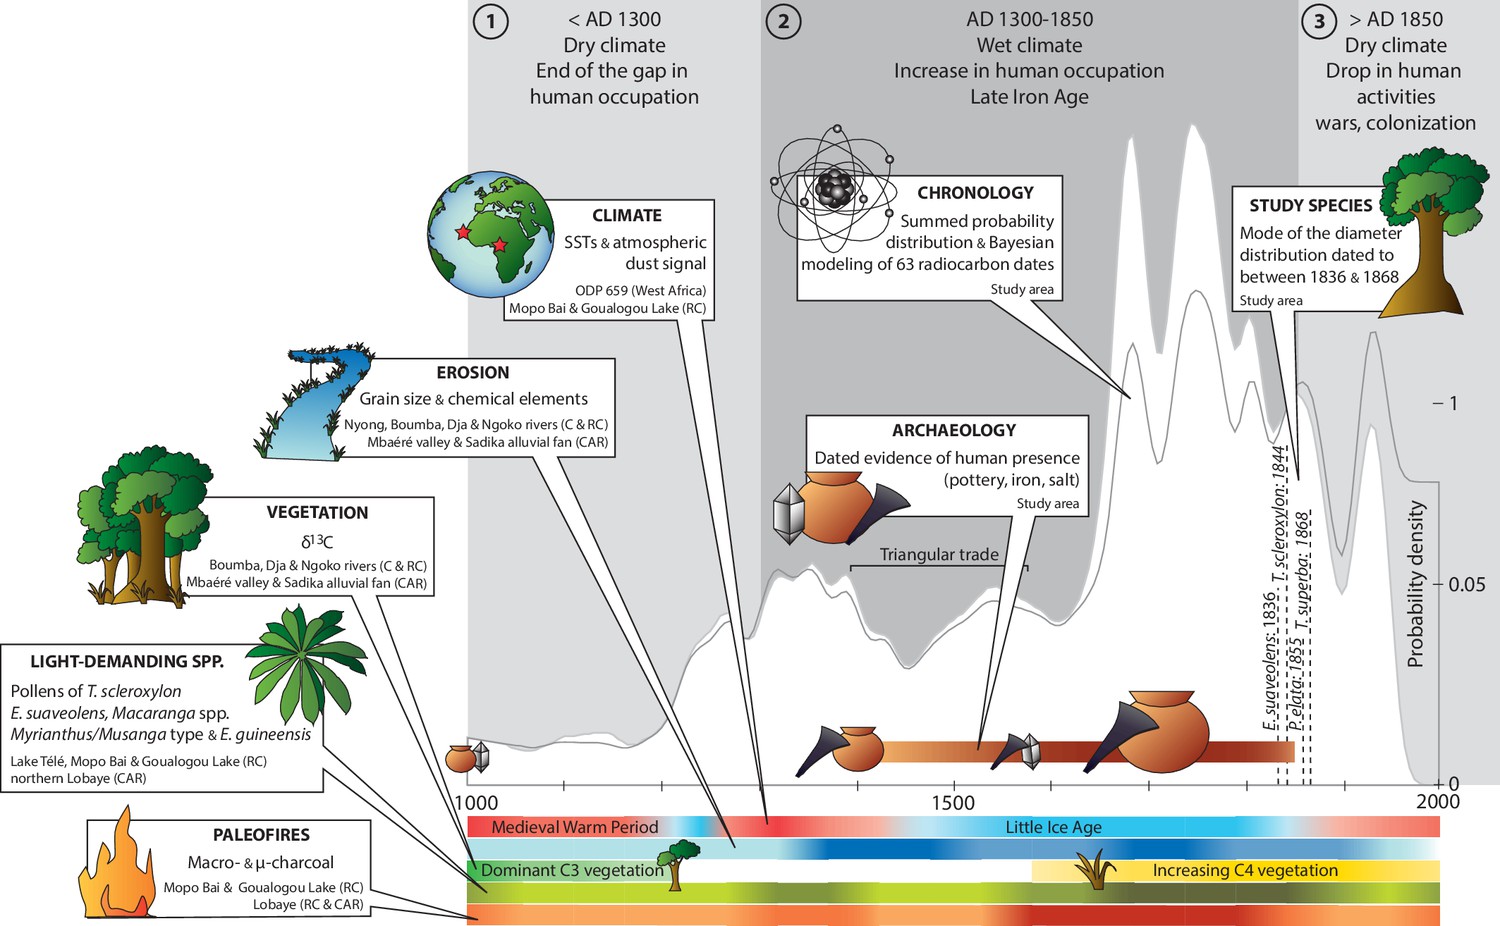
Chronology of paleoenvironmental changes and human activities in the Sangha River Interval.
We compiled data on climate, erosion, vegetation types, light-demanding species and paleofires for the last 1000 years from 34 paleoenvironmental sites and data from 38 dated archaeological sites and discoveries with 63 related radiocarbon dates. The summed probability distribution of the radiocarbon ages showed fluctuations in the signal of human activities through time. Three primary time periods were identified: (a) before AD 1300; (b) from AD 1300 to 1850; and (c) after AD 1850. Color scales (four levels) were assigned depending on the proxy influx on the curve: light = present but rare; light-medium = present; medium = frequent; and dark = very frequent. Abbreviations: AD = Anno Domini (= calendar dates); C = Cameroon; RC = Republic of the Congo; CAR = Central African Republic; SSTs = Sea Surface Temperatures; C3/C4 plants = woody species (below −20‰)/herbs (above −20‰); E. guineensis = the oil palm Elaeis guineensis (Supplementary files 5 and 6). CAD: Illustrator CS4 (https://www.adobe.com).
Additional files
-
Supplementary file 1
Trait information and characteristics of the diameter distribution for the 176 study genera across the SRI.
Botanical family was extracted from the African Plant Database of the Conservatoire et Jardin botaniques de la Ville de Genève and South African National Biodiversity Institute, Pretoria (http://www.ville-ge.ch/musinfo/bd/cjb/africa/recherche.php). Trait information, including regeneration guild sensu Hawthorne (1995) (P = pioneers; NPLD = non-pioneer light-demanders; SB = shade-bearers), leaf phenology (deci = deciduous; ever = evergreen) and wood basic density, was extracted from Fayolle et al. (2014b). Diameter distribution was studied across the SRI using an ordination followed by a clustering (Figure 2). Total number of stems, mean diameter (in cm) and basal area (in m²) are given. The four genera that are monospecific in the SRI and were used for age estimations are highlighted.
- https://doi.org/10.7554/eLife.20343.008
-
Supplementary file 2
Age estimations of the trees at the mode of the diameter distribution for the four genera that are monospecific in the SRI.
The mode of the diameter distribution across the SRI, information on growth data, including number of trees (n), the diameter (dbh) range and the mean and standard error of the annual diameter increment (SE), and age estimations of the mode based on the mean annual diameter increment (MAId) calculated for 982 monitored trees in the SRI are provided for the four study species (see Figure 2—figure supplement 2). For all study species, eight growth models (i.e., Canham, Gompertz, Verhulst, Power, Power mult, Lognormal, Linear and Mean) were fitted to the data, and age estimations were obtained with numerical solutions to ordinary differential equations (ODE) (see Figure 2—figure supplement 2). The most reliable age estimations according to age data from published tree-ring studies are highlighted.
- https://doi.org/10.7554/eLife.20343.009
-
Supplementary file 3
Age data for the four study species based on published tree-ring data.
Mean ages and corresponding estimated dates are shown in Figure 2 (Main Text). C = Cameroon; RC = Republic of the Congo; CAR = Central African Republic; n = number of stem discs.
- https://doi.org/10.7554/eLife.20343.010
-
Supplementary file 4
Relative performance of commonly used growth models for the four genera that are monospecific in the SRI.
Growth model functions used to analyze the variation in tree growth (MAId, in cm.yr−1) with tree size (DBH, in cm) are detailed below. For the biological interpretation of parameters, Max is the maximum growth or growth optimum (in cm.yr−1), Dopt is the diameter at growth optimum (in cm), and Dmax is the maximum diameter (in cm). Linear and mean models were additionally fitted to the data. For each model fitted to the growth and diameter data of each species, the Bayesian Information Criterion (BIC) is provided. The models with the best performance for each species are highlighted.
- https://doi.org/10.7554/eLife.20343.011
-
Supplementary file 5
Data documenting paleoenvironmental changes (Figures 1 and 3, Main Text) during the last 1000 years in the SRI.
C = Cameroon; RC = Republic of the Congo; CAR = Central African Republic; W Africa = West Africa. Numbers refer to the map (Figure 1 Main Text). References are indicated.
- https://doi.org/10.7554/eLife.20343.012
-
Supplementary file 6
Synthesis of the 63 AMS radiocarbon and the two OSL dates documenting human activities (Figure 3 Main Text) during the last 1000 years in the SRI.
C = Cameroon; RC = Republic of the Congo; CAR = Central African Republic; AA = AMS Laboratory, University of Arizona (USA); Beta = Beta Analytic (USA); Erl = Erlangen AMS Facility (Germany); Gif = Gif-sur-Yvette (France); KI = Kiel (Germany); KIA = Kiel AMS (Germany); Ly = University of Lyon (France); OBDY = ORSTOM Bondy (France); Poz = Poznań Radiocarbon Laboratory (Poland). Numbers refer to the map (Figure 1 Main Text). Dated material, identified species, lab codes, raw and calibrated dates Before Present (BP) and Anno Domini (AD), source references, and pottery (i.e. potsherds), smelting (i.e. iron slags and identified tuyères), salt (Richard Oslisly pers. obs.) and charred oil palm endocarps evidence are indicated. We assumed that charred oil palm endocarps found in combination with potsherds were consumed during the occupation of the sites (Morin-Rivat et al., 2016).
- https://doi.org/10.7554/eLife.20343.013
-
Supplementary file 7
SQL codes for the Bayesian analysis of the radiocarbon dates.
- https://doi.org/10.7554/eLife.20343.014
-
Supplementary file 8
Chronology of the historical events from the beginning of the 15th century to the present occurring or influencing human populations in the SRI.
Precise dates or time spans are related to local or more general events. References are indicated.
- https://doi.org/10.7554/eLife.20343.015
Download links
A two-part list of links to download the article, or parts of the article, in various formats.
Downloads (link to download the article as PDF)
Open citations (links to open the citations from this article in various online reference manager services)
Cite this article (links to download the citations from this article in formats compatible with various reference manager tools)
Present-day central African forest is a legacy of the 19th century human history
eLife 6:e20343.
https://doi.org/10.7554/eLife.20343


