Centriolar SAS-7 acts upstream of SPD-2 to regulate centriole assembly and pericentriolar material formation
- University of Oregon, United States
- Ohio Wesleyan University, United States
- Fred Hutchinson Cancer Research Center, United States
- University of Washington, United States
Figures
Figure 1 with 4 supplements
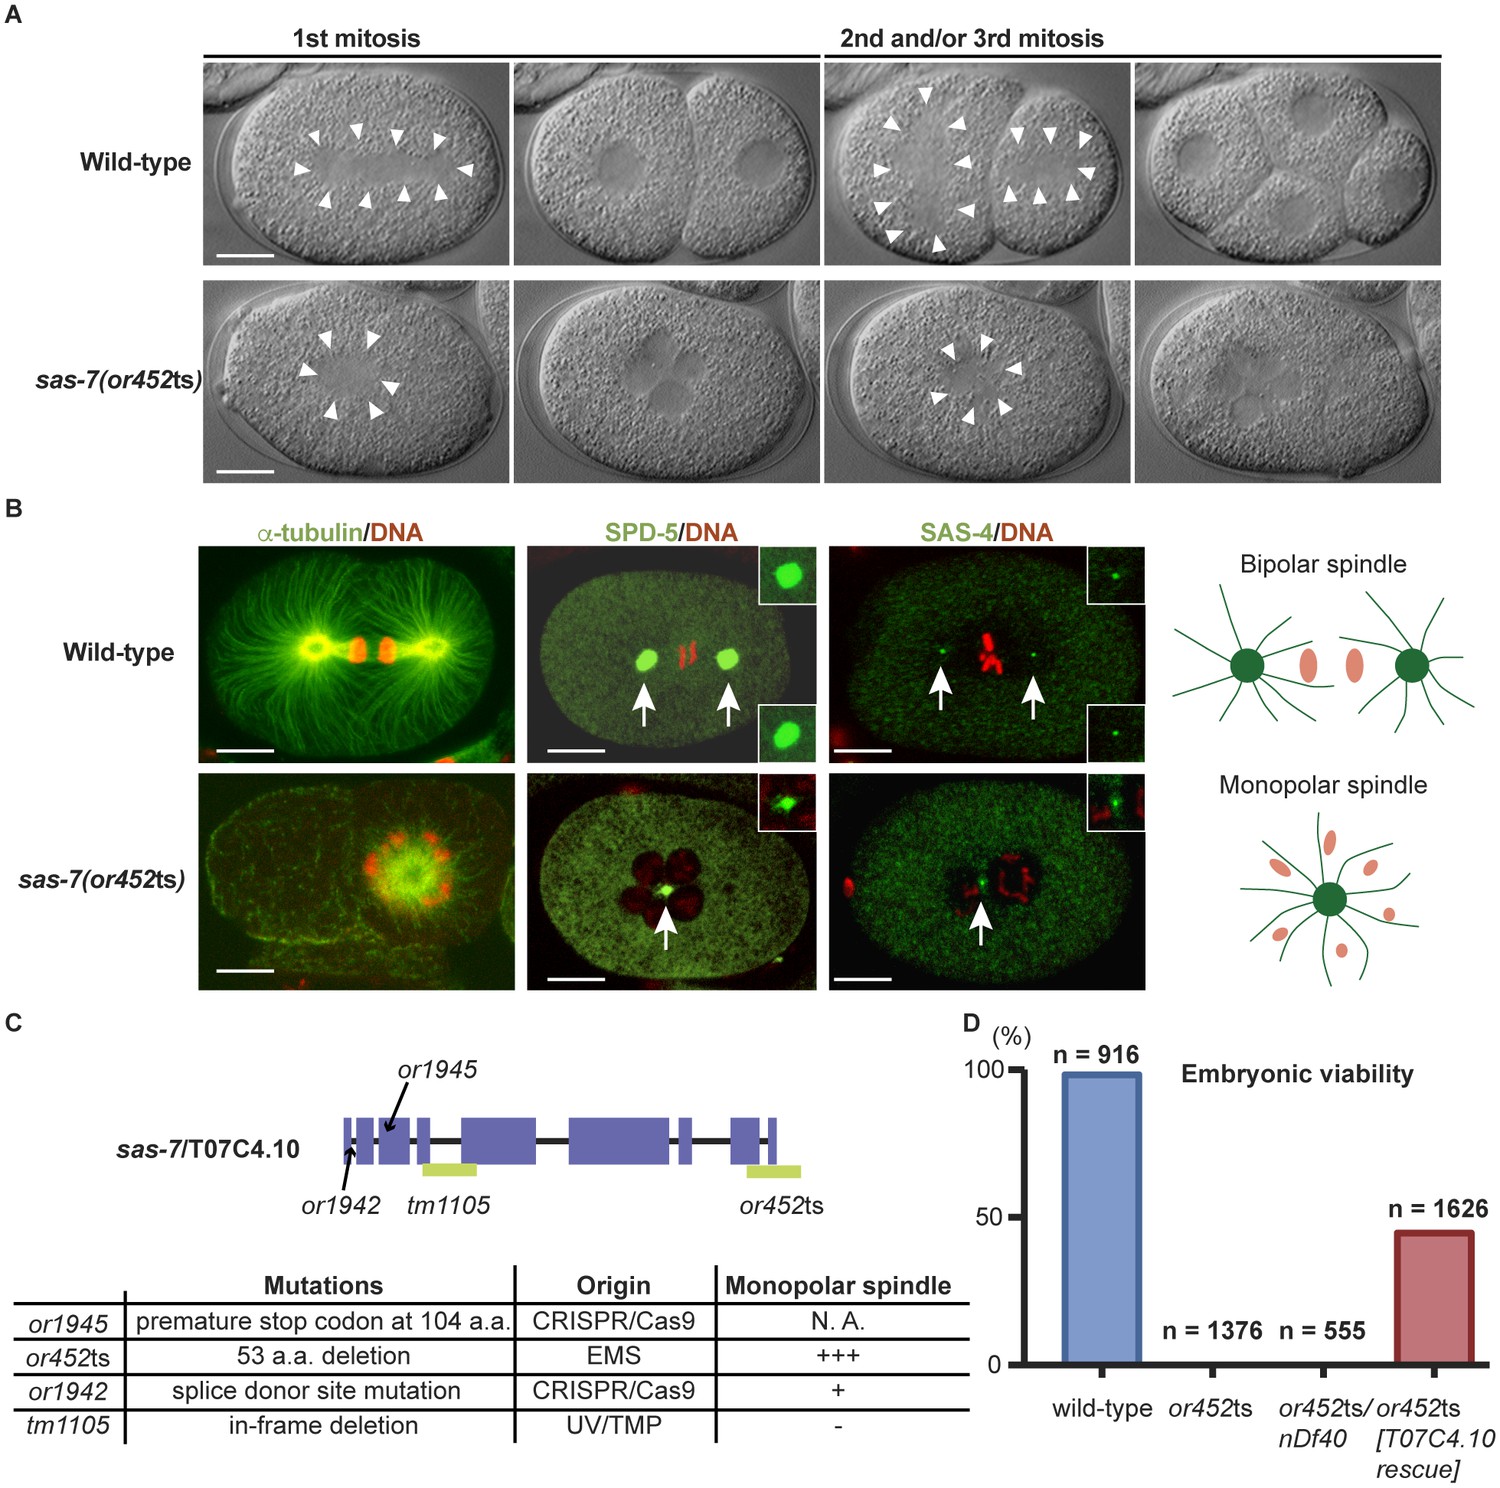
SAS-7 is required for bipolar mitotic spindle assembly.
(A) Time-lapse DIC images of the first, second and third mitotic cell divisions in wild-type and sas-7(or452ts) mutants. Arrowheads indicate the shape of the mitotic spindle. (B) Immunofluorescence of mitotic spindle components. α-tubulin, SPD-5 and SAS-4 were stained by antibodies, shown in green and indicated by arrows. Insets are magnified views. DNA staining is red. (C) sas-7 gene model and mutant alleles. See Materials and Methods for details. (D) Embryonic viability for indicated genotypes. Scale bars indicate 10 µm.
Figure 1—figure supplement 1
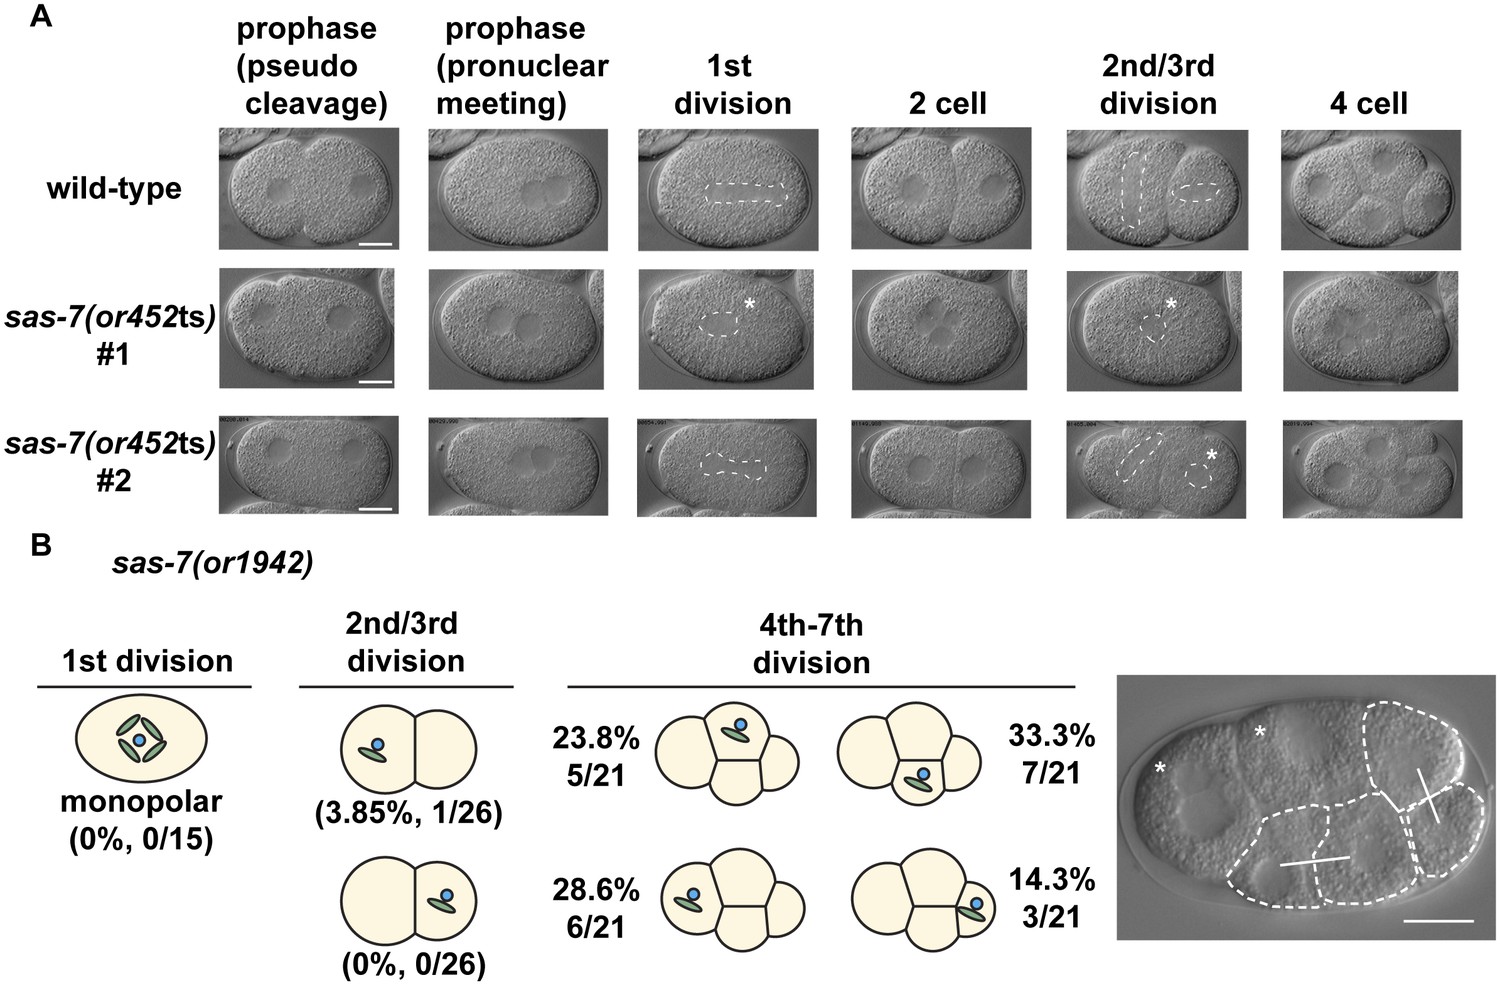
SAS-7 is required for bipolar spindle formation.
(A) DIC time-lapse images of wild-type and sas-7(or452ts) mutants. White dotted lines indicate the mitotic spindle, which are often monopolar in the mutants. (B) Bipolar spindle formation defects in sas-7(or1942). Asterisks indicate cells with bipolar spindle assembly defects. Scale bars indicate 10 µm.
Figure 1—figure supplement 2
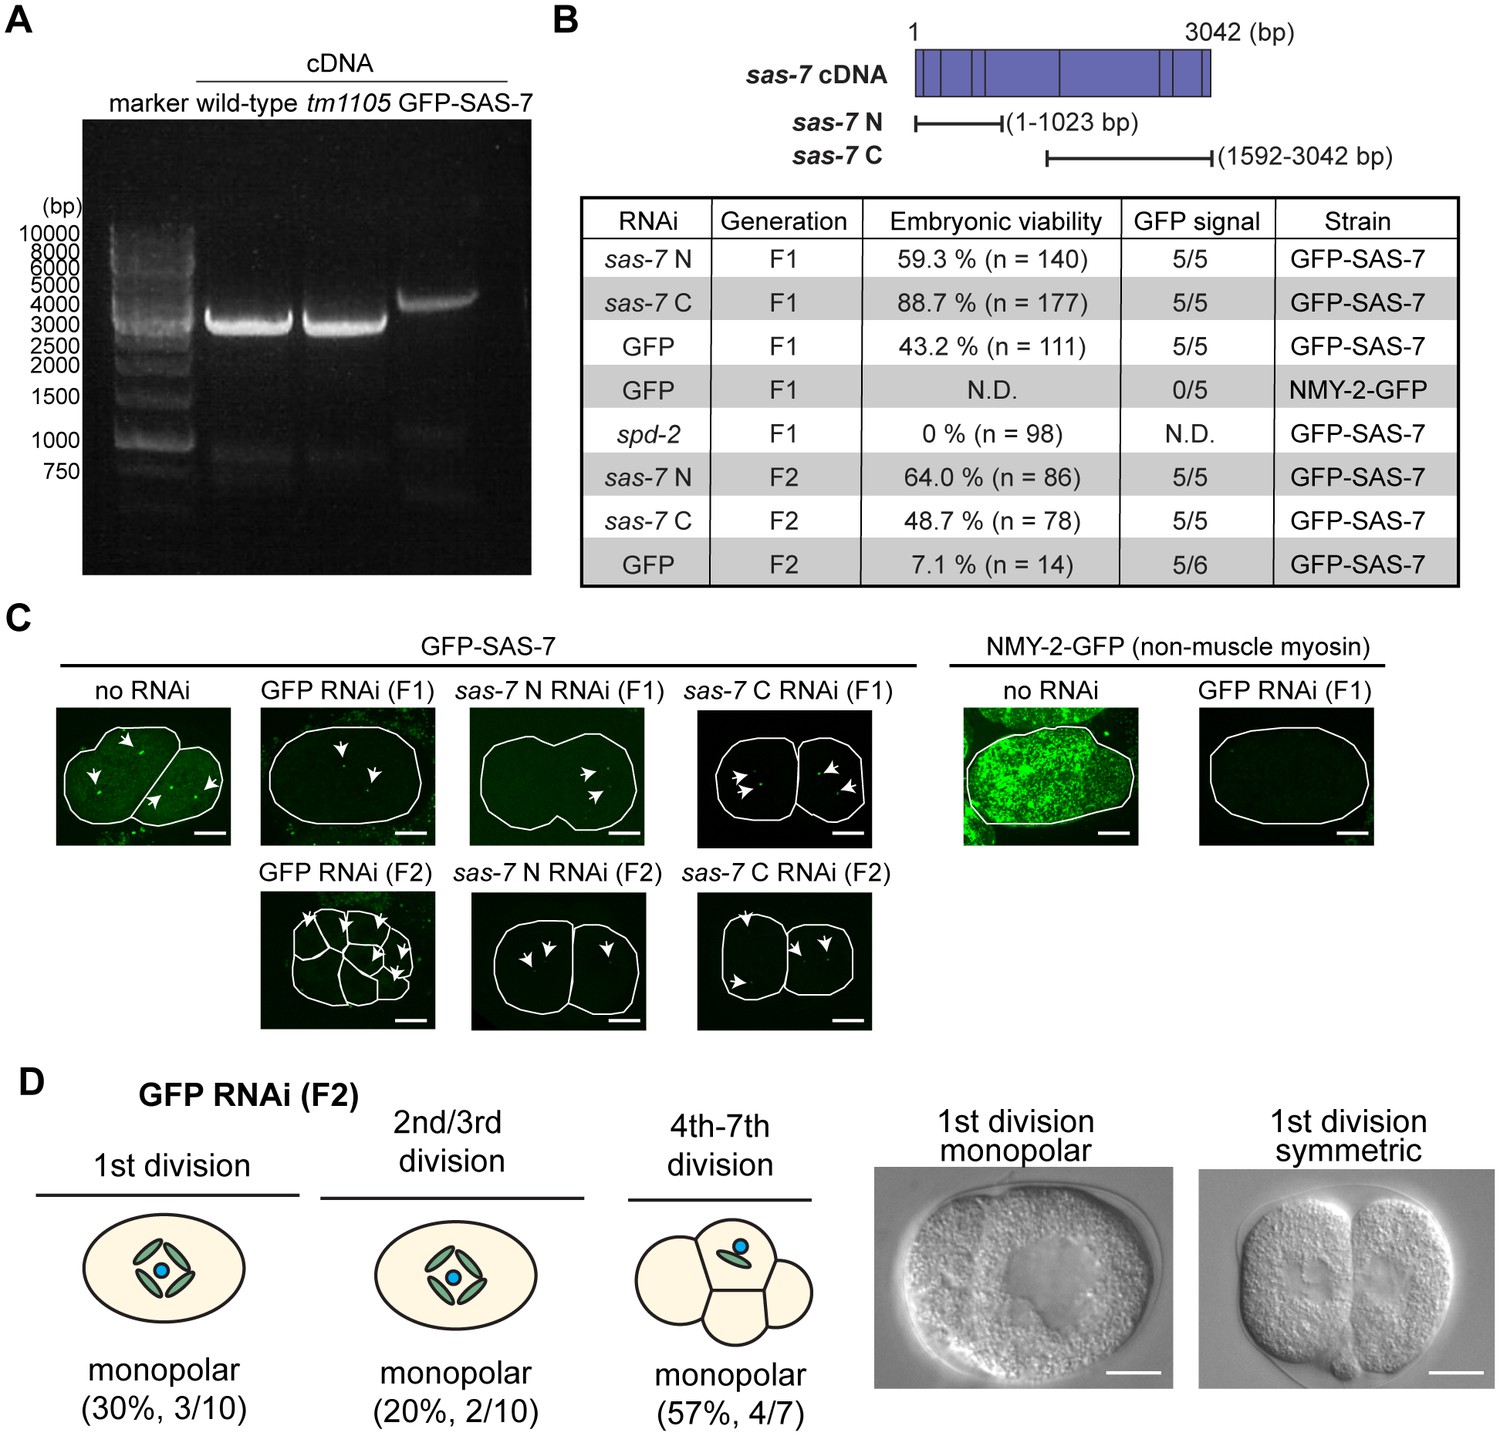
RNAi knock-down against SAS-7 is not effective.
(A) SAS-7 cDNAs obtained from wild-type, sas-7(tm1105) and GFP::SAS-7 strains. As cDNAs were amplified with 5’ primer targeting sas-7 N-terminal end and poly-dT, sas-7 is transcribed as mRNA. (B) RNAi phenotypes of sas-7. Two different cDNAs sas-7 N and sas-7 C were used for RNAi. Embryonic viability and GFP signal were used to assess RNAi effects. (C) GFP::SAS-7 signal remains after sas-7(RNAi). NMY-2::GFP signal was undetectable using same GFP(RNAi) construct, suggesting that RNAi constructs are functional. Thus the sas-7 locus may be relatively insensitive to RNAi. (D) GFP RNAi against GFP::SAS-7 strain showed monopolar spindle phenotypes. Most of the F1 adults were sterile but fertile F1s produced some F2 embryos with monopolar spindles as depicted. Scale bars indicate 10 µm.
Figure 1—figure supplement 3
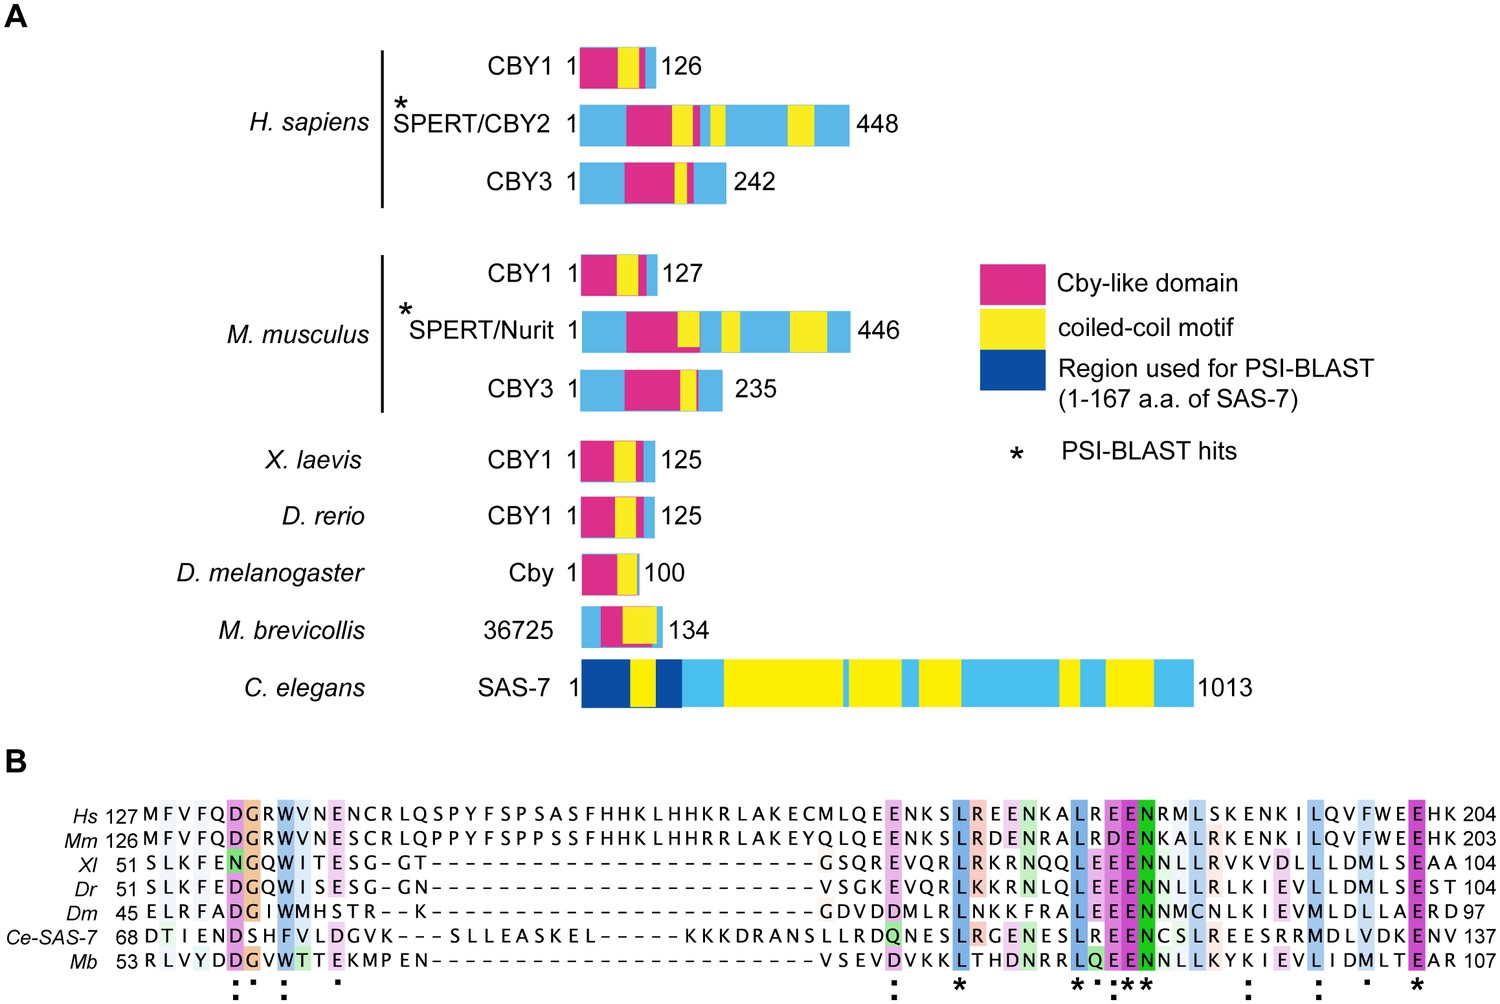
SAS-7 N-terminus has weak homology to human SPERT protein.
(A) SAS-7 and Chibby family proteins in animals and the Choanoflagellate Monosiga brevicollis. Regions in magenta and yellow are conserved Cby-like domain and coiled-coil motifs, respectively. In SAS-7, the N-terminal 1–167 a.a. were used for PSI-BLAST analysis (iteration 3) and detected human (E value: 4e-27) and mouse SPERT (5e-22), respectively. (B) Multiple alignment of human SPERT (Hs), mouse SPERT (Mm), frog CBY1 (Xl), zebrafish CBY1 (Dr), fly Cby (Dm), C. elegans SAS-7 and monosiga 36725 (Mb). Note that the SAS-7 N-terminal region has weak similarity to Chibby-like domain. Asterisk, colon, and period indicate the fully conserved, strongly similar and weakly similar residues annotated by the Clustal Omega.
Figure 1—figure supplement 4
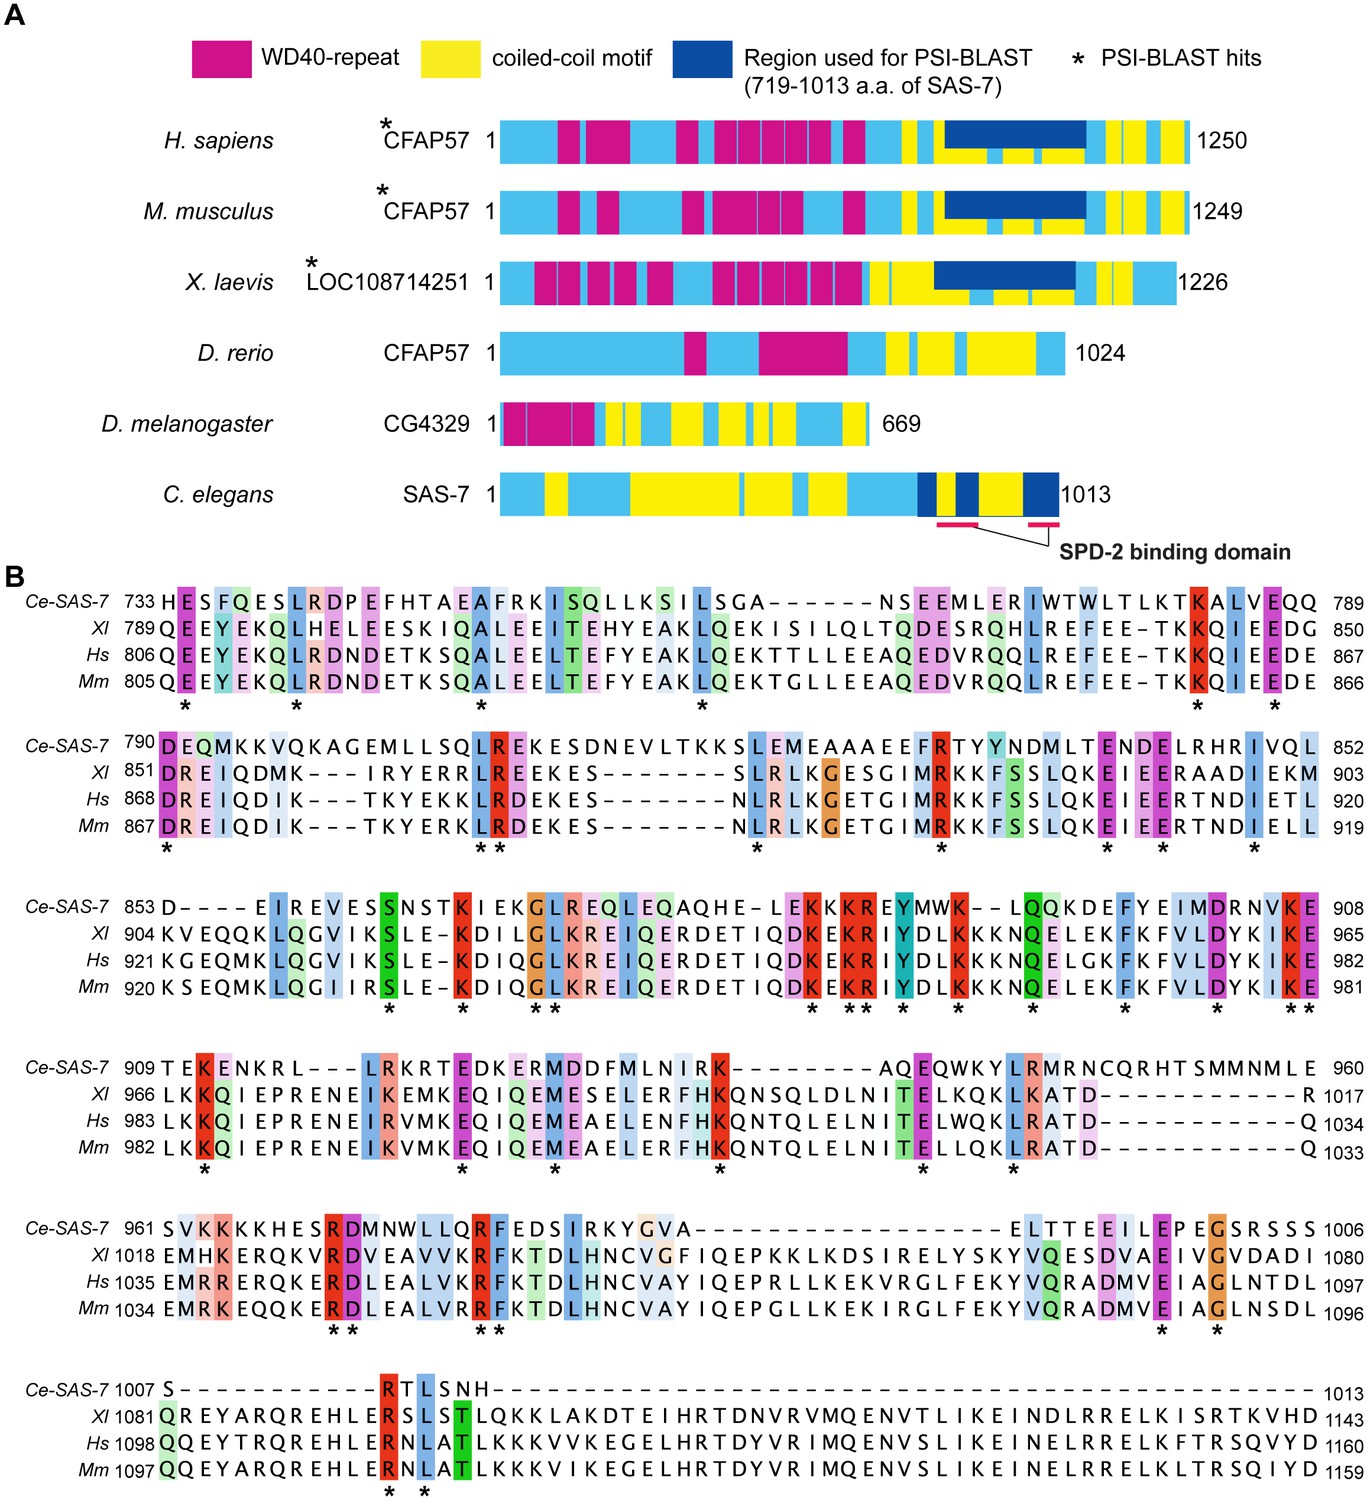
SAS-7 C-terminus has weak homology to human CFAP57/WDR65 protein.
(A) SAS-7 and CFAP57 family proteins in animals. Regions in magenta and yellow are predicted WD40 repeat and coiled-coil motif, respectively. In SAS-7, the C-terminal 719–1013 a.a. were used for PSI-BLAST analysis (iteration 3) and detected human (E value: 1e-57) and mouse CFAP57 (6e-54), and frog CFAP57 homolog (7e-46), respectively. (B) Multiple alignment of human CFAP57 (Hs), mouse CFAP57 (Mm), frog CFAP57 homolog (Xl) and C. elegans SAS-7. Asterisks indicate the identical residues.
Figure 2 with 1 supplement
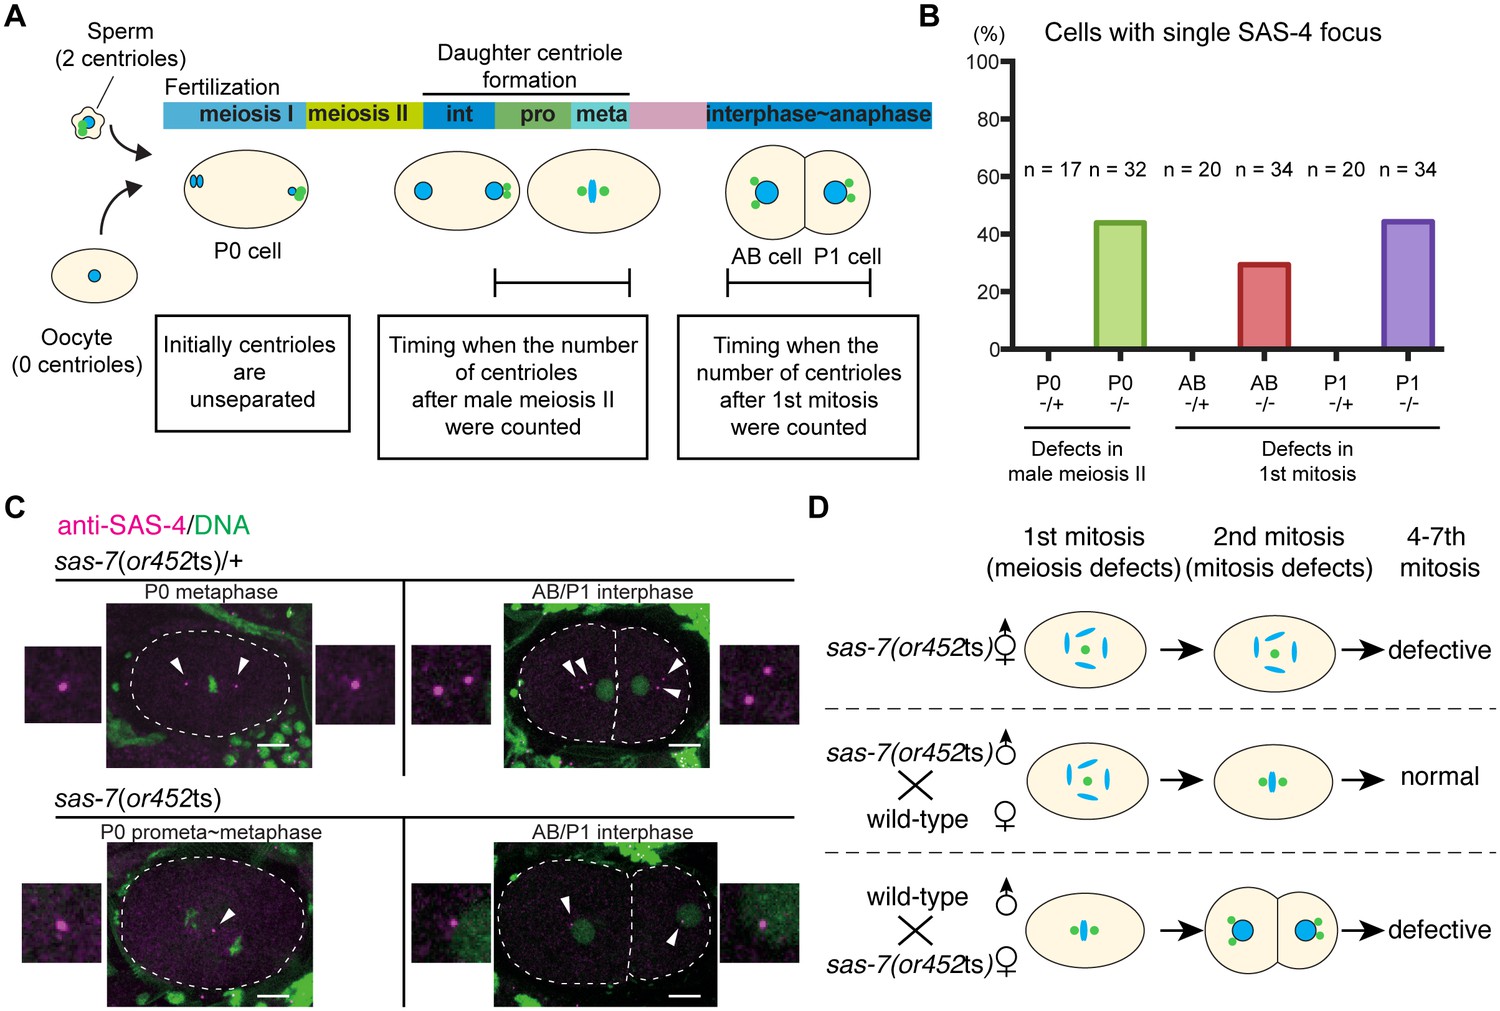
SAS-7 regulates centriole duplication during both sperm meiosis and embryonic mitosis.
(A) Schematic illustration of the timing of centriole duplication and times at which centriole numbers were counted. As duplicated centrioles are initially unseparated, the number of centrioles after male meiosis II and the first mitosis were monitored after centriole separation at the time intervals indicated in the text boxes. (B) Percentages of cells with single SAS-4 foci; embryos were self-progeny either from control heterozygous (-/+) hermaphrodites, or from homozygous (-/-) mutant hermaphrodites, as indicated below cell names on x-axis. Prophase to metaphase P0, and interphase to anaphase AB and P1 cells, were scored for SAS-4 foci numbers. (C) SAS-4 foci number after male meiosis II and the first embryonic mitosis. SAS-4 and DNA are magenta and green, respectively. Arrowheads and dotted lines indicate centrioles and cell outlines, respectively. Scale bars indicate 10 µm. (D) Paternal and maternal contributions of sas-7 gene activities to centriole duplication. Paternal and maternal SAS-7contribute to centriole duplication in male meiosis II and mitosis, respectively. See also Table 1.
Figure 2—figure supplement 1
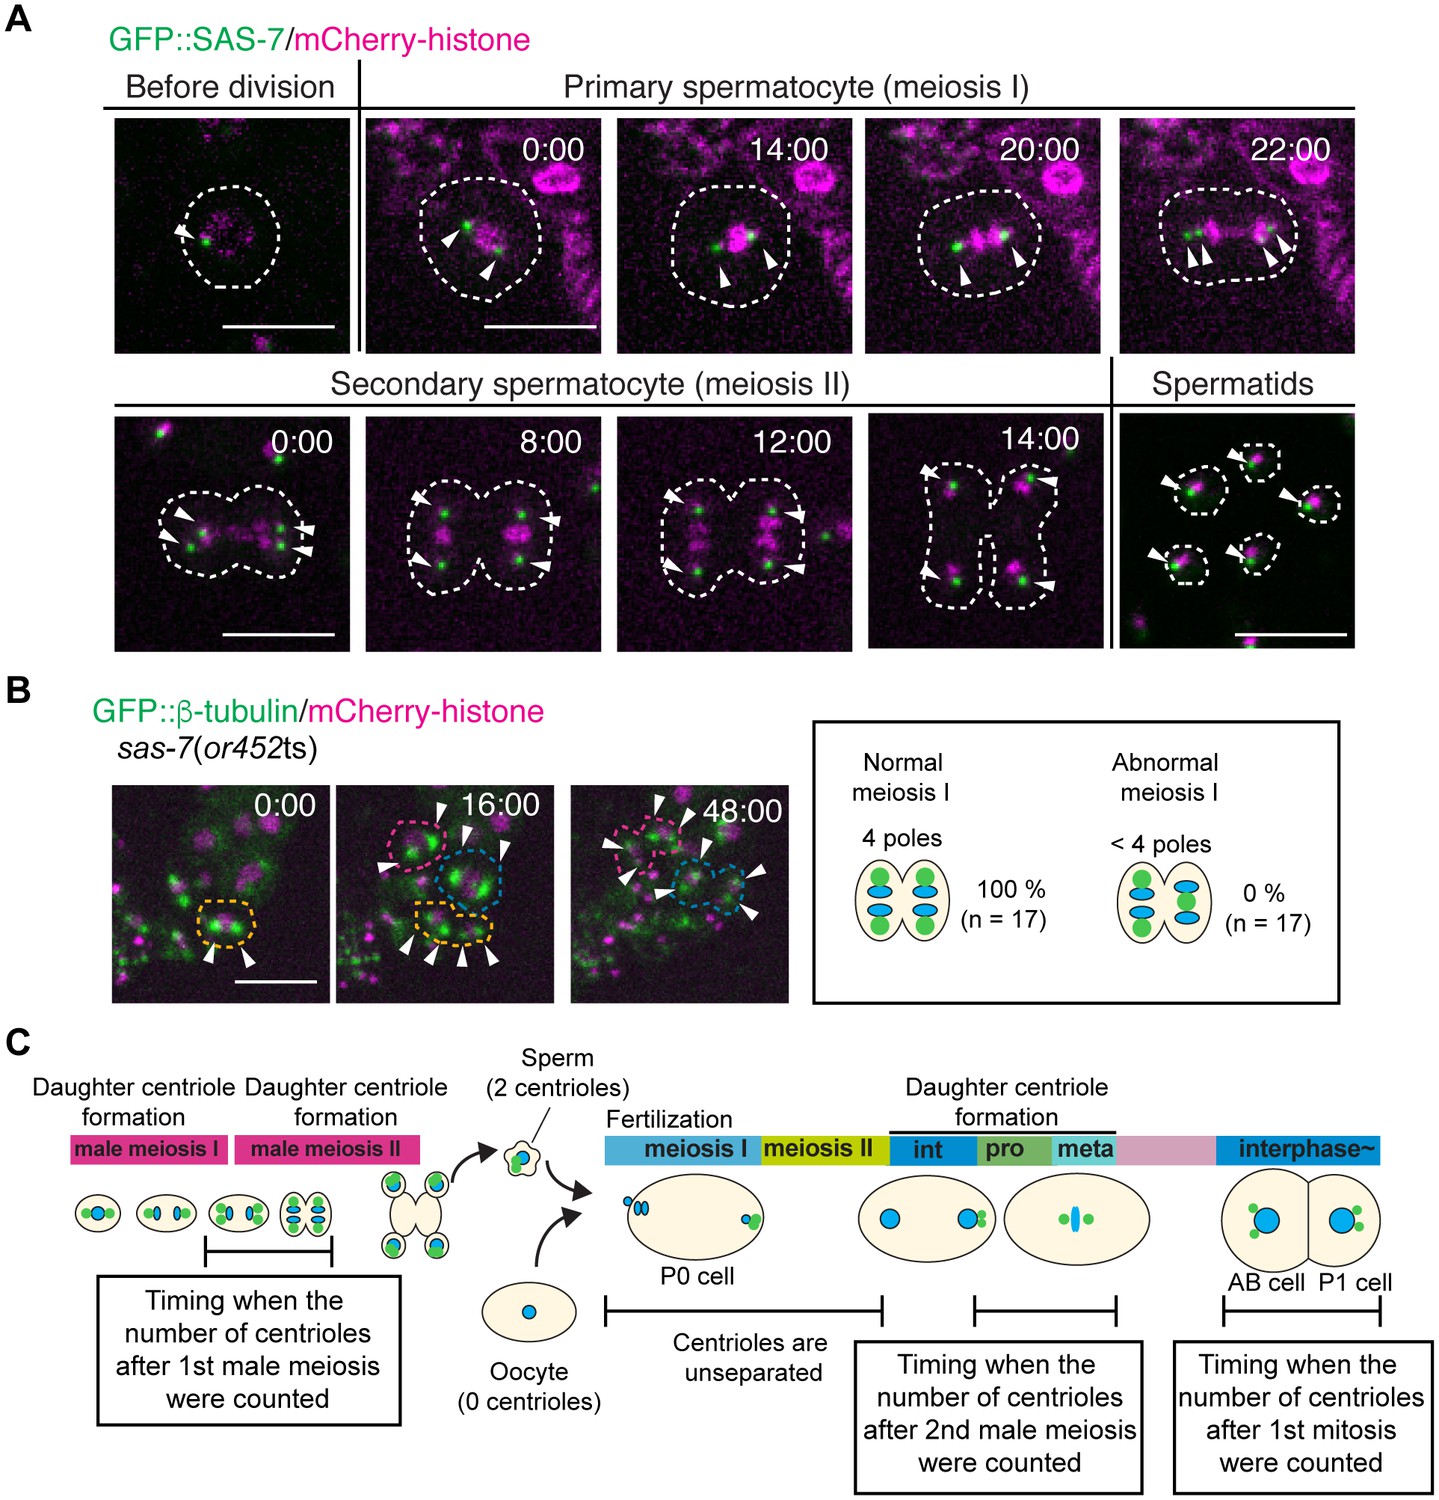
SAS-7 localizes to sperm throughout spermatogenesis but sas-7(or452ts) mutants did not show meiosis I defects.
(A) GFP::SAS-7 localization during male meiosis. GFP::SAS-7 and mCherry::histone H2B are green and magenta, respectively. (B) Normal centrosome duplication of sas-7(or452ts) mutants after male meiosis I. (C) Schematic illustration of the timing of centriole duplication and timing measured for centriole numbers. As duplicated centrioles are initially unseparated, the number of centrioles after male meiosis I, male meiosis II and the first mitosis were monitored after centriole separation, as shown by the text boxes. Times are minutes and seconds. Arrowheads and dotted lines indicate centriole/centrosome and cell outlines. Scale bars indicate 10 µm.
Figure 3 with 1 supplement
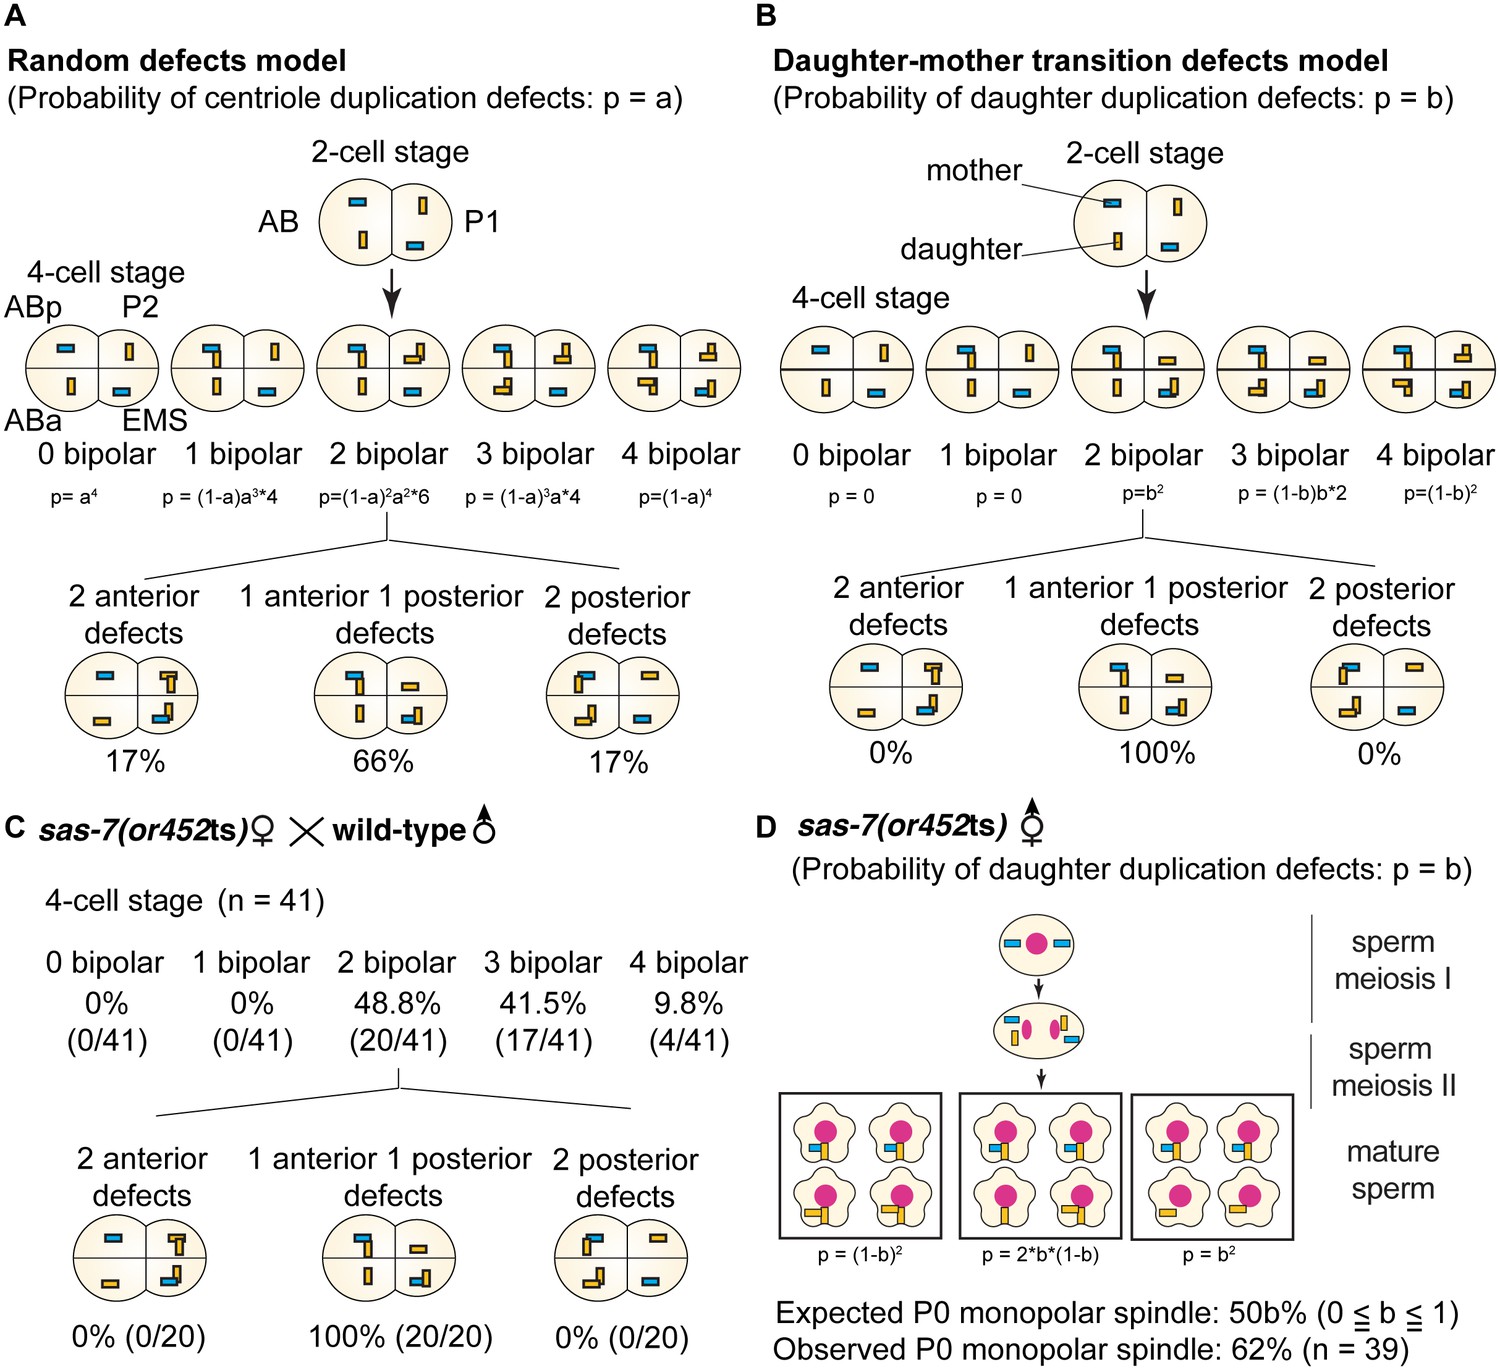
SAS-7 is required for newly formed daughter centrioles to become mother centrioles.
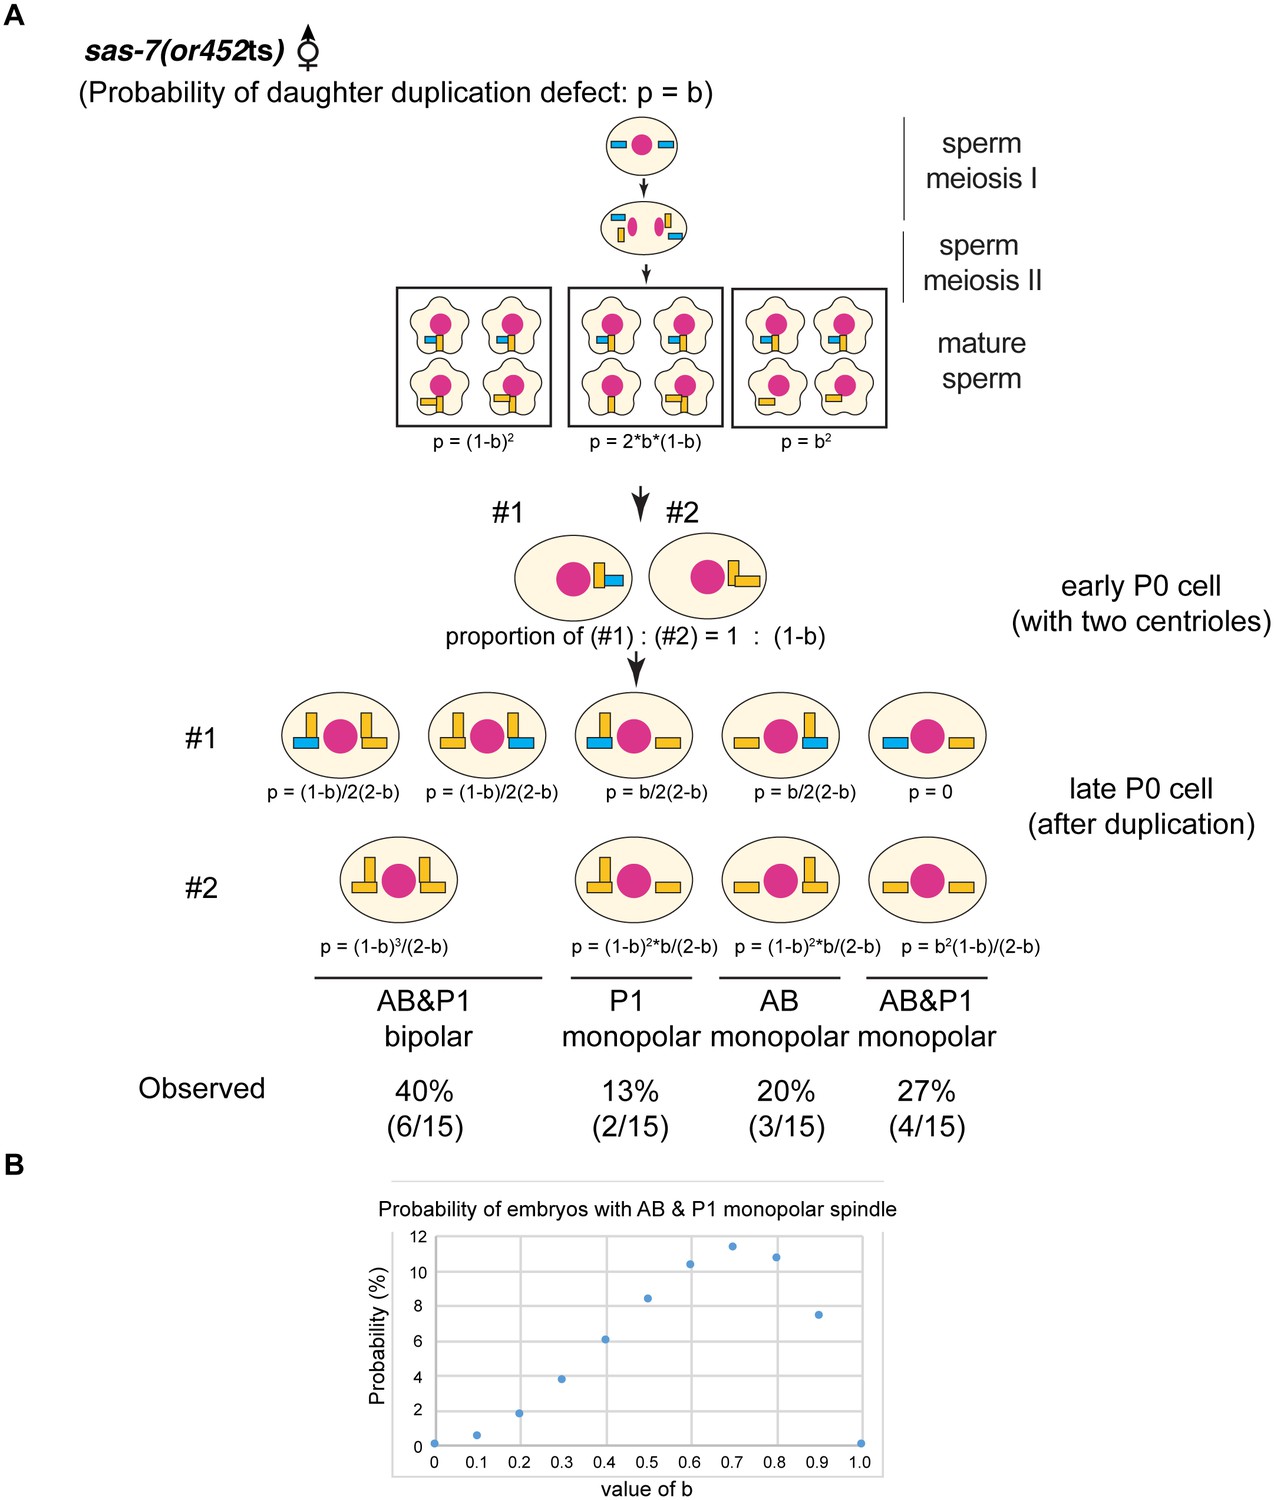
(A) Random defects model for centriole duplication in sas-7 mutants. If both mother and daughter centrioles fail to duplicate with a probability of a (p=a), the distribution of 4 cell stage monopolar spindles will be as shown. (B) Daughter-mother transition defects model for sas-7 mutants. If mother centrioles are never defective for centriole duplication while daughter centrioles fail to duplicate with a probability of b (p=b), the distribution of 4 cell stage monopolar spindles will be as shown. (C) Distribution of 4 cell stage monopolar spindles in sperm(+), oocyte(-) embryos from sas-7(or452ts) mutant females crossed with wild-type males. (D) SAS-7 may also be required for mother centrioles to maintain duplication competence. In sas-7(or452ts) mutants, centriole duplication in meiosis I is normal but is sometimes defective in meiosis II resulting in the P0 monopolar spindle phenotype. However, the observed P0 monopolar spindle penetrance (62%; see Table 1) is higher than even the case where all daughter centrioles fail to duplicate (b = 1.0, in which case all sperm would have centrioles depicted in the right-most box, such that 50% of P0 spindles would be monopolar); even fewer would be monopolar at lower values of b. These results suggest that SAS-7 is required for some of the mother centrioles to duplicate in sperm(-), oocyte(-) sas-7(or452ts) embryos. Mother centrioles are blue; daughters are orange.
Figure 3—figure supplement 1
sas-7(or452ts) mother centrioles lose duplication competence.
(A) If the daughter-to-mother transition defects model in Figure 3D is applied, the probability of monopolar spindle formation in sperm(-), oocyte(-) P0 division becomes as shown. (B) If the daughter-to-mother transition defects model in Figure 3D is applied, the probability that monopolar spindles will form in both AB and P1 is at most 11%. However, we observed monopolar spindles in both P1 and AB in 27% of the sperm(-), oocyte(-) embryos examined (A). These results as well as the data in Figure 3D suggest that that some mother centrioles lose duplication competence in the absence of SAS-7. Mother centrioles are blue; daughters are orange. Note that in our calculations, we did not consider the possibility that daughter centrioles become mothers even if they duplicate; if that possibility were included, the probability that monopolar spindles will form in both AB and P1 is even lower.
Figure 4 with 1 supplement
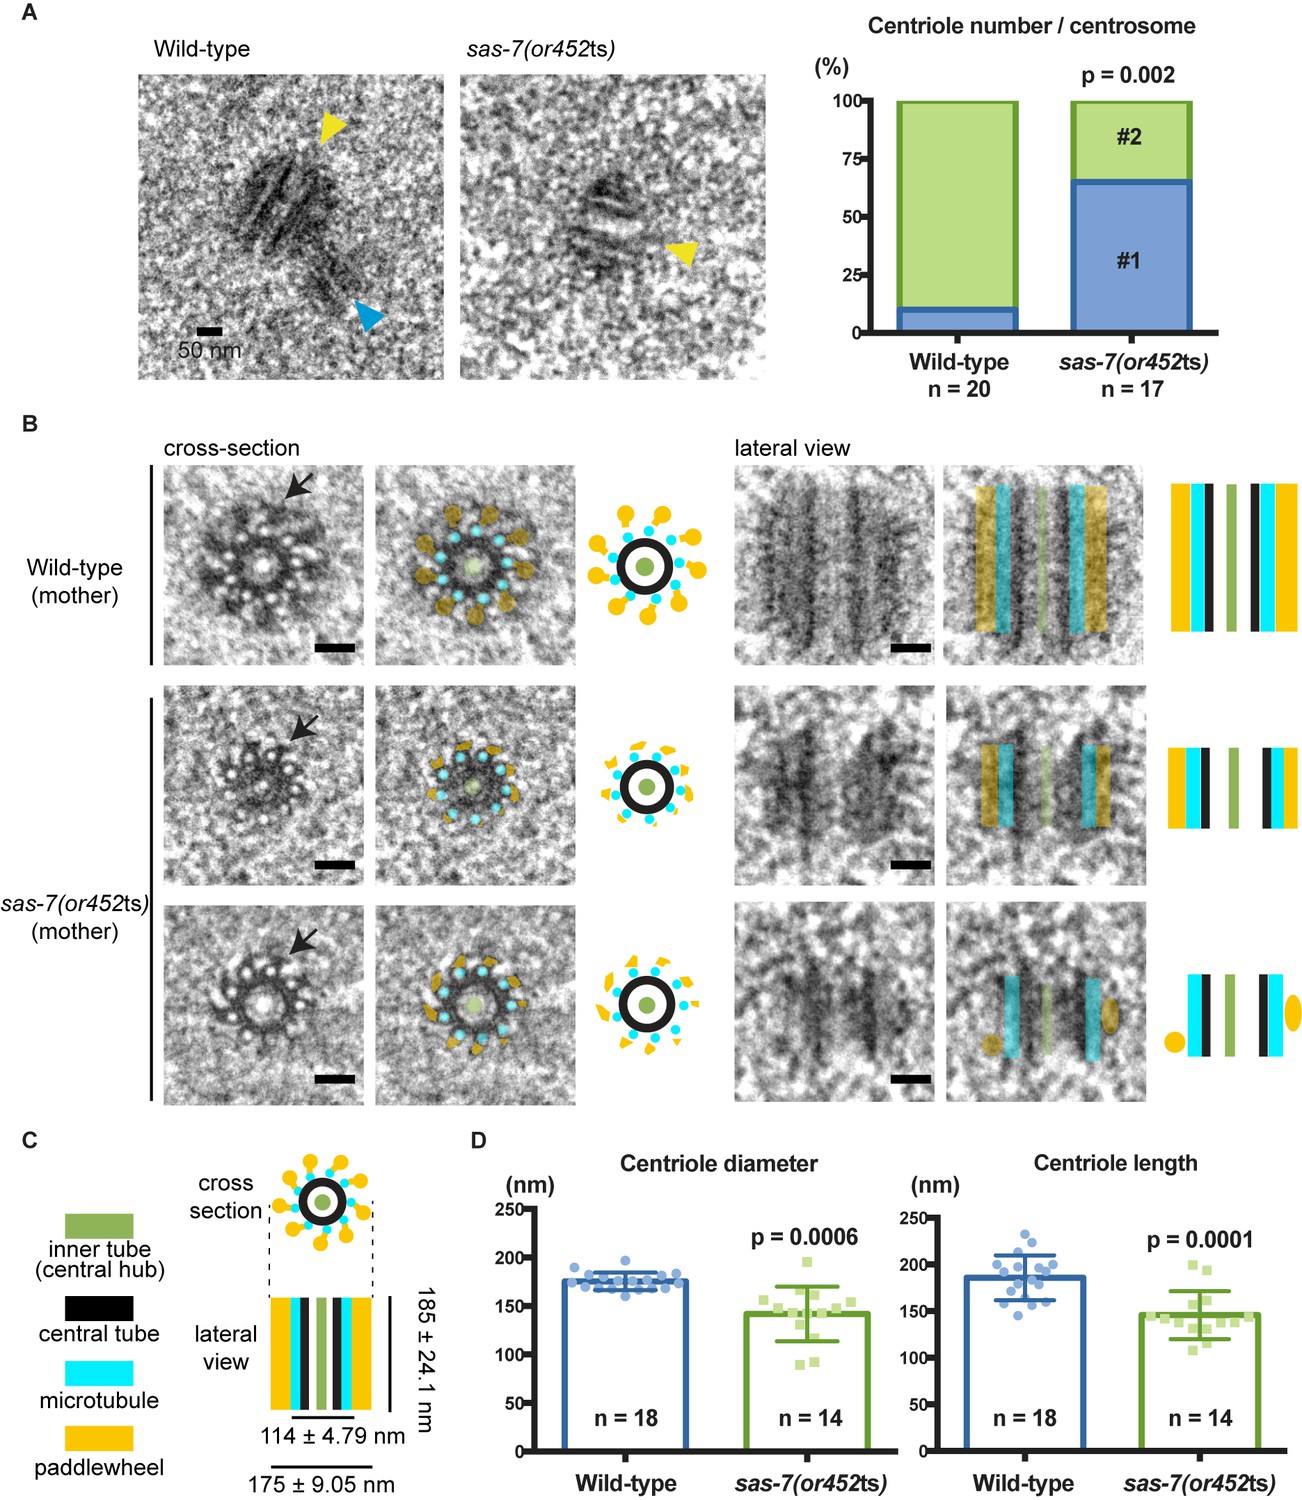
SAS-7 is required for centriole duplication, assembly and elongation.
(A) TEM images of centrioles. Yellow and blue arrowheads indicate the mother and daughter centrioles, respectively. P-value in the graph was calculated by the Fisher's exact test. (B) Cross-section and lateral view TEM images of centrioles. Arrows indicate the paddlewheel structure. Colored overlays indicate the distinct structural units shown in C. (C) Schematic representations of C. elegans centriole structure and chirality when viewed from the distal end. (D) Quantified centriole diameter and length. Mean ± SD shown. P-values calculated by the Welch's t-test. See also Figure 4—figure supplement 1. Scale bars indicate 50 nm.
Figure 4—figure supplement 1
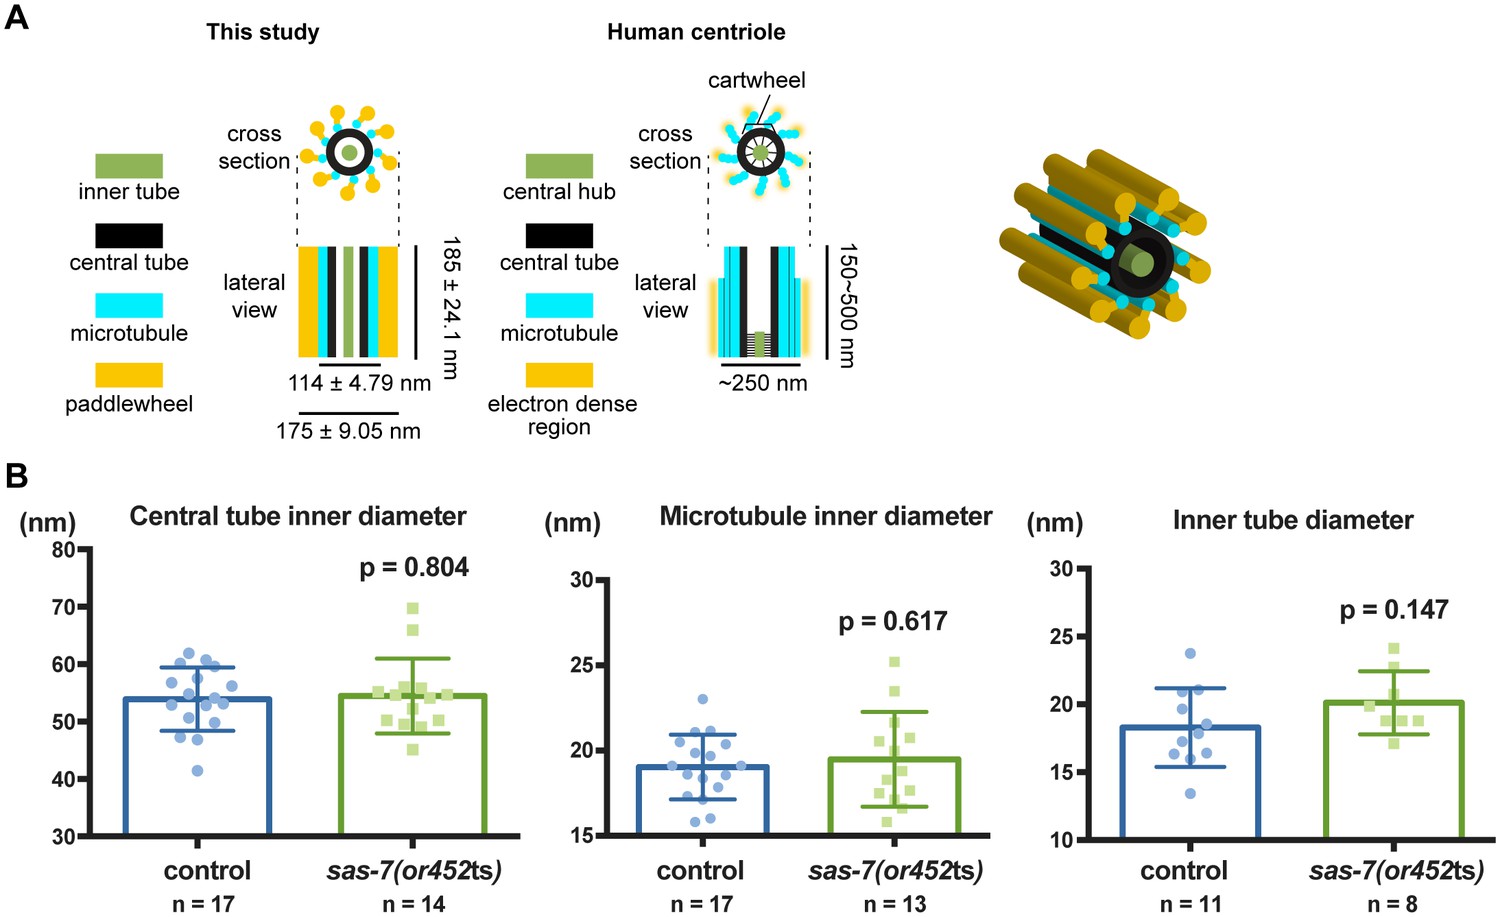
Quantification of centriole structural units.
(A) Schematic representation and 3-dimensional cartoon of C. elegans centriole based on our observations. (B) Quantified diameters of centriole structural units. Mean ± SD are shown. P-values were calculated by Welch's t-test.
Figure 5 with 1 supplement
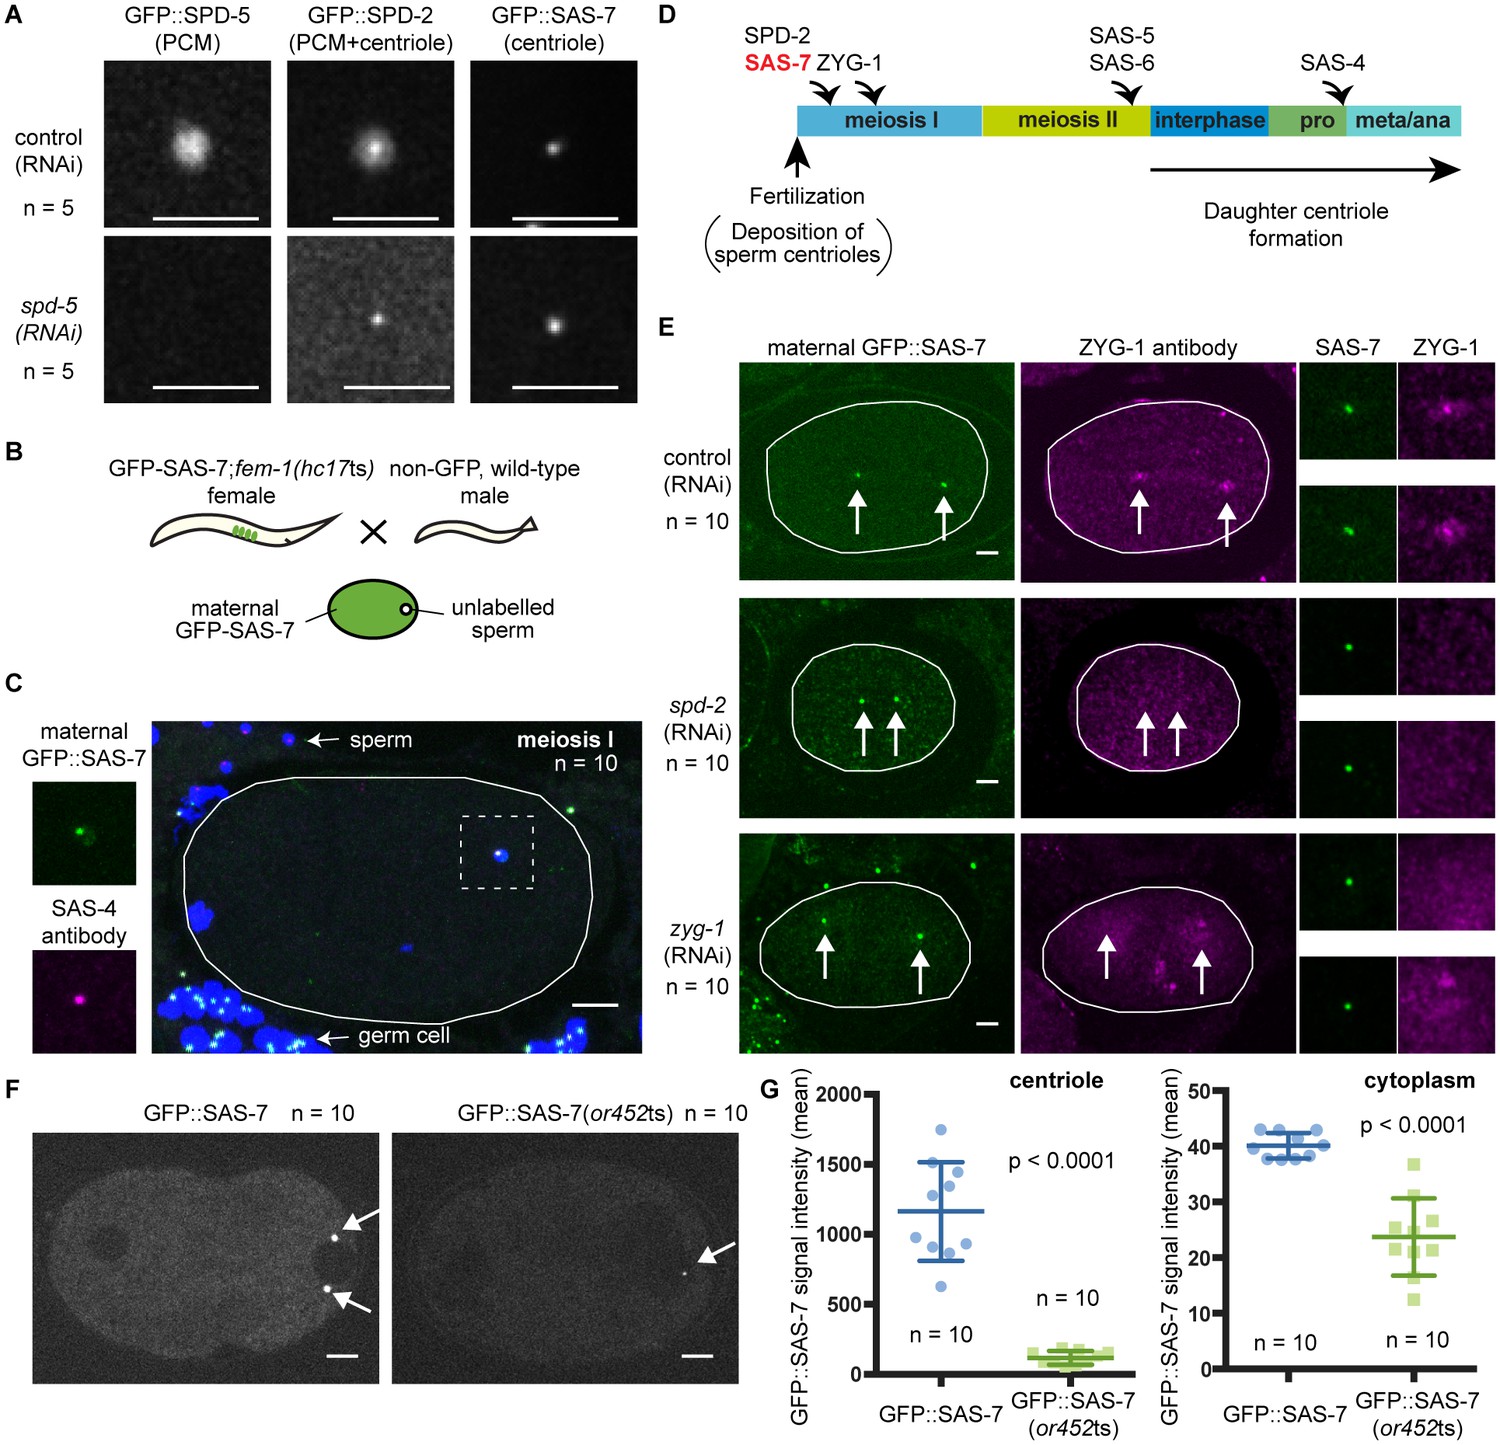
SAS-7 localizes to centrioles independently of SPD-2.
(A) Comparison of GFP::SAS-7, GFP::SPD-5 and GFP::SPD-2 localization. SPD-5 is a PCM component. SPD-2 localizes to both the centriole and the PCM. SAS-7 localized exclusively to the centriole. (B) Schematic illustration of experiments performed in C, E and Figure 5—figure supplement 1C. (C) Localization of maternal SAS-7 protein to the site of daughter centriole formation. GFP::SAS-7 and SAS-4 antibody staining are shown in green and magenta. Note that most of the SAS-4 on centrioles at this stage is paternal protein (Delattre et al., 2006; Pelletier et al., 2006). (D) Schematic illustration of the timing of core protein recruitment to the centriole (Delattre et al., 2006; Pelletier et al., 2006; this study). (E) Maternal SAS-7 localization in spd-2(RNAi) and zyg-1(RNAi) embryos. Maternal SAS-7 and ZYG-1 antibody staining shown in green and magenta, respectively. ZYG-1 centriolar localization was lost in spd-2(RNAi) as reported previously (Delattre et al., 2006; Pelletier et al., 2006). Arrows indicate the position of centrioles. (F) GFP-tagged SAS-7(or452ts) showed reduced expression level compared to wild-type. (G) Quantified GFP::SAS-7 intensity on centriole (left graph) and cytoplasm (right graph). P-values were calculated by Welch’s t-test. Scale bars indicate 5 µm.
Figure 5—figure supplement 1
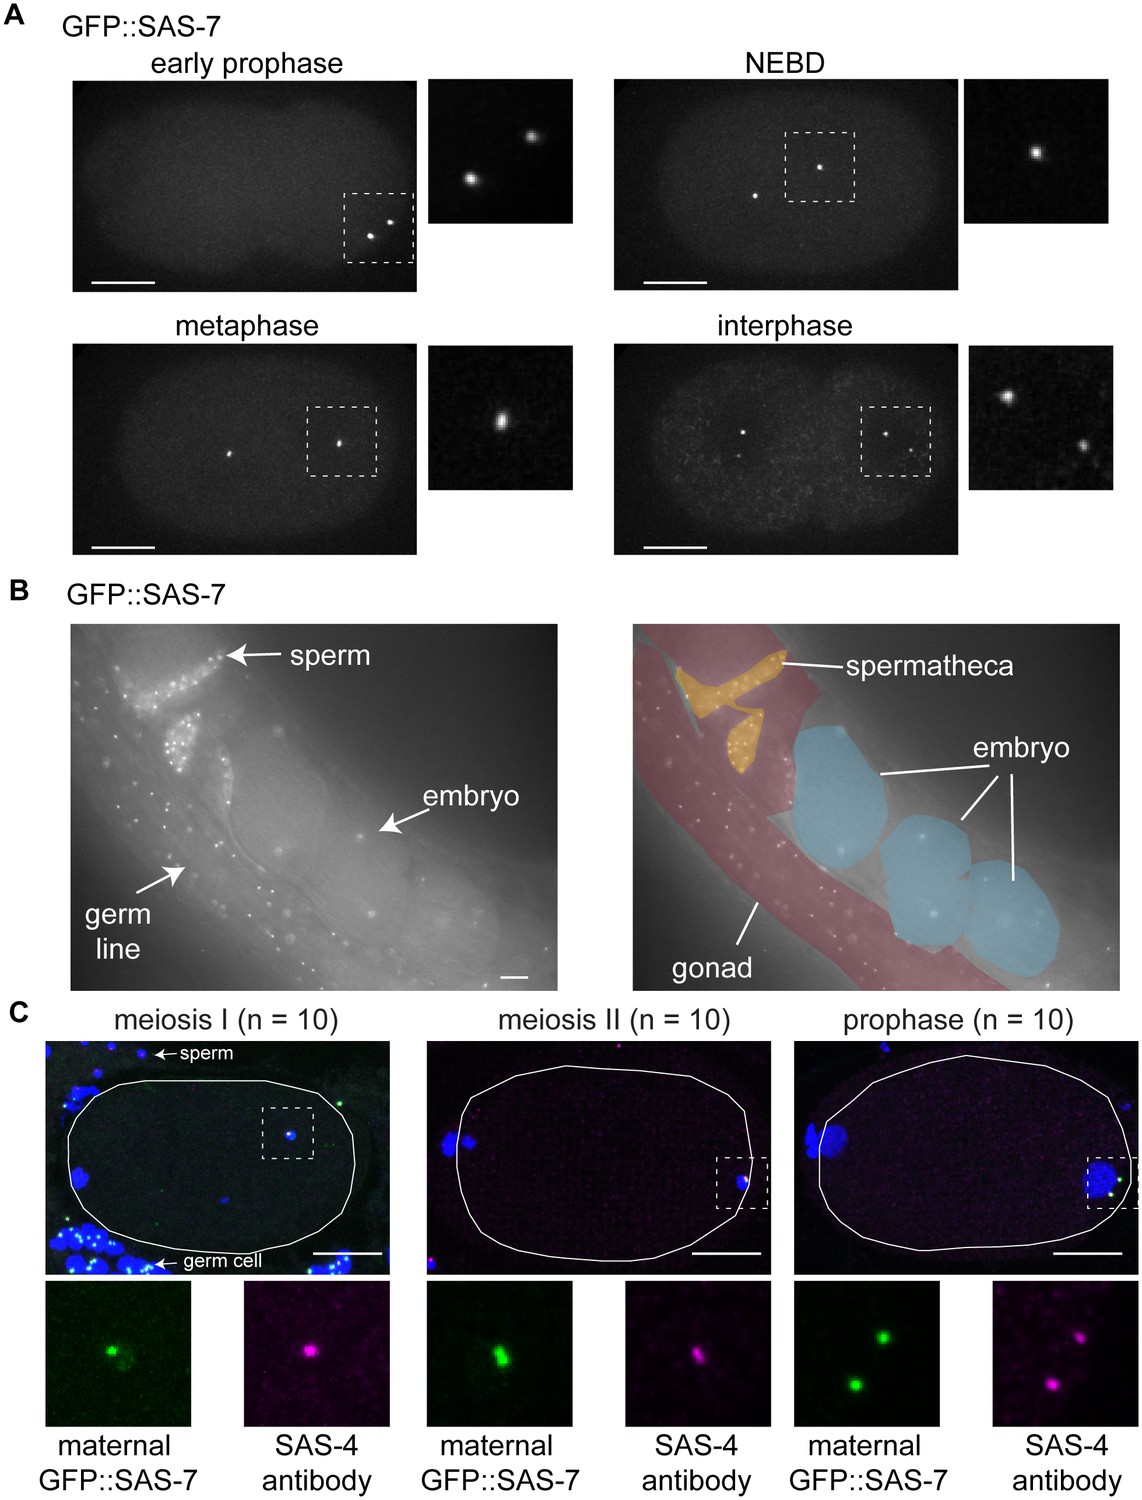
SAS-7 localizes to the centriole throughout cell division.
(A) GFP::SAS-7 localization during the first embryonic mitosis. The regions in white dotted squares are shown magnified, to the right in each panel. (B) GFP::SAS-7 localization in live whole mount worms. SAS-7 localized to form foci (centrioles) in distal gonad germline, sperm and embryos. (C) Maternal GFP::SAS-7 localization in early 1 cell stage embryos. GFP::SAS-7 and SAS-4 staining are shown in green and magenta, respectively. White dotted areas are shown magnified at the bottom. Note that, as illustrated in Figure 5B, GFP::SAS-7 was not present in sperm but only in the female germ cells in the cross used to generate these embryos. Scale bars indicate 10 µm.
Figure 6
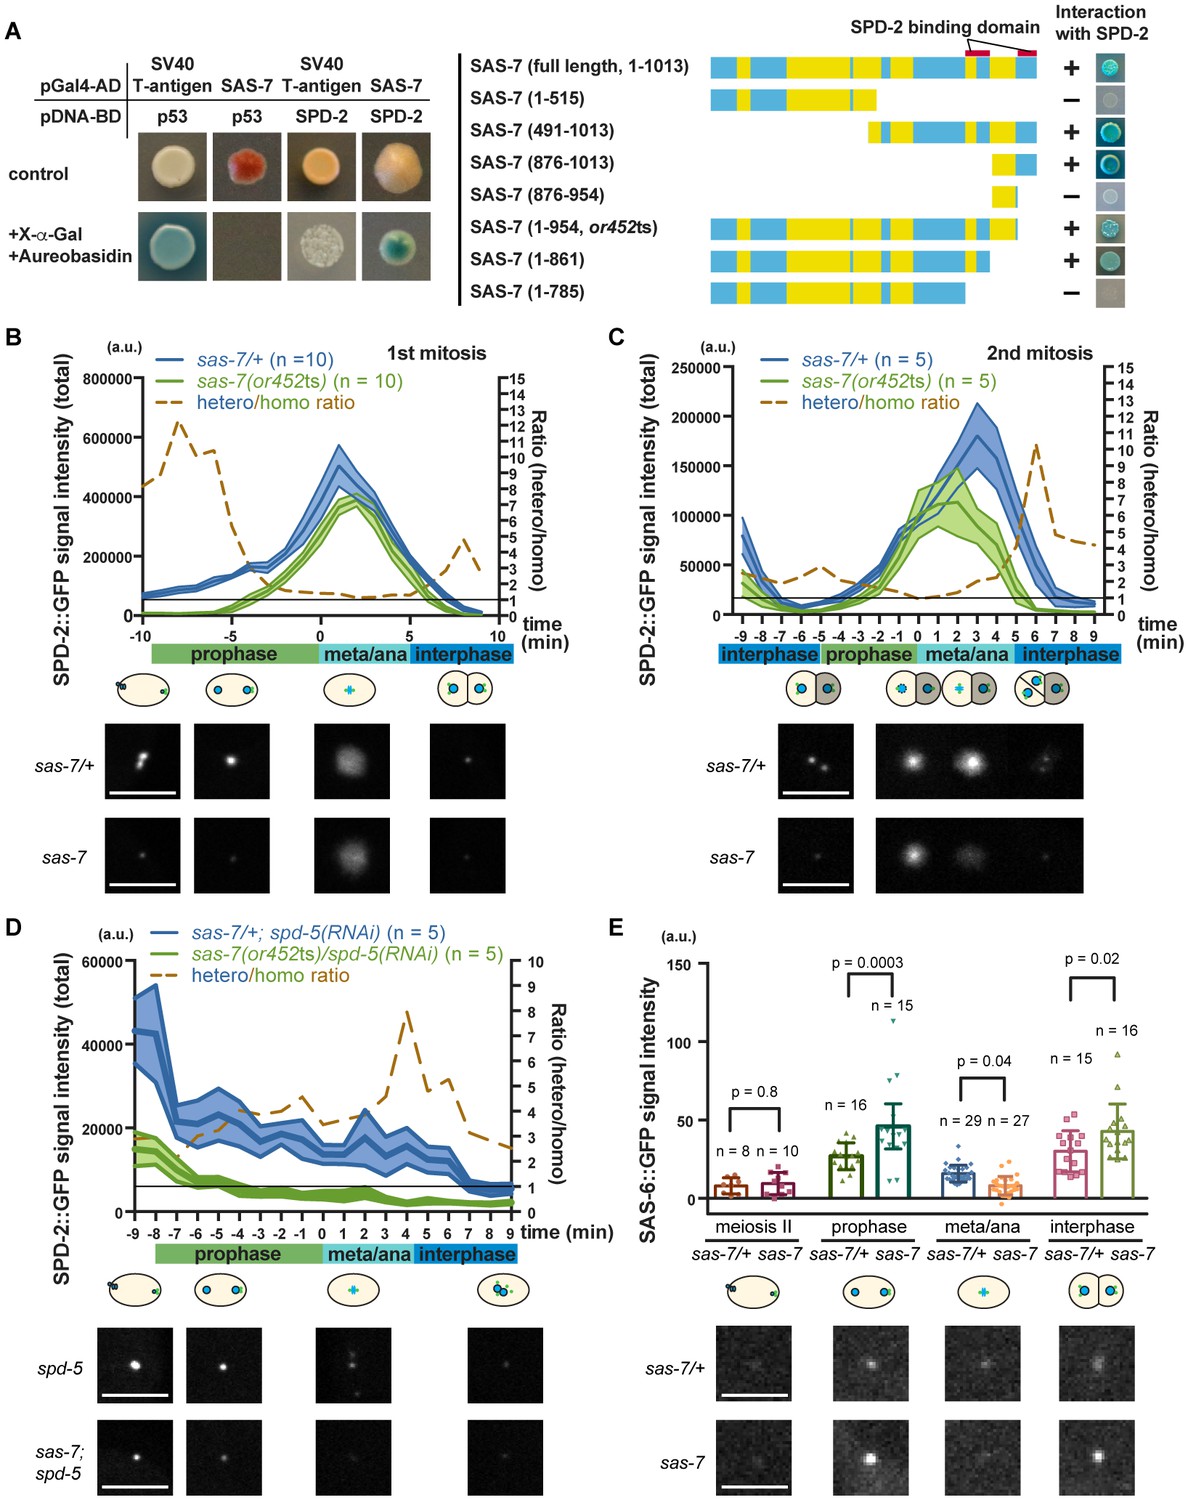
SAS-7 regulates SPD-2 centriolar localization.
(A) Yeast two-hybrid assays to test the interaction between SAS-7 and SPD-2. In the left panels, positive control, negative control and experiment are shown from left to right. Yellow in the gene model represents the coiled-coil motifs. (B, C) Quantified SPD-2::GFP signal intensity in the first mitosis (P0) and the second mitosis (AB) in B and C, respectively. (D) Quantified SPD-2::GFP signal in spd-5(RNAi) background. sas-7(or452ts) heterozygous siblings were used as a control in B-D. Mean ± SEM are shown. Times are relative to NEBD. (E) Quantified SAS-6::GFP signal intensity. Error bars indicate 95% confidence intervals (CI). P-values were calculated by one-way ANOVA with Holm-Sidak's multiple comparison test. Scale bars indicate 5 µm.
Figure 7
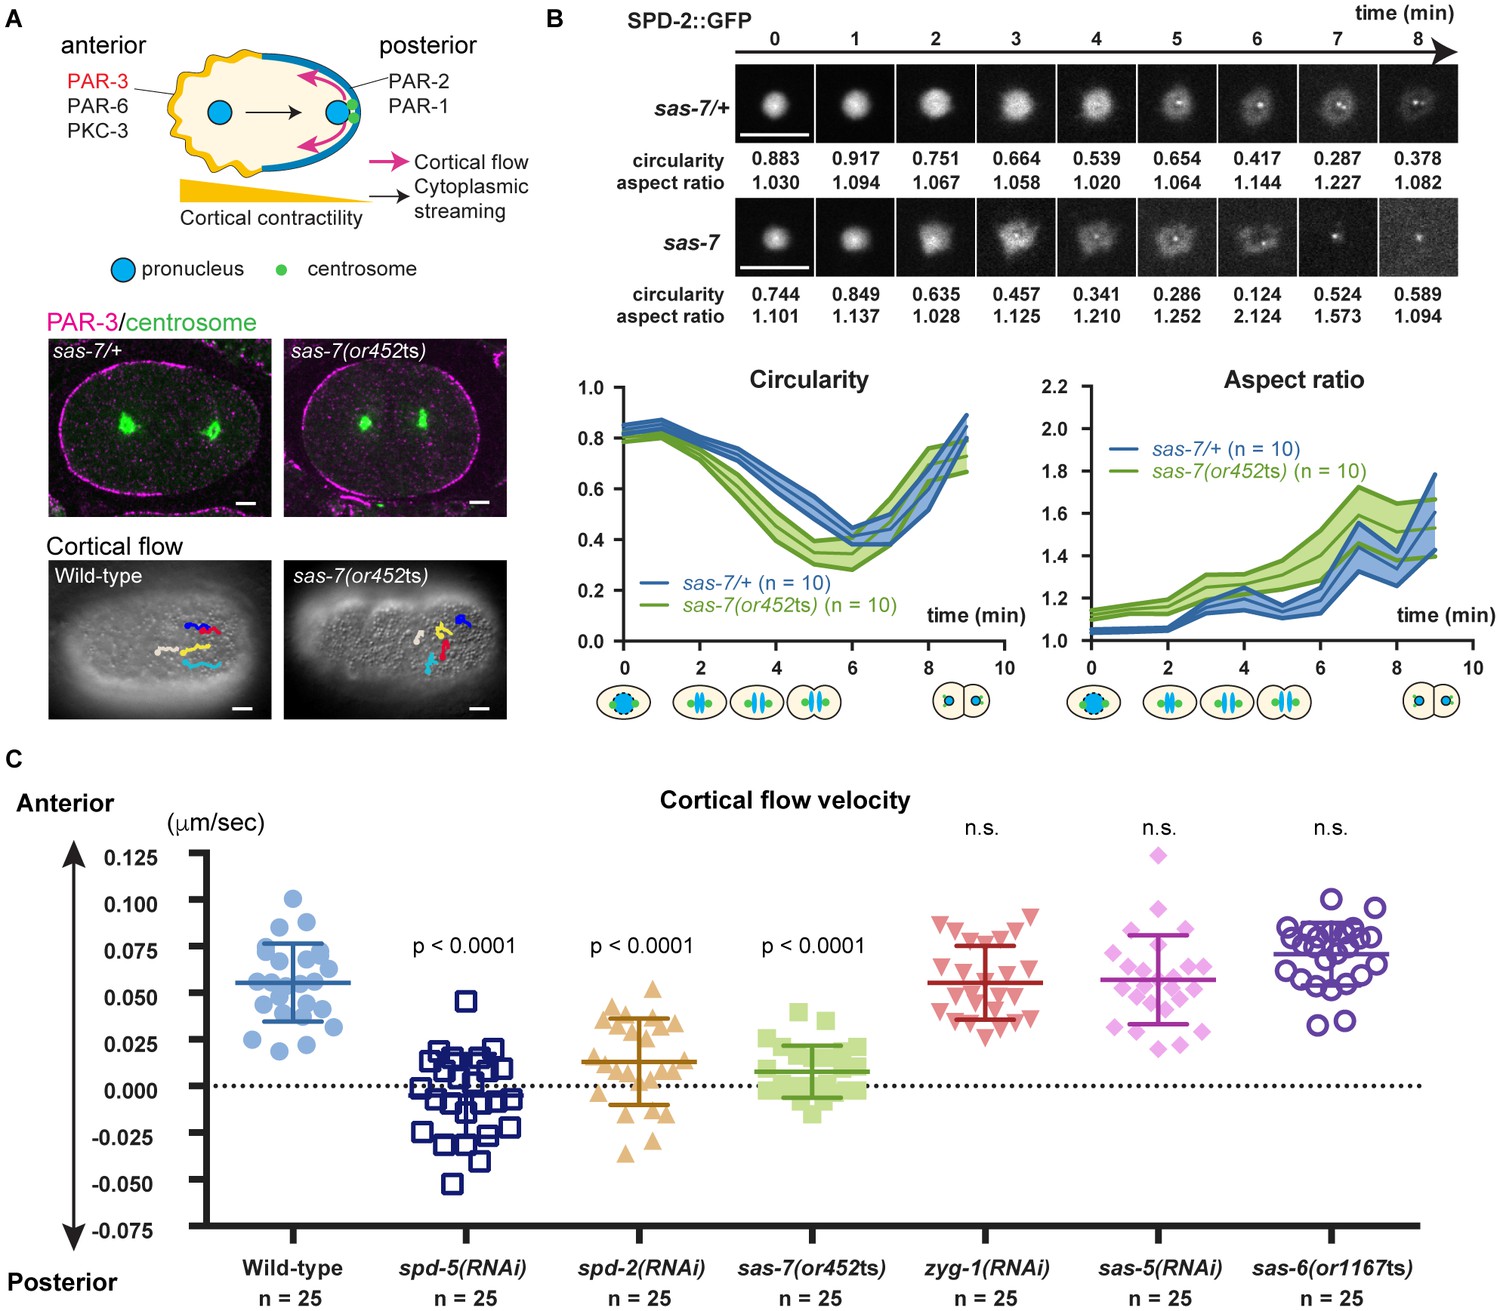
SAS-7 regulates PCM function and integrity.
(A) Top: Schematic illustration of PAR-dependent cell polarity at 1 cell stage. Middle: PAR-3 and SPD-5 antibody staining at telophase. Cortical PAR-3 and centrosomal SPD-5 are shown in magenta and green, respectively. Bottom: Trajectories of surface yolk granule movements during 120 s in early prophase. (B) PCM shapes in sas-7 mutant. Using SPD-2::GFP, PCM circularity and aspect ratios of anterior centrosomes were calculated and shown in the graphs. Time is relative to NEBD. sas-7 heterozygous siblings were used for control. (C) Cortical flow velocities in control and mutant embryos. Cortical flows were calculated and anterior-directed movements given a positive value. Mean ± SD are shown. P-values were calculated by one-way ANOVA with Bonferroni's multiple comparison test. Scale bars indicate 5 µm.
Figure 8

SAS-7 acts upstream of SPD-2 and is critical for both centriole assembly and PCM formation.
(A) Left: Proposed SAS-7 pathway regulates both centriole biogenesis and PCM formation. SAS-7 may directly regulate PCM SPD-2 (arrow 1), or indirectly affect a catalytic activity of the centriole (arrow 2; Zwicker et al., 2014) that controls PCM growth (see text). An inducing factor for cell polarity, X, is unknown. SAS-4 is reported to regulate PCM size (Kirkham et al., 2003) while PCM component(s) regulate proper SAS-4 recruitment (Dammermann et al., 2004) (dotted arrows). Right: A summary of centriole duplication defects and cell polarity defects in the mutants of PCM and centriole components (Gönczy, 2012; this study). *Unlike centriole duplication-defective and some partial loss of function sas-7(or452ts) mutants, depletion of PCM components γ-tubulin and SPD-5 does not fully block centriole duplication. (B) A model for SAS-7 function during centriole biogenesis and PCM formation. (i) SAS-7 recruits SPD-2 to the centriole to regulate the formation of the paddlewheel. (ii) SPD-2 recruits ZYG-1/SAS-5/SAS-6 to initiate daughter centriole formation. SPD-2 also promotes PCM formation to induce cell polarity by an unknown factor X. (iii) Cartwheel formation. (iv) Centriole duplication and SAS-7 recruits SPD-2 to the daughter centriole to form paddlewheel.
Tables
Table 1
Embryonic viability and early embryonic phenotypes.
Embryonic Viability (%)* | Monopolar spindle† | Multi-nucleated? | ||||||||
|---|---|---|---|---|---|---|---|---|---|---|
15°C | 26°C | P0 1 st mitosis | AB 2nd mitosis | P1 3rd mitosis | ABa 4th mitosis | ABp 5th mitosis | EMS 6th mitosis | P2 7th mitosis | Yes/No | |
Wild-type | 97.8 (n = 9, 2010) | 98.3 (n = 9, 916) | 0% | 0% | 0% | 0% | 0% | 0% | 0% | No |
sas-7 (or452ts) | 13.1 (n = 10, 1838) | 0 (n = 11, 1376) | 62% (24/39) | 47% (7/15) | 40% (6/15) | 20% (1/5) | 80% (4/5) | 80% (4/5) | 60% (3/5) | Yes |
sas-7 (or1942) | 0 (n = 7, 305) | N. D. | 0% (0/15) | 4% (1/26) | 0% (0/26) | 29% (6/21) | 24% (5/21) | 33% (7/21) | 14% (3/21) | Yes |
sas-7 (tm1105) | 96.9 (n = 7, 632) | 20 (n = 15, 533) | 0% (0/15) | 0% (0/15) | 0% (0/15) | 0% (0/12) | 0% (0/12) | 0% (0/12) | 0% (0/12) | Yes |
sas-7 (or452ts) /nDf40‡ | N. D. | 0 (n = 15, 555) | 56% (19/34) | 50% (12/24) | 29% (7/24) | N. D. | N. D. | N. D. | N. D. | Yes |
sas-7 (or452ts) /+ | N. D. | 97.2 (n = 9, 1173) | 0% (0/11) | 0% (0/11) | 0% (0/11) | N. D. | N. D. | N. D. | N. D. | No |
or452ts female /wild-type male§ | N. D. | 7.31 ± 2.28 (n = 7, 711) | 0% (0/20) | 0% (0/31) | 0% (0/31) | 24% (10/41) | 44% (18/41) | 42% (17/41) | 17% (7/41) | Yes |
Wild-type female /or452ts male# | N. D. | 57.4 ± 3.54 (n = 19, 1669) | 65% (13/20) | 0% (0/13) | 0% (0/12) | 0% (0/12) | 0% (0/12) | 0% (0/12) | 0% (0/12) | Yes |
Wild type female /wild-type male¶ | N. D. | 97.1 ± 1.09 (n = 6, 938) | N. D. | N. D. | N. D. | N. D. | N. D. | N. D. | N. D. | N. D. |
-
*L1 stage larvae were grown at the permissive temperature (15°C) or restrictive temperature (26°C). Once gravid, single worms were transferred every 12–24 hr for ~3 days, and the embryos laid and hatched were scored. Percent hatching is given ± standard error of the mean. In parenthesis are the number of worms scored and the number of embryos counted.
-
†L1 stage larva were grown at 26°C until young adults and videos were made typically starting prior to the pronuclei meeting.
-
‡nDf40 deletion, chr III: 0.77–3.36.
-
§Female genotype: sas-7(or452ts);fem-1(hc17ts).
-
#Female genotype: fem-1(hc17ts), Male genotype: sas-7(or452ts); him-8(e1489). Worms were raised at 26°C from L1 stage.
-
¶Female genotype: fem-1(hc17ts), Male genotype: him-8(e1489). Worms were raised at 26C from L1 stage.
Download links
A two-part list of links to download the article, or parts of the article, in various formats.
Downloads (link to download the article as PDF)
Open citations (links to open the citations from this article in various online reference manager services)
Cite this article (links to download the citations from this article in formats compatible with various reference manager tools)
Centriolar SAS-7 acts upstream of SPD-2 to regulate centriole assembly and pericentriolar material formation
eLife 6:e20353.
https://doi.org/10.7554/eLife.20353


