Oral transfer of chemical cues, growth proteins and hormones in social insects
- University of Lausanne, Switzerland
- Arid Land Agricultural Research Center, USDA-ARS, United States
- Instituto de Ciências Biológicas, Universidade Federal de Minas Gerais, Brasil
- University of Cambridge, United Kingdom
- Ecole Polytechnique Fédérale de Lausanne, Switzerland
- The University of Tokyo, Japan
- University of Haifa, Israel
- Wellcome Trust Genome Campus, United Kingdom
Figures
Figure 1 with 2 supplements
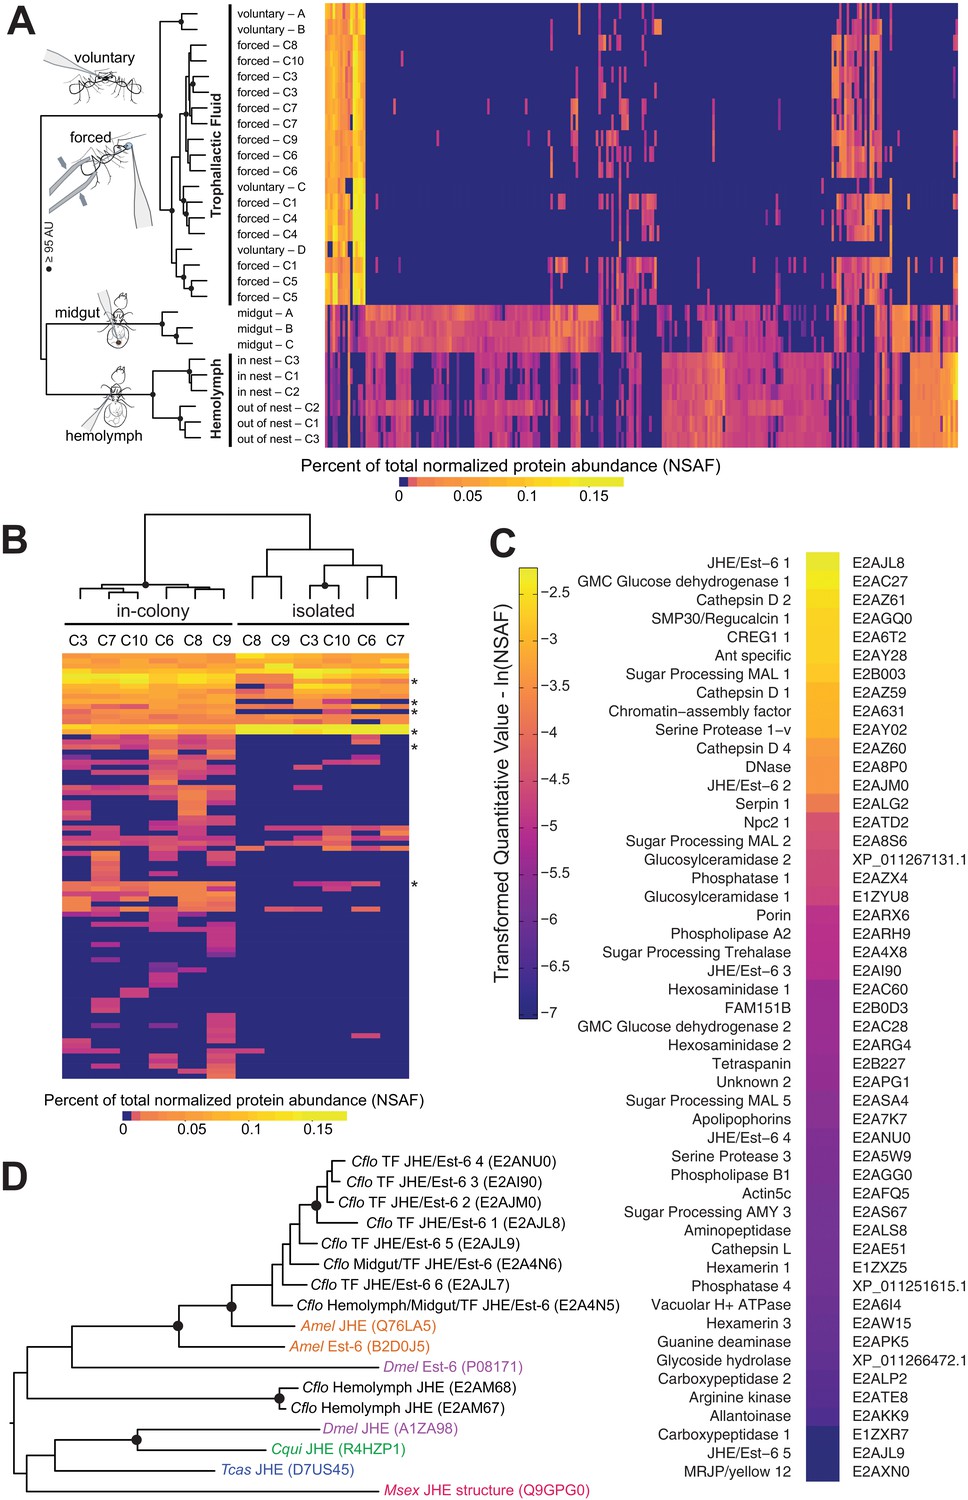
Proteomic characterization of Camponotus floridanus trophallactic fluid.
(A) Heat map showing the percentage of total molecular weight-normalized spectra assigned to proteins from voluntary TF, forced TF, midgut, or hemolymph fluids (normalized spectral abundance factor, NSAF [Zybailov et al., 2006]). C1-C10 indicate colony of origin. Forced trophallaxis samples are pooled from 10 to 20 ants, hemolymph from 30 ants, and the contents of dissected midguts from five ants each. Voluntary and midgut samples were collected from ants of multiple colonies; multiple samples are differentiated by letters. Approximately unbiased (AU) bootstrap probabilities for 10,000 repetitions are indicated by black circles where greater or equal to 95%. (B) Trophallaxis samples from the same ants, in-colony and group-isolated. Trophallactic fluids were sampled first upon removal from the colony, then after 14 days of group isolation (20–30 individuals per group). Values were compared by spectral counting, and the dendrogram shows approximately unbiased probabilities for 10,000 repetitions. Along the right side, asterisks indicate Bonferroni-corrected t-test significance to p < 0.05 between in-colony and isolated TF. Approximately unbiased (AU) bootstrap probabilities for 10,000 repetitions are indicated by black circles where greater or equal to 95%. (C) The most abundant proteins present in TF sorted by natural-log-scaled NSAF value. The UniProt ID or NCBI ID is listed to the right. (D) A dendrogram of proteins including all proteomically observed juvenile hormone esterases (JHE)/Est-6 proteins in C. floridanus, the orthologs in D. melanogaster and A. mellifera, and biochemically characterized JHEs. Each protein name is followed by the UniProt ID. C. floridanus JHE/Est-6 proteins are listed with the fluid source where they have been found. Names are color-coded by species. Bootstrap values >95% are indicated with a black circle. JHE/Est-6 6 (E2AJL7) is identified by PEAKS software but not by Scaffold and consequently is not shown in the proteomic quantifications in panels (A–C).
Figure 1—figure supplement 1
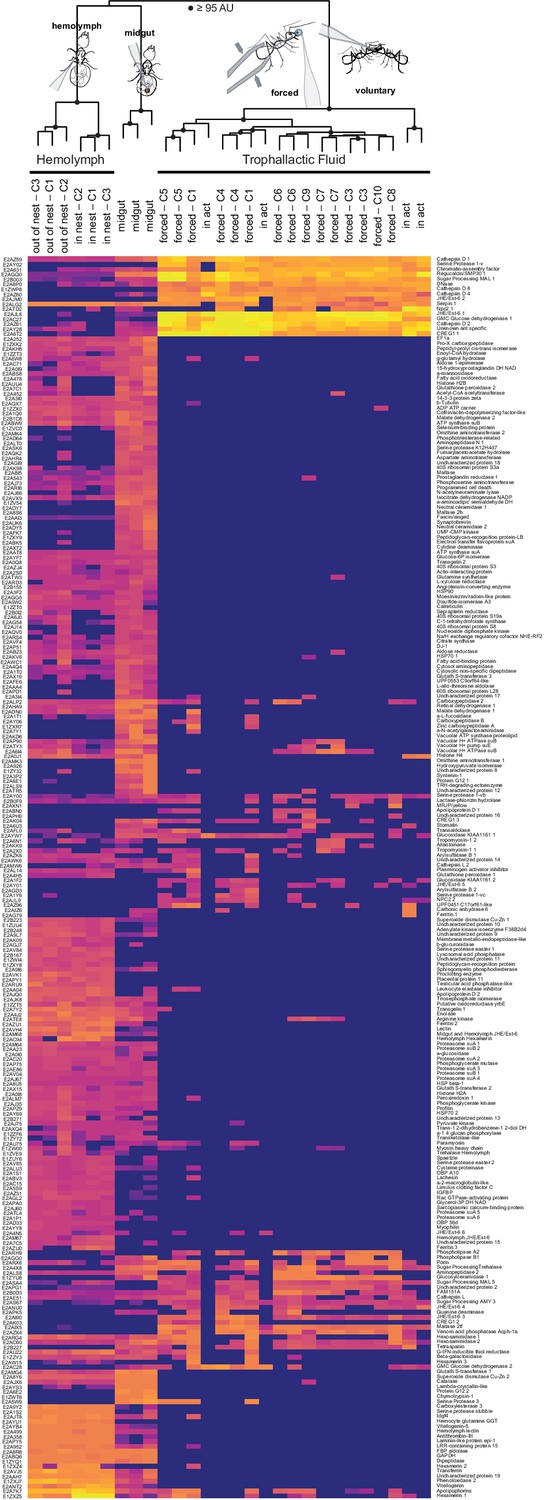
Proteomic characterization of C. floridanus trophallactic fluid.
Heat map showing the percentage of total molecular weight-normalized spectra assigned to proteins from voluntary TF, forced TF, midgut, or hemolymph fluids (normalized spectral abundance factor, NSAF [Zybailov et al., 2006]. C1-C10 indicate colony of origin. Forced trophallaxis samples are pooled from 10 to 20 ants, hemolymph from 30 ants, and the contents of dissected midguts from five ants each. Voluntary and midgut samples were collected from ants of multiple colonies. Approximately unbiased bootstrap probabilities for 10,000 repetitions are indicated by black circles where greater or equal to 95%. UniProt IDs are listed to the left and protein names to the right.
Figure 1—figure supplement 2
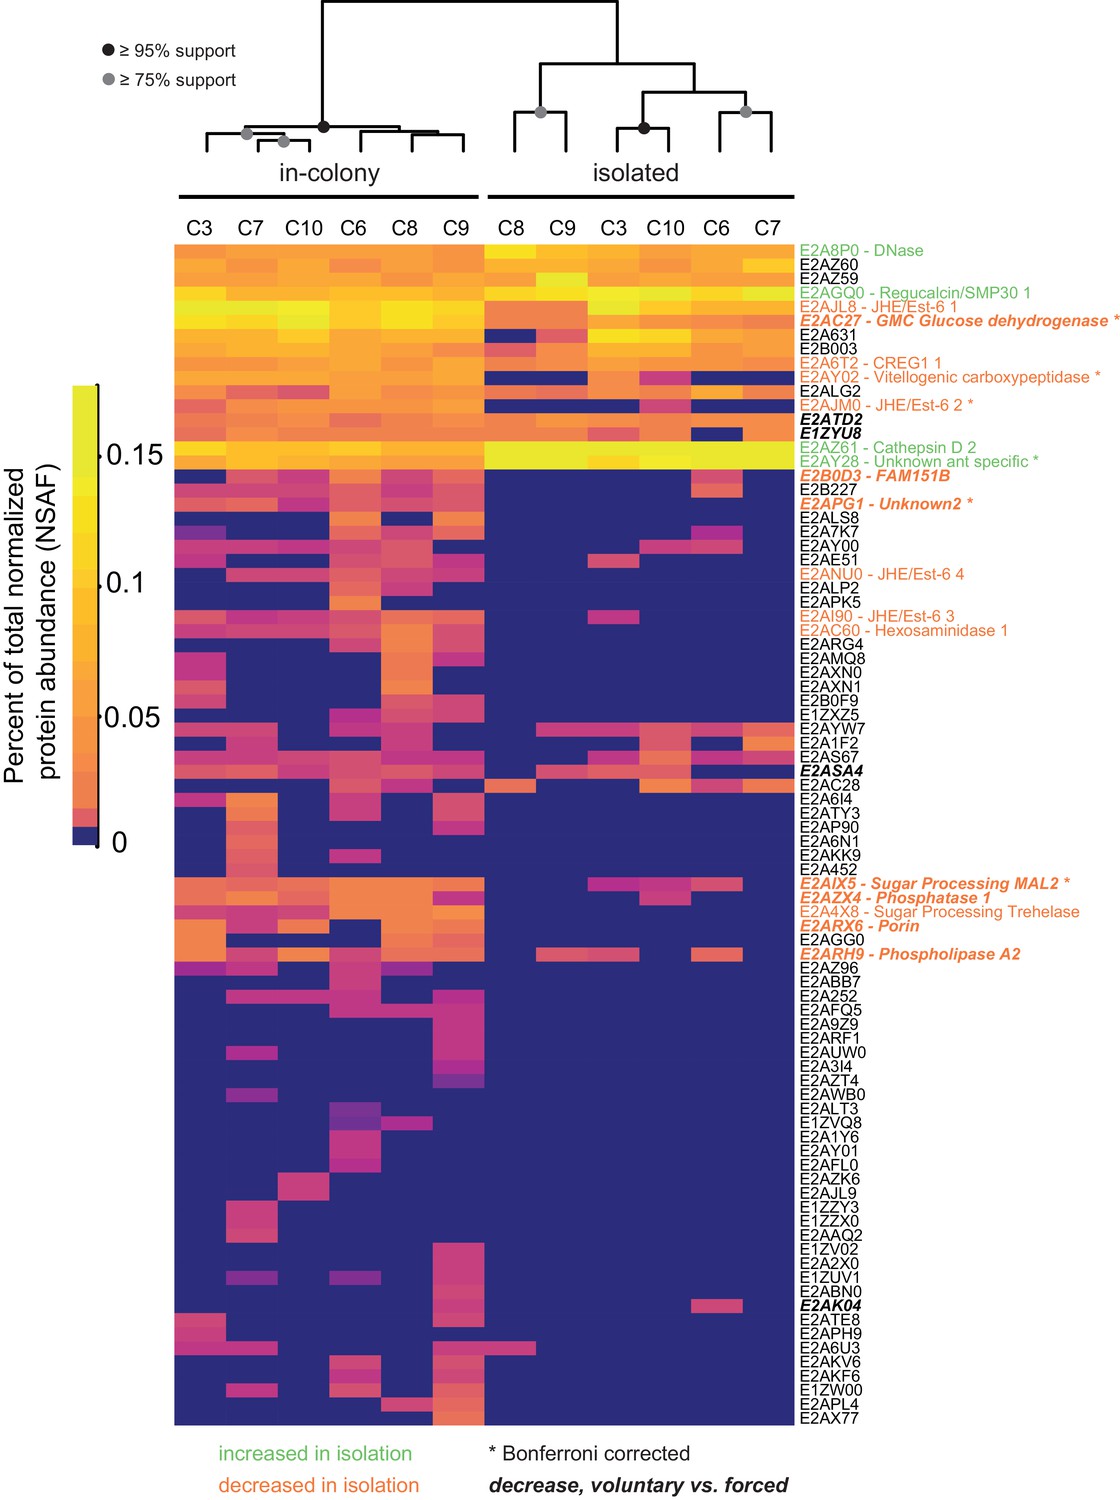
Social isolation influences trophallactic fluid content.
Trophallaxis samples from the same ants, in-colony and group-isolated. Trophallactic fluid of ant workers sampled when first removed from the colony, then after 14 days of group isolation (~20–30 individuals per group). Values were normalized using spectral counting and the dendrogram shows approximately unbiased probabilities for 10,000 repetitions. Along the right side, UniProt IDs are shown. Proteins that significantly decreased in abundance in isolation are shown in orange, and proteins that increased in abundance are shown in green (t-test p < 0.05). Asterisks indicate Bonferroni-corrected t-test significance. Names in bold italics indicate proteins that significantly decreased in abundance in voluntary samples (socially isolated, starved then fed) relative to forced TF samples (in-colony) from data shown in Figure 1A and Figure 1—figure supplement 1. Approximately unbiased (AU) bootstrap probabilities for 10,000 repetitions are indicated by black circles where greater or equal to 95% and grey circles where greater or equal to 75%.
Figure 2

Trophallactic fluid of C. floridanus contains microRNAs.
Left: heatmap showing the length of reads assigned to each C. floridanus microRNA (miRNA) found in TF. MiRNAs should exhibit a consistent read size typically between 18 and 22 base pairs. Right: histogram indicating read abundance. miRNA names were assigned through homology to A. mellifera where possible. Letters were assigned for novel miRNAs. Bold miRNA names indicate miRNAs whose homologs were also observed in royal and/or worker jelly in A. mellifera (Guo et al., 2013). Source data in Figure 2—source data 1.
Figure 3 with 1 supplement
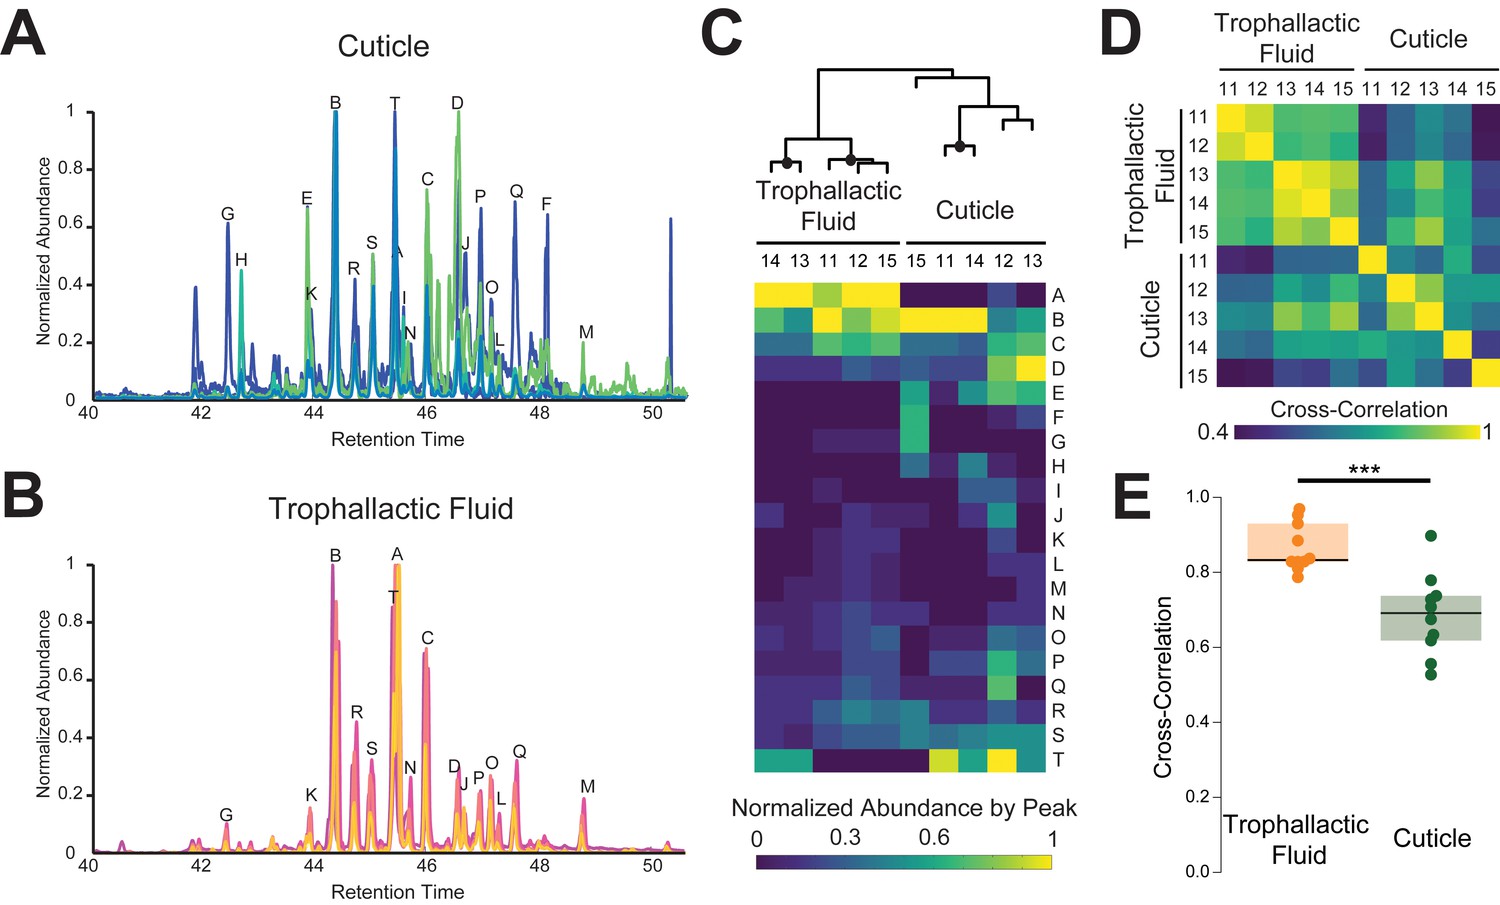
Trophallactic fluid of C. floridanus contains cuticular hydrocarbons.
(A–B) Gas chromatography-mass spectrometry profiles in the retention time window for cuticular hydrocarbons (C28–C37), from hexane extracts of whole body (A) and from trophallactic fluid (B). Samples were extracts from whole body and trophallactic fluid for five groups of 20–38 ants. Each group of ants is from a different colony, C11-C15. Different colonies are shown in distinct colors. Source data in Figure 3—source data 1. The abundant component (peak A) found in TF samples but not on the cuticle was cholesterol, a molecule that insects cannot synthesize but must receive from their diet. Three molecules outside this window were found only in TF and not on the cuticle: 7Z-tricosene, oleic acid, ethyl oleate (Table 1). All have been reported to be pheromones in other insect species (Wang et al., 2011; Le Conte et al., 2001; Mohammedi et al., 1996; Choe et al., 2009). (C) A hierarchically clustered heatmap of the dominant peaks in the range of retention times for long-chain cuticular hydrocarbons. The dendrogram shows approximately unbiased probabilities for 10,000 repetitions. Approximately unbiased bootstrap values > 95% are indicated with black circles. Letters along the right correspond to individual peaks in (A) and (B). (D) Normalized pair-wise cross-correlation values for each TF and body hydrocarbon profile for each of the five colonies. Source data in Figure 3—source data 2. (E) Normalized pair-wise cross-correlation values between TF hydrocarbon profiles and between body hydrocarbon profiles indicate that the TF hydrocarbon profiles are significantly more similar than are body hydrocarbon profiles. Median values and interquartile ranges are shown. t-test, p<0.0003.
-
Figure 3—source data 1
Peak lists for cuticular and trophallactic fluid long chain hydrocarbons form GC-MS experiments for five different colonies of C.floridanus.
C11, 20 ants, 9.5 µL of TF; C12, 38 ants, 20 µL; C13, 34 ants, 11 µL; C14, 26 ants, 11.5 µL; C15, 35 ants, 9 µL.
- https://doi.org/10.7554/eLife.20375.008
-
Figure 3—source data 2
Cross-correlation matrix for panels 3D-E.
- https://doi.org/10.7554/eLife.20375.009
Figure 3—figure supplement 1
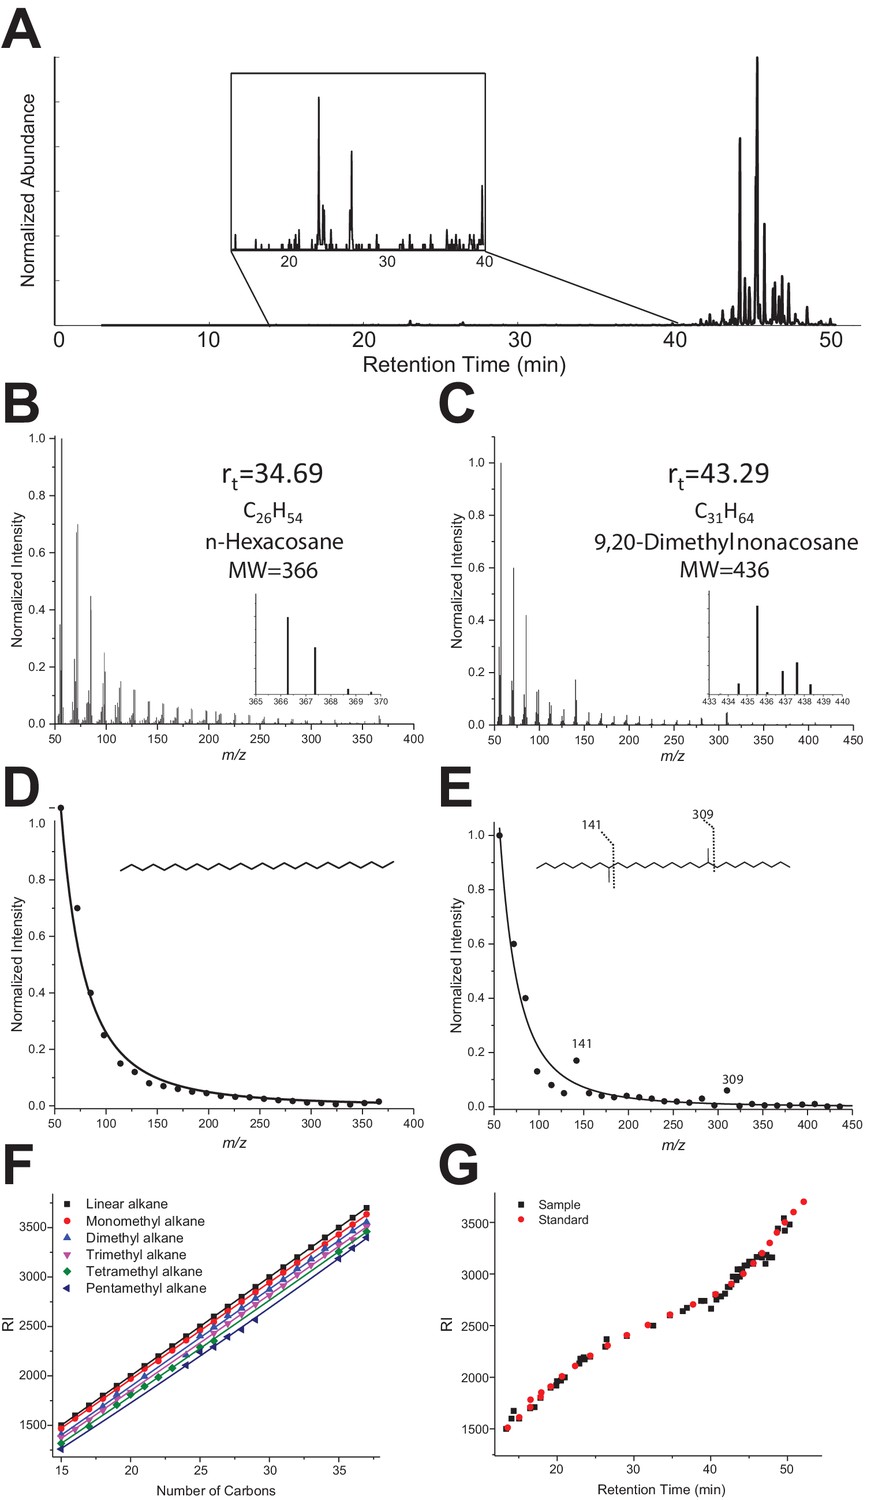
(A) Typical GC-MS chromatogram of a TF sample from C. floridanus, showing the main hydrocarbons C28-C37 eluting after 40 min. The insert shows the region with minor hydrocarbons and other components C15-C28. (B–D) GC-MS Mass spectra of linear alkane (n-hexacosane at Rt 34.69 min, panel B) and a dimethylated alkane at Rt 43.29 min (C). Extracted MS profiles were fitted with an exponential decay equation (B, D). The proposed structure for the branched alkane based on fragments ions (141 and 309) is 9,20-dimethyl nonacosane (D). (E) RI values vs. number of carbons extracted from the NIST Chemistry WebBook library, depending on the number of ramifications: linear (black), monomethyl (red), dimethyl (blue), trimethyl (pink), tetramethyl (green) and pentamethyl (dark blue). (F) The black dots represent experimental retention times with the calculated RI index for all identified hydrocarbons of the TF sample. The red dots represent the experimental retention times and with their RI index for the linear C8-C40 alkane standard.
Figure 4
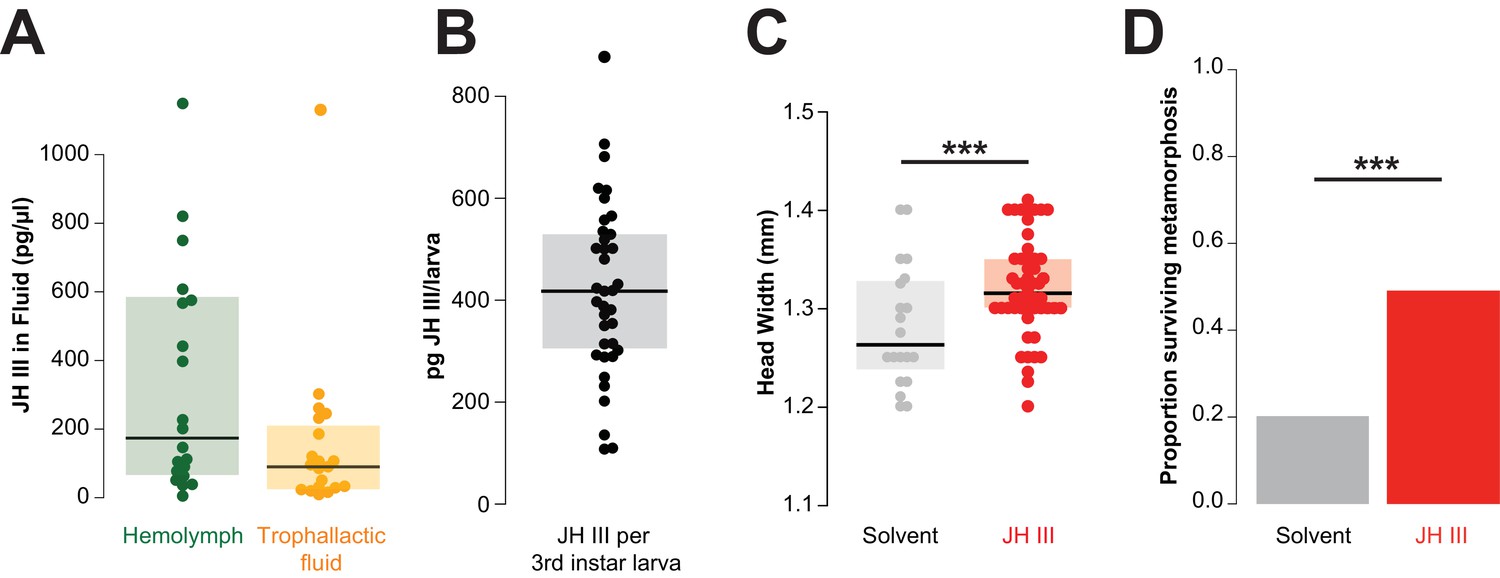
Juvenile hormone passed in trophallactic fluid increases larval growth and rate of pupation in C. floridanus.
(A) JH titer in trophallactic fluid and hemolymph (n = 20; each replicate is a group of 30 workers). Source data in Figure 4—source data 1. (B) JH content of third instar larvae. Source data in Figure 4—source data 2. (C) Head width of pupae raised by workers who were fed food supplemented with JH III or solvent. General linear mixed model (GLMM) testing effect of JH on head width with colony, replicate and experiment as random factors, ***p < 9.01e−06. Source data in Figure 4—source data 3. (D) Proportion of larvae that have undergone metamorphosis when workers were fed food supplemented with JH III or solvent only. Binomial GLMM testing effect of JH on survival past metamorphosis with colony and experiment as random factors, ***p < 7.39e−06. Median values and interquartile ranges are shown in panels (A–C). Panels (C) and (D) are data from three separate experiments where effects in each were individually significant to p<0.05. Source data in Figure 4—source data 4.
-
Figure 4—source data 1
Hemolymph and trophallactic fluid Juvenile hormone titers for 20 pooled samples of each fluid.
- https://doi.org/10.7554/eLife.20375.013
-
Figure 4—source data 2
Juvenile hormone titers for 37 individual third instar larvae.
- https://doi.org/10.7554/eLife.20375.014
-
Figure 4—source data 3
Head-width measurements for panel 4C.
- https://doi.org/10.7554/eLife.20375.015
-
Figure 4—source data 4
Metamorphosis or death counts for panel 4D.
- https://doi.org/10.7554/eLife.20375.016
Figure 5 with 1 supplement
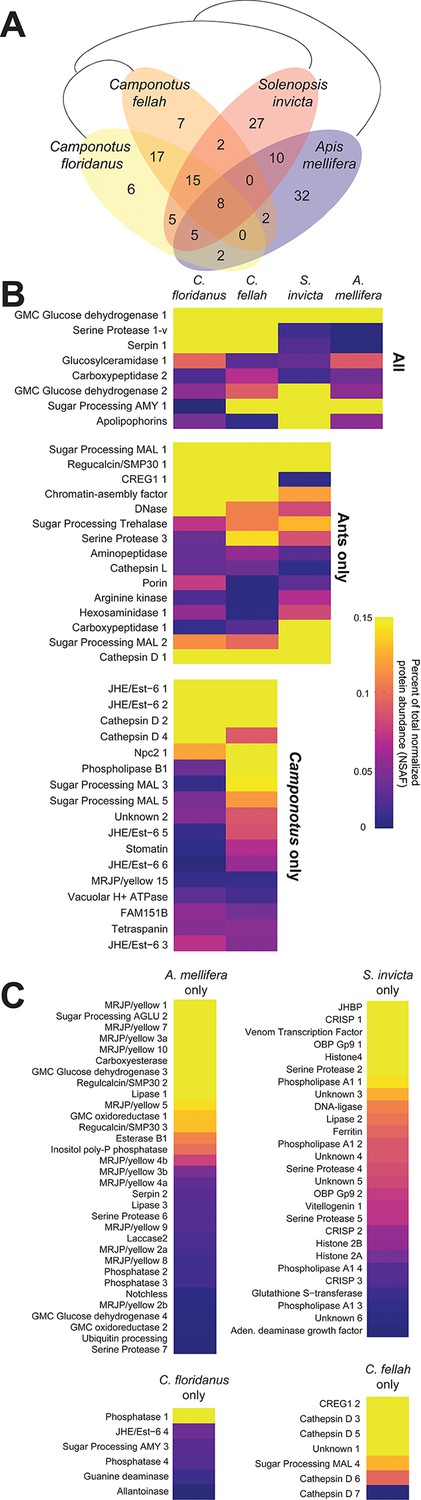
Proteins in trophallactic fluid across social insect species.
(A) Venn diagram indicating the number of species-specific and orthologous proteins detected in TF from the indicated species, whose phylogenetic relationships are shown with black lines. (B) Heat maps showing the percentage of total molecular-weight normalized spectra in TF samples assigned to the proteins in each given species, averaged over all in-colony samples for that species. Samples sizes: C. floridanus (n = 15), C. fellah (n = 6), S. invicta (n = 3), A. mellifera (n = 6). (C) Species-specific TF proteins. The 26 TF ortholog groups found in two or three species, but not the most closely related ones (e.g., A. mellifera and S. invicta, or S. invicta and only one of the two Camponotus species) are indicated in Figure 5—figure supplement 1.
-
Figure 5—source data 1
A table of all orthologous proteins and their predicted functions, identifiers, known D. melanogaster orthologs, presence of annotated secretion signals and average NSAF values when present in TF.
A complete orthology across the four species can be found in Supplementary file 3.
- https://doi.org/10.7554/eLife.20375.018
Figure 5—figure supplement 1
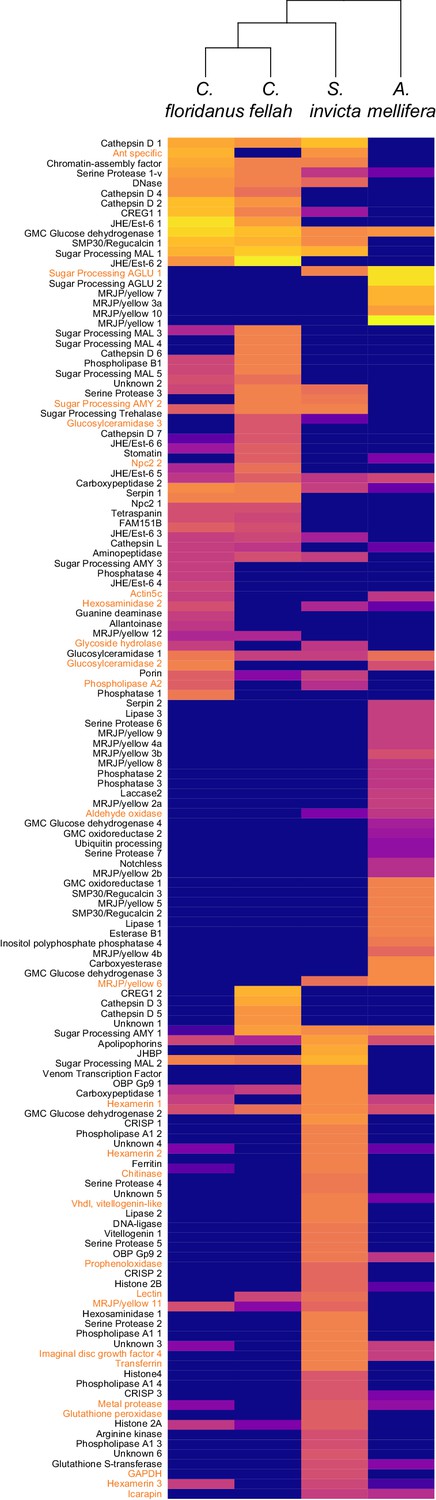
Heat map showing the percentage of total molecular-weight normalized spectra in trophallactic fluid samples assigned to each protein in three ant species and the European honey bee, averaged over all in-colony samples for that species.
Sample sizes: C. floridanus (n = 15), C. fellah (n = 6), S. invicta (n = 3), A. mellifera (n = 6). The 26 protein ortholog groups whose presence/absence in TF was inconsistent with phylogeny (e.g., present in only C. floridanus and A. mellifera) are shown in orange. Protein names are shown on the left. Identifiers can be found in the table in Figure 5—figure supplement 1.
Author response image 1
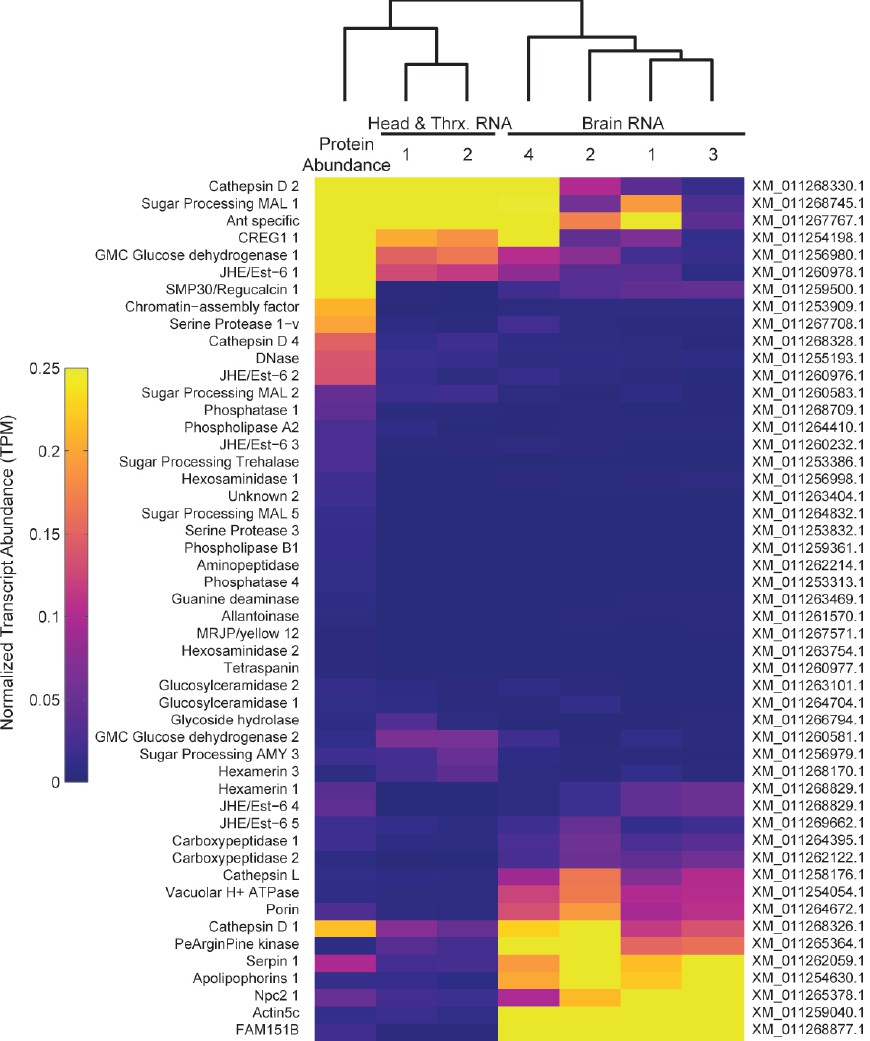
Heatmap comparing TF protein abundance with RNA expression of the same genes in brain, head and thorax samples from RNA-Seq datasets (Simola et al. Genome Research 2013).
Expression values are calculated as transcripts per million (TPM) reads, and normalized for presentation on the same scale as proteomic data from Figure 5 (NSAF).
Tables
Table 1
Table of all components identified by GC-MS in TF of C. floridanus. Molecules marked with black dots (•) were found only in TF and not on the cuticle. Peak ID corresponds to Figure 3.
Retention time | Proposed MF | Proposed structure | RI | Peak ID |
|---|---|---|---|---|
13.35 | C15H32 | Pentadecane | 1500 | |
14.05 | C16H34 | 4-Methyltetradecane | 1600 | |
14.34 | C10H10O3 | Mellein | 1674 | |
15.05 | C16H34 | Hexadecane | 1600 | |
16.47 | C17H36 | Heptadecane | 1700 | |
17.06 | C20H42 | 7,9-Dimethylheptadecane | 1710 | |
17.83 | C18H38 | Octadecane | 1800 | |
19.15 | C19H40 | Nonadecane | 1900 | |
19.89 | C21H44 | 7,10,11-Trimethyloctadecane | 1920 | |
19.97 | C16H32O2 | n-Hexadecanoic acid | 1962 | |
20.5 | C18H36O2 | Ethyl palmitate | 1968 | |
20.62 | C20H42 | Eicosane | 2000 | |
20.98 | C18H36O | Octadecanal | 1999 | |
22.89 | C18H32O2 | Linoleic acid | 2133 | |
23.03 | C18H34O2 | Oleic acid | 2179 | • |
23.46 | C20H36O2 | Ethyl-9-Cis-11-Trans-octadecadienoate | 2193 | |
23.59 | C20H38O2 | Ethyl oleate | 2173 | • |
24.3 | C22H46 | Docosane | 2200 | |
26.27 | C23H46 | 7Z-Tricosene | 2296 | • |
26.45 | C20H38O2 | Cis-13-Eicosenoic acid | 2368 | |
29.08 | C24H50 | Tetracosane | 2400 | |
32.51 | C25H52 | Pentacosane | 2500 | |
34.69 | C26H54 | Hexacosane | 2600 | |
36.37 | C27H56 | 4-Methylhexacosane | 2640 | |
36.91 | C27H54 | Heptacosene | 2672 | |
38.76 | C28H58 | 9-Methylheptacosane | 2740 | |
39.19 | C28H58 | 5-Methylheptacosane | 2740 | |
40.05 | C28H58 | *-Trimethylpentacosane | 2610 | |
40.63 | C28H58 | Octacosane | 2800 | |
40.76 | C28H58 | 7-Methylheptacosane | 2753 | |
41.36 | C29H60 | 5,7,11-Trimethylhexacosane | 2783 | |
41.88 | C29H60 | 4-Methylnonacosane | 2810 | |
42.23 | C29H58 | Nonacosene | 2875 | |
42.47 | C30H62 | 2,10-Dimethyloctacosane | 2874 | G |
42.7 | C29H60 | Nonacosane | 2900 | H |
42.9 | C31H64 | 9,16-Dimethylnonacosane | 2974 | |
43.29 | C31H64 | 9,20-Dimethylnonacosane | 2974 | |
43.36 | C30H62 | 7-Methylnonacosane | 2940 | |
43.51 | C31H64 | 4-Methyltriacontane | 3045 | |
43.79 | C31H64 | 7,16-Dimethylnonacosane | 2974 | |
43.9 | C31H64 | 2-Methyltriacontane | 3045 | E |
43.96 | C31H64 | 10-Methyltriacontane | 3045 | K |
44.12 | C32H66 | 10,11,15-Trimethylnonacosane | 3023 | |
44.42 | C32H66 | *-Dimethyltriacontane | 3083 | B |
44.74 | C32H66 | 8,12-Dimethyltriacontane | 3083 | Q |
45.02 | C33H68 | *-Trimethyltriacontane | 3119 | R |
45.3 | C31H62 | Hentriacontene | 3100 | |
45.45 | C33H68 | 5,10,19-Trimethyltriacontane | 3119 | S |
45.54 | C27H46O | Cholest-5-en-3-ol / Cholesterol | 3100 | A |
45.7 | C31H64 | Hentriacontane | 3100 | M |
46 | C34H70 | 9,13-Dimethyldotriacontane | 3185 | C |
46.56 | C33H68 | 5,9-Dimethyldotriacontane | 3185 | D |
46.69 | C34H70 | *-Tetramethylnonacosane | 3160 | J |
46.93 | C34H70 | *-Multiramified tetratriacontane | 3220–3100 | O |
47.15 | C34H70 | 5,9,13,17,21-Pentamethylnonacosane | 3100 | N |
47.28 | C33H68 | *-Dimethylhentriacontane | 3185 | T |
47.58 | C34H70 | 10,14,18,22-Tetramethyldotriacontane | 3160 | P |
48.01 | C34H70 | *-Tetramethyldotriacontane | 3160 | |
48.12 | C35H72 | 11,15-Dimethyltritiacontane | 3380 | F |
48.77 | C35H72 | *-Methyltetratriacontane | 3440 | L |
49.54 | C36H74 | 14-Methylpentatriacontane | 3540 | |
49.67 | C36H74 | *-Multiramifiedhexatriacontane | 3420–3300 | |
50.28 | C37H76 | *-Tetramethyltetratriacontane | 3480 |
Additional files
-
Supplemental file 1
RNA of microorganisms present in trophallactic fluid.
- https://doi.org/10.7554/eLife.20375.020
-
Supplemental file 2
Proteomic experiments included in this study.
- https://doi.org/10.7554/eLife.20375.021
-
Supplemental file 3
Orthology matrix across four social insect species.
- https://doi.org/10.7554/eLife.20375.022
Download links
A two-part list of links to download the article, or parts of the article, in various formats.
Downloads (link to download the article as PDF)
Open citations (links to open the citations from this article in various online reference manager services)
Cite this article (links to download the citations from this article in formats compatible with various reference manager tools)
Oral transfer of chemical cues, growth proteins and hormones in social insects
eLife 5:e20375.
https://doi.org/10.7554/eLife.20375


