Experimental reconstitution of chronic ER stress in the liver reveals feedback suppression of BiP mRNA expression
- University of Iowa Carver College of Medicine, United States
Figures
Figure 1
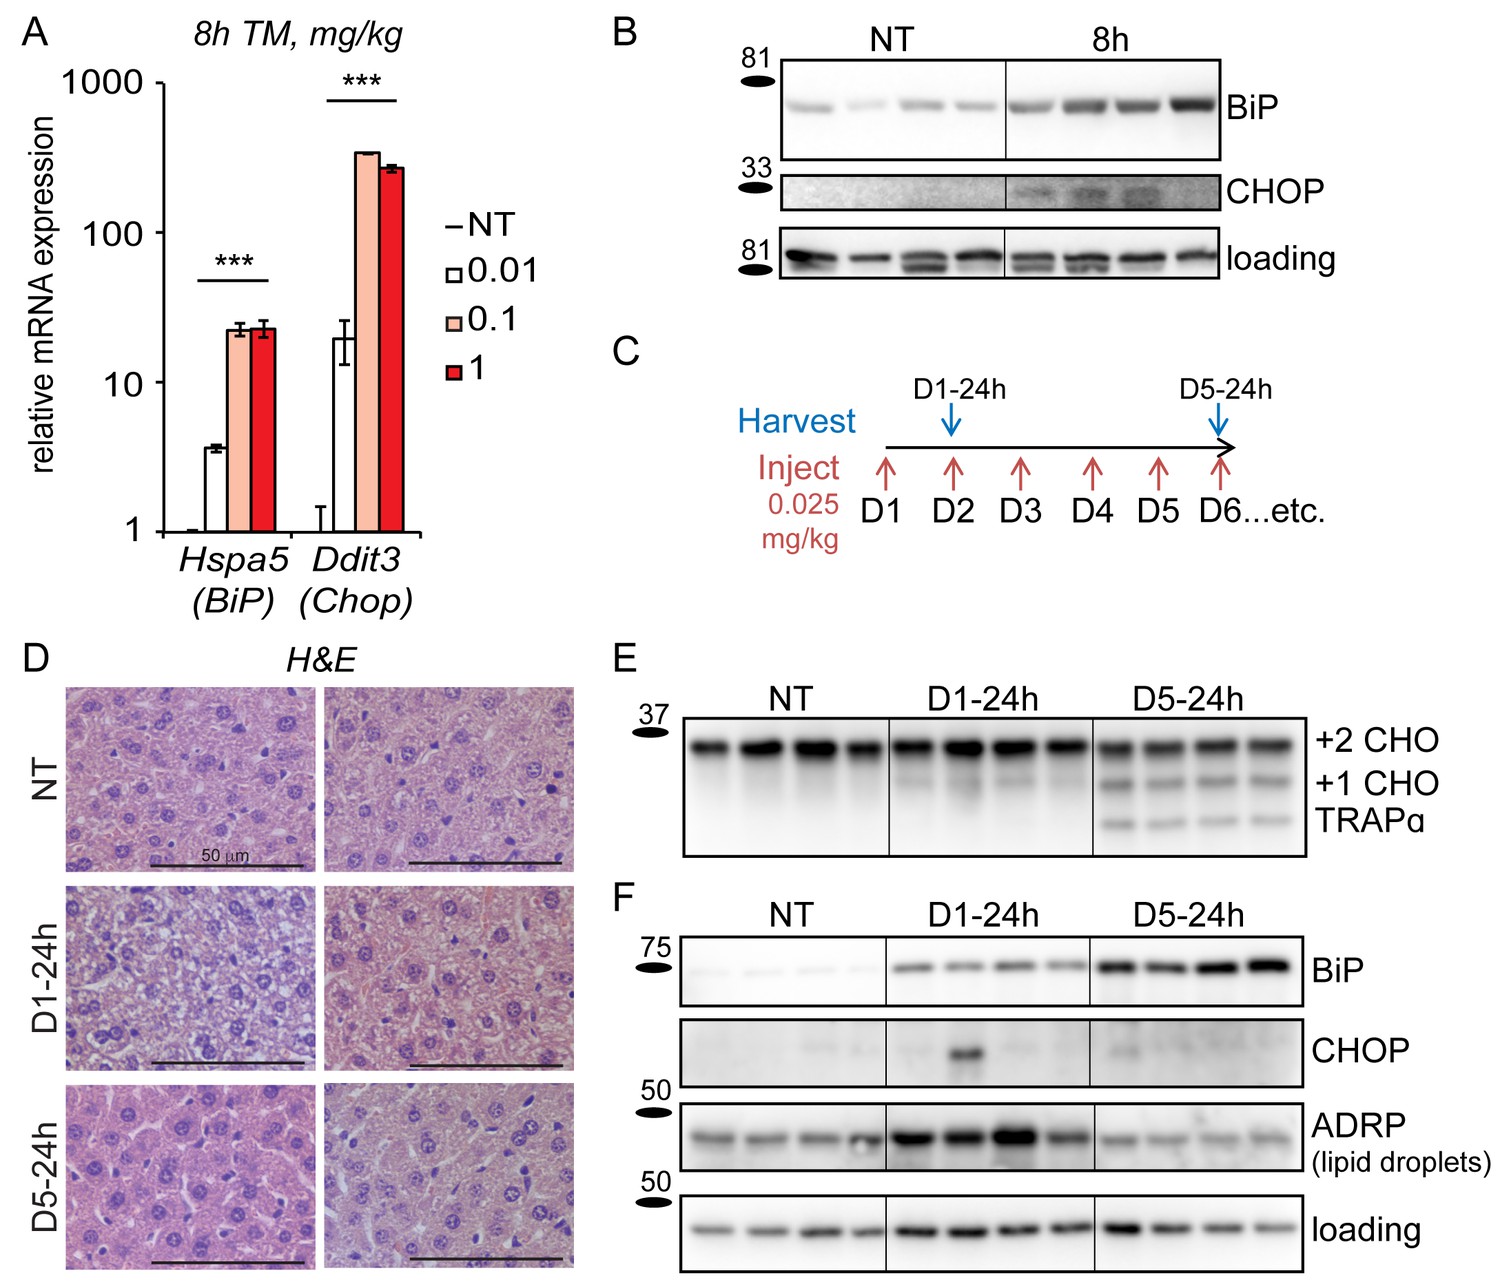
Mice adapt to repeated exposure to TM despite persistent stress.
(A) Livers from wild-type mice collected 8 hr after injection with the indicated concentrations of TM (in mg/kg) were probed by qRT-PCR for expression of Hspa5 (encoding BiP) and Ddit3 (encoding CHOP). n = 2–3 animals/group. Significance was determined by one-way ANOVA. Here and elsewhere, ***, p<0.001; **, p<0.01; *, p<0.05.; NS = not significant (B) Livers were harvested after treatment for 8 hr with vehicle or 0.025 mg/kg TM and protein lysates were probed by immunoblot to detect BiP or CHOP. Calnexin was used as a loading control. For all blots and gels in this paper, each lane represents a separate animal. Hairlines are used for visual clarity only. (C) Chronic stress treatment schematic. Mice were weighed and then injected daily with 0.025 mg/kg TM (red arrows); liver samples were collected at the indicated times (blue arrows) for downstream analysis. The naming convention is as follows: ‘D’ indicates the number of daily injections received while ‘h’ indicates the time of tissue collection after the last injection. Here and elsewhere, not treated animals (NT) received injections of vehicle at the same times that D5-24h mice received TM. (D) Formalin-fixed liver sections from animals treated as in (C) were collected, fixed, and stained by H and E at the indicated times. For each condition, representative images from two separate mice are shown. Note the extensive cytoplasmic vacuolization in the D1-24h animals. (E, F) Protein lysates from animals treated as in (C) were isolated and probed for expression of the ER-resident glycoprotein TRAPα (E) and BiP, CHOP, ADRP, and α-actin (loading control) (F).
-
Figure 1—source data 1
Contains raw and transformed Ct values for qRT-PCR experiment in Figure 1A.
- https://doi.org/10.7554/eLife.20390.004
Figure 2
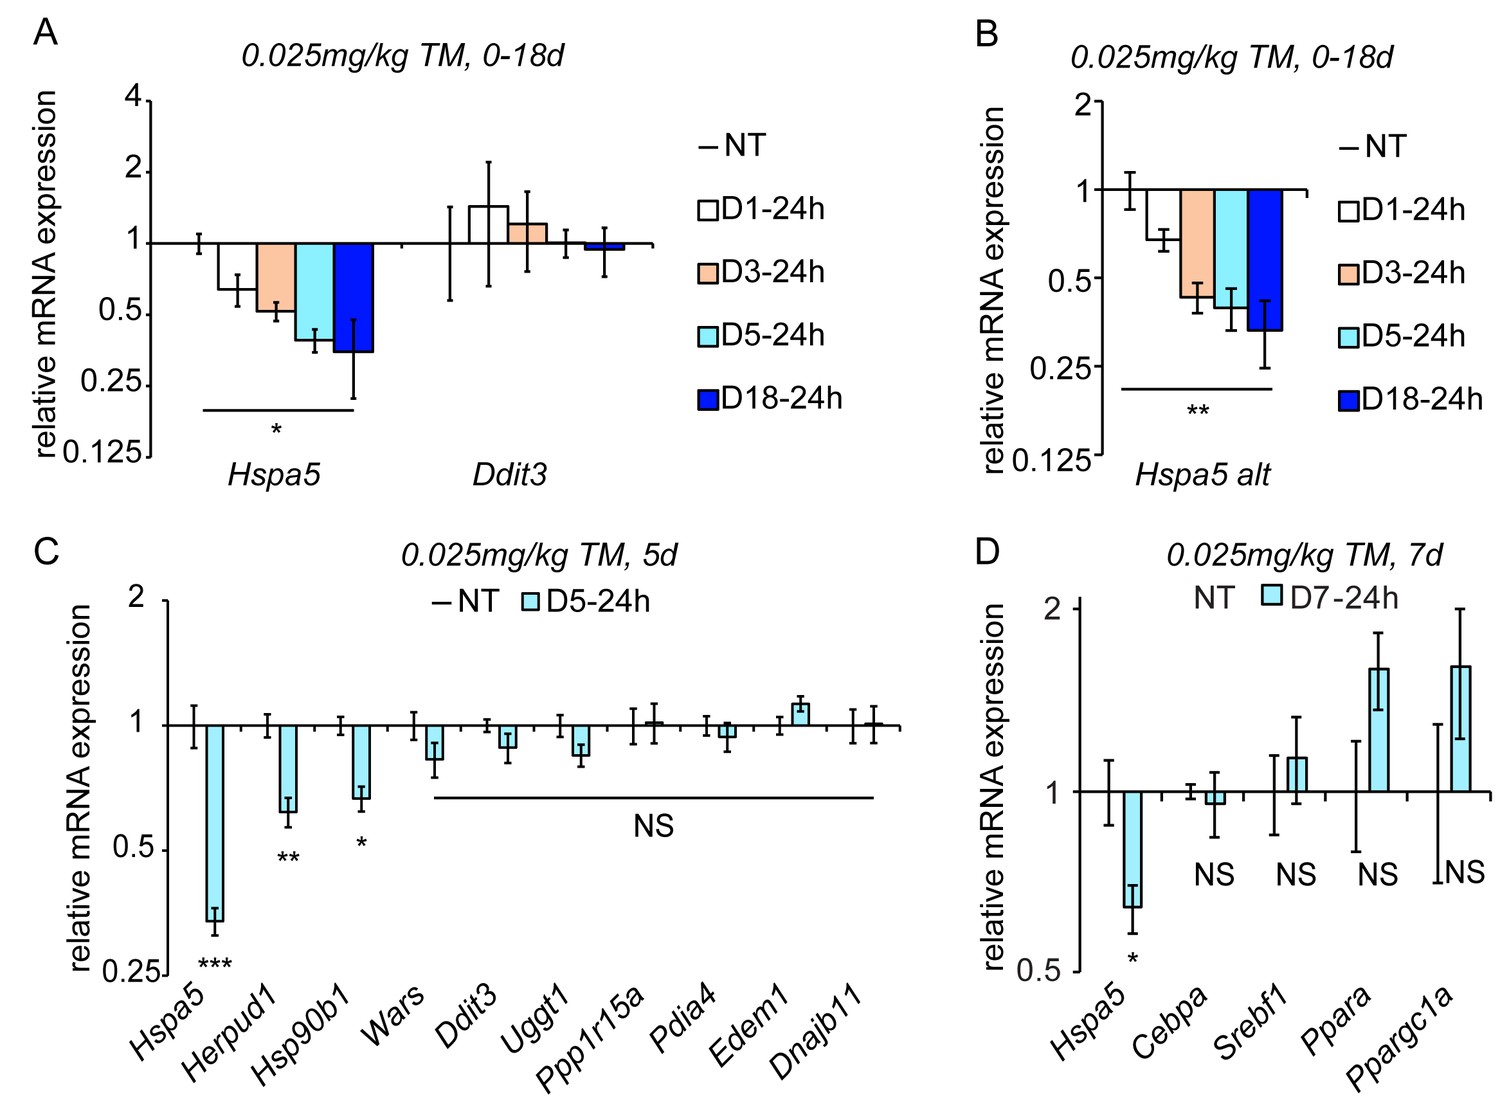
Chronic stress suppresses a subset of UPR target genes.
(A) Mice were injected with 0.025 mg/kg TM daily for up to 18 days, and livers were collected 24 hr after the last injection as indicated. Expression of Hspa5 and Ddit3 was measured by qRT-PCR. Expression is given relative to vehicle-treated control mice. Data for all qRT-PCR experiments is shown on a log scale. n = 2–3 animals/group (B) Expression of Hspa5 using an alternate primer pair spanning a different exon/intron junction confirms results from (A). (C) qRT-PCR of a group of UPR target genes from animals treated with vehicle or TM for 5d. n = 8 animals/group from two experiments. (D) Expression of the indicated metabolic genes was determined by qRT-PCR from an experiment similar to (C), except injections were performed for 7d. n = 4 animals/group.
-
Figure 2—source data 1
Contains raw and transformed Ct values for qRT-PCR experiments in Figure 2A–D.
- https://doi.org/10.7554/eLife.20390.006
Figure 3
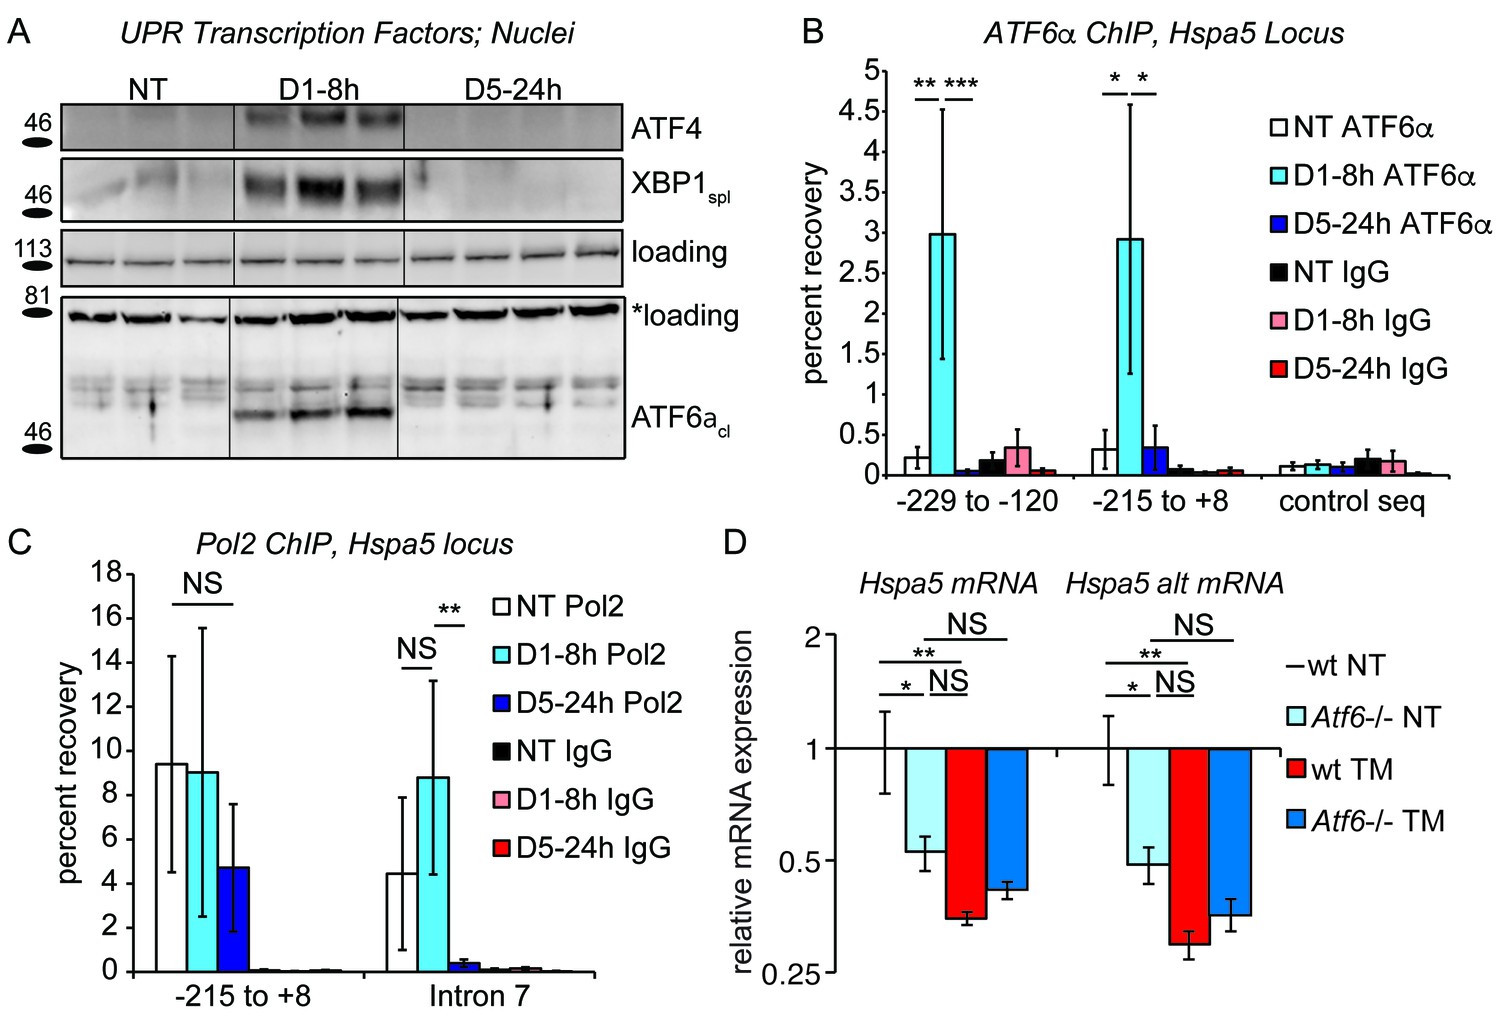
Chronic stress silences ATF6α-dependent transcription.
(A) After treatment of mice with 0.025 mg/kg TM for either 8 hr or 5d, nuclei were isolated from liver lysates and probed with antibodies against ATF4, XBP1, or ATF6α. Specificity of all antibodies was confirmed by immunoblot from knockout or overexpression cells or liver lysates (not shown). The loading control for ATF4 and XBP1 blots was PARP. The loading control for the ATF6α immunblot is a nonspecific background band (*). (B) After TM treatment as in (A), control Ig or antibodies against ATF6α were used to immunopurify the Hspa5 promoter region, which was then amplified by qPCR using primers directed against two overlapping regions in the promoter containing the ER stress elements (ERSEs) or a control sequence. Number is given relative to the transcriptional start site. n = 3–4 animals/group (C) Same as (B), except ChIP was performed using antibodies against RNA Polymerase 2. The −215 to + 8 regions detects poised polymerase and so Pol2 binding does not change, while the Intron seven region (+2727 to+2906) detects elongating Pol2. (D) Wild-type or Atf6-/- mice were treated with 0.025 mg/kg TM or vehicle for 5d. qRT-PCR expression of Hspa5 in the liver was assessed using both primer sets. Hspa5 expression was suppressed to comparable levels by either chronic stress or deletion of ATF6α, but chronic stress had no effect in Atf6-/- animals. n = 3–5 animals/group.
-
Figure 3—source data 1
Contains raw and transformed Ct values for qPCR and qRT-PCR experiments in Figure 3B–D.
- https://doi.org/10.7554/eLife.20390.008
Figure 4
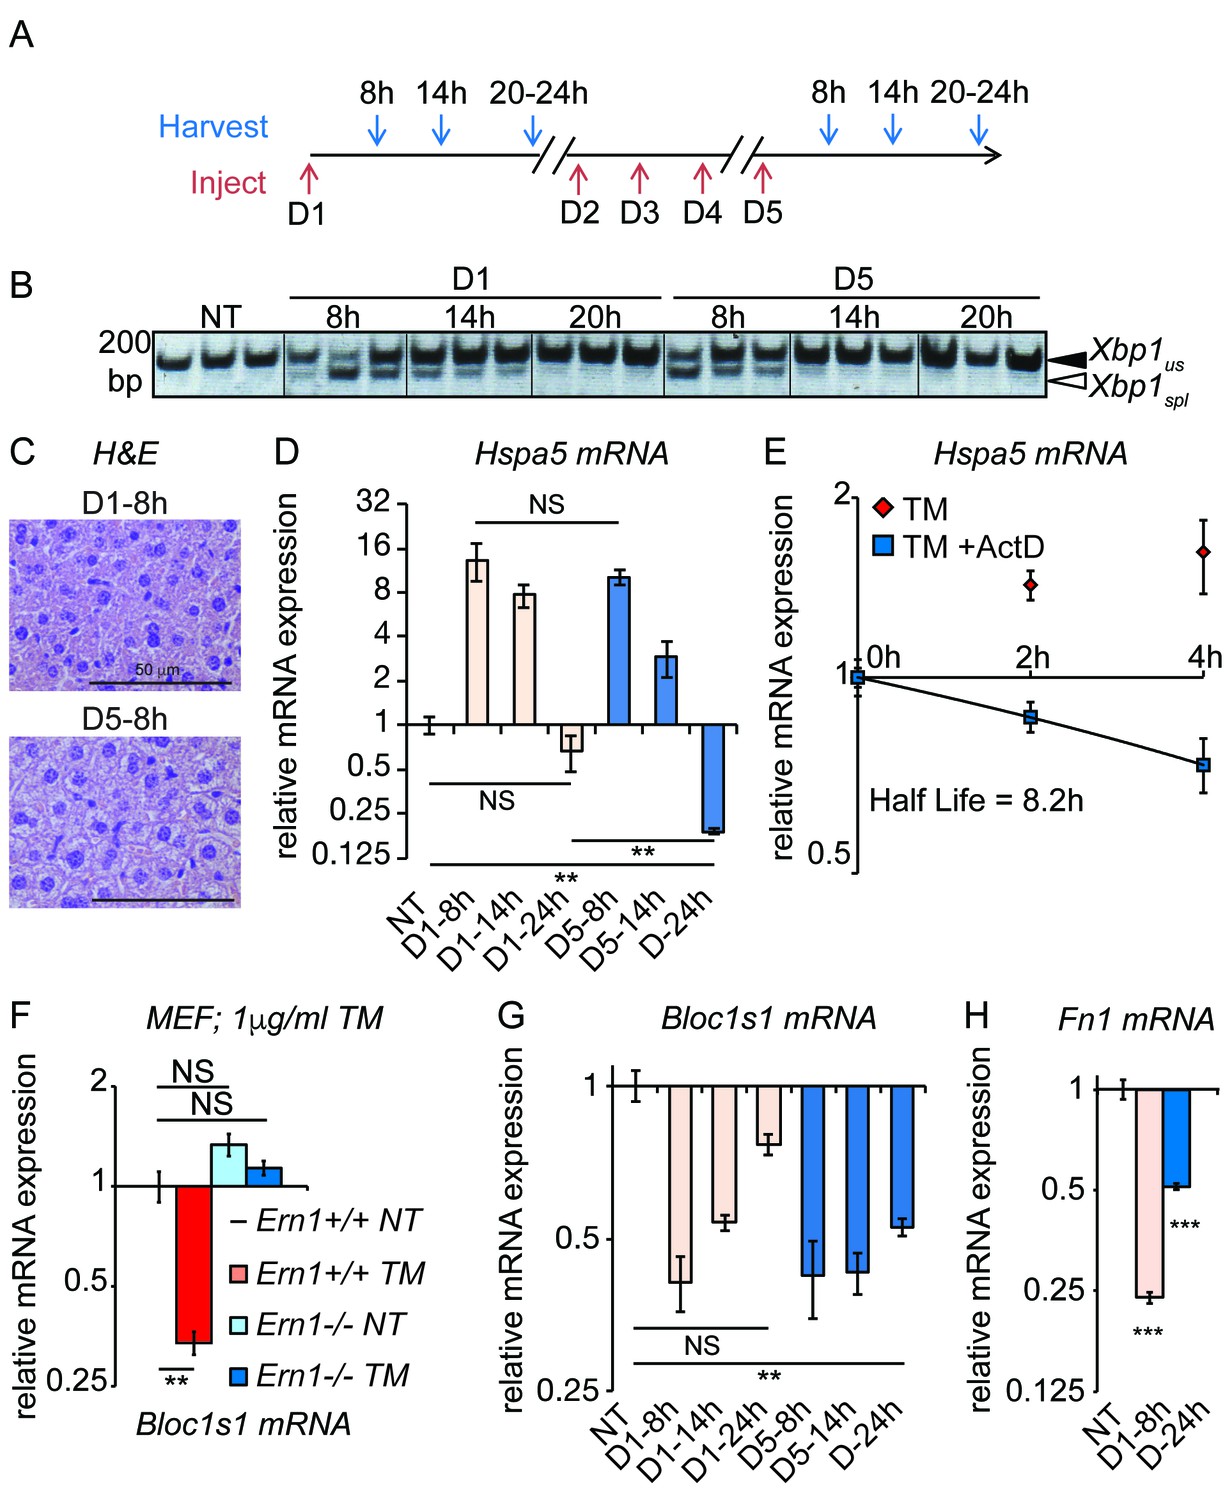
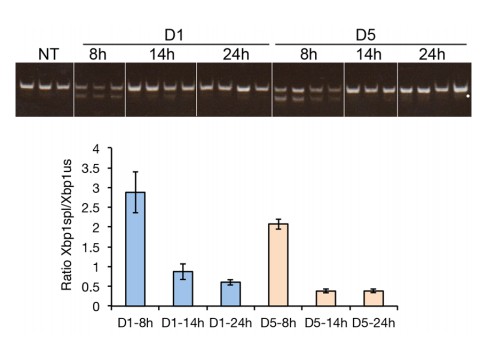
Accelerated degradation diminishes Hspa5 mRNA levels during chronic stress.
(A) Schematic showing treatment protocol; livers were harvested 8, 14, or 20–24 hr after either the first TM injection or the fifth. (B) Conventional RT-PCR was used to distinguished spliced (spl) from unspliced (us) Xbp1 mRNA in samples treated as in (A). Image is inverted black-to-white for greater visual clarity. Each lane represents a separate animal. (C) H and E staining of liver sections harvested at the D1-8h or D5-8h timepoints. (D) Hspa5 mRNA expression was assessed by qRT-PCR from samples treated as in (B). n = 3–4 animals per group (E) Primary hepatocytes were isolated from a wild-type mouse, and treated with TM in the presence or absence of actinomycin D (ActD) to inhibit transcription as described in Materials and methods. Hspa5 half-life was calculated from these data. n = 3 plates/group (F) Wild-type or Ern1-/- (lacking IRE1α) mouse embryonic fibroblasts (MEFs) were treated with TM for 8 hr and expression of the RIDD target Bloc1s1 was determined by qRT-PCR. n = 3 plates/group (G) Animals were treated as in (A) and Bloc1s1 expression was detected by qRT-PCR. (H) Animals were treated for 8 hr or 5d with 0.025 mg/kg TM. Expression of Fn1 was determined by qRT-PCR. n = 4 animals/group.
-
Figure 4—source data 1
Contains raw and transformed Ct values for qRT-PCR experiments in Figure 4D–H.
- https://doi.org/10.7554/eLife.20390.010
Figure 5
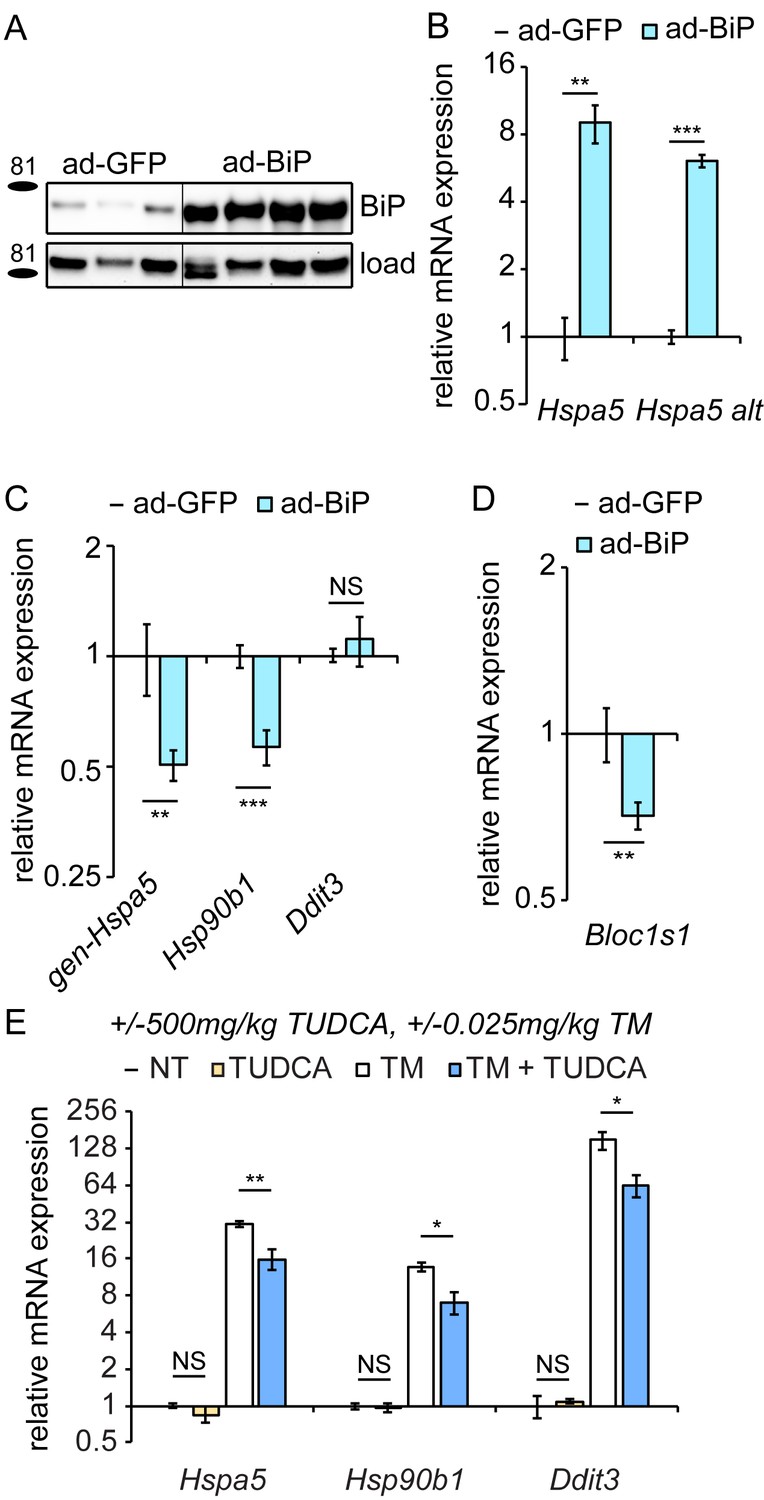
Overexpression of exogenous BiP is sufficient to repress endogenous Hspa5 expression.
(A) Animals were injected with recombinant adenovirus expressing either GFP or BiP. 5d after injection, mice were sacrificed and BiP was probed by immunoblot. Loading control was calnexin. (B) Both primer sets detected elevated Hspa5 expression in ad-BiP mice, which is attributable to the contribution of the exogenous Hspa5. n = 8 animals/group for regular Hspa5 primers and 3–4 animals/group for Hspa5 alternate primers. (C, D) Expression of endogenous Hspa5 from the genomic locus (gen-Hspa5), Hsp90b1, or Ddit3 (C) or Bloc1s1 (D) was assessed in ad-GFP and ad-BiP animals by qRT-PCR. n = 8 animals/group from two experiments. (E) Wild-type animals were treated for 10d with 500 mg/kg TUDCA, and then for 8 hr with 0.025 mg/kg TM, and expression of the indicated genes was detected by qRT-PCR. TUDCA was sufficient to reduce stress-induced expression of these genes approximately two-fold or more, but not to suppress basal Hspa5 expression. n = 3–6 animals/group.
-
Figure 5—source data 1
Contains raw and transformed Ct values for qRT-PCR experiments in Figure 5B–E.
- https://doi.org/10.7554/eLife.20390.012
Figure 6
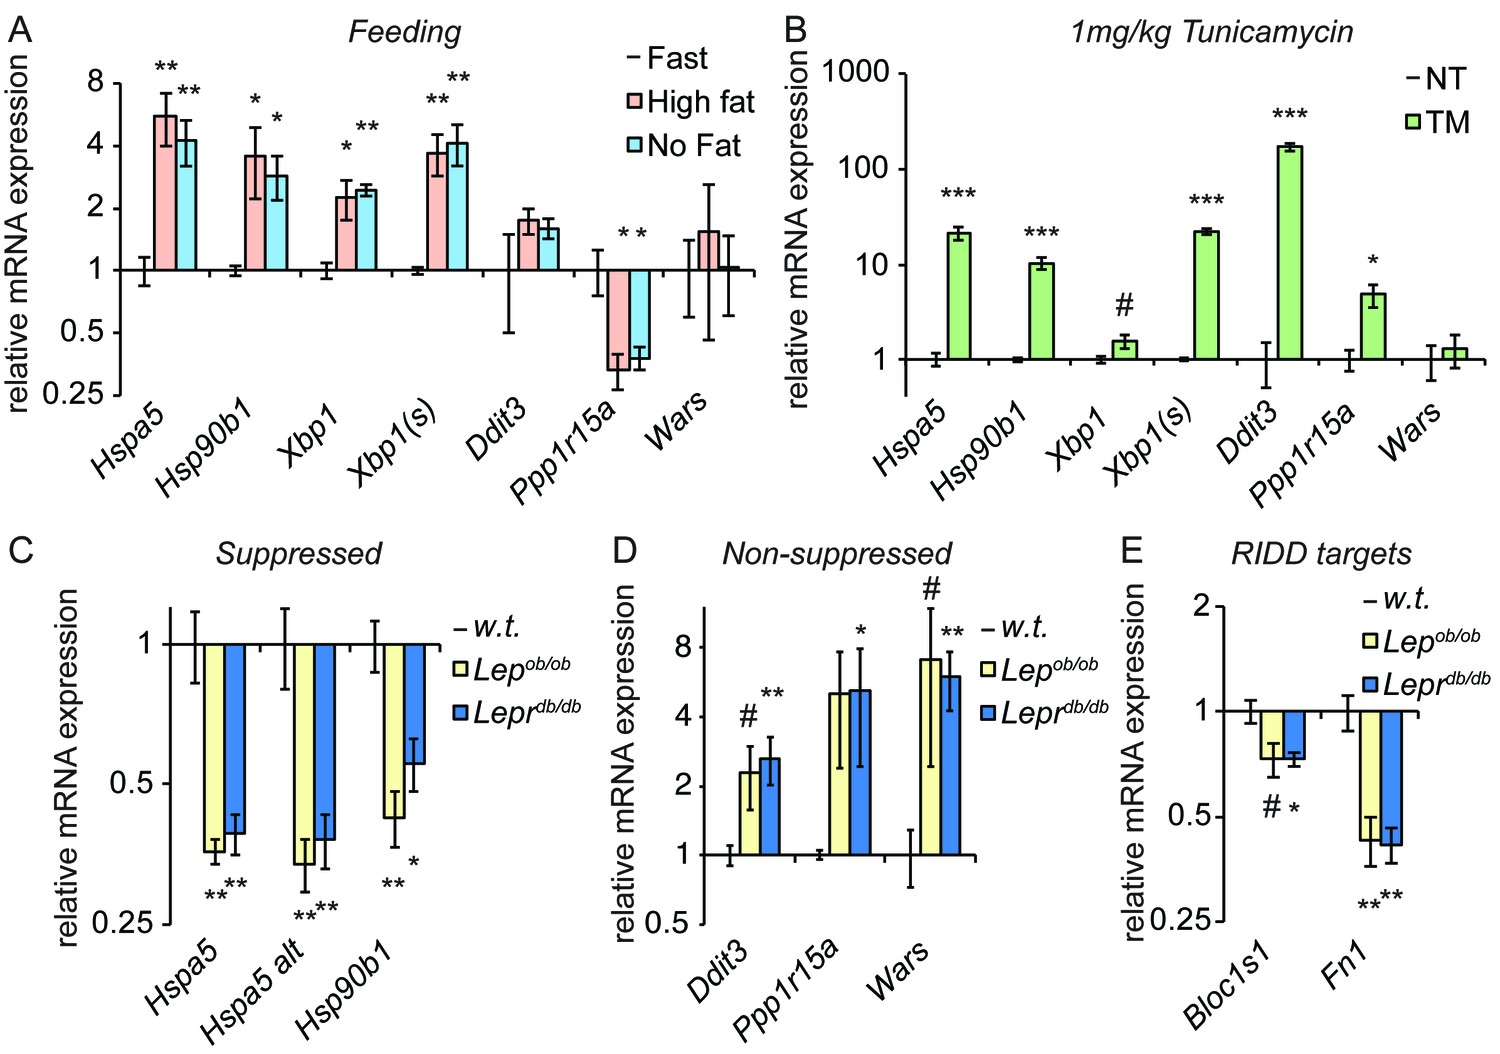
Genetically-induced obesity phenocopies chronic stress.
(A) Wild-type animals were fasted overnight, and then provided food containing either 45% fat or no fat for 4 hr. Expression of the indicated genes was assessed by qRT-PCR. n = 3 animals/group (B) Wild-type animals were treated with 1 mg/kg TM for 4 hr, and the same genes as in (A) were detected by qRT-PCR. #; p<0.1. n = 3 animals/group (C–E) Livers from five month-old female Lepob/ob or Leprdb/db mice or age-matched wild-type mice were probed for expression of genes that were suppressed by chronic stress (C) or not-suppressed (D), or of the RIDD target Bloc1s1 and the putative RIDD target Fn1 (E). n = 4 animals/group.
-
Figure 6—source data 1
Contains raw and transformed Ct values for qRT-PCR experiments in Figure 6A–E.
- https://doi.org/10.7554/eLife.20390.014
Figure 7
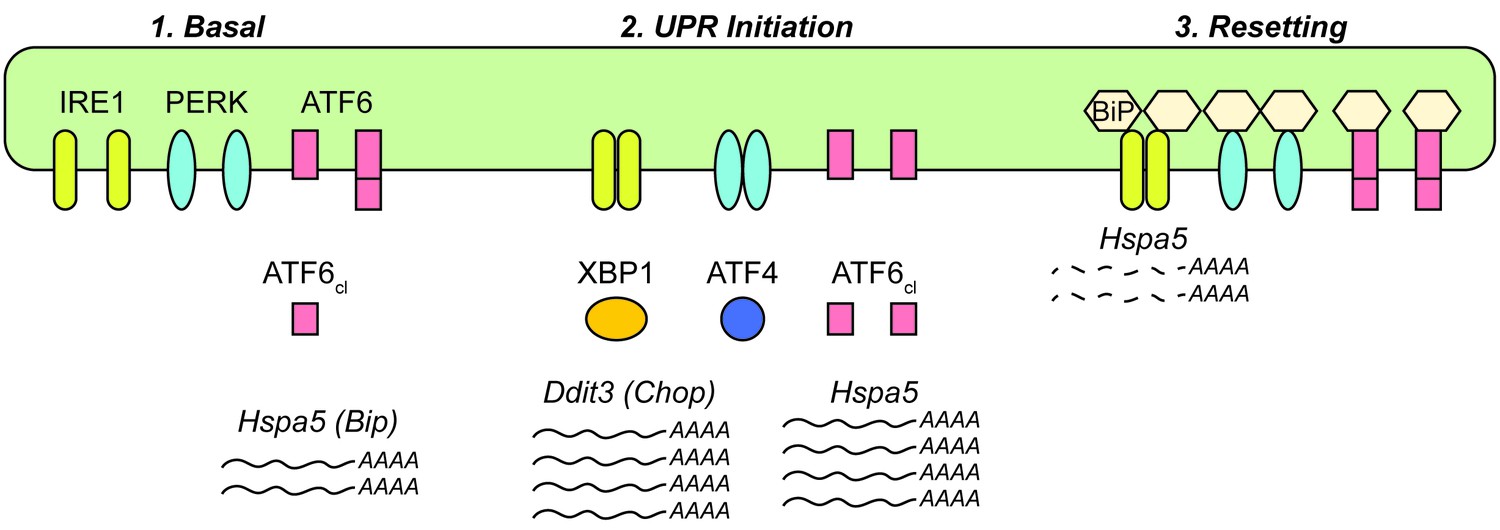
Model for UPR dynamics during chronic stress.
See Discussion for details.
Author response image 1
Download links
A two-part list of links to download the article, or parts of the article, in various formats.
Downloads (link to download the article as PDF)
Open citations (links to open the citations from this article in various online reference manager services)
Cite this article (links to download the citations from this article in formats compatible with various reference manager tools)
Experimental reconstitution of chronic ER stress in the liver reveals feedback suppression of BiP mRNA expression
eLife 5:e20390.
https://doi.org/10.7554/eLife.20390


