Neurodegenerative disease mutations in TREM2 reveal a functional surface and distinct loss-of-function mechanisms
- Washington University School of Medicine, United States
Figures
Figure 1 with 2 supplements
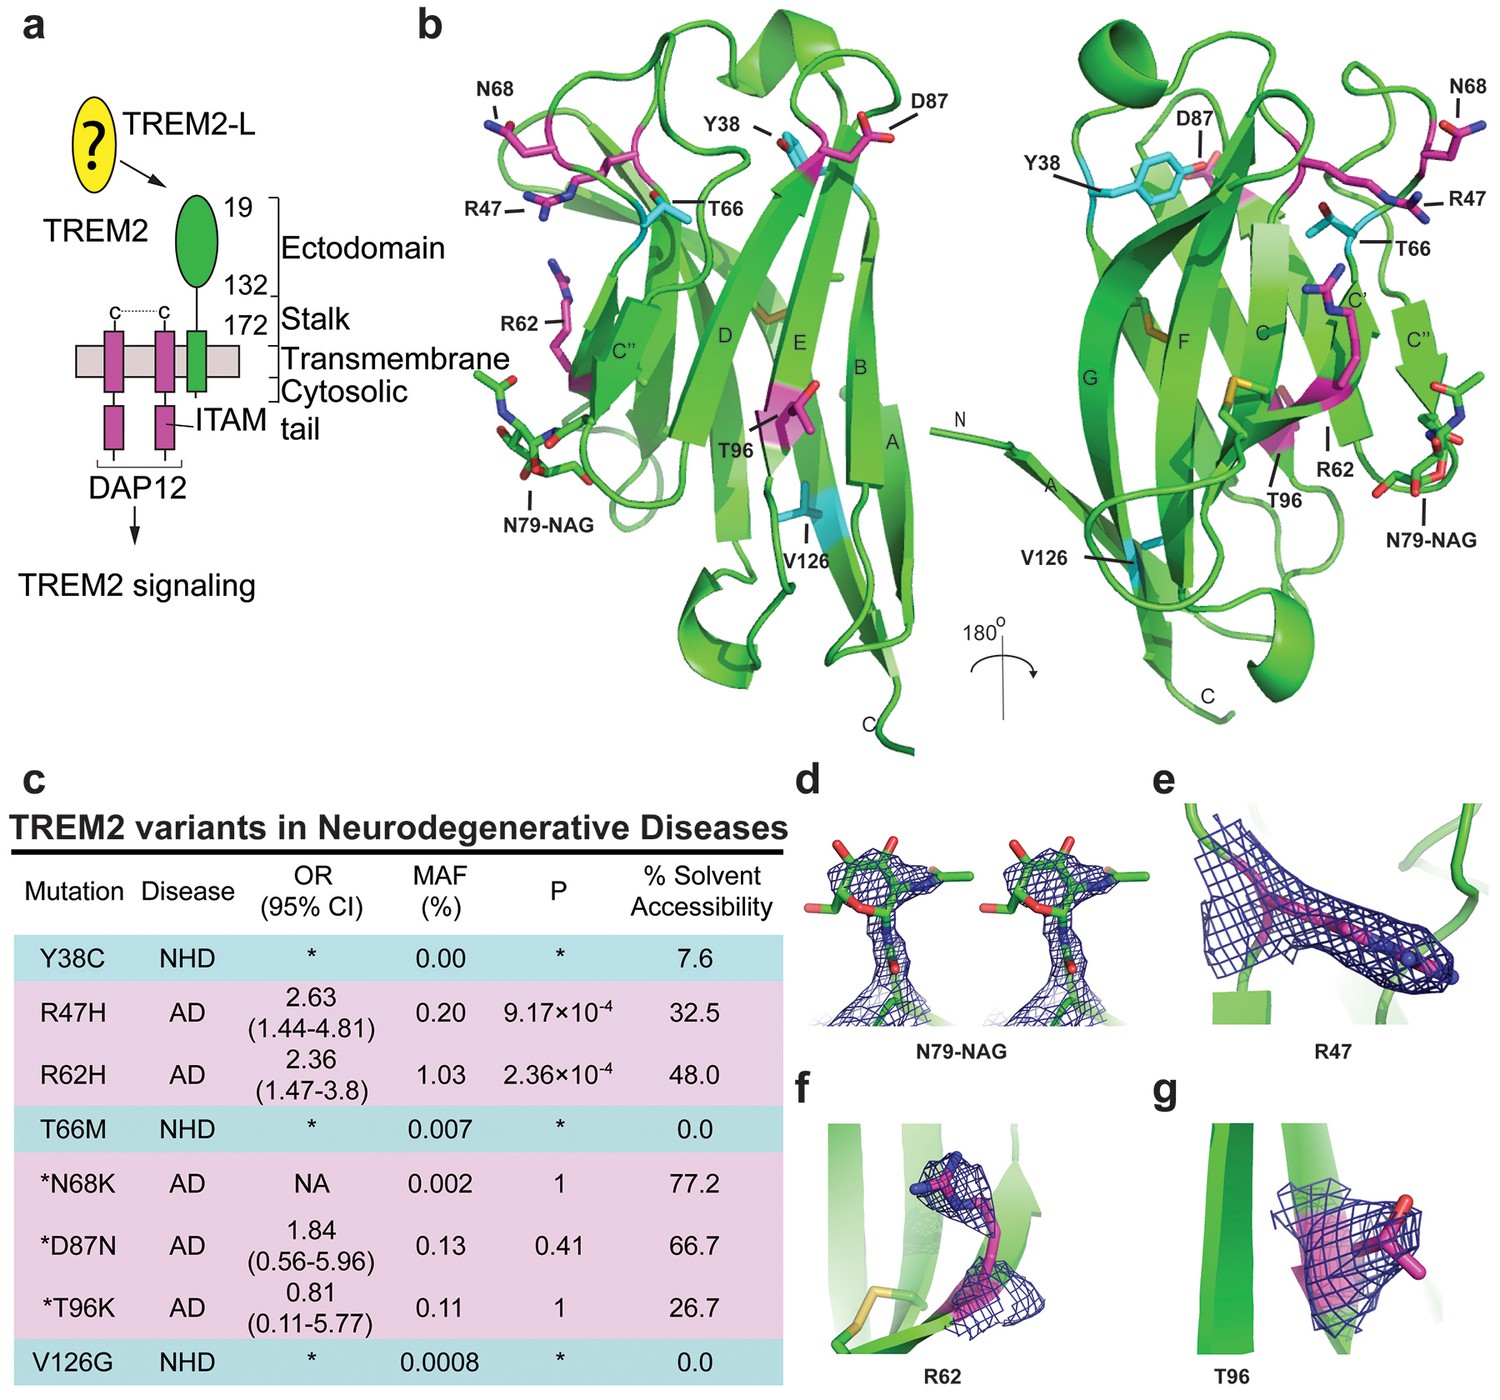
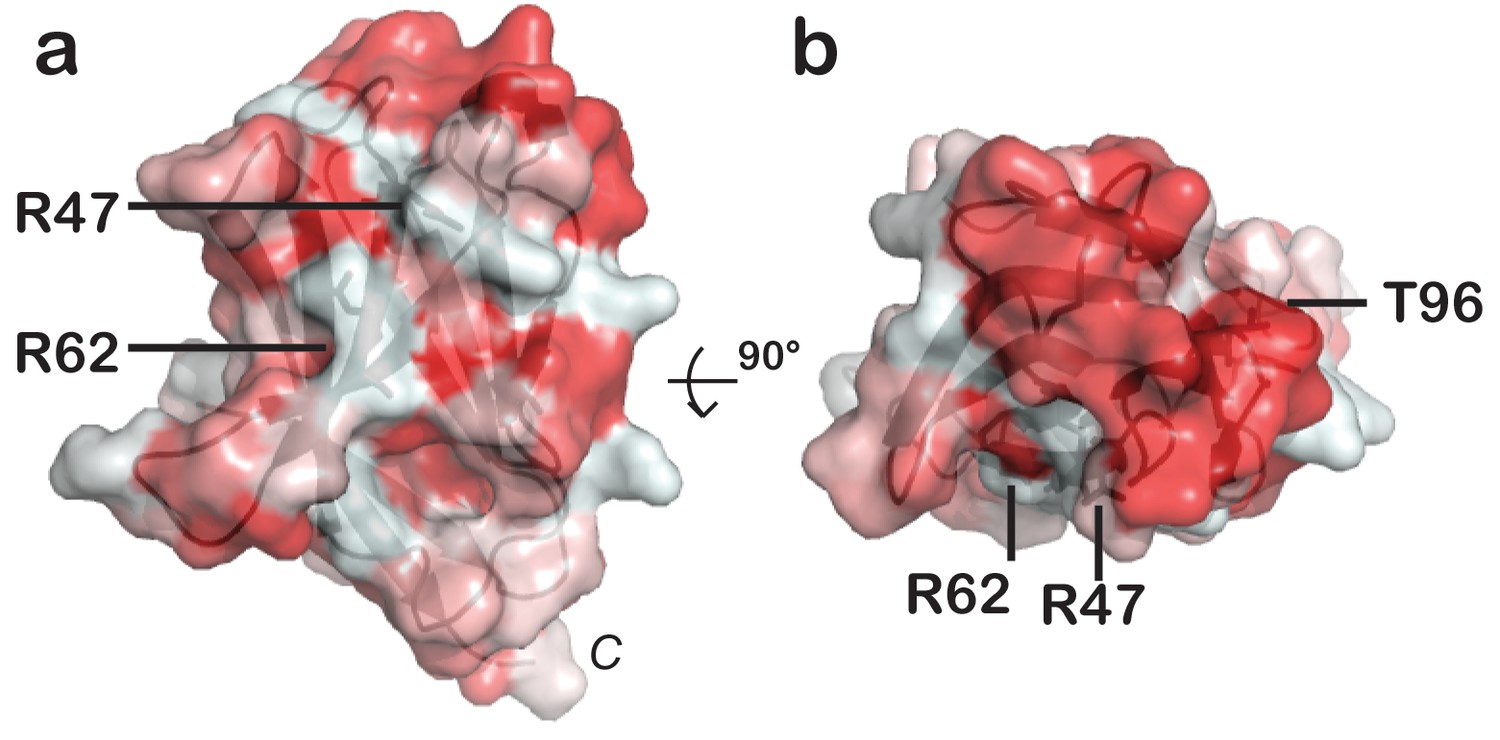
Crystal structure of the human TREM2 ectodomain.
(a) Schematic of TREM2 cell-surface association with adapter protein DAP12, which contains an Immuno Tyrosine Activation Motif (ITAM). Engagement of TREM2-L by the ectodomain of TREM2 induces signaling. Domain boundaries are indicated. (b) TREM2 ectodomain in two orientations with disease-linked residues shown as sticks. The positions of AD risk variants are shown in magenta, whereas Nasu-Hakola disease (NHD) mutations are shown in cyan. The N-acetylglucosamine (NAG) is shown as green sticks. (c) Table of TREM2 disease-linked mutations, associated disease, and calculated solvent accessible surface exposure for the side-chain (calculated using Naccess), along with statistical correlations to AD (OR = odds ratio; MAF = mean allele frequency) (from Jin et al., 2014). Table is highlighted with same color scheme as Figure 1b. Validated AD risk variants (R47H and R62H) are not marked. Potential AD risk variants are denoted with an asterisk. (d) Side-by-side stereo view of difference electron density (2mFo-DFc contoured at 2σ) for the N79-NAG. (e–g) Difference electron density (2mFo-DFc contoured at 2σ) for the surface-exposed AD-associated mutation positions (e) R47, (f) R62 and (g) T96.
Figure 1—figure supplement 1
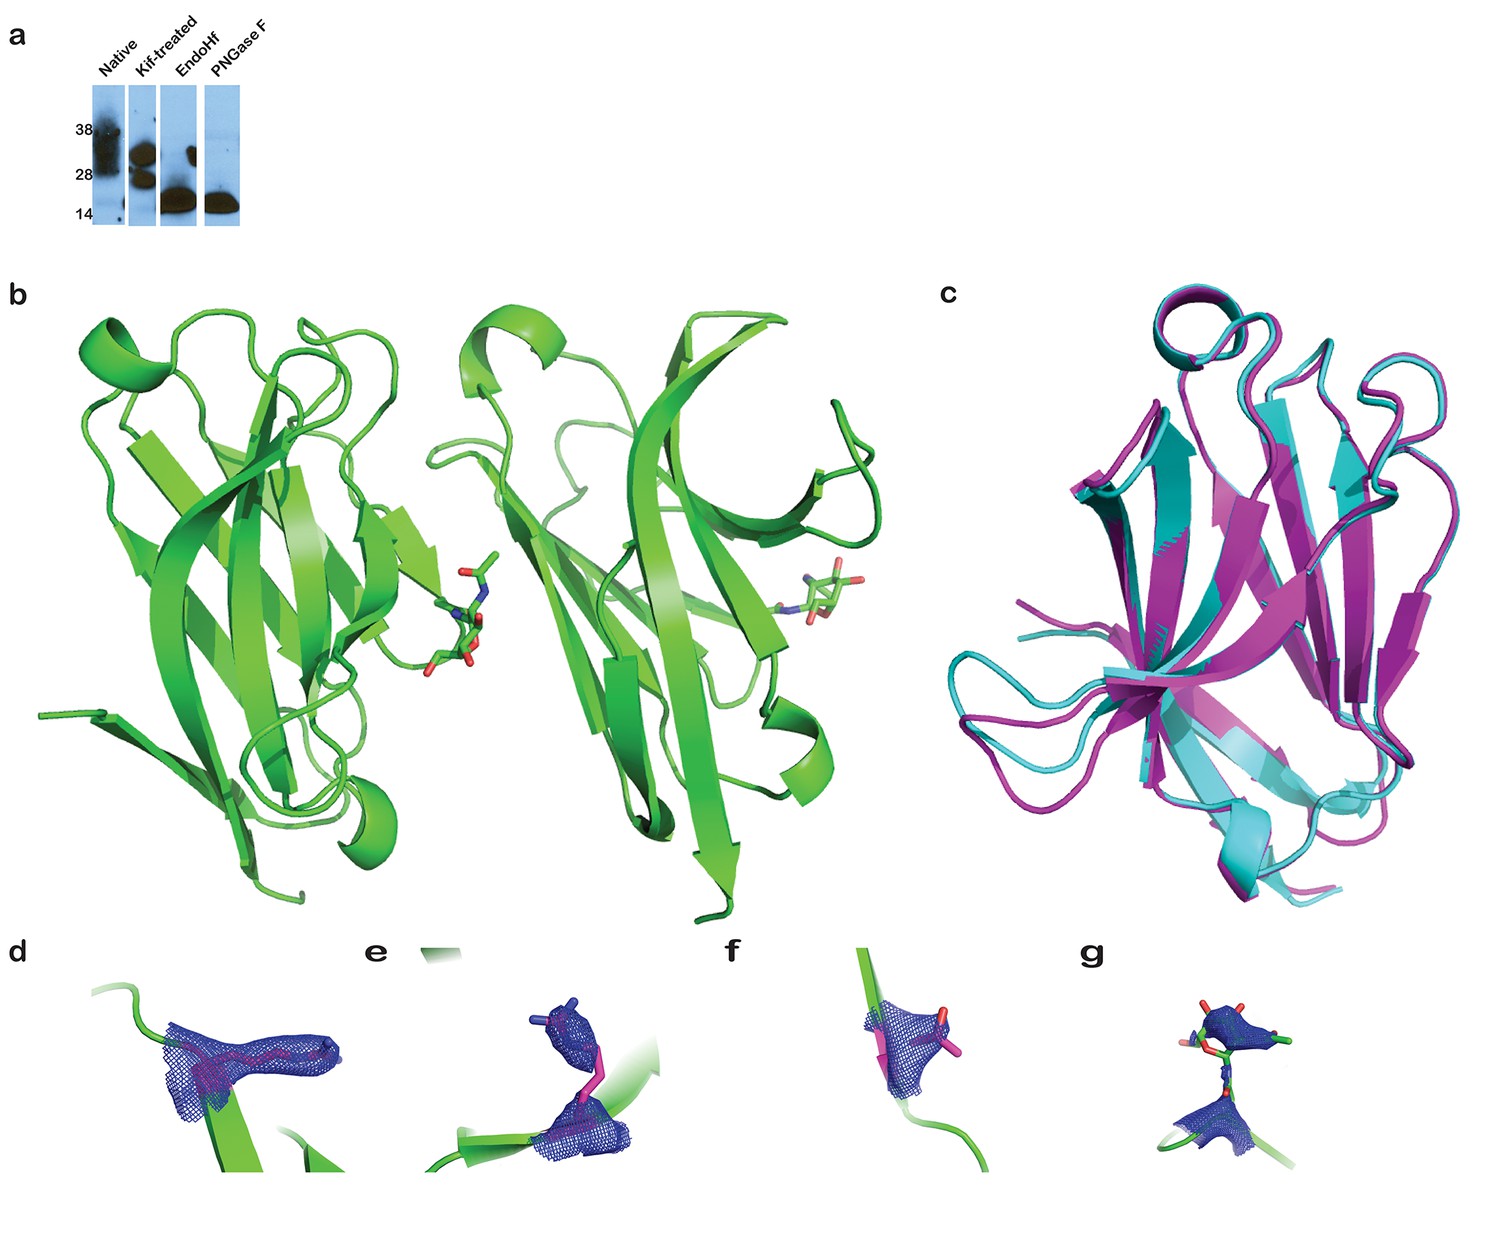
Analysis of TREM2 glycosylation, comparison of TREM2 monomers in the crystal structure, and SA-omit maps of AD-linked residues.
(a) Immunoblot (anti-6His) analysis of secreted WT hTREM2 ectodomains. From left to right: natively glycosylated and secreted hTREM2 ectodomain, hTREM2 ectodomain secreted from kifunensine-treated cells, EndoHf-digested ectodomains from kifunensine-treated cells (which have a single N-acetylglucosamine residue at the two N-linked sites), and PNGaseF-digested TREM2 ectodomain from kifunensine-treated cells (from which the entire glycan has been removed). (b) The hTREM2 asymmetric unit (ASU) contains two monomers of the TREM2 ectodomain. Note that the NAG (shown in sticks) participates in the interface, suggesting that the full-length glycan would disrupt this interaction observed in the crystal. (c) Chain A and B superimposed (Cα RMSD < 1 Å). Chain A is magenta and Chain B is cyan. The only notable difference between the two monomers is the loop in chain B, which makes lattice contacts with symmetry-related B-H103 and is slightly shifted compared to chain A, which does not make lattice contacts. (d–g) Simulated annealing composite omit maps (2mFo-DFc) contoured at 2σ around residues (d) R47, (e) R62, (f) T96, and (g) N79-NAG.
Figure 1—figure supplement 2
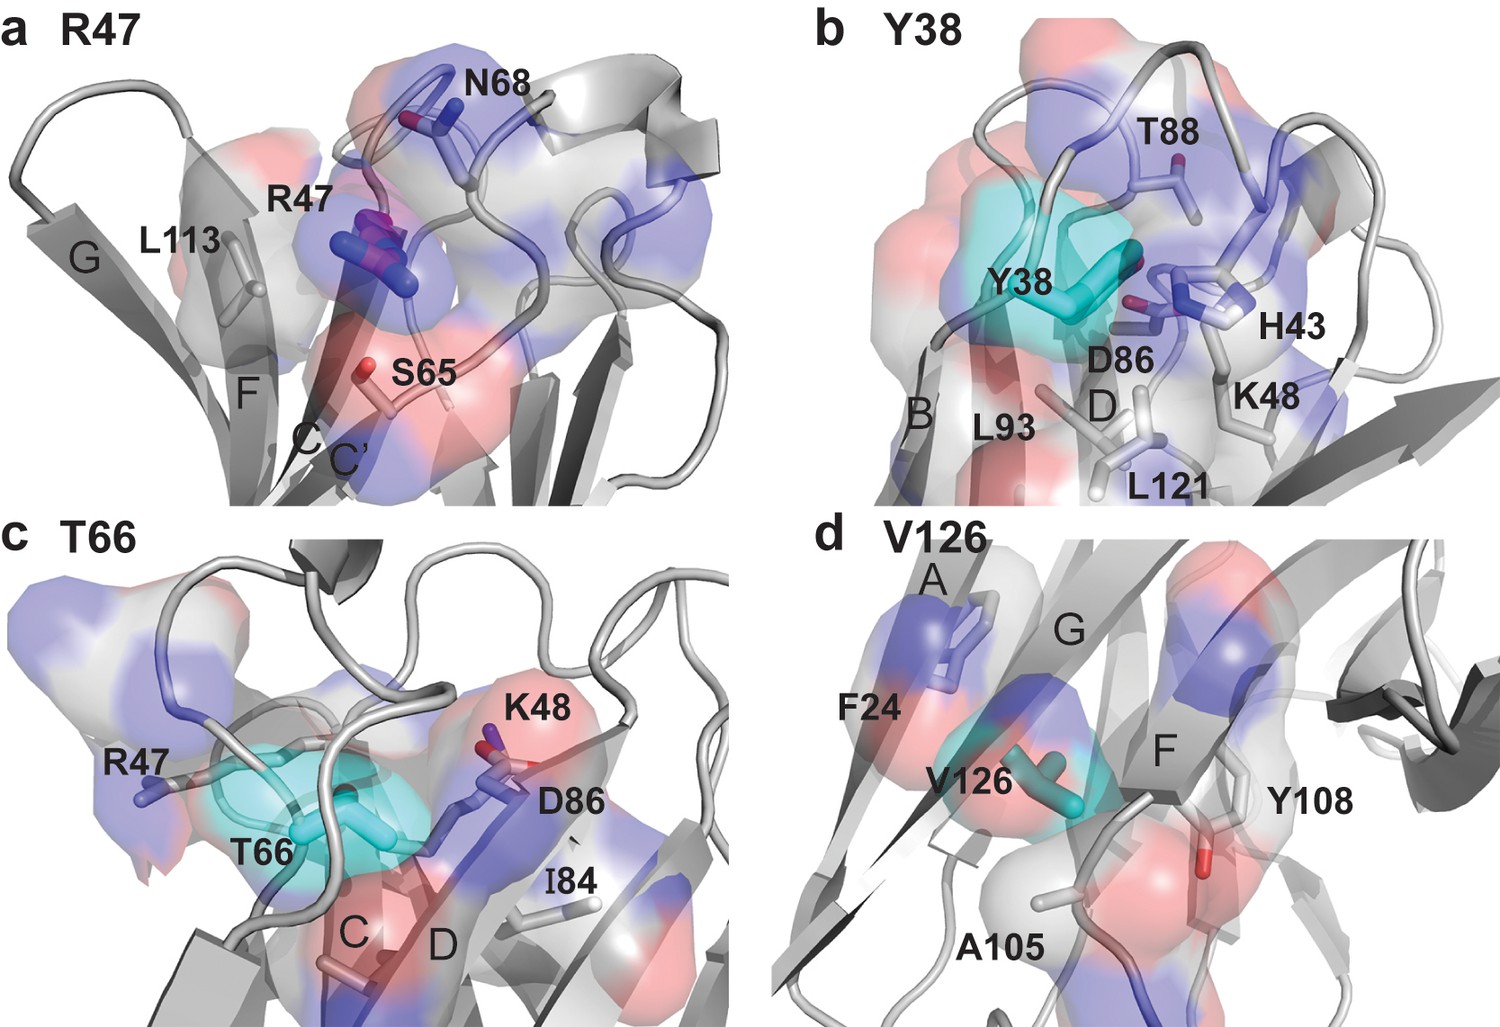
Packing neighbors for the TREM2 AD risk variant R47 and the TREM2 NHD mutants Y38, T66, and V126.
(a) Packing environment for surface residue R47 (magenta carbon sticks and surface). The gray carbon surface shows all residues that contact R47. Residues whose side chains make Van-der Waals contacts with the R47 side chain are shown as sticks and are labeled. (b) Packing environment for the buried residue Y38 (cyan carbon sticks and surface). The gray carbon surface shows all residues that contact Y38. Residues whose side chains make Van der Waals contacts with the Y38 side chain are shown as sticks and are labeled. (c) Packing environment for the buried residue T66 (cyan carbon sticks and surface). The gray carbon surface shows all residues that contact T66. Residues whose side chains make Van-der Waals contacts with the T66 side chain are shown as sticks and are labeled. (d) Packing environment for buried residue V126 (cyan carbon sticks and surface). The gray carbon surface shows all residues that contact V126. Residues whose side chains make Van der Waals contacts with the V126 side chain are shown as sticks and are labeled.
Figure 2 with 2 supplements
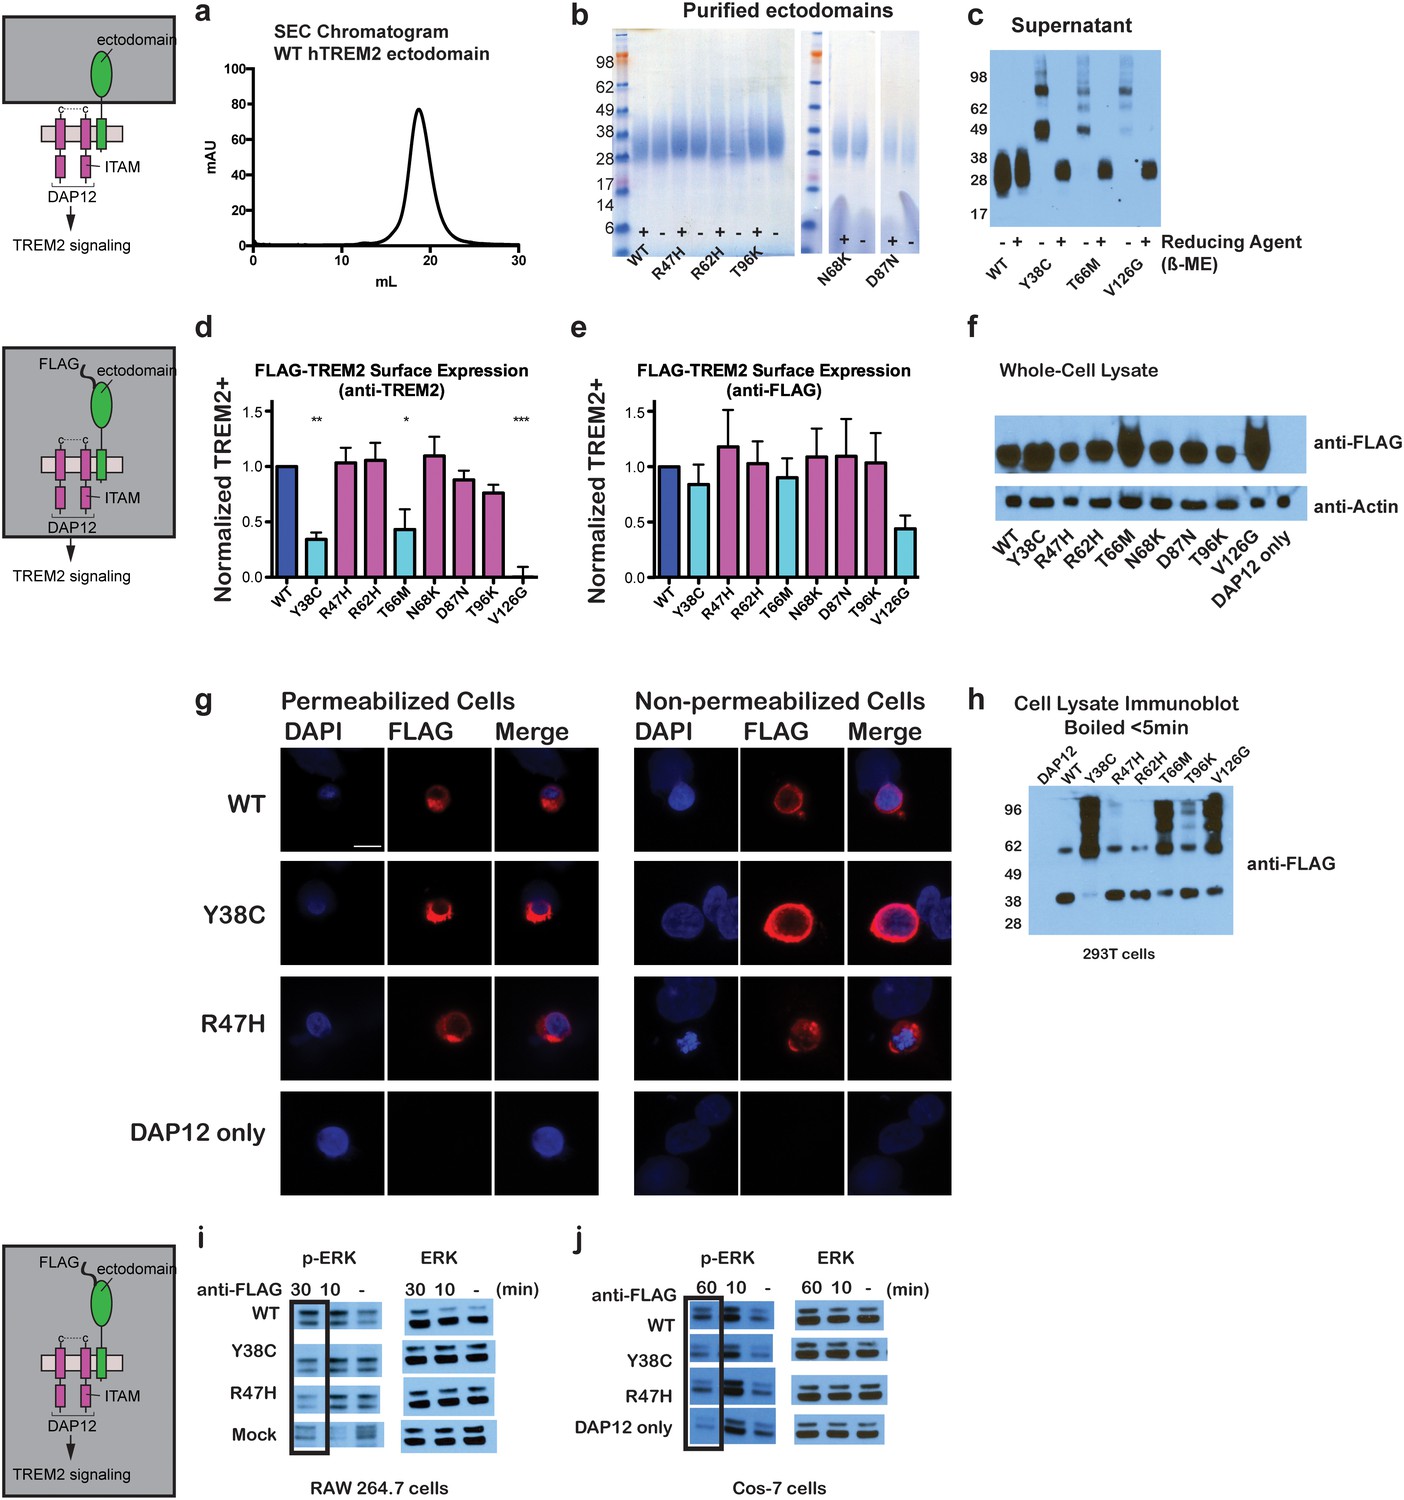
Chromatographic and surface expression analysis of WT and variant TREM2.
The schematic depicts the domain of TREM2 used in the experiments shown in (a–c). (a) Gel filtration chromatography profile (Superdex 200 10/300 GL) of purified WT human TREM2 ectodomain showing a single monomeric peak. (b) SDS-PAGE analysis of purified TREM2 AD risk variants prepared with (+) and without (-) reducing agent (β-mercaptoethanol). (c) Western blot analysis of TREM2 NHD mutants secreted from transfected 293F cells prepared with (+) and without (-) reducing agent (β-mercaptoethanol). The NHD mutants Y38C, T66M, and V126G all migrate as higher MW oligomers under non-reduced conditions, indicating that they are misfolded and linked by aberrant intermolecular disulfide bonds. Purified WT TREM2 is shown for comparison. Representative of more than three independent expressions. The second schematic depicts FLAG TREM2 used in the experiments shown in (d–h). (d–e) Surface expression of WT and variant TREM2 in 293F cells assayed by flow cytometry. Full-length FLAG-WT or mutant TREM2 were co-transfected with mDAP12 into 293F cells. Surface expression was measured by either (d) a polyclonal serum or (e) an anti-FLAG antibody. Normalized TREM2 indicates the normalized fraction of cells staining positive over DAP12-only background. Data are from four (d) or five (e) independent experiments. Bars are color-coded in the same way as the residues in Figure 1b (cyan = NHD mutant; magenta = AD risk variant). Error bars are SEM. Significance was determined by ANOVA with Bonferroni post-test correction. (*p<0.05, **p<0.01, and ***p<0.001). (f) Western blot analysis of whole-cell lysates of 293F cells used in (d) and (e) showing expression levels of WT, NHD mutant (Y38C, T66M and V126G), and AD risk variant (R47H, R62H, N68K, D87N and T96K) TREM2. Note that the NHD mutants are more highly expressed than the AD risk variants. (g) Confocal microscopy of 293F cells co-transfected with DAP12 and FLAG-TREM2. Cells were fixed and either permeabilized (left) or non-permeabilized (right) and stained with anti-FLAG antibody (red). (h) FLAG-TREM2 full-length constructs were co-transfected with DAP12 into 293T cells and expression analyzed by anti-FLAG immunoblot. Samples were prepared by suspending cells in reducing SDS loading buffer and boiling for no more than 5 min. We observe SDS-resistant aggregate bands for the NHD variants, which were largely absent in WT and AD risk variants. The T96K variant shows some light aggregation, consistent with the slight shift (~5°C) in denaturation temperature for that variant (Figure 3). Schematic depicts FLAG TREM2 signaling assay employed in the experiments shown in (i–j). (i) TREM2 signaling analyzed by phosphor-ERK1/2 and ERK1/2 immunoblot in RAW264.7 macrophage cells transfected with WT or variant FLAG-TREM2. (RAW264.7 cells express endogenous DAP12.) 24 hr post-transfection, cells were stimulated with anti-FLAG antibody (1:100) for the indicated length of time. ERK/pERK content was assessed by immunoblot. In these cells, we observe pERK at 10 min post-stimulation. However, only WT sustained signaling 30 min post-stimulation. (j) TREM2 signaling analyzed in Cos-7 cells as in (c). Cos-7 cells were co-transfected with DAP12 and TREM2. In these cells, there is a non-specific antibody response at 10 min. However, as in the RAW264.7 cells, we observe sustained WT signaling at the later time point which is diminished in R47H and Y38C variants.
Figure 2—figure supplement 1
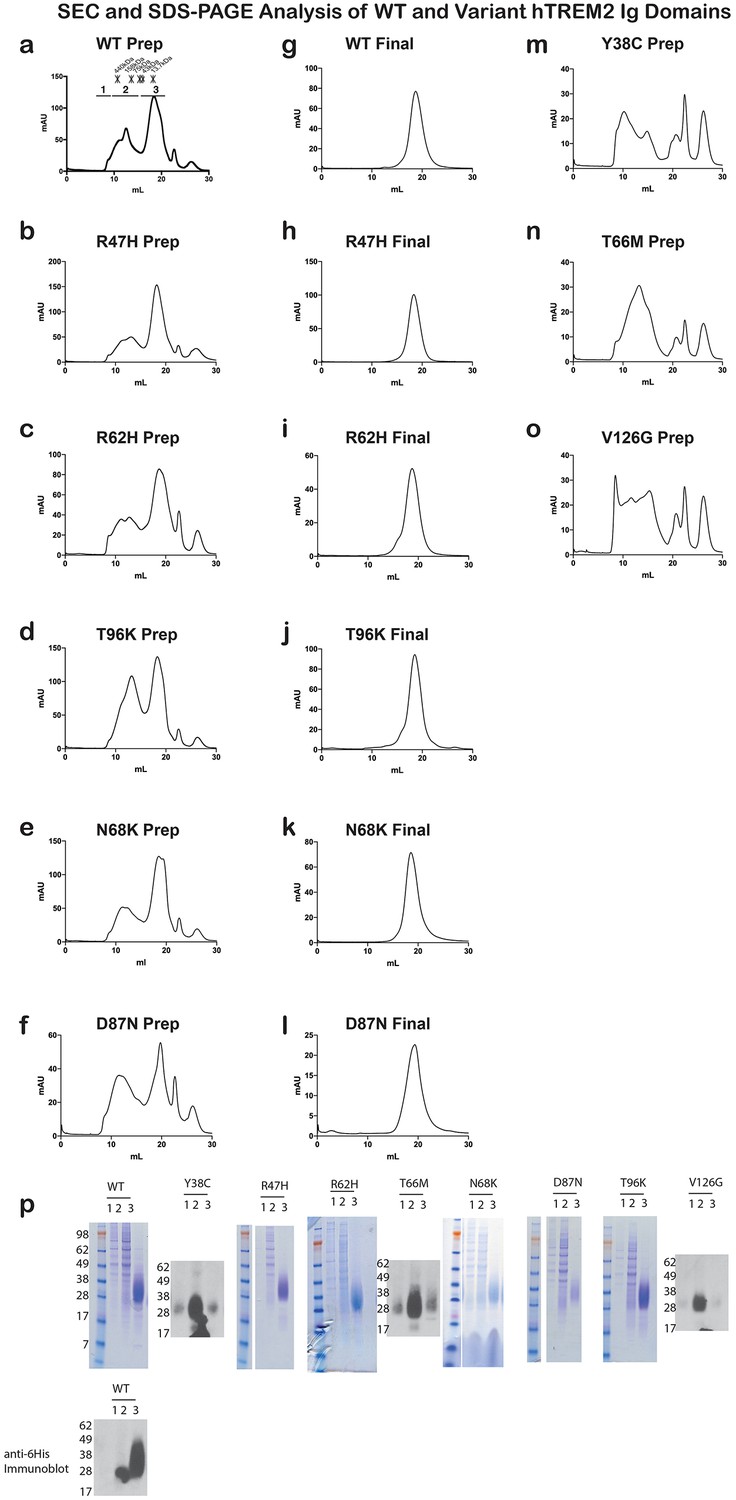
Analysis of WT and variant TREM2 ectodomains by size exclusion chromatography.
(a-f) Preparative SEC chromatograms of WT and validated (R47H and R62H) and possible (N68K, D87N and T96K) AD risk variant hTREM2 ectodomains harvested from 293F suspension cells. Fractions were pooled as shown in (a) for SDS-PAGE analysis (r). Fraction volumes corresponding to 1) aggregate;, 2) oligomer, and 3) monomer TREM2 are indicated. Asterisks (*) in (a) indicate elution volumes of MW standards. Fraction 3 contains purified hTREM2 ectodomains that elute as a monomer. This fraction was concentrated and re-run. (g–l) Analytical SEC chromatograms of purified WT and validated and possible AD risk variant hTREM2 ectodomains showing that they elute as monomers without detectable aggregation. (m–o) Preparative SEC chromatograms of hTREM2 NHD mutant ectodomains harvested from 293F suspension cells. These mutants do not yield folded TREM2 protein and largely elute as aggregates and oligomers. (p) SDS-PAGE analysis of WT and validated and possible AD risk variant TREM2 ectodomain preparative traces. Fractions 1, 2, and 3 are indicated as denoted in (a). TREM2 NHD mutant ectodomains were analyzed by anti-6His western blots because they have minimal yields of purified protein that are not readily detectable by SDS-PAGE staining. The AD risk variants elute similarly to WT, while NHD mutants elute as aggregates/oligomers.
Figure 2—figure supplement 2
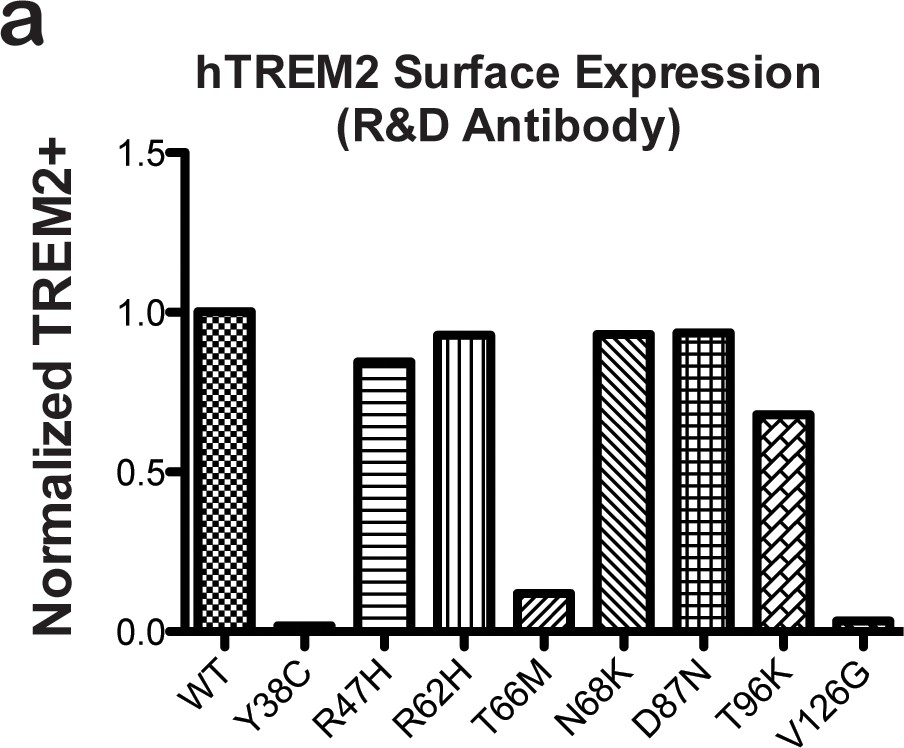
hTREM2 surface expression probed using a commercial antibody.
(a) hTREM2 surface expression was probed by flow cytometry using a commercial anti-TREM2 antibody (R&D). The results are comparable to results obtained using our anti-TREM2 polysera (see Figure 2d). In this experiment, anti-FLAG staining was observed for all variants as in Figure 2e (not shown).
Figure 3 with 1 supplement
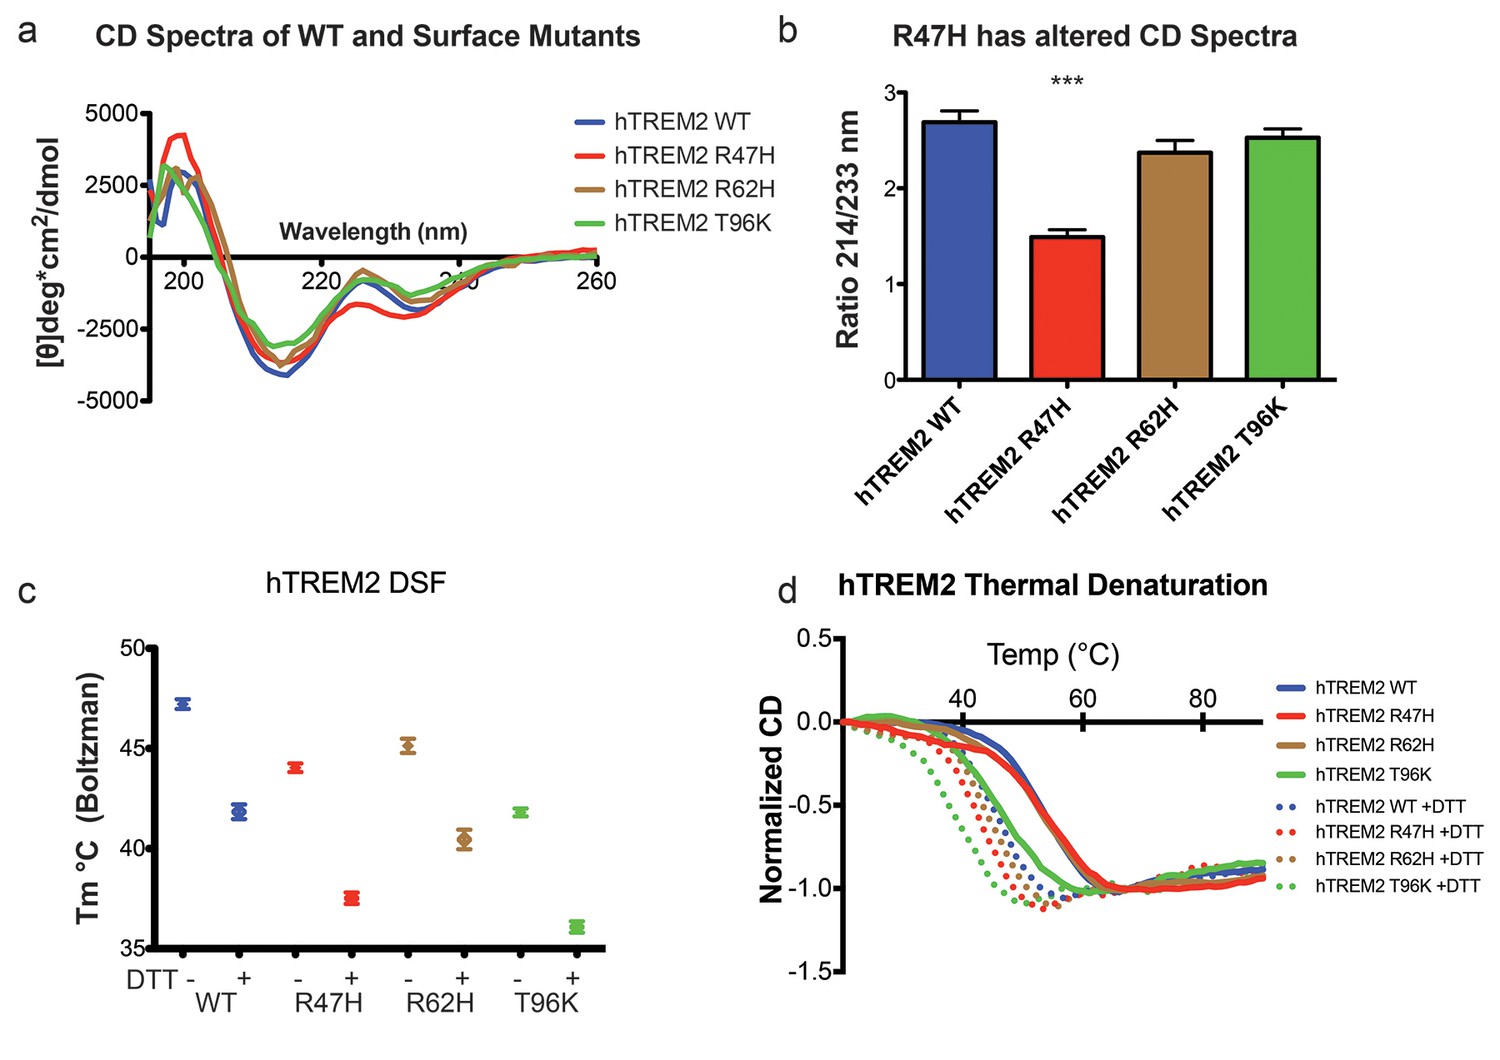
Structure and stability analysis by CD and DSF of human WT and AD-linked surface variant TREM2 ectodomains.
(a) CD spectra of human WT TREM2 (blue) and R47H (red), R62H (brown), and T96K (green) variants. (b) Ratio of CD minima at 214 nm and 233 nm reveals that R47H has an altered CD spectrum. Minima ratios were measured on five (WT and R47H) or three (R62H and T96K) independent protein preparations, respectively. (c) Thermal melt temperatures measured by DSF. (d) WT and variant TREM2 thermal denaturation measured by CD at 225 nm while increasing the temperature from 20°C to 90°C with or without 1 mM DTT.
Figure 3—figure supplement 1
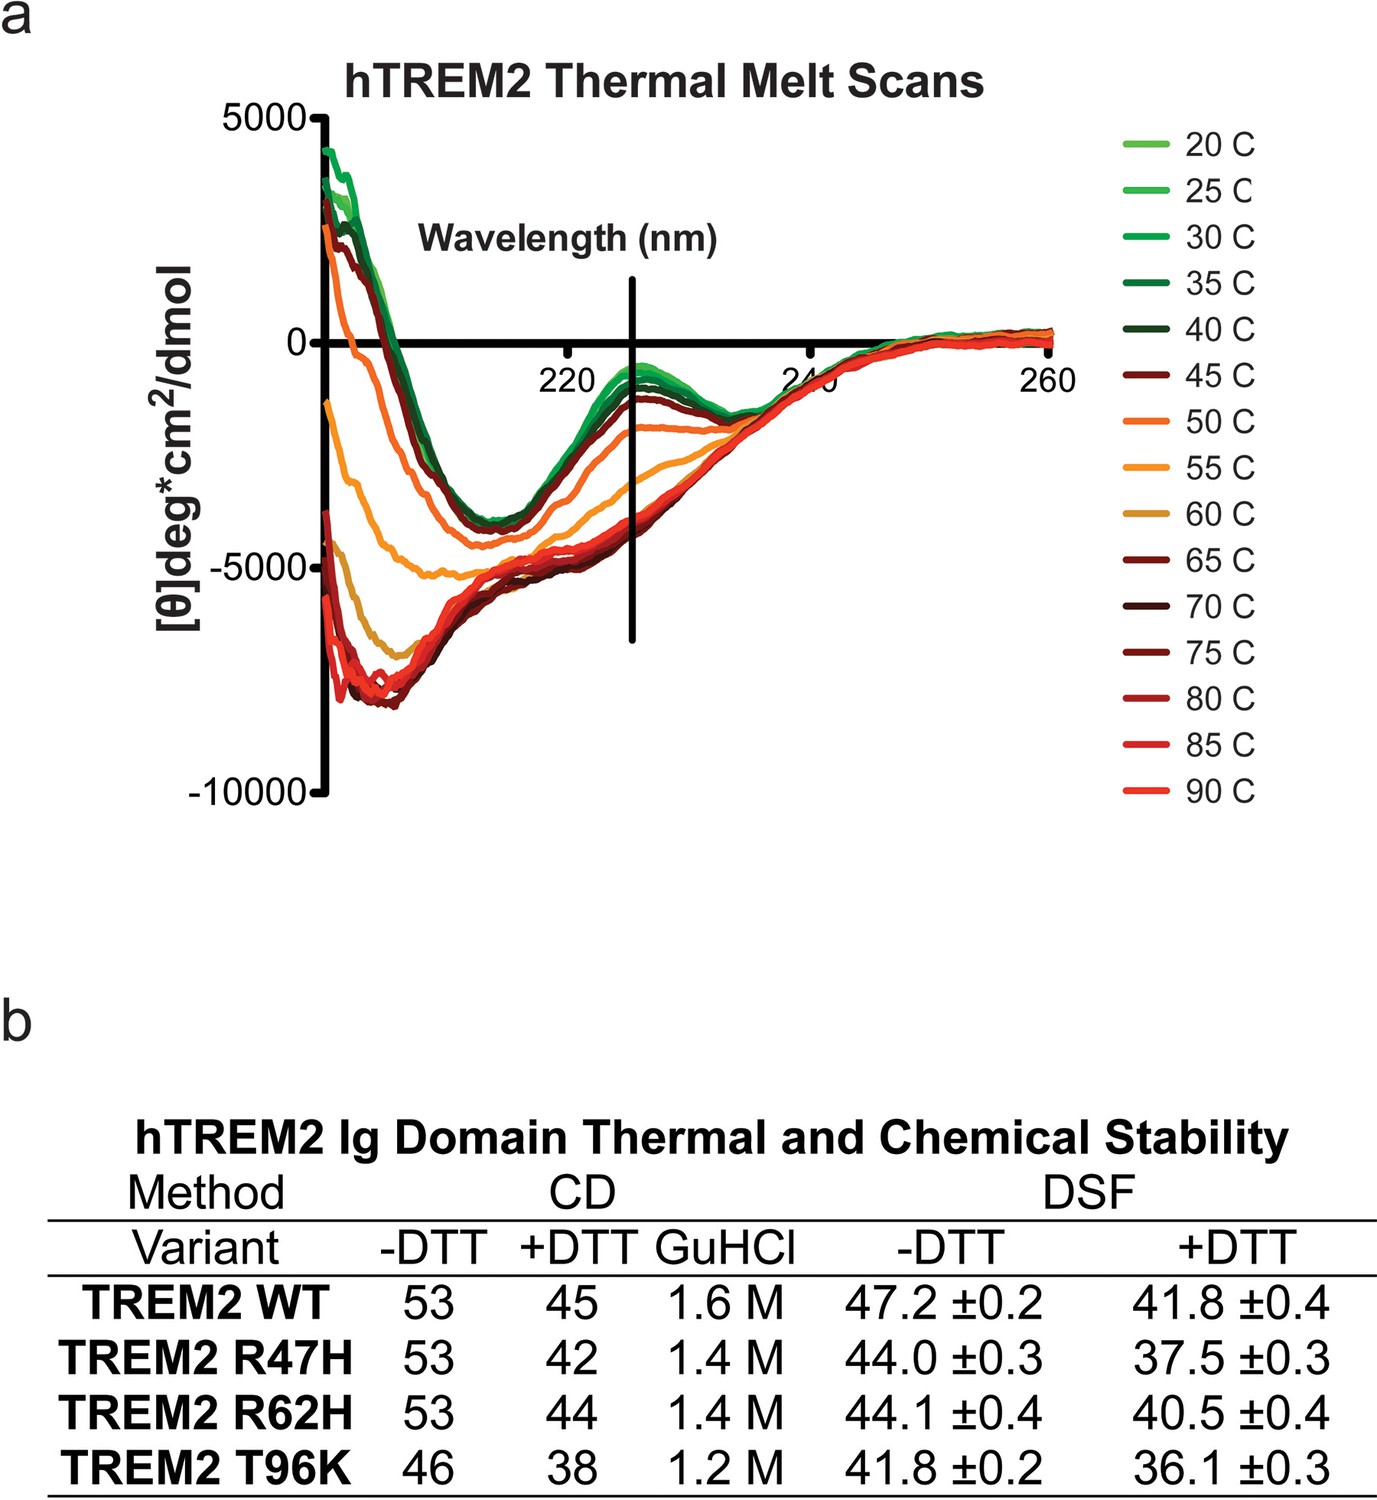
Structure and stability analysis by CD and DSF of human WT and AD-linked surface variant TREM2 ectodomains.
(a) WT TREM2 melt curves measured in 5°C intervals. TREM2 shows a denaturation transition at 225 nm (black line). (b) Table of denaturation temperatures measured by CD or DSF and chemical denaturation concentrations of guanidine hydrochloride (GuHCl) measured by CD. CD denaturation experiments were performed on at least three independent protein preparations. DSF experiments were done in triplicate on at least two independent protein preparations. All error bars are SEM. Significance was determined by ANOVA with Bonferroni post-test correction. (***p<0.001).
Figure 4 with 2 supplements
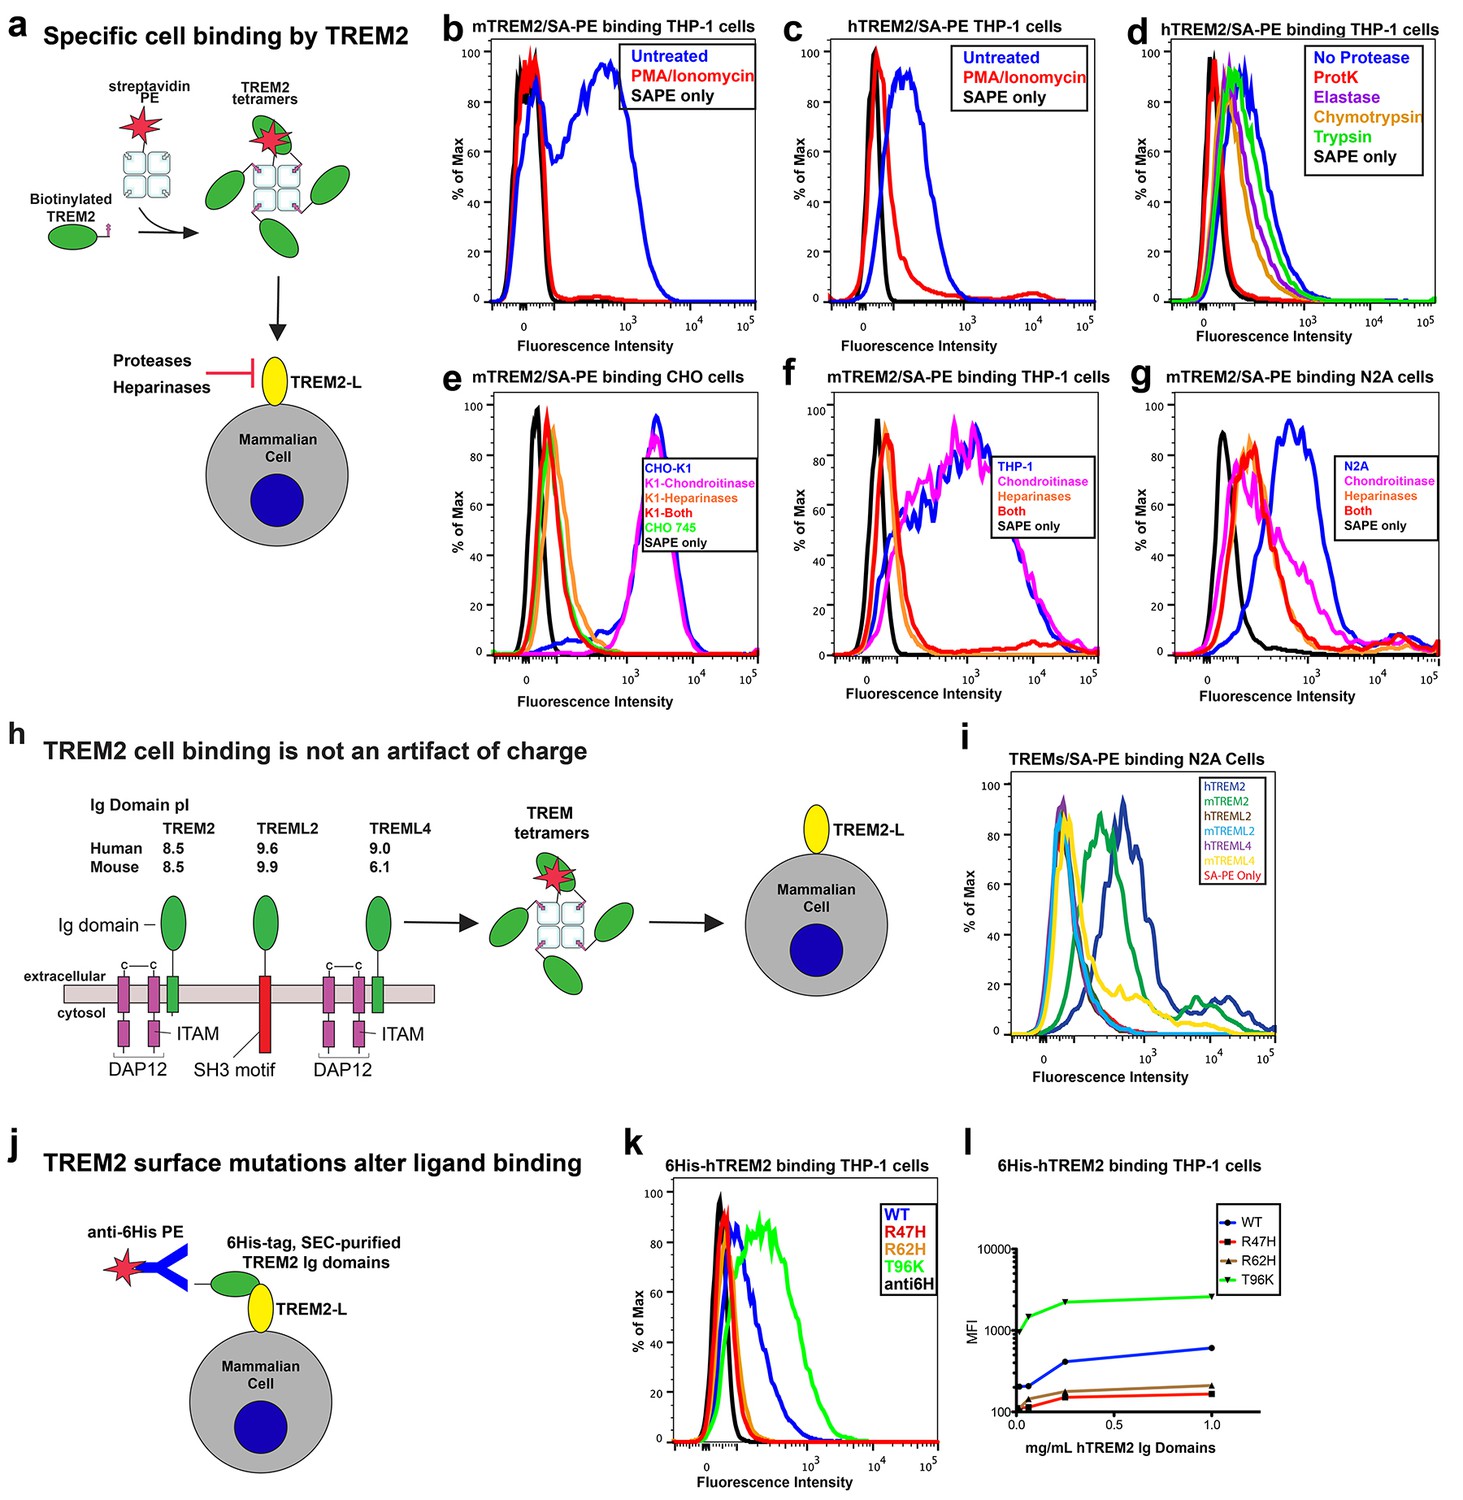
AD risk variants in TREM2 alter binding to cell surface TREM2-L.
(a) Schematic outlining the flow cytometry experiments in (b–g). TREM2 ectodomains were specifically biotinylated at the C-terminus and probed for binding to TREM2-L on the surface cells, which was reduced by pre-treating cells with proteinases or heparinases. (b–c) Flow cytometry analysis of either (b) mTREM2/SA-PE tetramer or (c) hTREM2/SA-PE tetramer staining of THP-1 cells ± PMA/ionomycin treatment. (d) Flow cytometry analysis of hTREM2/SA-PE tetramer staining of THP-1 cells pretreated by various proteases. (e) mTREM2 staining of CHO-745 (GAGless) and CHO-K1 cells. CHO-K1 cells were treated with a cocktail of heparinases, chondroitinase ABC, or both. (f–g) mTREM2 staining of (f) THP-1 and (g) N2A cells treated with heparinases, chondroitinases, or both. (h) Schematic outline of control cell-binding experiments with the TREM-like proteins TREML2 and TREML4. On the left is a schematic of receptor versions of TREM2, TREML2, and TREML4, along with calculated pI values for the respective ectodomains. (i) Tetramer staining of TREM family ectodomains to N2A cells. (j) Schematic outlining monomeric TREM2-6His cell-staining experiments. Cells were stained with monomeric TREM2-6H and detected using PE-labeled anti-6H antibody. (k) Representative plot of THP-1 staining by hTREM2-6H analyzed by flow cytometry. (l) MFI of anti-6His staining of SEC-purified hTREM2 WT and variant ectodomains pre-incubated with THP-1 cells at the indicated concentrations. All data are representative of at least two independent experiments.
Figure 4—figure supplement 1
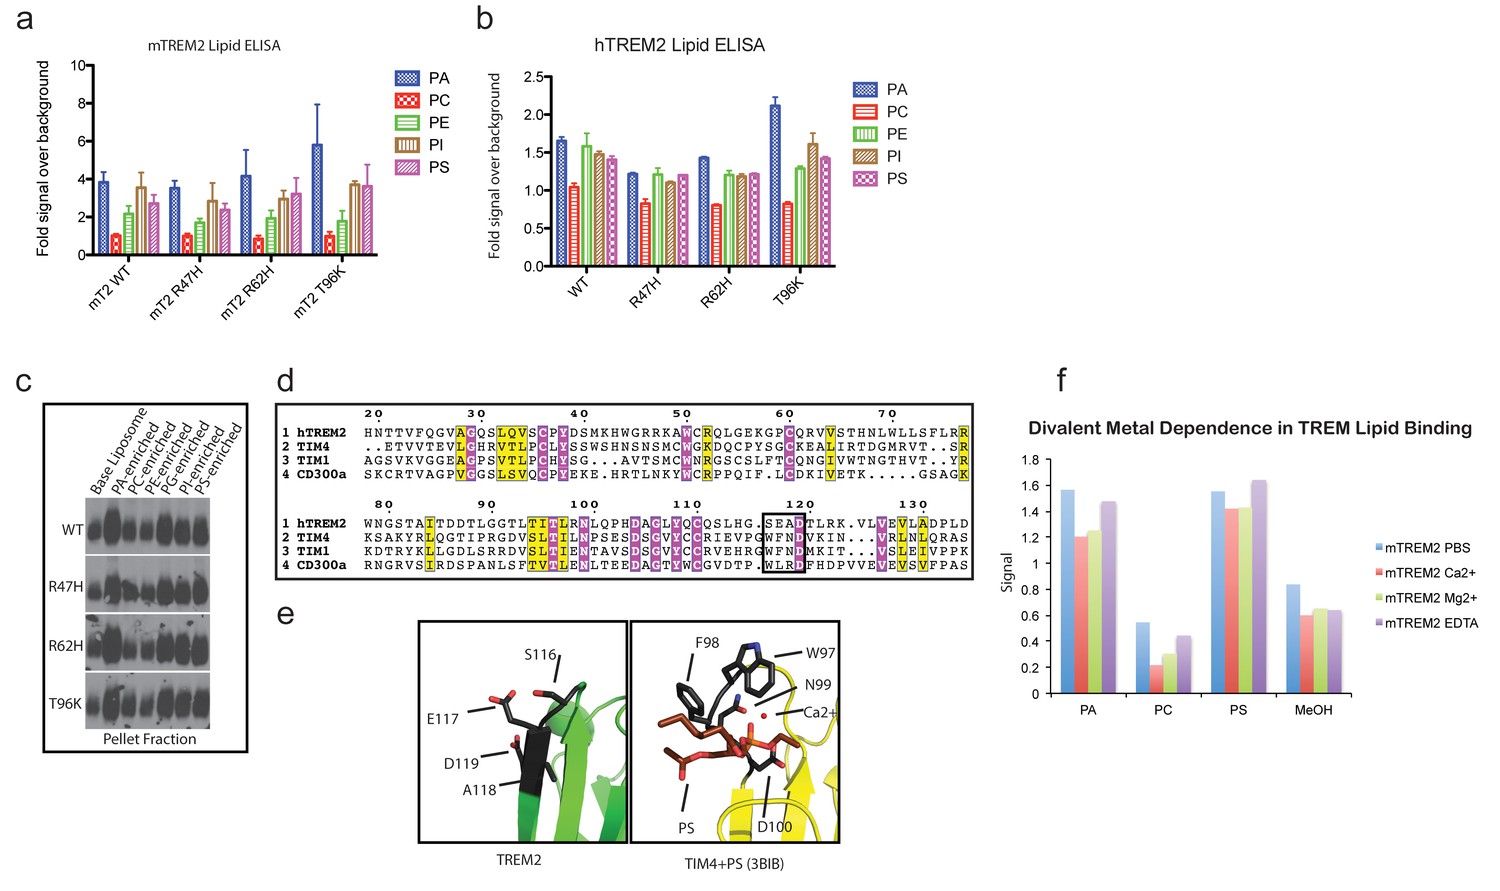
TREM2 lipid binding as assessed by phospholipid ELISA and liposome sedimentation.
(a) Mouse TREM2 phospholipid binding measured by streptavidin-HRP detection of biotinylated mTREM2 ectodomain binding to plated phospholipids. Mean and SEM of three independent experiments done in triplicate. Each value was calculated by normalizing the lipid signal to the MeOH-only background for each protein. (b) Human TREM2 ectodomain phospholipid-binding ELISA. Mean and SEM are one of two representative experiments done in triplicate. (c) Immunoblot analysis of liposome pellets shows equivalent binding by disease-variants and preferential binding of anionic phospholipids. Representative of three independent experiments. (d) Alignment of the ectodomains of hTREM2, T-cell immunoglobulin and mucin domain-containing protein 4 (TIM4, UniProt Q96H15), TIM1 (UniProt Q96D42) and CD300a (UniProt Q9UGN4). Conserved and invariant residues labeled as in Figure 5. The black box denotes the ‘WFND’ motif required for phospholipid binding by TIM and CD300 ectodomains. (e) Human TREM2 and TIM4-phosphatydilserine crystal structures (pdb: 3BIB) superimposed, with the key lipid-binding motif residues shown as black sticks. Note that the conserved TREM2 D119 is facing away from the putative lipid-binding pocket, whereas the TIM4 D100 faces inward towards the pocket to coordinate a Ca2+ ion. (f) mTREM2-lipid binding was assessed by ELISA in the presence of 5 mM Mg2+, Ca2+, or EDTA. Representative of two independent experiments with both mouse and human TREM2.
Figure 4—figure supplement 2
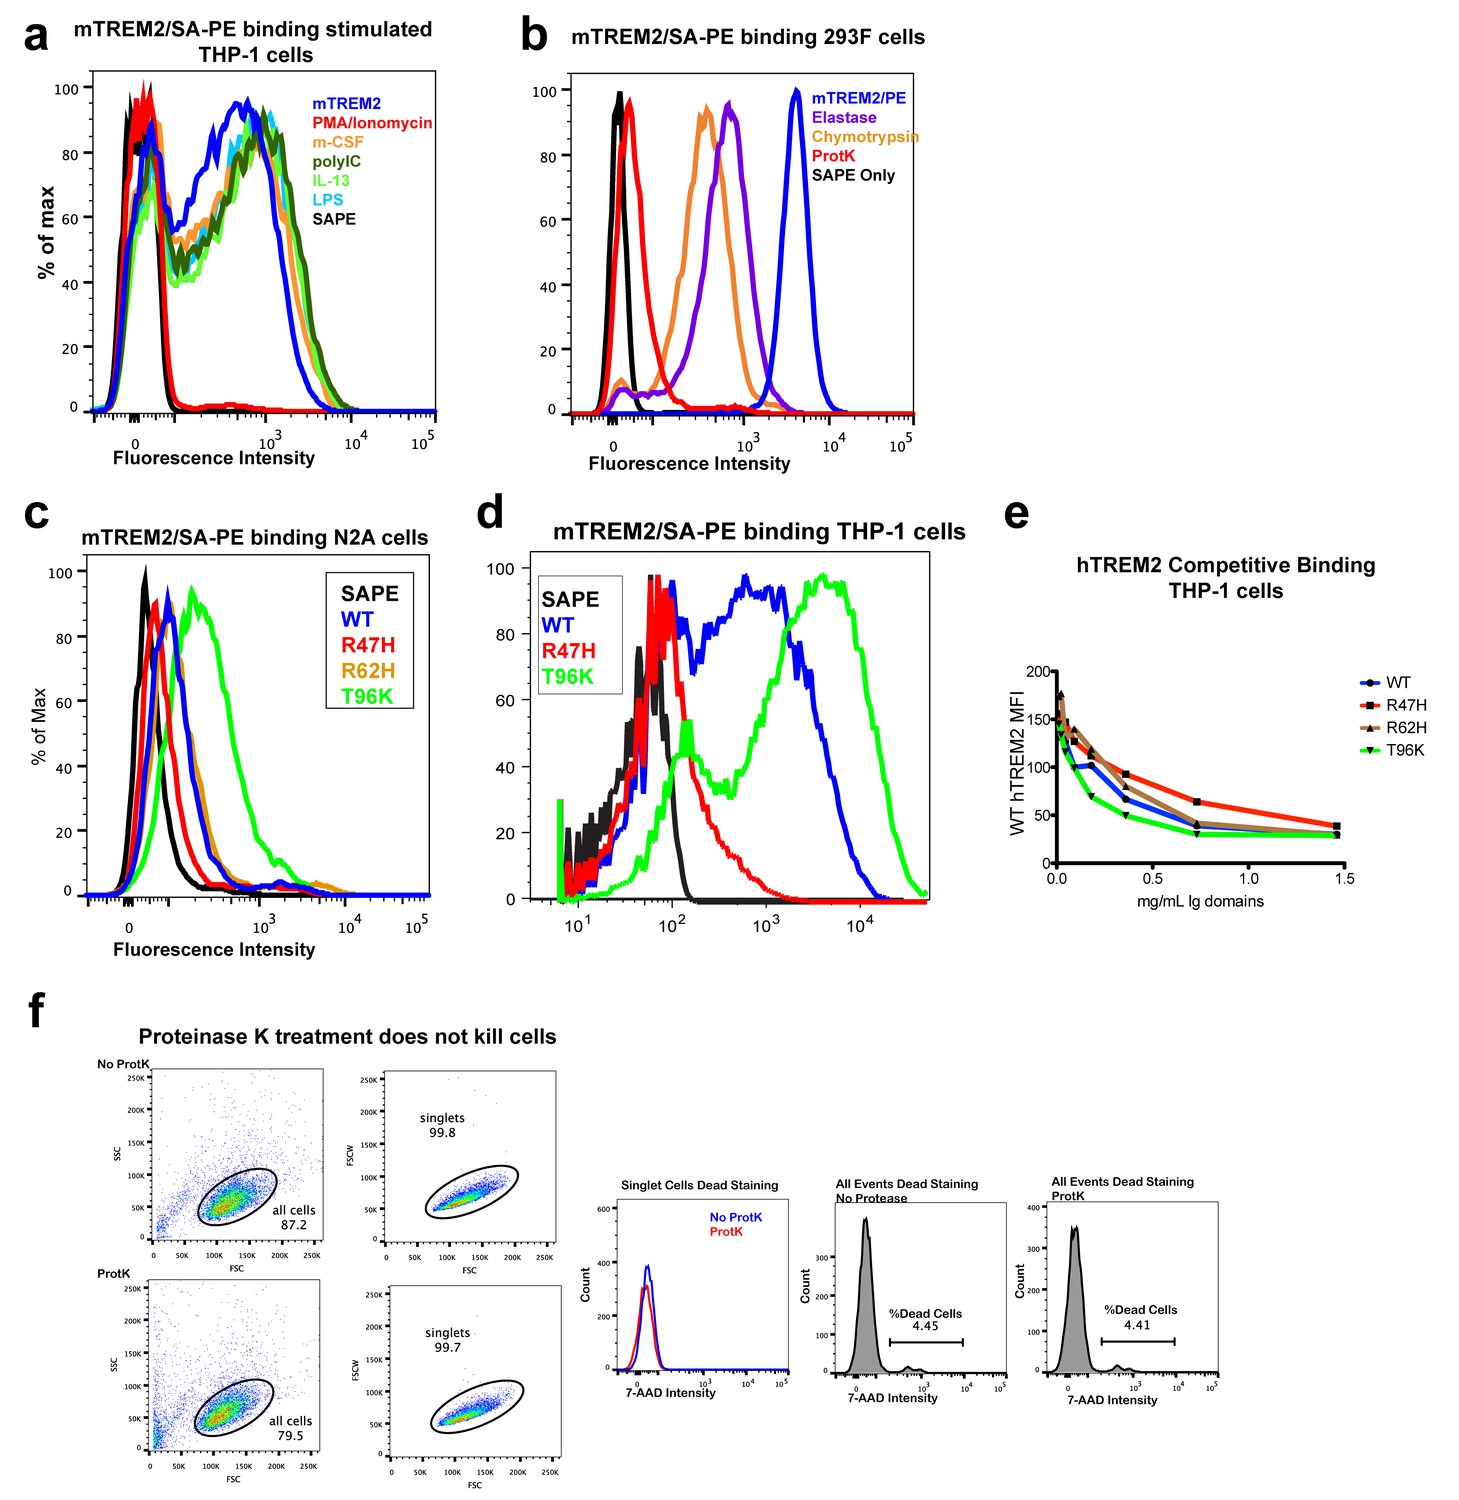
TREM2 binding to mammalian cells.
(a) Flow cytometry (FC) analysis of mouse TREM2 ectodomain/SA-PE tetramers binding to THP-1 cells following stimulation with different compounds. Only PMA/ionomycin reduces binding. (b) FC analysis of mouse TREM2/SA-PE tetramers binding to 293F cells, which is ablated by the pre-treatment of cells with proteinase K and reduced by chymotrypsin and elastase. (c) Flow cytometry analysis of WT, R47H, R62H, and T96K mTREM2/SA-PE tetramers binding Neuro2A cells (N2A). (d) Flow cytometry analysis of WT, R47H, and T96K mTREM2/SA-PE binding THP-1 cells. (e) Competition binding to THP-1 cells. WT hTREM2/SA-PE tetramers were applied to THP-1 cells pre-incubated with SEC-purified hTREM2 ectodomains at decreasing concentrations. The highest concentration is 1.5 mg/mL, with two-fold dilution points. All staining results are representative of at least two independent experiments. (f) Cell viability analysis of proteinase-K-treated THP-1 cells. Forward and side scatter analysis of THP-1 cells selected for staining analysis. No dead cells were detected in this singlet population (7-AAD staining). Analysis of all events showed >95% viability.
Figure 5
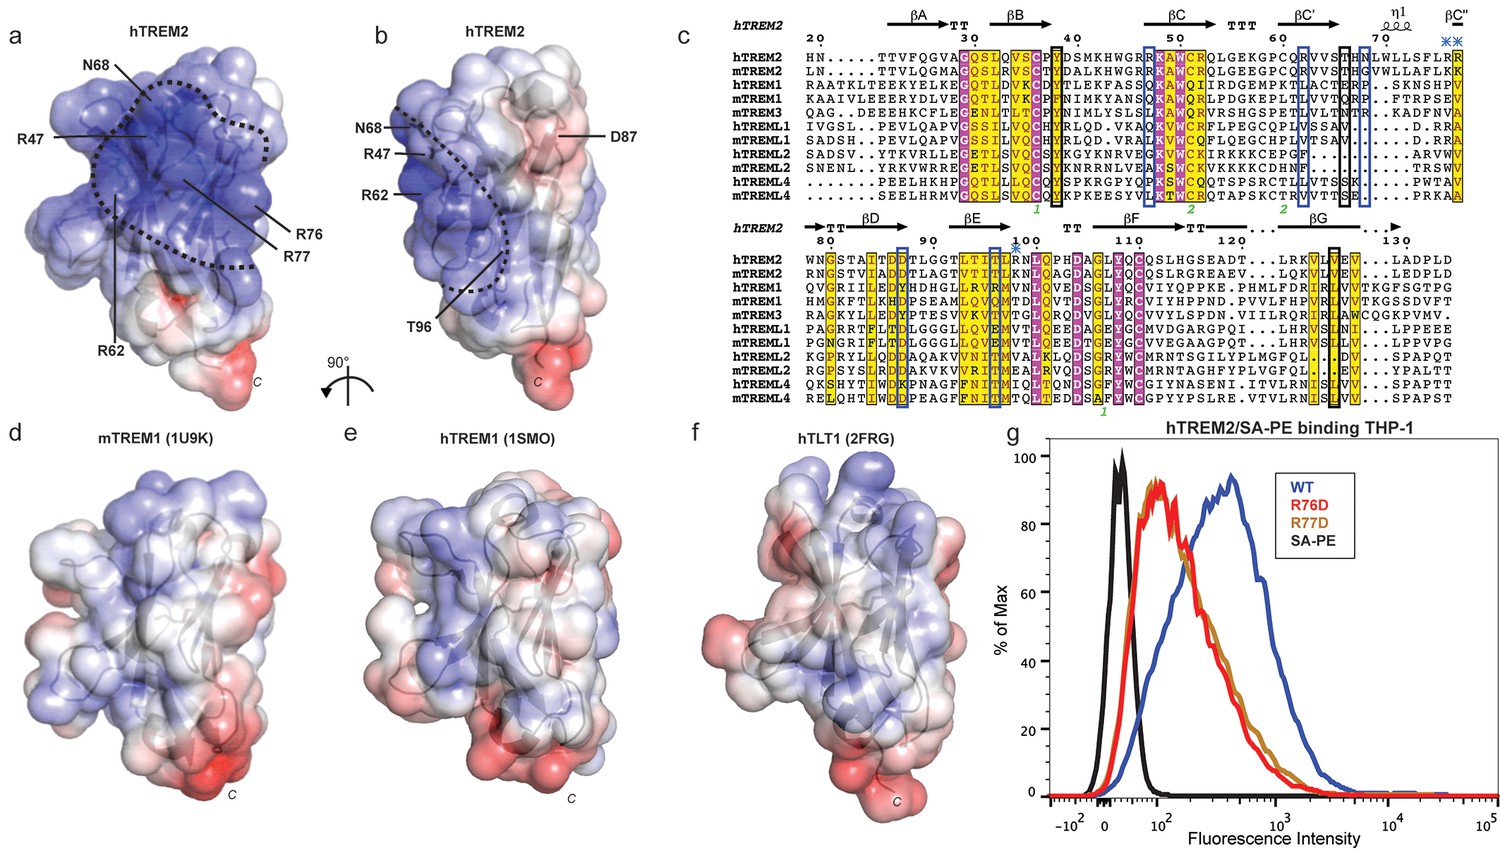
AD risk variants reveal a functional surface on TREM2.
(a) Electrostatic surface of hTREM2 and (b) hTREM2 rotated 90°. The extended basic patch on hTREM2 is outlined with a dashed line. (c) Structure-based sequence alignment of human (h) and mouse (m) TREM family members. Secondary structure assigned using the DSSP server. Invariant residues are shown in magenta and conserved residues are shown in yellow. Disulfide bonds are numbered in green. NHD residues are highlighted with black boxes and AD residues in blue boxes. Basic patch residues are labeled with blue asterisks. (d) mTREM-1 (1 U9K), (e) hTREM-1 (1SMO), and (f) hTLT-1 (2FRG) aligned with hTREM2 as in (a). Electrostatic potential was plotted on the solvent-accessible surface using the AMBER force field and the PDB2PQR server within the APBS Pymol plugin. Scale is −6.0 kT/e (blue) to +6 kT/e (red). (g) Flow cytometry analysis of WT, R76D, and R77D hTREM2/SA-PE binding to TREM2-L on THP-1 cells. Representative of two independent experiments.
Figure 6 with 1 supplement
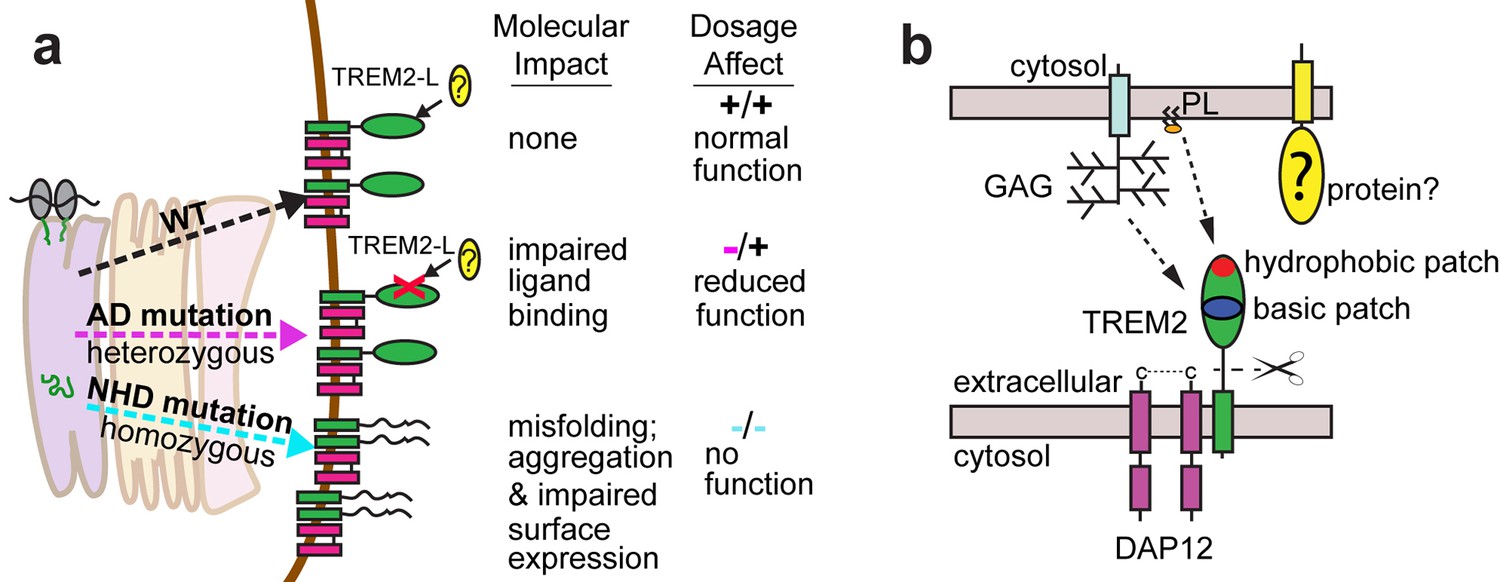
Models developed from the current data.
(a) Current model for the role of TREM2 ectodomain point mutations in neurodegenerative diseases. WT TREM2 is surface expressed in complex with DAP12 and engages TREM2-L normally. AD risk variants do not impair surface expression, but do impair ligand binding. They occur heterozygously, so this would lead to overall reduced TREM2 function in individuals carrying these risk variants. NHD mutations cause misfolding, which leads to aggregation and impaired surface expression. These mutations occur homozygously, leading to no TREM2 function in individuals carrying these mutations. (b) Current model for the engagement of possible TREM2 ligands investigated here. Membrane-bound or soluble TREM2 (sTREM2) produced by proteolytic cleavage likely engages GAGs via the basic patch and engages phospholipids (PL) via the hydrophobic patch. In addition, there is a protein component of TREM2-L.
Figure 6—figure supplement 1
hTREM2 has an extended hydrophobic surface.
(a) hTREM2 oriented as in Figure 5a and (b) hTREM2 rotated 90° towards the viewer to show the hydrophobic ‘top’ of the protein. Protein surface shown with residues colored by hydrophobicity scoring according to the color_h Pymol script, where red is hydrophobic is and white is hydrophilic.
Tables
Table 1
Determination of resolution cut-off by evaluation of meaningful data.
To evaluate the functional resolution of data past 3.3 Å, data were scaled to 3.0 Å resolution. Data were successively truncated at 0.1 Å intervals from 3.4 Å to 3.0 Å and the initial 3.3 Å solution was used to initiate molecular replacement, rigid body refinement and XYZ refinement in PHENIX without manual refinements. After refinement at the higher resolution, the resulting model was used to calculate R and Rfree values at the immediate lower resolution. If this resulted in a better model, as judged by Rfree, the higher resolution data are useful for improving the model. Data at resolutions that improved the model are highlighted in green while data at resolutions that worsened the model are highlighted in red.
Refine at: | |||||
3.3 | 3.2 | 3.1 | 3.0 | ||
Calculate at: | 3.3 | 26.26/31.66 | 25.30/31.47 | ||
3.2 | 26.75/31.88 | 26.79/31.80 | |||
3.1 | 27.71/32.47 | 27.64/32.87 | |||
3.0 | 28.30/32.52 | ||||
Table 2
Data collection and refinement statistics.
Human TREM2 ectodomain | |
|---|---|
Data collection | |
Space group | P 64 2 2 |
Cell dimensions | |
a, b, c (Å) | 125.76, 125.76, 183.70 |
α, β, γ (°) | 90, 90, 120 |
Resolution (Å) | 50.00–3.10 (3.21–3.10)* |
Rsym | 0.11 (1.00) |
Mean I / σI | 21.0 (1.76) |
Completeness (%) | 99.88 (99.75) |
Redundancy | 12.9 (13.4) |
Refinement | |
Resolution (Å) | 50.00–3.10 |
No. reflections | 16,285 |
Rwork / Rfree | 0.2605/0.2736 |
No. atoms | 1,784 |
Protein | 1,756 |
Carbohydrate | 28 |
B-factors | 93.48 |
Protein | 92.39 |
Carbohydrate | 162.1 |
R.m.s. deviations | |
Bond lengths (Å) | 0.006 |
Bond angles (°) | 1.18 |
-
*Values in parentheses are for highest-resolution shell.
Table 3
Primers used in this study.
hTREM2 ectodomain | GAAACCGGTCACAACACCACAGTGTTCCAGGGC CGGGGTACCCAGGGGGTCTGCCAGCACCTCCAC |
|---|---|
hTREM2 Y38C* | CTGCAGGTGTCTTGCCCCTGTGACTCCATGAAGCACT AGTGCTTCATGGAGTCACAGGGGCAAGACACTTGCAG |
hTREM2 T66M* | TGCCAGCGTGTGGTCAGCATGCACAACTTGTGGCTGC GCAGCCACAAGTTGTGCATGCTGACCACACGCTGGCA |
hTREM2 V126G* | TCAGGAAGGTCCTGGGGGAGGTGCTGGCAGA TCTGCCAGCACCTCCCCCAGGACCTTCCTGA |
hTREM2 R62H+ | CCCAGTCCAGCATGTGGTCAGCA CCCTTCTCTCCCAGCTGGC |
hTREM2 R76D+ | GTCCTTCCTGGACAGGTGGAATGGG AGCAGCCACAAGTTGTGC |
hTREM2 R77D+ | CTTCCTGAGGGACTGGAATGGGAGCACAG GACAGCAGCCACAAGTTG |
FLAG-hTREM2 | GAAACCGGTGATTATAAAGATGATGATGATAAACACAACACCACAGTGTTCCAGGGC CGGGGTACCTCACGTGTCTCTCAGCCCTGGCAG |
mTREM2 ectodomain | GAAACCGGTCTCAACACCACGGTGCT CGGGGTACCTTGGTCATCTAGAGGGT |
mTREM2 R62H+ | CCCATGCCAGCATGTGGTGAGCA CCCTCCTCACCCAGCTGC |
mTREM2 R47H* | AAGCACTGGGGGAGACACAAGGCCTGGTGTCGG CCGACACCAGGCCTTGTGTCTCCCCCAGTGCTT |
mTREM2 T96K* | CTTGCTGGAACCGTCACCATCAAGCTGAAGAACCTCCAAGCCGGT ACCGGCTTGGAGGTTCTTCAGCTTGATGGTGACGGTTCCAGCAAG |
mDAP12 | CCGGAATTCGCCACCATGGGGGCTCTGGAGCCCTCCTGG CGGGGTACCTCATCTGTAATATTGCCTCTGTGT |
-
All primers 5’−3’ with the coding direction primer listed first
-
*Designed for Quikchange Lightning Mutagenesis
-
+Designed for NEB Q5 mutagenesis
Download links
A two-part list of links to download the article, or parts of the article, in various formats.
Downloads (link to download the article as PDF)
Open citations (links to open the citations from this article in various online reference manager services)
Cite this article (links to download the citations from this article in formats compatible with various reference manager tools)
Neurodegenerative disease mutations in TREM2 reveal a functional surface and distinct loss-of-function mechanisms
eLife 5:e20391.
https://doi.org/10.7554/eLife.20391


