Suppressor of cytokine signaling (SOCS)5 ameliorates influenza infection via inhibition of EGFR signaling
- The Walter and Eliza Hall Institute of Medical Research, Australia
- University of Melbourne, Australia
- Hudson Institute of Medical Research, Australia
- Monash University, Australia
- Hunter Medical Research Institute and The University of Newcastle, Australia
- Fudan University, China
- University of Melbourne, at the Peter Doherty Institute for Infection and Immunity, Australia
Figures
Figure 1 with 1 supplement
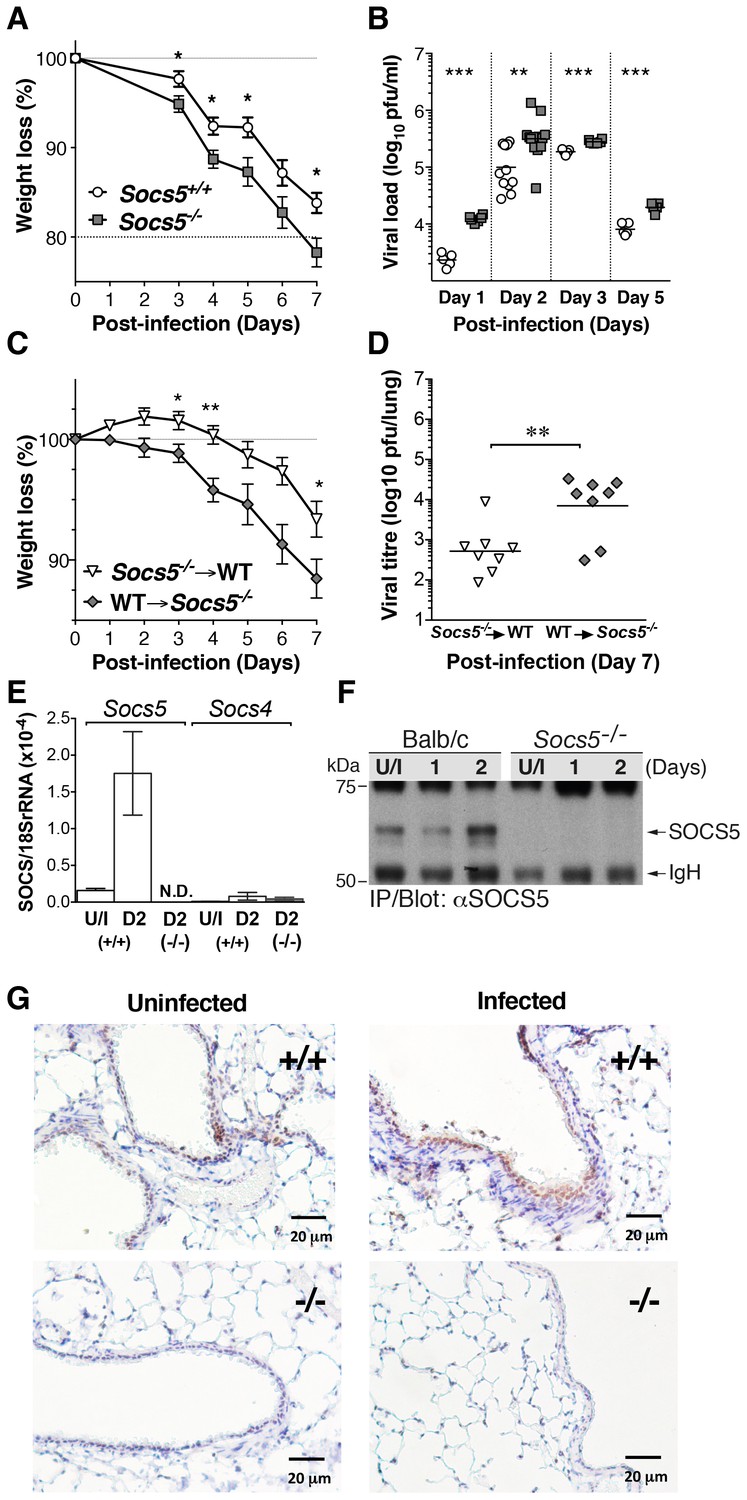
Socs5−/− mice show increased susceptibility to influenza A virus infection.
(A) Mice were infected i.n. with 25 pfu influenza virus H1N1 PR8 and weight loss monitored for 7 days. Mice that lost more than 20% of their initial body weight were euthanized. Mean ± S.E.M.; n = 9. (B) Comparison of viral titres in lung homogenates on days 1, 2, 3 and 5 post-PR8 infection. (C,D) Lethally irradiated Socs5+/+ Thy1.1 mice were reconstituted with Socs5−/− Thy1.2 bone marrow (n = 8) or the reciprocal transplantation was performed (n = 9), following which mice were infected with H1N1 PR8 virus. Weight loss (C) was monitored for 7 days, at which time lungs were harvested for (D) viral titre estimation. *p<0.05, **<0.005, ***<0.001; mean ± S.E.M. (E) Lungs from wild-type and Socs5−/− mice were harvested at day (D) two post-infection and analyzed for Socs5 and Socs4 mRNA expression by Q-PCR. The results were normalized to 18SrRNA levels. Mean ± S.E.M.; N.D.=Not detected; n = 3 uninfected (U/I) wild-type mice, n = 6 infected wild-type mice, n = 6 infected Socs5−/− mice. (F) Lungs were lysed at day 1 and 2 post-infection and SOCS5 protein levels analyzed by immunoprecipitation and immunoblotting. (G) Lung immunohistochemistry showing SOCS5 expression (brown staining) in wild-type (+/+) airway epithelium at day three post-infection. The following figure supplement is available for Figure 1.
Figure 1—figure supplement 1

Comparison of viral titres.
Wild-type (WT), Socs4−/−, Socs5−/− or Sirpa−/− mice were infected i.n. with 35 pfu influenza virus H1N1 PR8 and viral titres in lung homogenates on day one post-inoculation determined by plaque assay. Mean ± S.E.M.; n = 6.
Figure 2 with 2 supplements
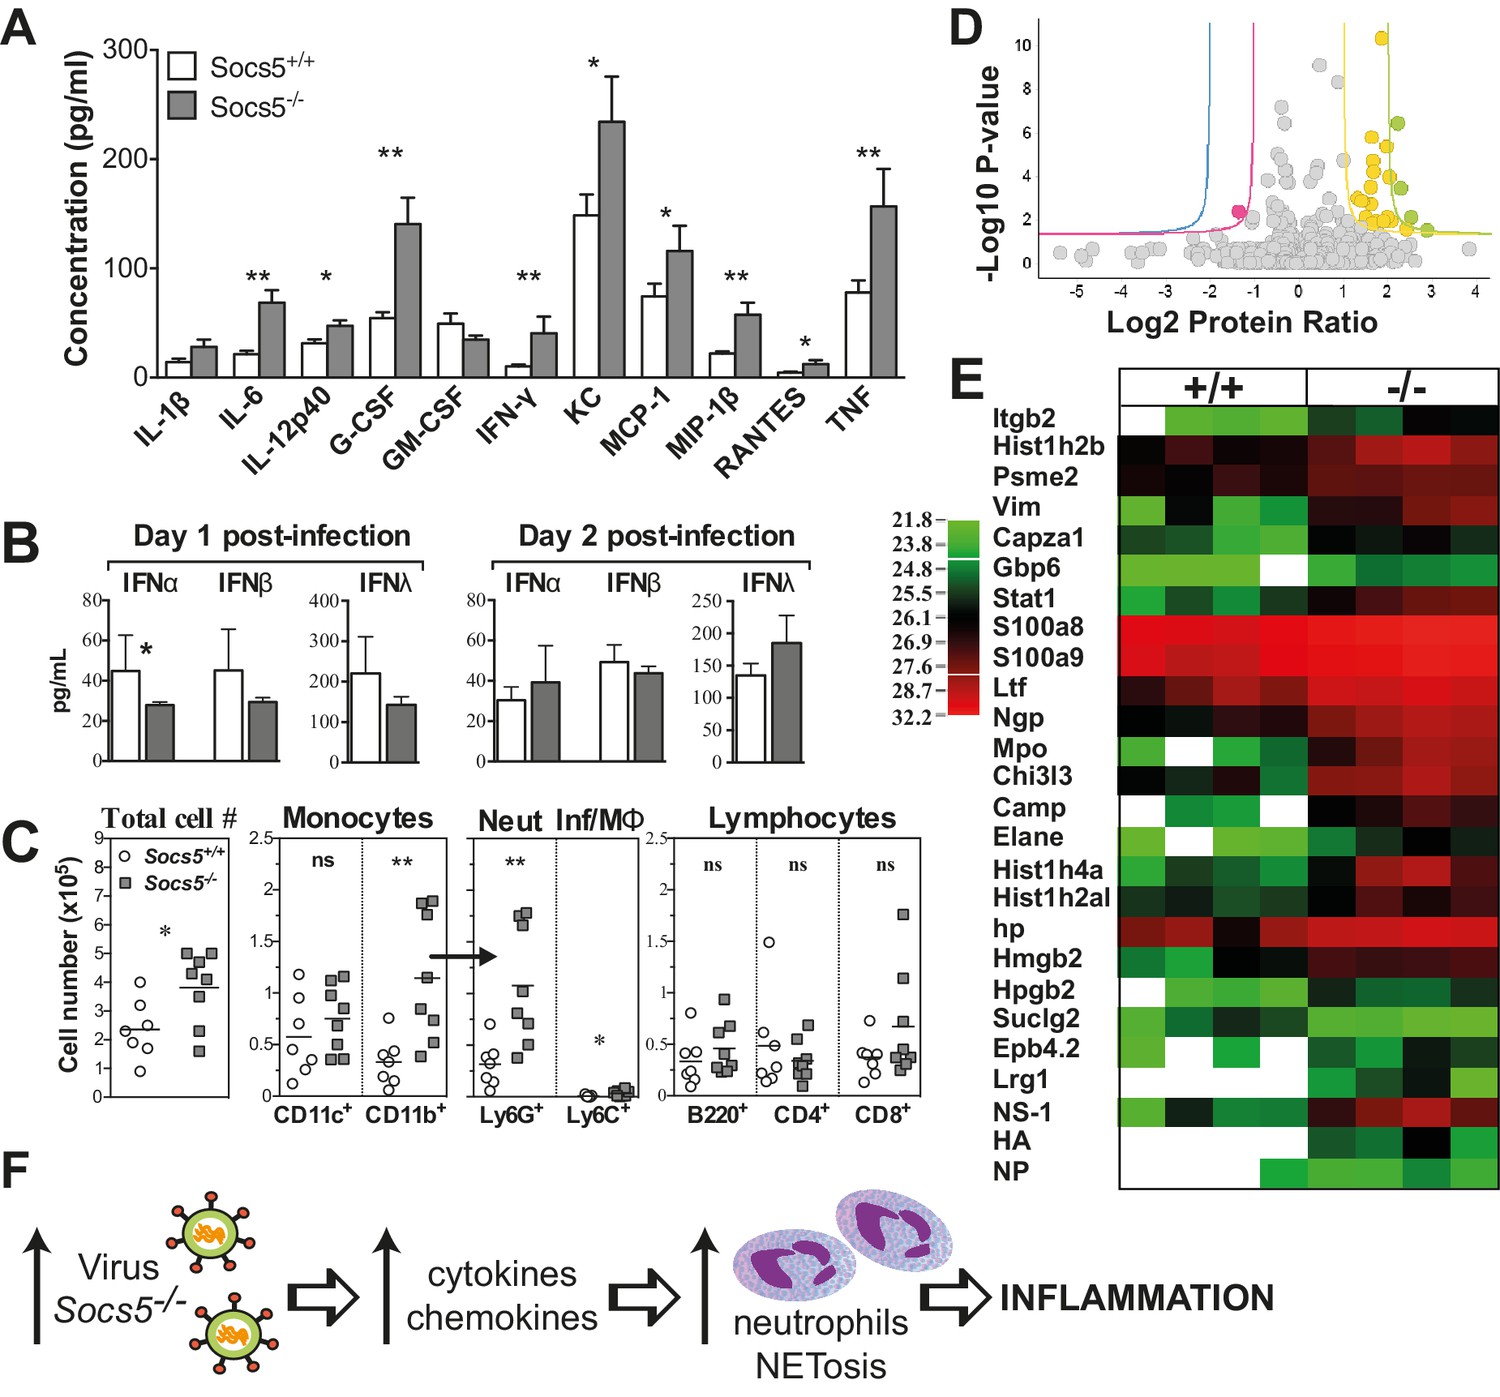
Socs5−/− mice have an exaggerated inflammatory response in the lungs to influenza A virus infection.
(A) Cytokine and chemokine levels were analyzed by Bioplex in bronchoalveolar lavage (BAL) fluid recovered from lungs at day two post-infection with 25 pfu influenza virus H1N1 PR8. *p<0.05, **<0.005; Mean ± S.E.M.; n = 7 for Socs5+/+, n = 8 for Socs5−/−. (B) Expression of type I and type III interferon (IFN) in the lungs at day 1 and day two post-infection was measured by ELISA. *p<0.05; Mean ± S.D.; day 1: n = 5 for Socs5+/+, n = 6 for Socs5−/−; day 2: n = 8. (C) Flow cytometric analysis was performed on cells in BAL. Cells were gated on CD11b+ and subdivided into CD11c+ APC (dendritic cells and alveolar macrophages), Ly6G+ neutrophils and Ly6C+ inflammatory monocytes. Gated lymphocytes were subdivided into B220+ B cells and CD4+ and CD8+ T cells. *p<0.05, **<0.005, ns = not significant; Individual and mean values; n = 7 for Socs5+/+, n = 8 for Socs5−/−. (D,E) Mice were infected and lungs lysed at day two post-infection for label-free quantification of global protein expression. Volcano plot (D) shows the Log2 protein ratios following the quantitative pipeline analysis (Socs5+/+ vs Socs5−/−). The red and yellow lines represent a 2-fold change in protein expression (log2 ratio of 1), while blue and green lines represent a 4-fold change (log2 ratio of 2); dots are coloured accordingly and represent individual proteins. Proteins with a -log10 p-value of 1.3 or greater (corresponding to a p-value of ≤0.05) were deemed differentially abundant. (E) Heat map displaying Log2-transformed summed peptide intensities (non-imputed) for proteins with significantly differential expression in (D). Data from individual biological replicates are shown (n = 4). Green to red indicates increasing expression levels. (F) Schematic showing the relationship between increasing viral load and inflammation.
Figure 2—figure supplement 1

Gating strategy for flow cytometric analysis.
(A) Cells were initially gated on Forward (FSC) and Side Scatter (SSC) and divided into CD11b+ and CD11c+ (dendritic cells and alveolar macrophages) cells. CD11b+ cells were further subdivided into Ly6G+ neutrophils and Ly6C+ inflammatory monocytes. (B) Lymphocytes were gated on FSC and SSC and subdivided into B220+ B cells, CD4+ and CD8+ T cells. Values shown indicate the % of gated or positive cells. FITC: Fluorescein isothiocyanate, APC: allophycocyanin, PerCP: Peridinin Chlorophyll Protein Complex.
Figure 2—figure supplement 2
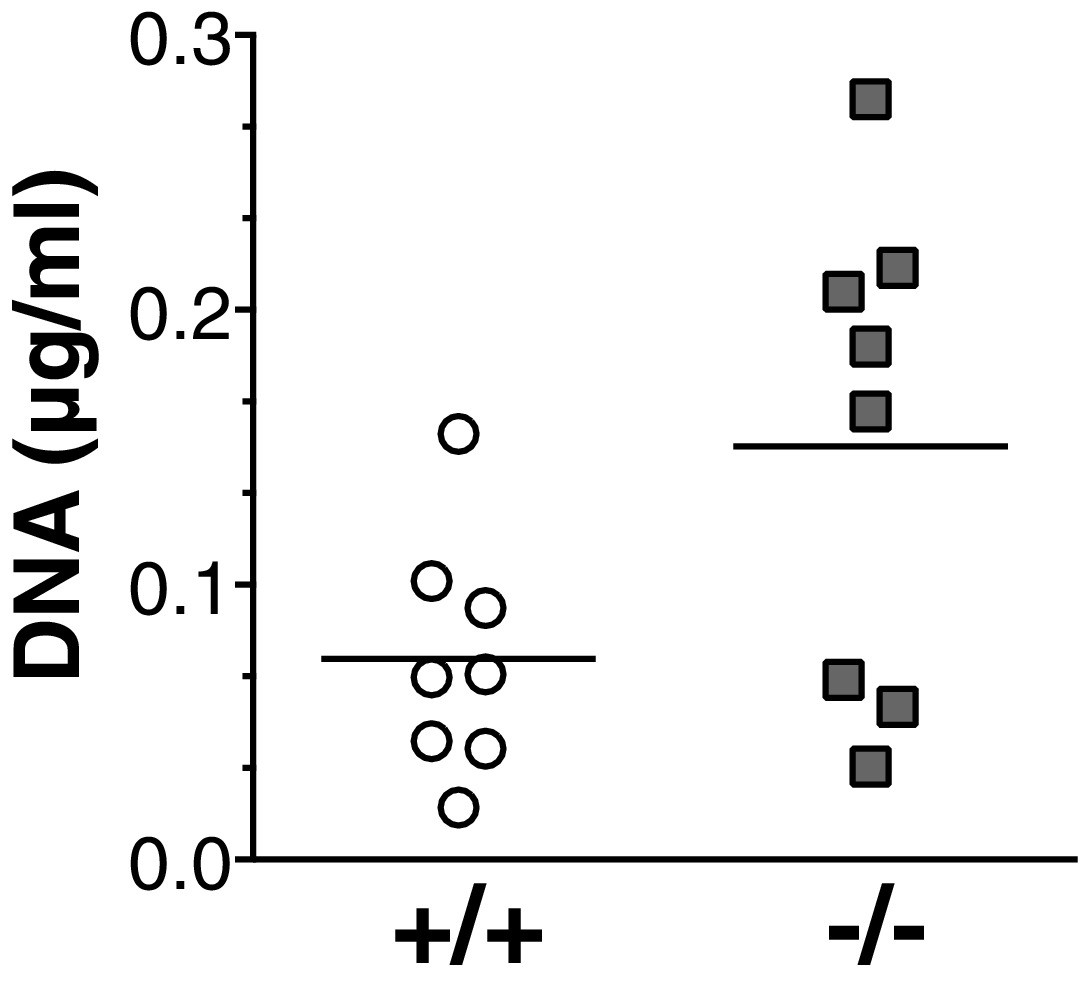
Increased NETosis in Socs5−/− lungs during influenza virus infection.
Bronchoalveolar fluid was harvested from the lungs of wild-type (+/+) and Socs5−/− mice (−/−) at day two post-infection with 25 pfu influenza virus PR8, and assayed for the presence of DNA.
Figure 3

Socs5−/− airway epithelial cells have increased intrinsic susceptibility to influenza virus infection.
(A) Primary mouse airway epithelial cells (mAEC) from wild-type and Socs5−/− mice were purified and cultured in vitro for 7 days prior to infection with influenza virus H1N1 PR8. (B) 8 h post-infection cell monolayers were fixed and stained by immunofluorescence for detection of viral nuclear protein. Results are shown as the mean % of infected cells from four technical replicates and are representative of 2 experiments. (C) mAEC were infected with PR8 (MOI 1) and then incubated in the presence of trypsin for 2, 8, 24 and 48 h. Culture supernatants were analyzed for infectious virus by plaque assay. Results are shown as the fold increase over the level of virus present at 2 h post-infection. Mean ± S.E.M. are shown for three technical replicates and are representative of 2 experiments. (D) mAECs were infected (MOI 5) and cytokine levels in culture supernatants measured by Bioplex at 24 h post-infection. Individual and mean values are shown for technical replicates derived from purified cells pooled from five mice and are representative of 2 experiments. *p<0.05.
Figure 4
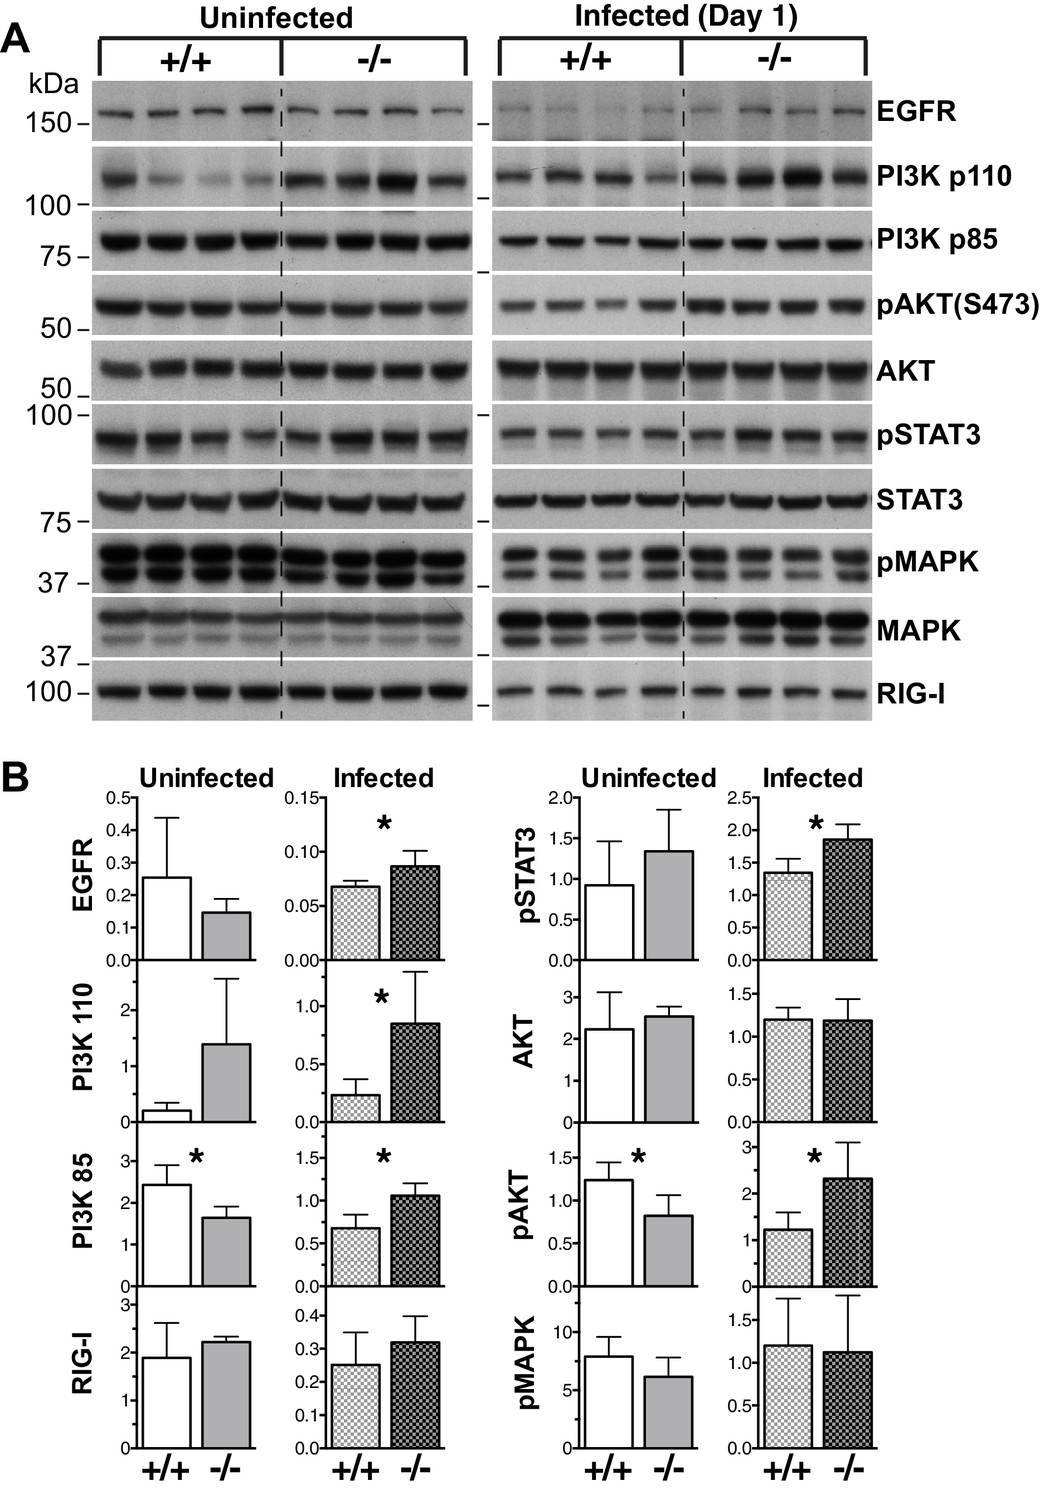
EGF-PI3K signaling is enhanced in Socs5−/− lungs.
(A) Whole lungs were harvested from uninfected wild-type (+/+) and Socs5−/− (−/−) mice or from mice at 24 h post-infection with 50 pfu influenza virus H1N1 PR8. Following tissue lysis 100 μg protein from each mouse was analyzed by immunoblotting with antibodies to the indicated proteins. p: phosphorylated. Note that as they are analyzed on separate gels, uninfected samples cannot be compared to infected samples. (B) Densitometric values derived from (A) were analyzed as follows: Data from uninfected mice were normalized to MAPK values, whilst data from infected mice were normalized to STAT3. *p<0.05, **p<0.005; Mean ± S.D.; n = 4.
Figure 5

SOCS5 interacts with a PI3K complex.
(A–C) 293T cells were transiently transfected with constructs expressing Flag-tagged SOCS5, SOCS5 mutants or vector alone, lysed and SOCS5-containing complexes immunoprecipitated (IP) using anti-Flag antibodies. (A) Protein complexes were analyzed by tryptic digest and mass spectrometry. Mean ± S.D. of summed peptide intensities from three replicates. The PI3K components, and SOCS5 and SOCS box components, were specifically enriched relative to immunoprecipitates from cells transfected with vector alone. (B,C) SOCS5-containing protein complexes were analyzed by immunoblotting with the indicated antibodies. Lysates were probed with antibodies to Erk1/2 to show equal protein input (lower panels). PV indicates pre-treatment of cells with pervanadate to inhibit phosphatase activity. mSH2: SOCS5-R406K; mSB: SOCS5-L484P, C488F; ΔNT: residues 350–536. (D) A549 cells were pre-treated with the proteasomal inhibitor MG132 (6 h) and pervandate (20 min) prior to lysis. Proteins were immunoprecipitated with either isotype control antibodies (Con) or SOCS5-specific antibodies (S5) and analyzed by immunoblotting with the indicated antibodies.
Figure 6 with 5 supplements

Socs5 expression in primary human airway epithelial cells regulates EGFR-PI3K signaling and restrains influenza virus infection.
Primary human airway epithelial cells (hAECs) from healthy individuals, smokers with COPD and smokers without lung disease, were cultured as described and infected with H3N2, H1N1 and H11N9 influenza virus strains (MOI 5). (A) 24 h post-infection Socs5 mRNA was measured by Q-PCR and is shown as the fold-change from a media only control. Mean ± S.E.M.; n = 3. (B) Data for healthy controls shown in (A) is plotted against the expression of Socs5 mRNA following infection with H5N1 (MOI 0.005). *p<0.05 Infection vs Media, +p<0.05 healthy vs COPD and H5N1 vs other subtypes/strains; Mean ± S.E.M.; n = 3. (C–F) hAECs from healthy individuals and COPD patients were cultured and SOCS5 depleted using siRNA (C,E). Alternatively, SOCS5 expression was increased in hAECs by transfection with SOCS5 cDNA (SOCS5 vector) (D,F) prior to infection with H1N1 (MOI 5). Cells were lysed at 24 h (C,D) or 2 h (E,F) post-infection and analyzed by immunoblotting with the indicated antibodies.
Figure 6—figure supplement 1
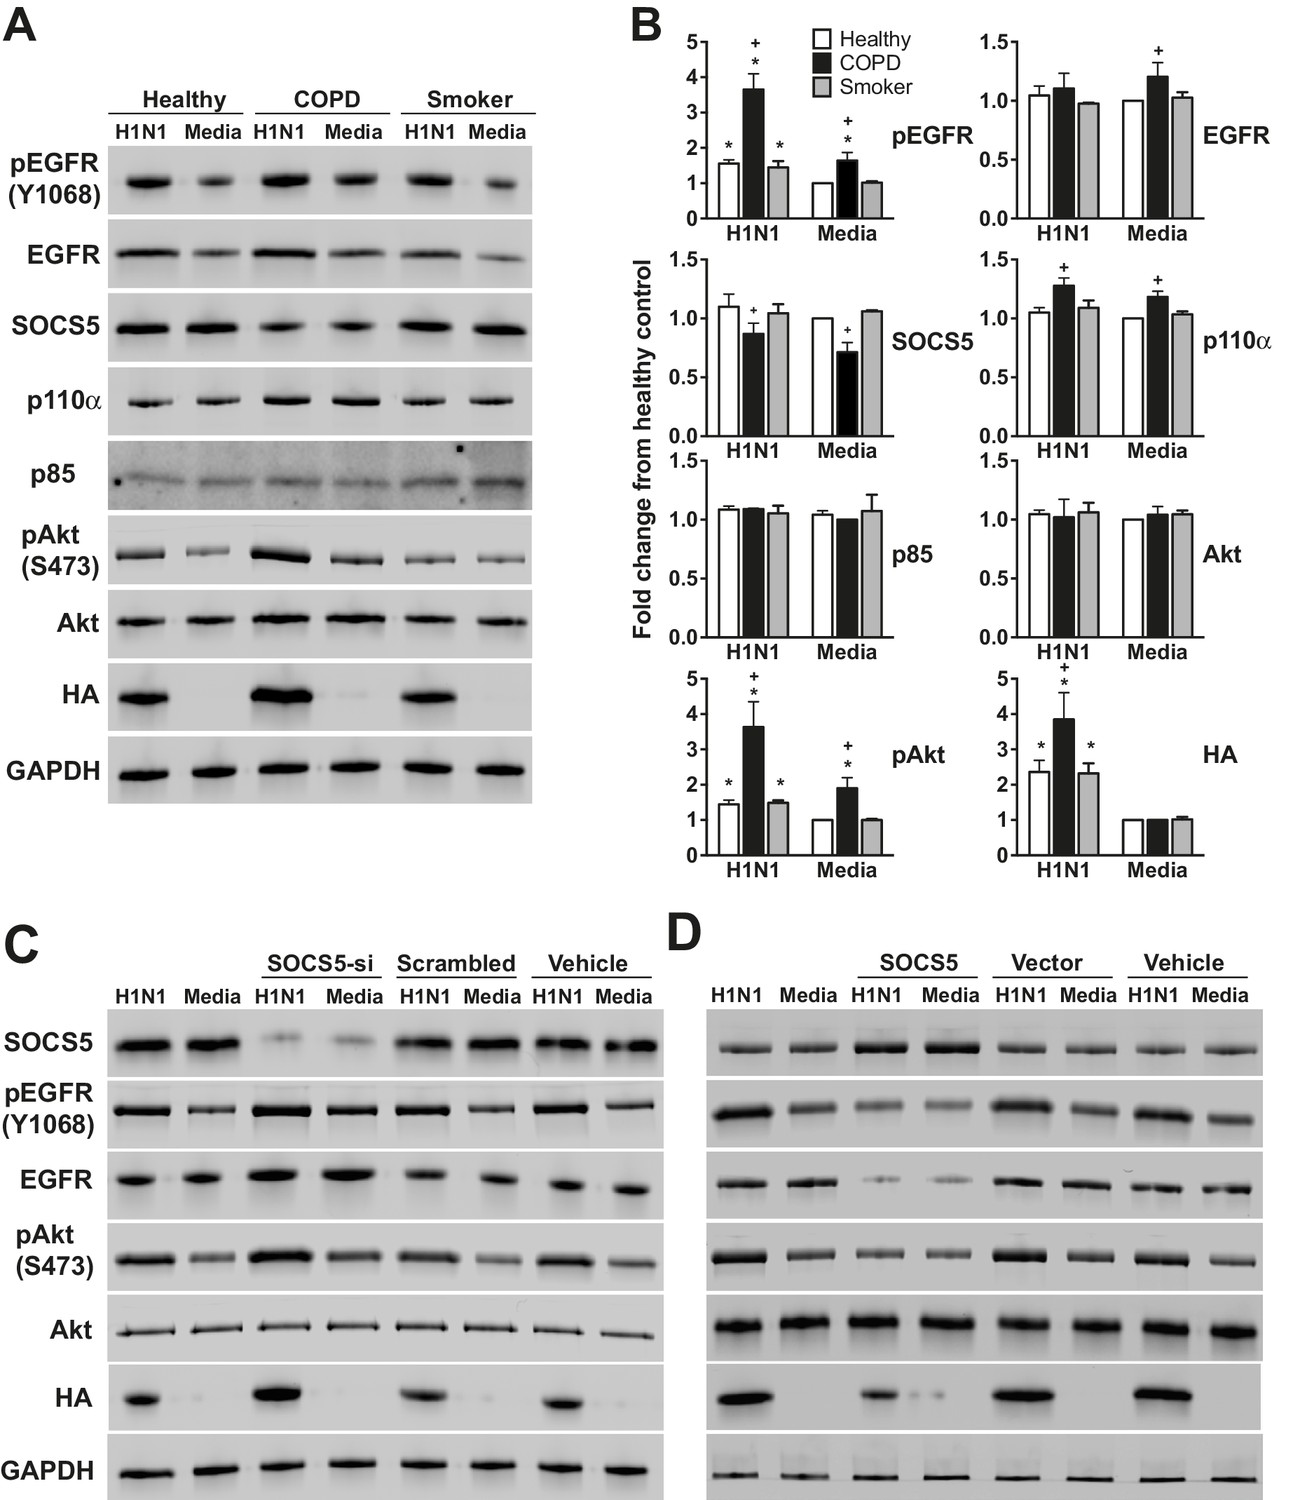
Socs5 expression in human primary airway epithelial cells regulates EGFR-PI3K signalling and restrains influenza infection.
(A) Human primary airway epithelial cells (hAECs) from healthy individuals (Healthy), smokers with COPD and smokers without lung disease (Smoker), were cultured and infected with influenza virus H1N1 (MOI 5). (A–D) Cells were lysed at 2 h post-infection and analyzed by Western blotting with the indicated antibodies. (B) Densitometric values were derived by first normalizing to GAPDH loading controls and are expressed as fold-change from healthy untreated controls (Media). *p<0.05 H1N1 vs media control, +p<0.05 COPD vs healthy; Mean ± S.E.M.; n = 5. (C) hAECs from healthy individuals were cultured and transfected with either siRNA to deplete Socs5 (SOCS5-si), control siRNA (scrambled) or vehicle alone. (D) Alternatively, SOCS5 expression was increased in hAECs by transfection with cDNA encoding SOCS5 (SOCS5), empty vector or vehicle alone, prior to infection.
Figure 6—figure supplement 2
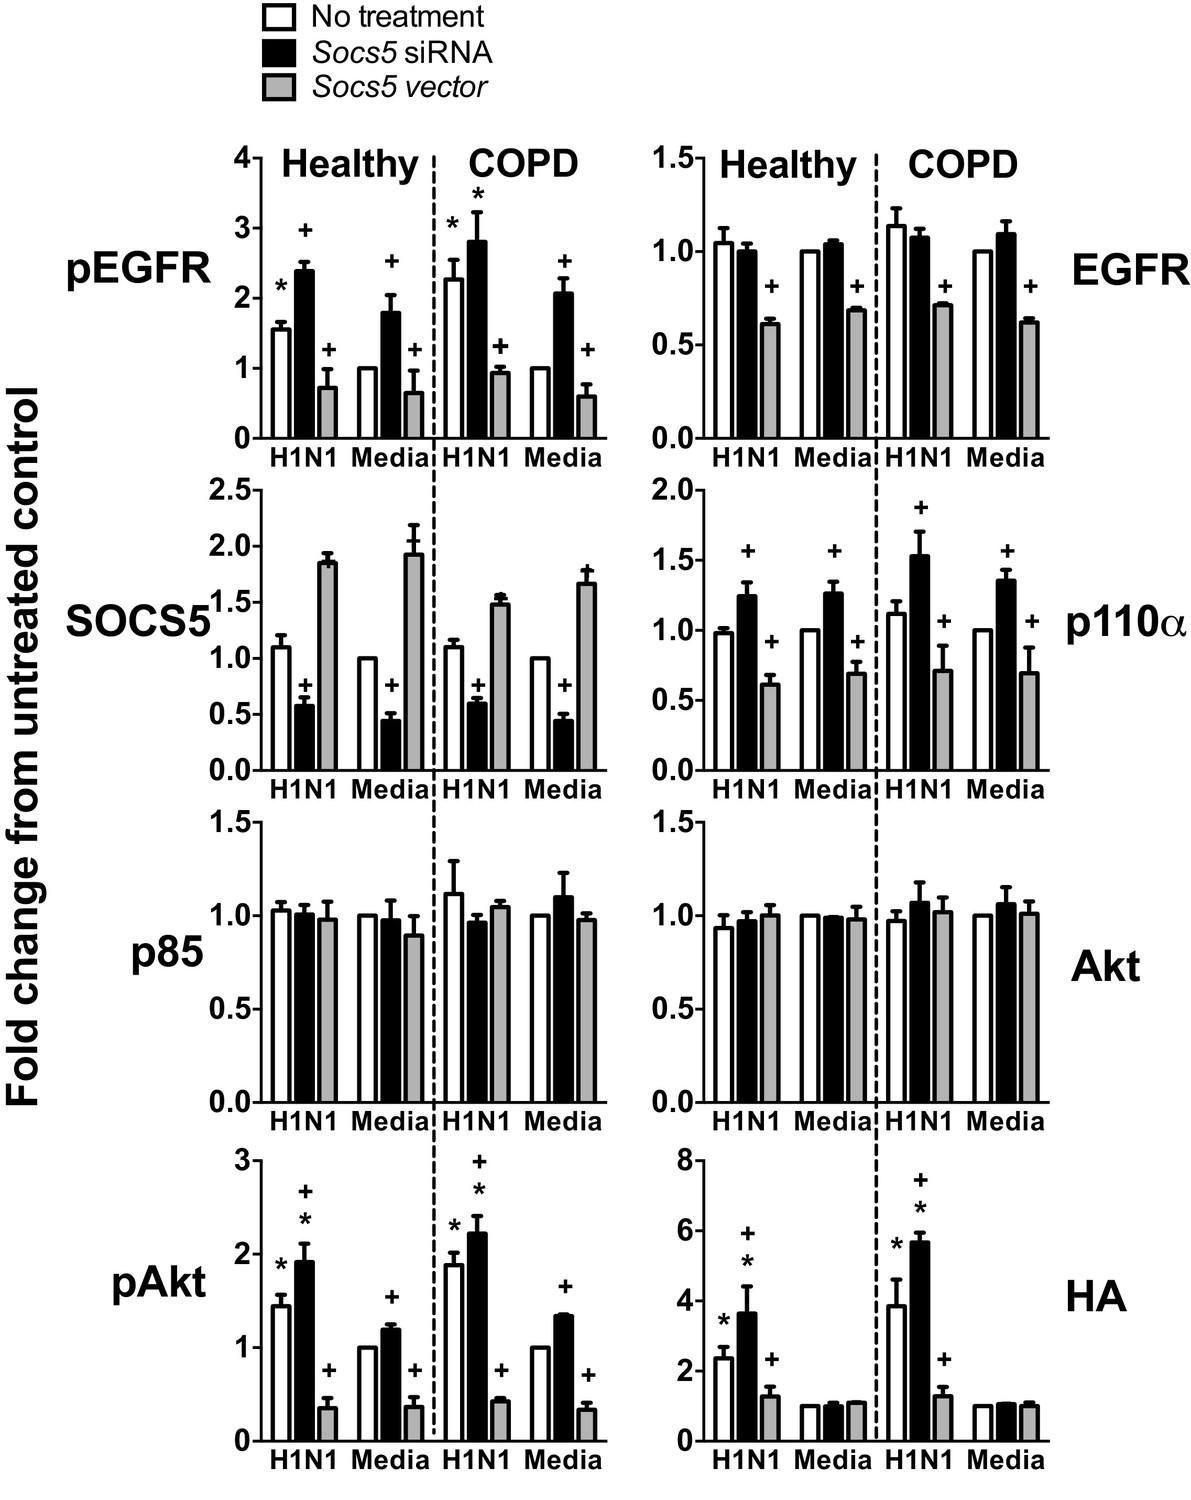
Socs5 expression in human primary airway epithelial cells regulates EGFR-PI3K signalling and restrains influenza infection.
hAECs from healthy individuals or smokers with COPD were cultured as described and transfected with siRNA to deplete Socs5, or alternatively, with cDNA encoding SOCS5 to increase SOCS5 expression (Socs5 vector), prior to infection with influenza virus H1N1 (MOI 5). Densitometric values were derived by first normalizing to GAPDH loading controls and are expressed as fold-change from healthy untreated controls (Media). *p<0.05 H1N1 vs media control, +p<0.05 Socs5 siRNA or Vector vs media control; Mean ± S.E.M. n = 3.
Figure 6—figure supplement 3

Socs5 expression in human primary airway epithelial cells regulates early events in influenza infection.
(A–D) hAECs from healthy individuals were cultured as described and transfected with control siRNA or siRNA to deplete Socs5, prior to addition of PI3K (Wortmannin) or EGFR (Erlotinib), inhibitor. Cells were then infected with influenza virus H1N1 (MOI 5) and lysed 2 h post-infection. (A and C) Immunoblot analysis with the indicated antibodies. (B and D) Densitometric values for HA levels were derived by first normalizing to GAPDH loading controls and are expressed as fold-change from uninfected, untreated controls (H1N1). *p<0.05; Mean ± S.E.M. n = 3.
Figure 6—figure supplement 4

PI3K p110α is not targeted by SOCS5 for proteasomal degradation.
The minimally immortalised bronchial epithelial cell line (BCi-NS1.1) was cultured in BEBM complete media (Lonza) and transfected with control siRNA or siRNA to deplete Socs5, prior to addition of the proteasomal inhibitor MG132 (10 μM; 4 h). Cells were then infected with influenza virus H1N1 (MOI 5) and lysed 2 h post-infection. Immunoblot analysis with the indicated antibodies.
Figure 6—figure supplement 5
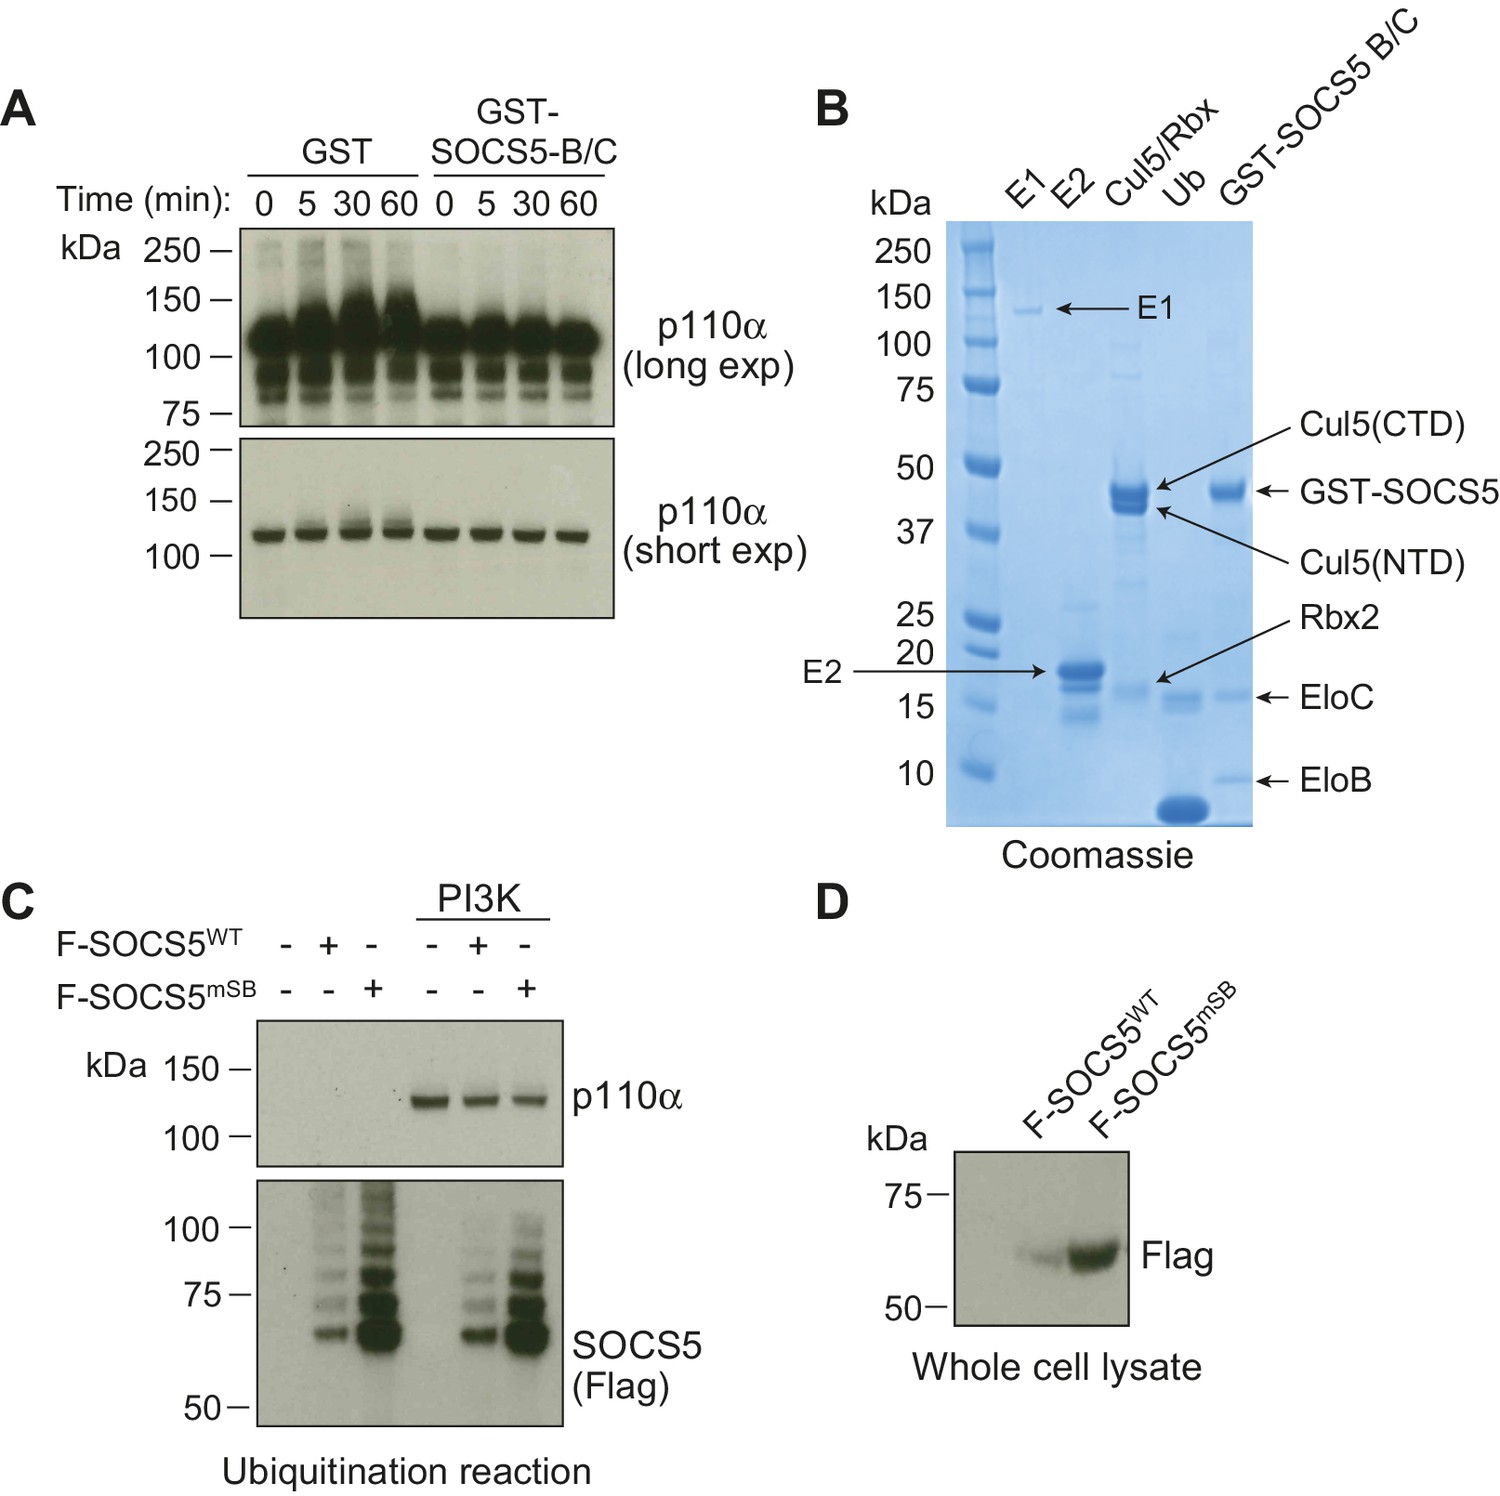
SOCS5 does not ubiquitinate PI3K p110α in vitro.
In vitro ubiquitination assays. (A) Recombinant PI3K p110α was incubated with GST alone or GST-SOCS5-SH2-SOCS box in complex with Elongin B/C (GST-SOCS5-B/C), together with Cullin 5, Rbx2, ubiquitin and E2 enzyme at 37°C. Reactions were initiated by the addition of E1 enzyme and samples collected at the indicated times, prior to immunoblot analysis with anti-PI3K antibodies. The lack of higher molecular weight species in the presence of SOCS5 indicates that no SOCS5-mediated ubiquitination of PI3K p110α was observed. Exp: exposure. (B) Coomassie stained gel showing all components of the ubiquitination reaction. CTD: C-terminal domain, NTD: N-terminal domain, EloB: Elongin B, EloC: Elongin C. (C) Flag-tagged, full-length SOCS5 (F-SOCS5) was enriched from 293T cells and incubated at 37°C for 1 h with the components of the E3 ligase complex in the presence or absence of recombinant PI3K p110α. Immunoblot analysis of PI3K p110α indicates no SOCS5-mediated ubiquitination of PI3K (WT: wild-type; mSB: SOCS5-L484P, C488F, a non-functional SOCS box). (D) Immunoblot analysis with anti-Flag antibodies showing expression of SOCS5 prior to enrichment.
Figure 7
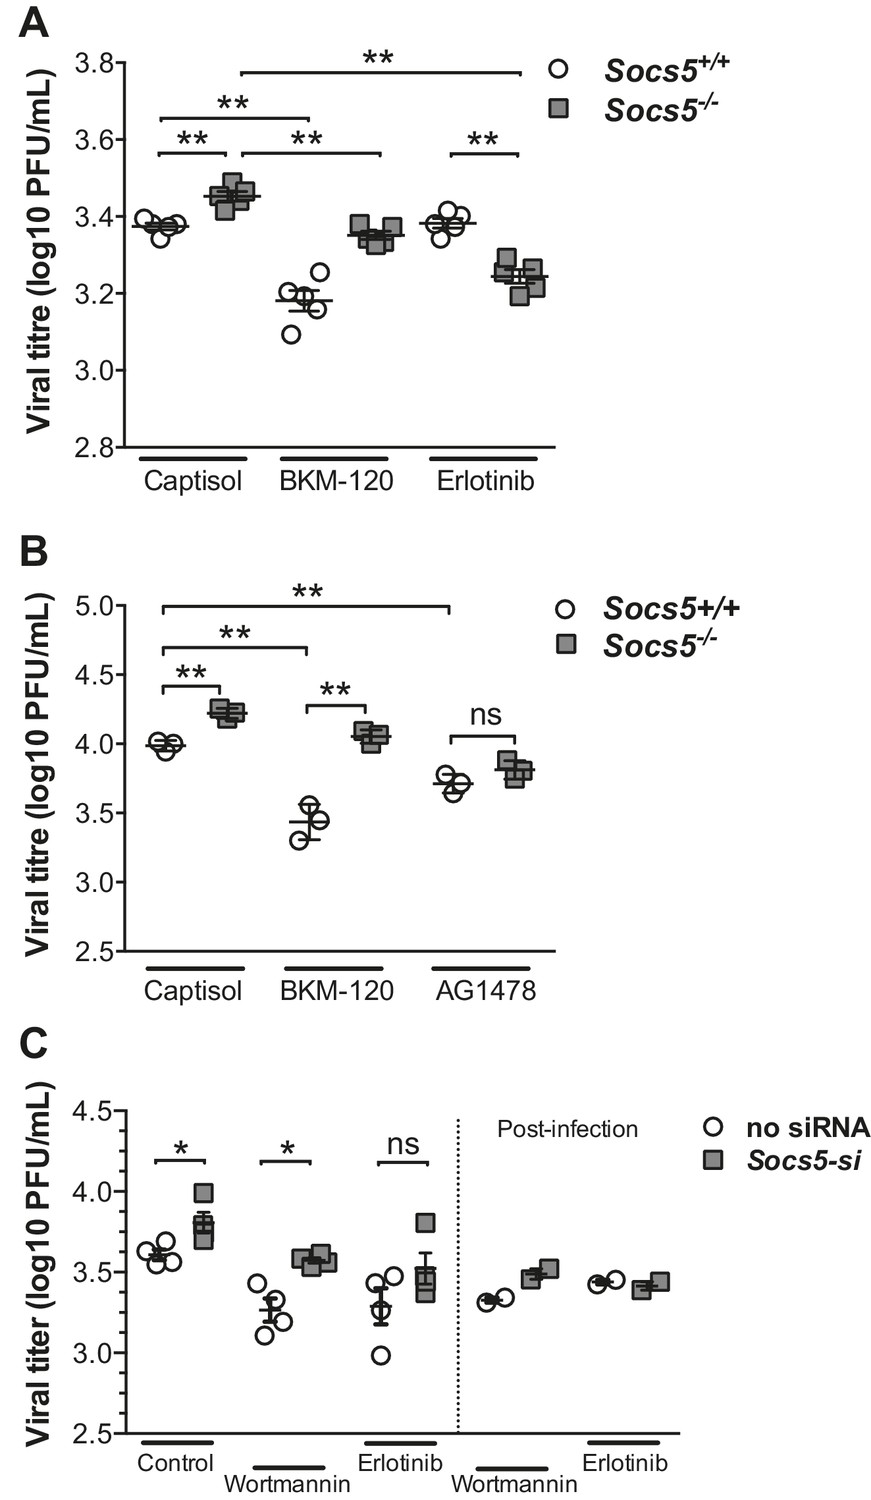
SOCS5 protects against influenza virus infection by suppressing virus-induced EGFR activity.
(A) Mice were infected i.n. with 35 pfu influenza virus H1N1 PR8 and viral titres determined in lung homogenates 24 h post-PR8 infection, by plaque assay. Mice were treated with vehicle (captisol), PI3K inhibitor (BKM-120) or EGFR inhibitor (Erlotinib) 4 h post-PR8 inoculation. (B) Primary mouse airway epithelial cells (mAEC) from wild-type and Socs5−/− mice were purified and cultured in vitro for 7 days prior to infection with influenza virus H1N1 PR8 (MOI 1) and then incubated in the presence of trypsin for 24 h. PI3K (BKM-120) and EGFR inhibitors (AG1478) were included in the culture media during and post-infection. Culture supernatants were analyzed for infectious virus by plaque assay. (C) Primary human airway epithelial cells (hAECs) from healthy individuals were cultured as described and infected with H1N1 strain (A/Auckland/1/2009; MOI 5). PI3K inhibitor (Wortmannin) and EGFR inhibitor (Erlotinib) were added 3 h prior to virus inoculation. Culture supernatants were analyzed for infectious virus by plaque assay 24 h post-infection. *p<0.05, **<0.005. (A–C; Mean ± S.E.M of indicated n). p values were determined by (A,B) unpaired student’s t-test or (C) a Mann-Whitney U test.
Author response image 1
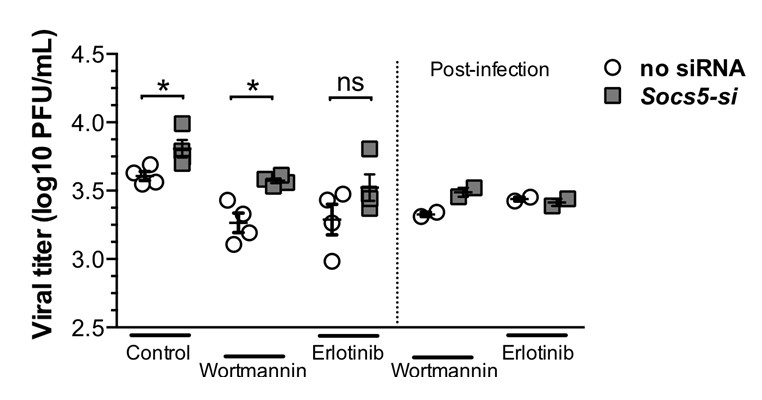
Primary hAECs- infected with H1N1.
Left-hand-side of graph: EGFR inhibitor (Erlotinib) and P13K inhibitor (Wortmannin) were added prior to influenza virus infection. Right-hand-side of graph: inhibitors were added after 1 h infection with H1N1 virus. Viral titres were determined by plaque assay, 24 h post-infection.
Author response image 2
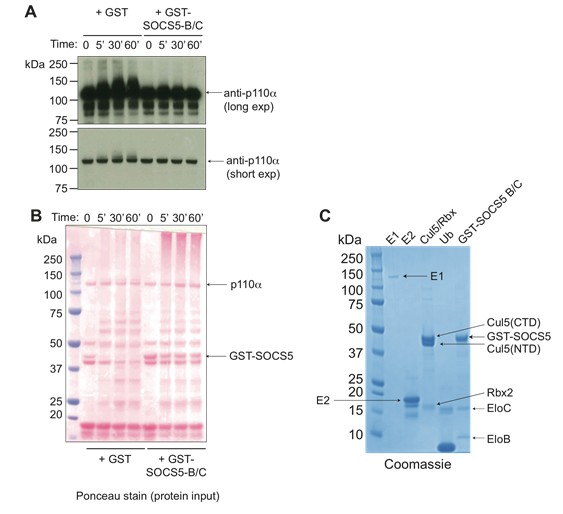
SOCS5 does not ubiquitinate PI3K p110α.
(A) Recombinant PI3K p110α (Promega) was incubated with the SOCS5-E3 ligase complex (GST-SOCS5-SH2-BC with Cullin5 and Rbx2) or GST alone as a control, together with ubiquitin, E1 and E2 enzymes at 37°C for the times indicated. Anti- PI3K p110α immunoblot of samples following in vitroubiquitination reaction, with longer and shorter exposures (exp). (B) Ponceau stain showing the protein input into each reaction. (C) Coomassie stain of all recombinant purified proteins. Recombinant SOCS5-SH2 domain was engineered to contain an N-terminal GST-tag and included the SOCS box sequences for increased stability and solubility when expressed as a ternary complex with elongins B and C, as described (Linossi et al., PLOS One 2013). Note that in the absence of SOCS5, some ubiquitination of PI3K p110α was observed indicating that all components were functional. Addition of SOCS5 blocked this reaction, with no SOCS5-mediated ubiquitination of PI3K p110α observed.
Author response image 3
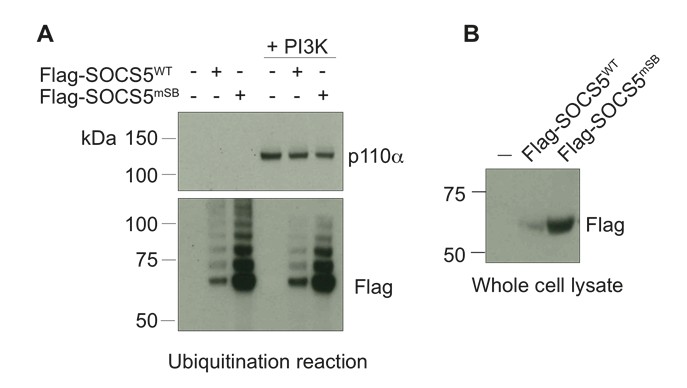
Full-length SOCS5 does not ubiquitinate PI3K p110α.
(A) Recombinant PI3K p110α (+PI3K; Promega) was incubated with either full-length Flag-SOCS5 (WT) or Flag-SOCS5 in which the Elongin C binding site was mutated to prevent E3 activity (mSB), together with Cullin5, Rbx2, ubiquitin, E1 and E2 enzymes at 37°C for 1 h. Anti-PI3K p110α immunoblot of proteins following the in vitro ubiquitination reaction. (B) Anti-Flag immunoblot shows levels of SOCS5 when expressed in 293T cells.
Tables
Table 1
Quantitative proteomic analysis showing differentially expressed proteins in lung lysates at day two post-infection.
| Accession number | Protein names | Gene name | Log2 protein ratio (−/−):(+/+) | Protein P-Value (−/−):(+/+) | #unique peptides (−/−) | #unique peptides (+/+) | |
|---|---|---|---|---|---|---|---|
| Q3UP42 | Protein S100-A9 | S100a9 | 2.90 | 2.94E-02 | 2 | 2 | NET-associated protein |
| P62806 | Histone H4 | Hist1h4a | 2.53 | 7.82E-03 | 4 | 3 | NET-associated protein |
| Q3UP87 | Neutrophil elastase* | Elane | 2.43 | 2.66E-02 | 2 | 1 | NET-associated protein |
| Q53 × 15 | Protein S100-A8 | S100a8 | 2.30 | 3.38E-04 | 3 | 3 | NET-associated protein |
| Q91XL1 | Leucine-rich alpha-2-glycoprotein | Lrg1 | 2.07 | 1.14E-02 | 3 | 0 | Neutrophil differentiation |
| Q61646 | Haptoglobin | Hp | 2.05 | 1.03E-04 | 13 | 9 | Produced by neutrophils |
| Q542I8 | Integrin beta 2 (Mac-1) | Itgb2 | 2.00 | 7.85E-03 | 6 | 1 | Induces Net formation |
| Q7TMS4 | Myeloperoxidase | Mpo | 1.97 | 4.18E-06 | 14 | 2 | NET-associated protein |
| P51437 | Cathelin-related antimicrobial peptide | Camp | 1.90 | 1.10E-02 | 3 | 1 | Highly expressed in neutrophils |
| Q4FJR3 | Lactotransferrin* | Ltf | 1.87 | 4.43E-11 | 26 | 13 | NET-associated protein |
| O08692 | Neutrophilic granule protein | Ngp | 1.76 | 1.10E-02 | 6 | 4 | In neutrophil granules |
| Q99K94 | Signal transducer and activator of transcription 1 | Stat1 | 1.68 | 5.80E-05 | 11 | 4 | Low in neutrophils – could be upregulated in response to IFN or EGFR? |
| P20152 | Vimentin | Vim | 1.67 | 1.99E-05 | 14 | 3 | NET-associated protein |
| Q3UV87 | Chitinase-3-like protein 3 (YM1) | Chi3l3 | 1.65 | 1.53E-06 | 9 | 6 | Produced by neutrophils |
| A0JLV3 | Histone H2B | Hist1h2bj | 1.32 | 9.49E-04 | 3 | 3 | NET-associated protein |
| G3 × 9V0 | Proteasome activator complex subunit 2 | Psme2 | 1.63 | 1.36E-02 | 7 | 5 | |
| Q5RKN9 | F-actin-capping protein subunit alpha-1 | Capza1 | 1.65 | 1.48E-02 | 4 | 2 | Neutrophil protein which inhibits actin polymerisation |
| Q8VCC1 | 15-hydroxyprostaglandin dehydrogenase [NAD(+)] | Hpgd | 1.63 | 1.87E-03 | 3 | 1 | Not in neutrophils? |
| Q3UAZ7 | High mobility group protein B2 | Hmgb2 | 1.62 | 3.03E-04 | 4 | 2 | Hmgb1: component of neutrophil NET filaments/induces NET formation |
| Q8BH61 | Erythrocyte membrane protein band 4.2 | Epb4.2 | 1.51 | 7.57E-03 | 5 | 1 | Neutrophil protein |
| F8WIX8 | Histone H2A | Hist1h2al | 1.44 | 1.73E-02 | 2 | 2 | NET-associated protein |
| Q6PEN2 | Protein Gbp6 | Gbp6 | 1.41 | 1.36E-03 | 3 | 1 | Not in neutrophils? |
| Q9Z2I8-2 | Succinyl-CoA ligase subunit beta | Suclg2 | −1.36 | 4.19E-03 | 1 | 3 |
-
* indicates the detection of citrullinated peptides.
-
Note: Given that trypsin cleaves at arginine and lysine residues and citrullination is a modification of arginine, it is likely that citrullination impacts on the efficiency of the tryptic digest. Hence, we may be underestimating the number of citrillinated proteins present.
Table 2
Proteomic analysis of SOCS5 immunoprecipitates.
| Summed peptide intensity | #unique peptides | |||||||||||||
|---|---|---|---|---|---|---|---|---|---|---|---|---|---|---|
| Accession number | Protein names | Gene names | SOCS5* | Vector | SOCS5 | Vector | ||||||||
| P27986 | PI3K p85 β | PIK3R2 | 5.63E + 07 | 2.31E + 07 | 6.18E + 07 | 0 | 0 | 0 | 6 | 2 | 7 | 0 | 0 | 0 |
| O00459 | PI3K p85 α | PIK3R1 | 5.57E + 07 | 2.60E + 07 | 7.02E + 07 | 0 | 0 | 0 | 7 | 2 | 6 | 0 | 0 | 0 |
| P42338 | PI3K p110 β | PIK3CB | 8.07E + 06 | 1.00E + 00 | 1.18E + 07 | 0 | 0 | 0 | 3 | 0 | 4 | 0 | 0 | 0 |
| O54928 | SOCS5 | SOCS5 | 1.06E + 10 | 1.20E + 10 | 2.00E + 10 | 0 | 0 | 0 | 32 | 30 | 37 | 0 | 0 | 0 |
| Q93034 | Cullin-5 | CUL5 | 1.08E + 10 | 7.01E + 09 | 1.31E + 10 | 0 | 0 | 0 | 54 | 46 | 51 | 0 | 0 | 0 |
| Q9UBF6 | RBX2 | RNF7 | 7.23E + 08 | 4.36E + 08 | 1.10E + 09 | 0 | 0 | 0 | 4 | 3 | 4 | 0 | 0 | 0 |
| Q15369 | ElonginB | TCEB1 | 1.41E + 09 | 9.89E + 08 | 8.69E + 08 | 0 | 0 | 4.78E + 06 | 5 | 5 | 5 | 0 | 0 | 1 |
| Q15370 | ElonginC | TCEB2 | 2.92E + 09 | 1.40E + 09 | 3.30E + 09 | 0 | 0 | 0 | 10 | 7 | 8 | 0 | 0 | 0 |
-
* Data are shown from replicate samples.
Table 3
Subject characteristics.
| Healthy | COPD | Smoker | P – value | |
|---|---|---|---|---|
| Number | 5 | 5 | 5 | NA |
| Sex (% Female) | 60% | 60% | 40% | p=0.6 |
| Mean Age (S.D.) | 61 (16.29) | 68 (12.35) | 64.33 (12.82) | p=0.07 |
| Mean FEV1 (S.D.) * | 98% (8.61) | 43% (10.63) | 97.5% (10.30) | p<0.001 |
| Cigarette (Packs/year; S.D.) | 0 | 43 (10.66) | 23 (11.54) | p<0.001 |
| Years abstinent (S.D.) | 0 | 12.35 (5.28) | 0 | NA |
| ICS (percent treated) | 0 | Seretide/Tiotropium/Salbutamol (60%) Tiotropium (40%) | 0 | NA |
-
* FEV1 refers to the forced expiratory volume in 1s expressed as a percentage of the predicated value.
-
The statistical analysis used for this table is ANOVA for multiple groups.
-
NA = Not applicable.
Download links
A two-part list of links to download the article, or parts of the article, in various formats.
Downloads (link to download the article as PDF)
Open citations (links to open the citations from this article in various online reference manager services)
Cite this article (links to download the citations from this article in formats compatible with various reference manager tools)
Suppressor of cytokine signaling (SOCS)5 ameliorates influenza infection via inhibition of EGFR signaling
eLife 6:e20444.
https://doi.org/10.7554/eLife.20444


