A molecular mechanism for the topographic alignment of convergent neural maps
- University of Strasbourg, France
- Cambridge Computational Biology Institute, University of Cambridge, United Kingdom
- University of Strasbourg Institute of Advanced Study, France
- The Salk Institute for Biological Studies, United States
Figures
Figure 1 with 1 supplement
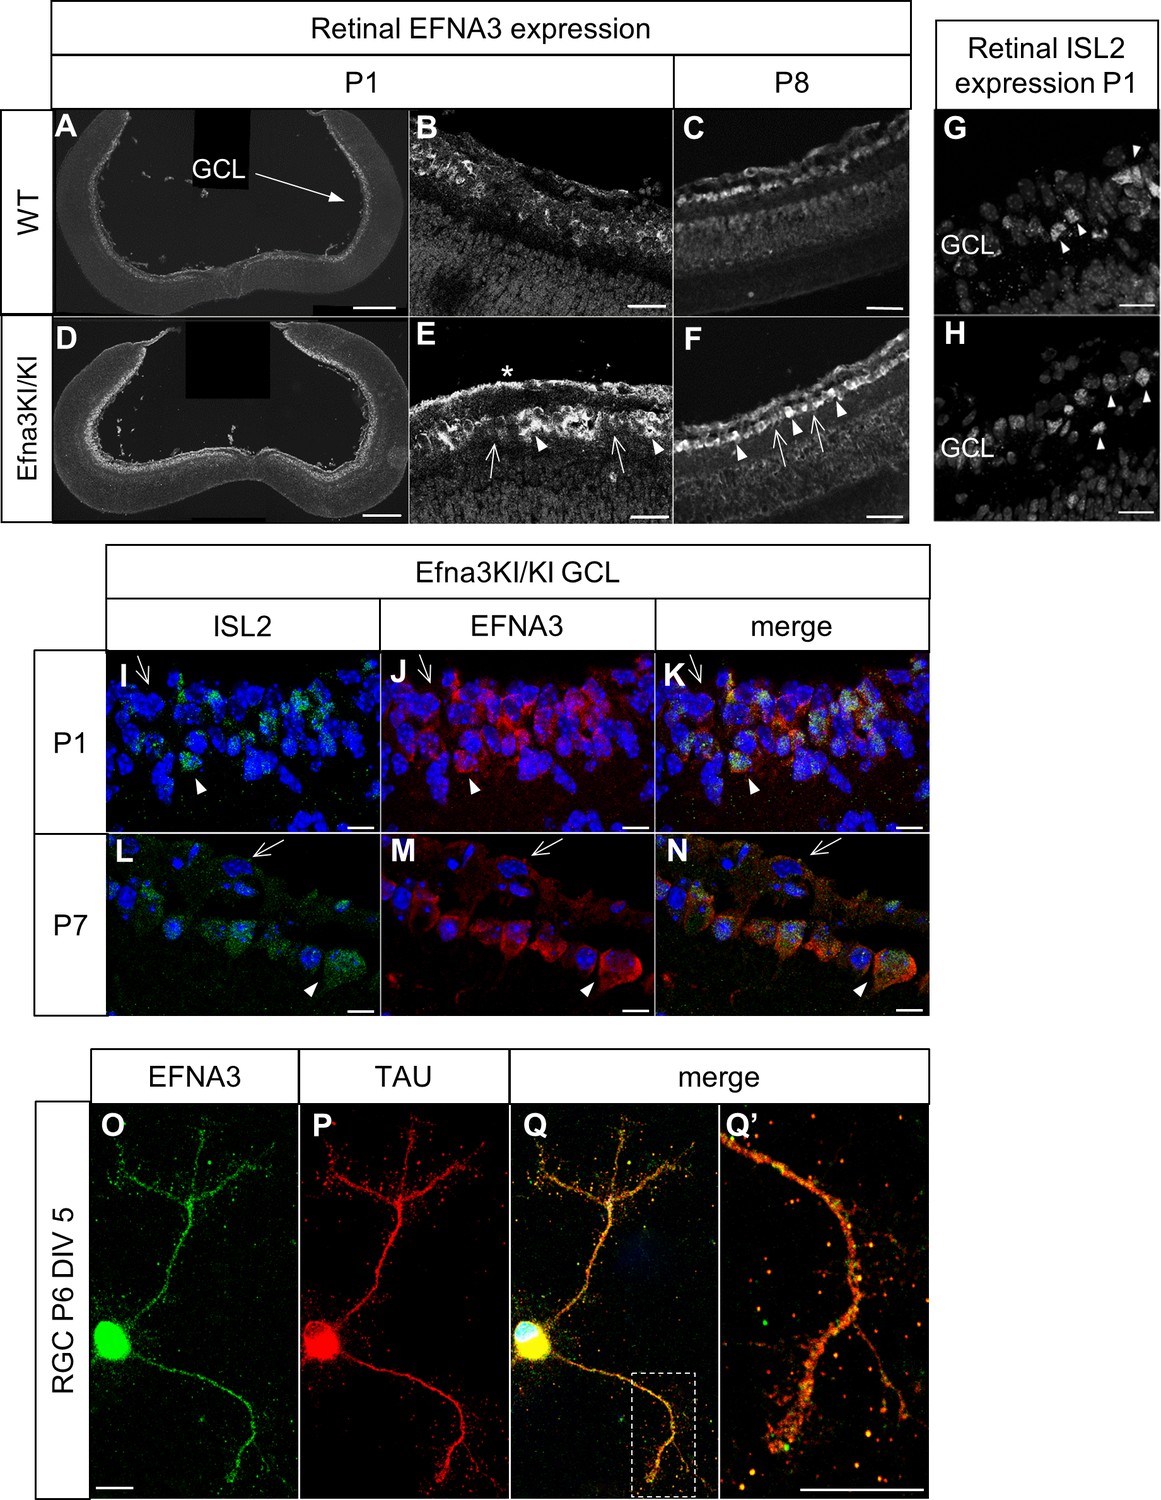
Validation of the Efna3 KI model I.
(A–F) Immunochemical staining using anti-EFNA3 (LS-C6547, LS-Bio) in P1 (A, B) and P8 (C) WT (n = 3 animals) and P1 (D, E) and P8 (F) Efna3KI/KI (n = 5 animals) RGCs. In (E, F) arrows indicate EFNA3 WT expression level in RGCs, arrowheads indicate putative ectopic (knock-in) EFNA3 expression in RGCs. The asterisk highlights strong EFNA3 labelling in the RGC fiber layer. Scale bars represent 200 μm (A, D), 20 μm (B–F). (G–H) Immunostaining of ISL2 in P1 WT (n = 3 animals) (G) and Efna3KI/KI (n = 5 animals) (H) RGCs in the ganglion cell layer. Arrowheads indicate ISL2(+) RGCs. Scale bars represent 20 μm. (I–N) Immunostaining of ISL2 (I, L), EFNA3 (LS-C6547, LS-Bio) (J, M) and merged (K, N) in P1 and P7 Efna3KI/KI (n = 5 animals) RGCs. Arrowheads indicate ISL2(+) RGCs with high EFNA3. Arrows indicate ISL2(-) RGCs with wild-type EFNA3 level. Scale bars represent 10 µm. (O, Q’) EFNA3 (LS-C6547, LS-Bio) (O, Q, Q’) and axonal marker TAU (P, Q, Q’) co-immunostaining on P6 RGC in culture (DIV 5) (n = 3 animals). (Q’) shows an EFNA3/TAU co-labelled RGC axon at higher magnification. Scale bars represent 10 µm. GCL, ganglion cell layer; RGC, retinal ganglion cell; DIV, days in vitro; WT, wild-type.
Figure 1—figure supplement 1
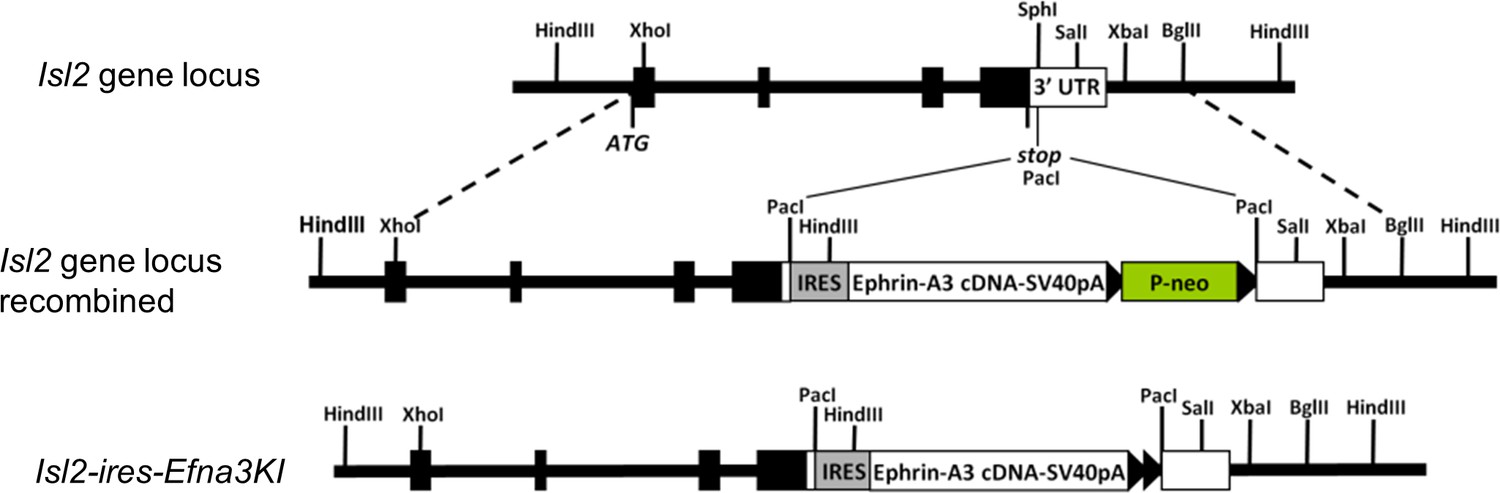
Scheme of the knock-in strategy generating the Isl2-ires-Efna3 mutant mouse.
https://doi.org/10.7554/eLife.20470.003
Figure 2
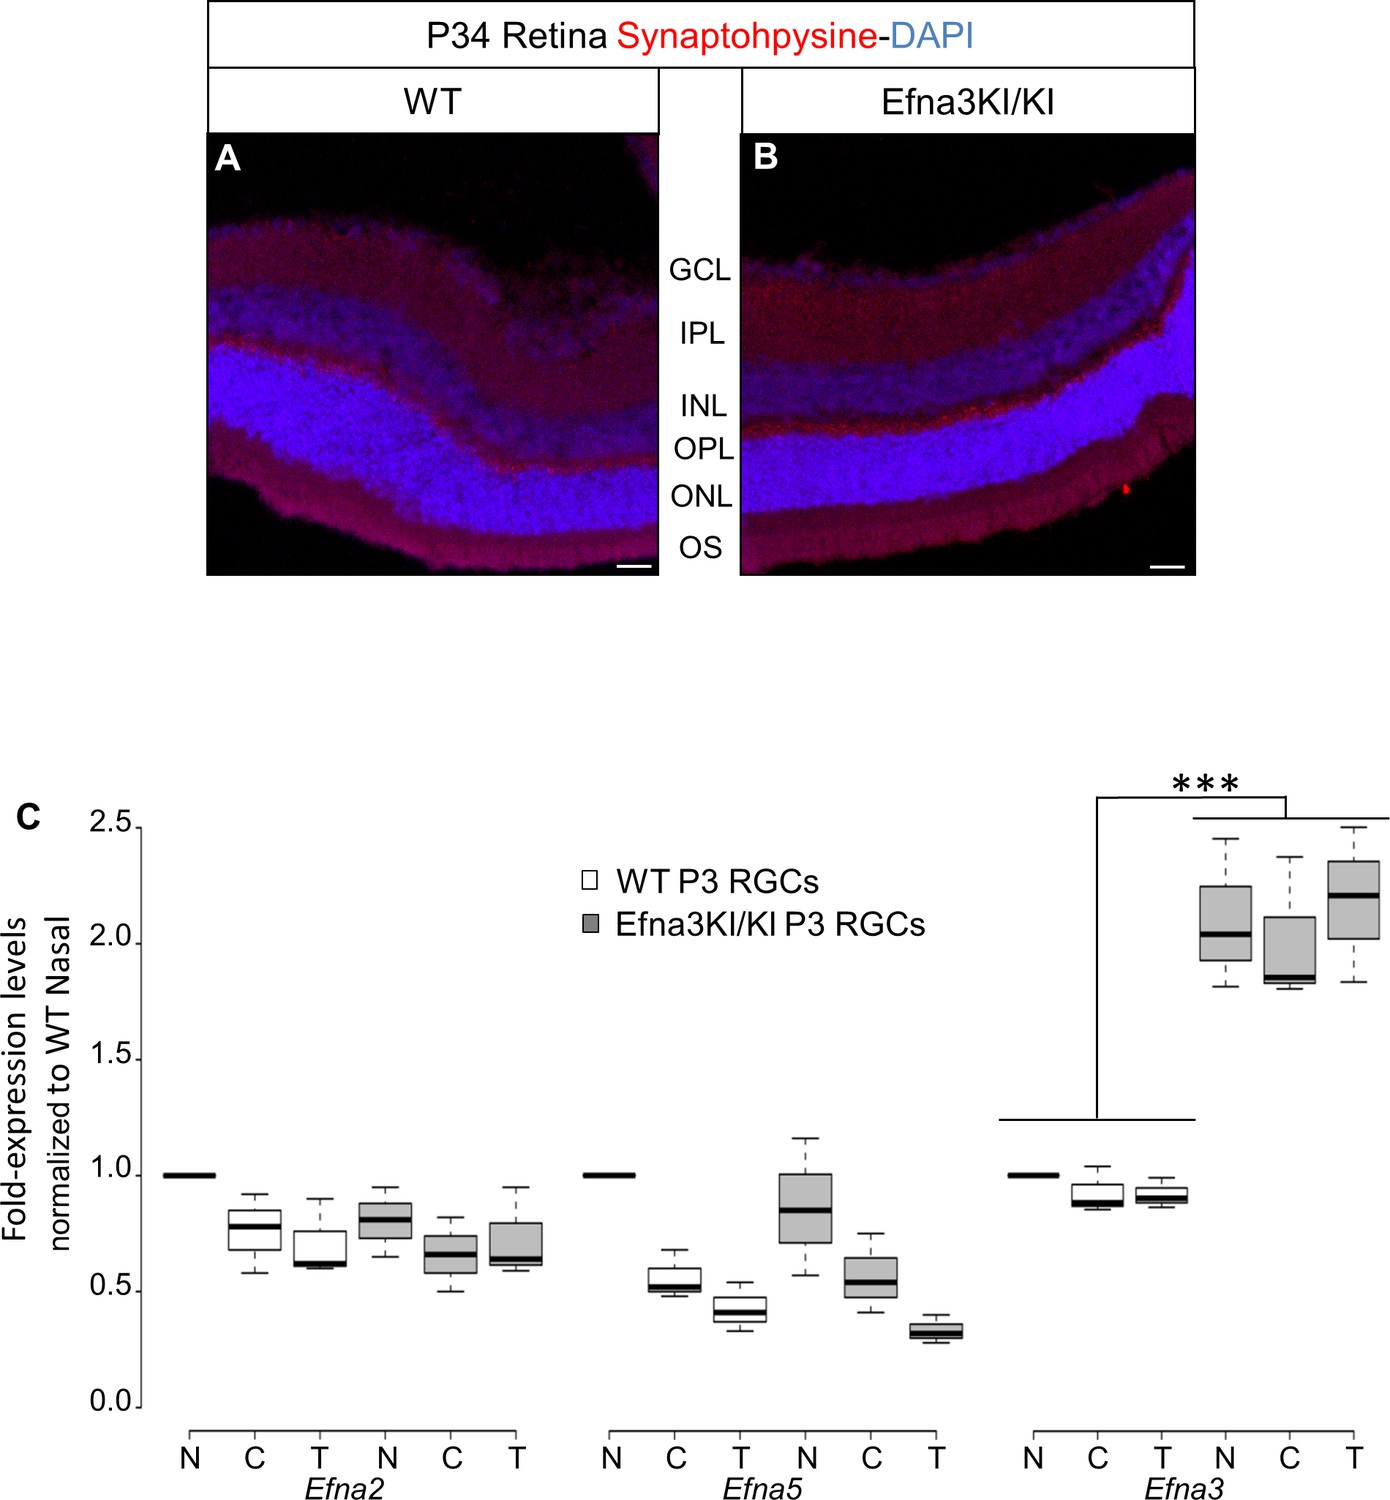
Validation of the Efna3 KI model II.
(A, B) Synaptophysin (red) and DAPI (blue) staining in P34 WT (n = 4 animals) (A) and Efna3KI/KI (n = 4 animals) (B) retinas. Scale bars represent 50 µm. (C) Efna mRNAs relative to nasal WT quantified in acutely isolated RGCs from nasal (N), central (C) and temporal (T) retinas and normalized against Gapdh and Hprt in P3 WT and Efna3KI/KI (WT, n = 6 animals/12 retinas; Efna3KI/KI, n = 8 animals/16 retinas, variables are normally distributed, two-way ANOVA: Efna2 genotype F11,3 = 1.79, p = 0.11; Efna5 genotype F11,3 = 2.08, p = 0.07; Efna3 genotype F11,3 = 8.11, ***p<0.001). WT, wild-type; GCL, ganglion cell layer; IPL, inner plexiform layer; INL, inner nuclear layer; OPL, outer plexiform layer; ONL, outer nuclear layer; OS, outer and inner segments; RGCs, retinal ganglion cells.
Figure 3 with 2 supplements
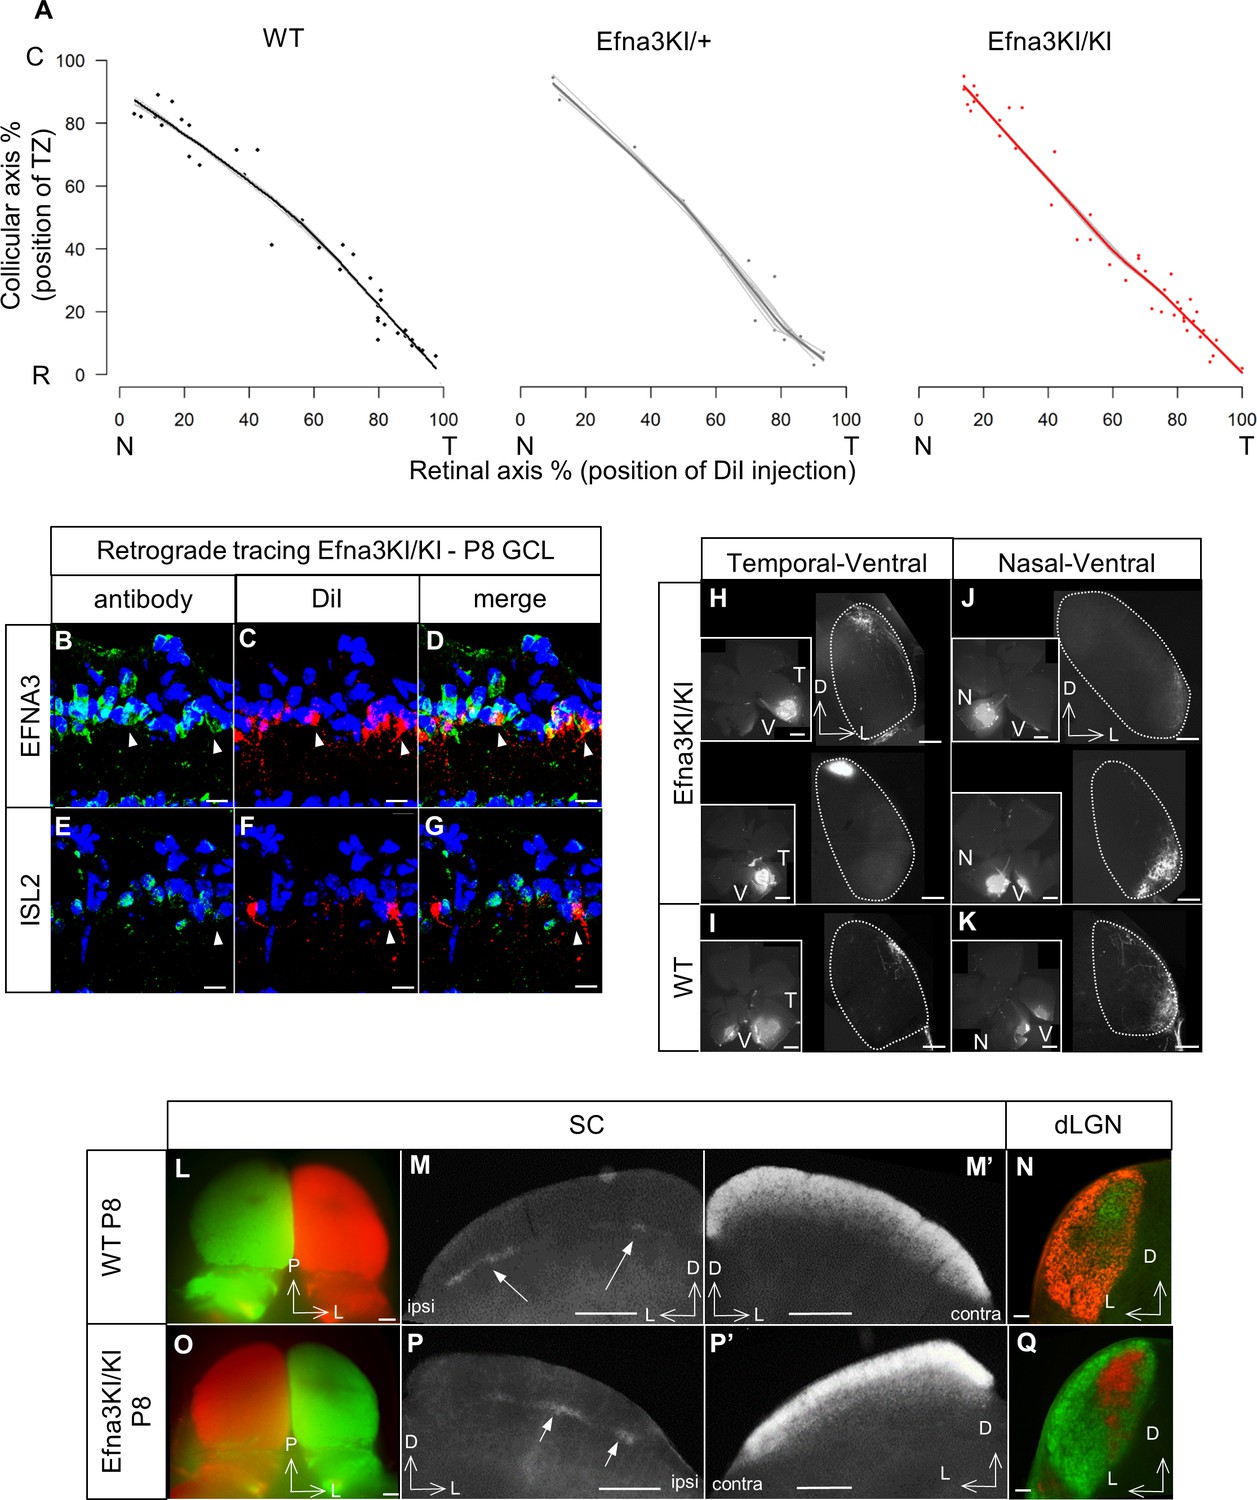
Retinal anterograde mapping and retrograde DiI labelling in P8 animals.
(A) Retino-collicular maps generated by the Leave-One-Out method at P8 in WT (n = 38 animals), Efna3KI/+ (n = 15 animals) and Efna3KI/KI (n = 43 animals) mutants. Grey lines represent each map for each leave-one-out run. Each dot represents an individual mouse. (B–G) P8 DiI retrograde labelling (red) coupled to immuno-staining (green) of EFNA3 (B–D) and ISL2 (E–G) in Efna3KI/KI (n = 4 animals) mutant retinas. Arrowheads indicate ISL2(+) / high EFNA3 DiI labelled RGCs. Scale bars represent 10 µm. (H–K) Anterograde labelling after focal DiI injections in the retina showing retino-geniculate projections from the temporal-ventral (T–V) (H, I) and nasal-ventral (N–V) (J, K) retinal quadrants between Efna3KI/KI (H, J), (n = 4 animals) and WT (I), (K), (n = 4 animals) P8 littermates. Scale bars represent 400 µm. (L–Q) Anterograde labelling after full-eye injections showing eye-segregation in P8 WT (n = 3 animals) SCs (whole-mount top view: L); coronal sections: M, (M’) and dLGN (N) and in Efna3KI/KI (n = 4 animals) SCs (whole-mount top view: O); coronal sections: P, (P’) and dLGN (Q). Scale bars represent 250 µm (L–P’), 100 μm (N, Q). WT, wild-type; GCL, ganglion cell layer; T, temporal; N, nasal; R, rostral; C, caudal; dLGN, dorsal lateral geniculate nuclei; SC, superior colliculus.
Figure 3—figure supplement 1
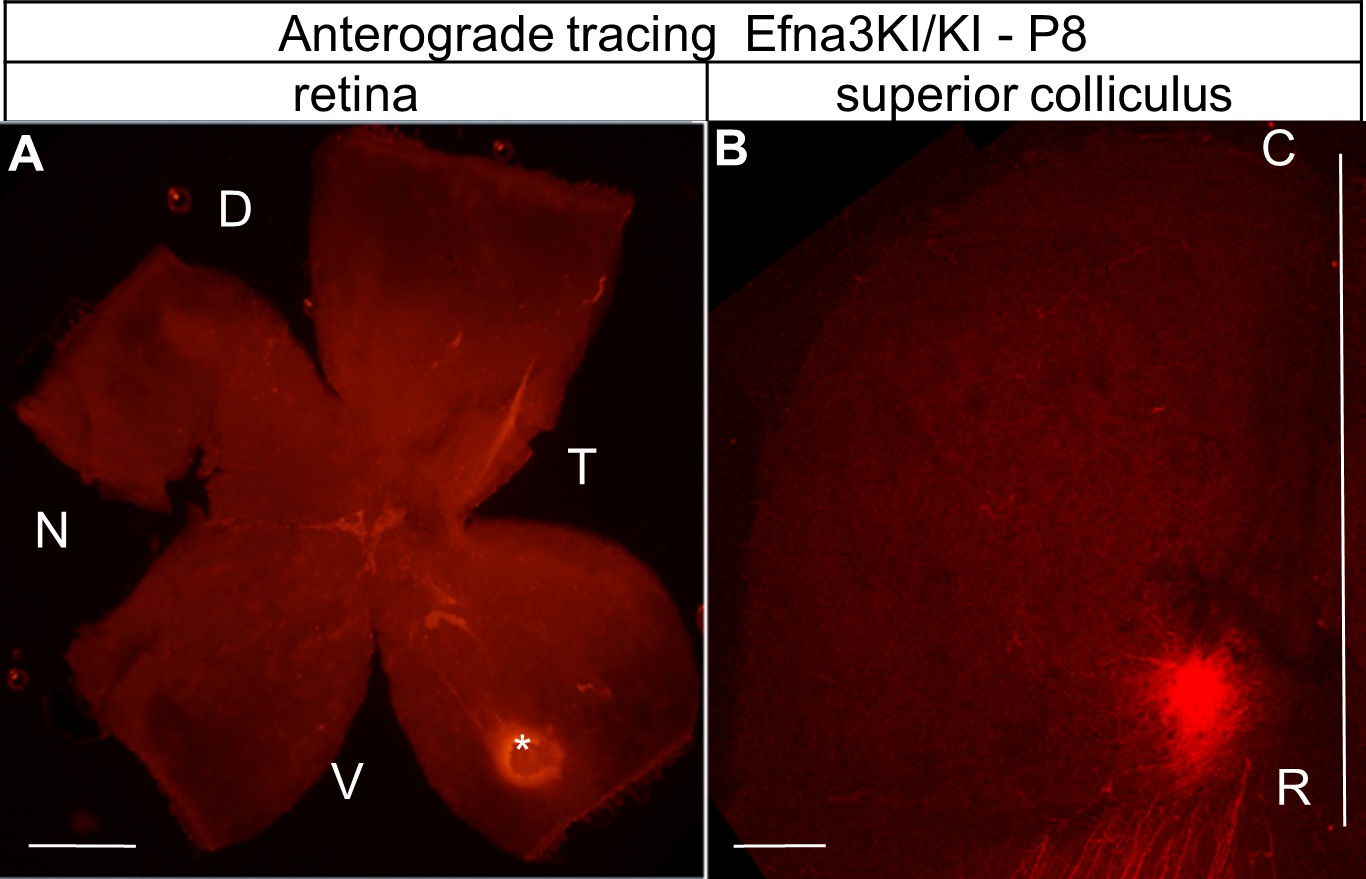
Anterograde DiI labelling showing the focal injection in the retina (white star in A) and the corresponding termination zones in the SC (B).
Scale bars represent 400 µm. D, dorsal; N, nasal; T, temporal, V, ventral; R, rostral; C, caudal; SC, superior colliculus.
Figure 3—figure supplement 2
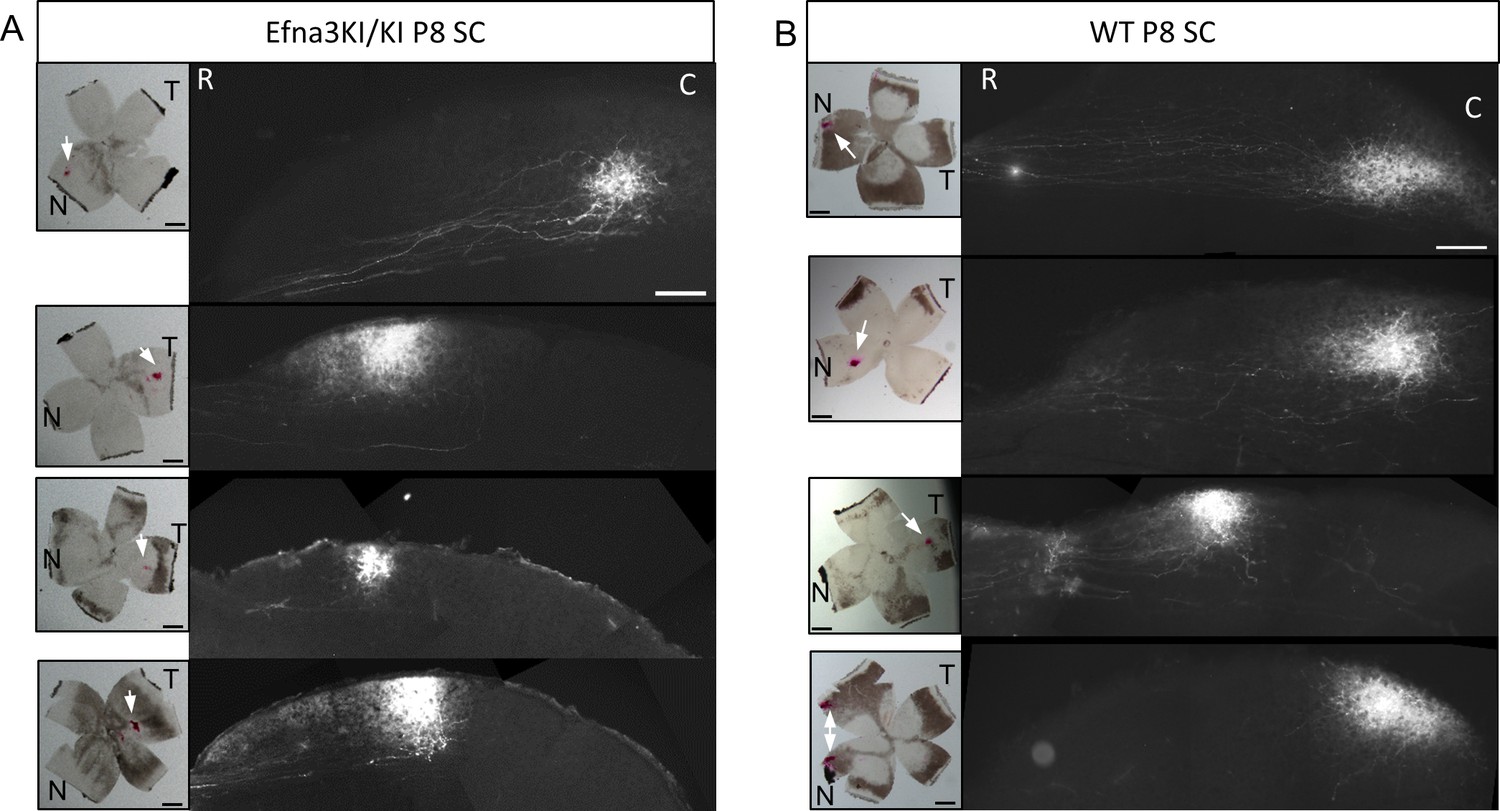
Representative examples of collicular parasagittal sections showing labelled anterograde retinal termination zones in P8 Efna3KI/KI (A) and WT (B) littermates.
Insets show the corresponding retinal DiI injection indicated by a white arrow. Scales bars represent 400 µm. N, nasal; T, temporal; R, rostral, C, caudal; SC, superior colliculus; WT, wild-type.
Figure 4 with 4 supplements
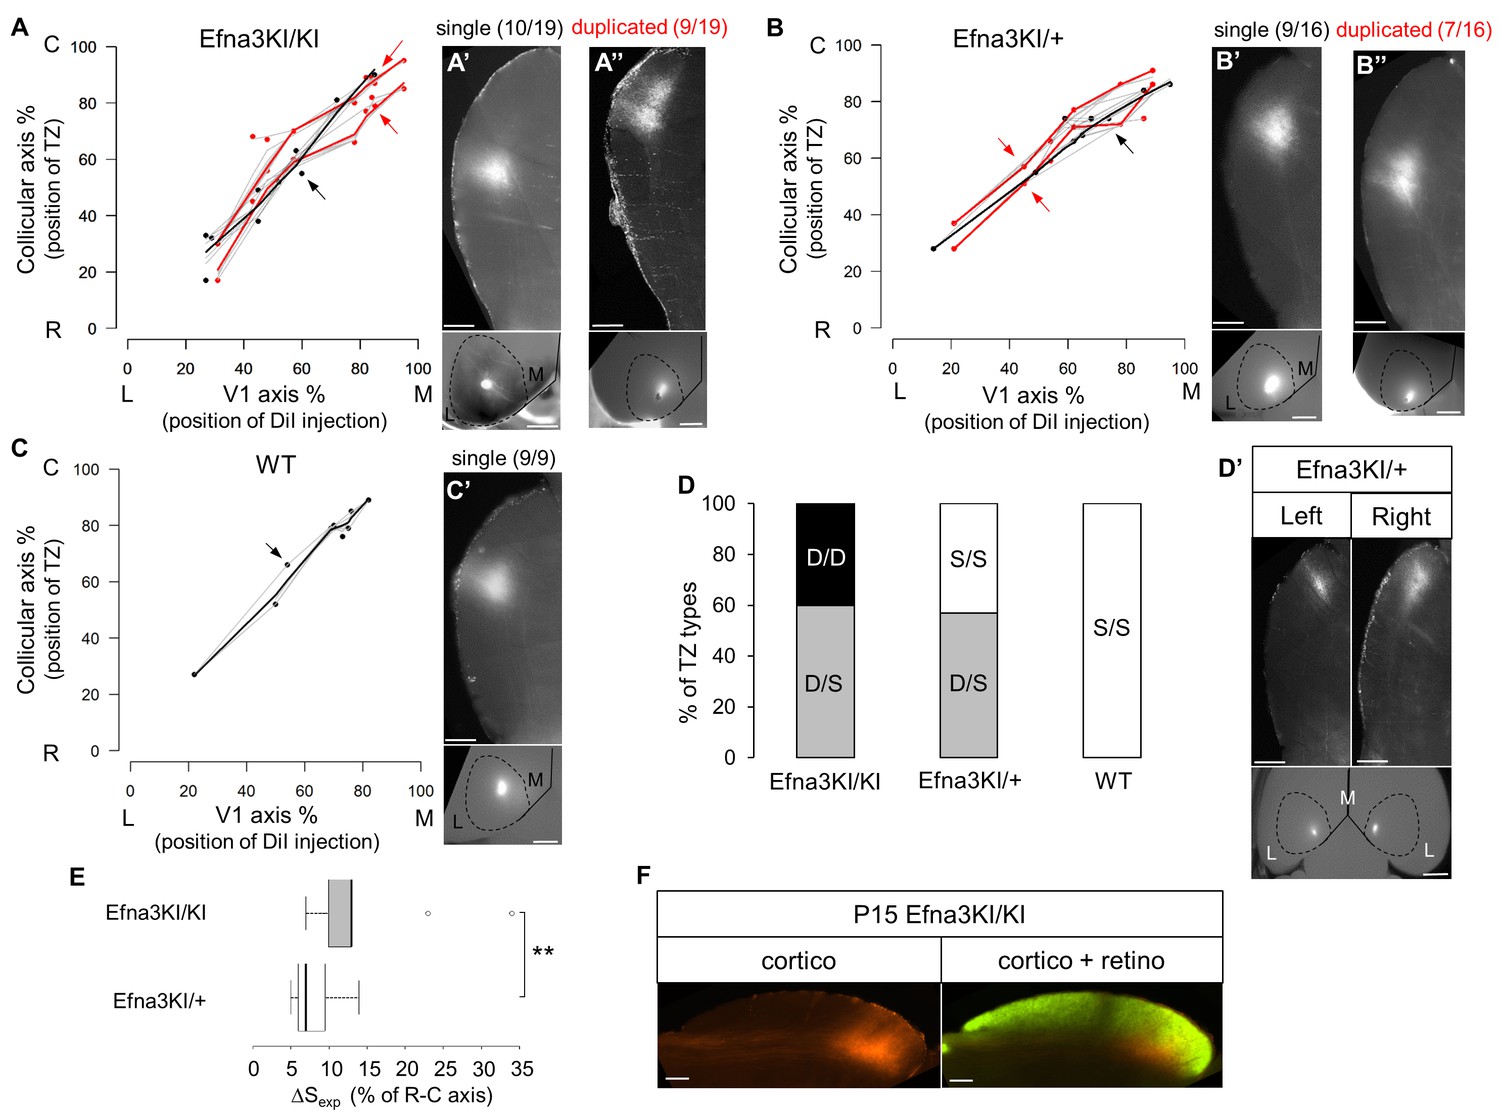
Anterograde cortico-collicular mapping in P14 animals.
(A–C) Cortico-collicular maps generated by the Leave-One-Out method at P15 in Efna3KI/KI (n = 19 animals) (A), Efna3KI/+ (n = 16 animals) (B) and WT (n = 9 animals) (C) mutant littermates. Grey lines represent each map for each leave-one-out run for duplicated and single maps. Each dot represent an individual mouse. (A’–C’) show examples of single (A’, B’, C’) and duplicated (A’’, B’’) cortical TZs in collicular sagittal sections from different genotype together with the corresponding injections in V1 (lower panels in A’–C’). The corresponding coordinates are labelled by red arrows (duplicated) or a black arrow (single). Scale bars represent 400 µm (A’–C’), 1 mm (insets in A’–C’). (D–D’) Percentage of heterogeneous duplicated/single (D/S) or homogeneous single/single (S/S) or duplicated/duplicated (D/D) projections in both colliculi of the same animal (D) (Efna3KI/KI, n = 5 animals; Efna3KI/+, n = 7 animals; WT, n = 4 animals). (D’) shows an example of cortico-collicular TZs from left and right colliculi and corresponding V1 injections in a P15 Efna3KI/+ animal. Scale bars represent 400 µm (for colliculi), 1 mm (for V1). (E) Mean separation between duplicated maps measured experimentally (ΔSexp) in Efna3KI/KI (median = 13%, 1stquartile = 10%, third quartile = 13%, n = 9 animals) and Efna3KI/+ (median = 7%, 1stquartile = 6%, third quartile = 9.5 % n = 7 animals) (non-parametric Mann and Whitney test, **p=0.020). (F) Sagittal section of P15 Efna3KI/KI (n = 4 animals) DiI labelled cortical projection (left) and merged image of CTB-488 full-eye fill and cortical DiI projection (right). Scale bars represent 200 µm. L, lateral; M, medial; R, rostral; C, caudal; S, single; D, duplicated; TZ, termination zone; WT, wild-type.
Figure 4—figure supplement 1
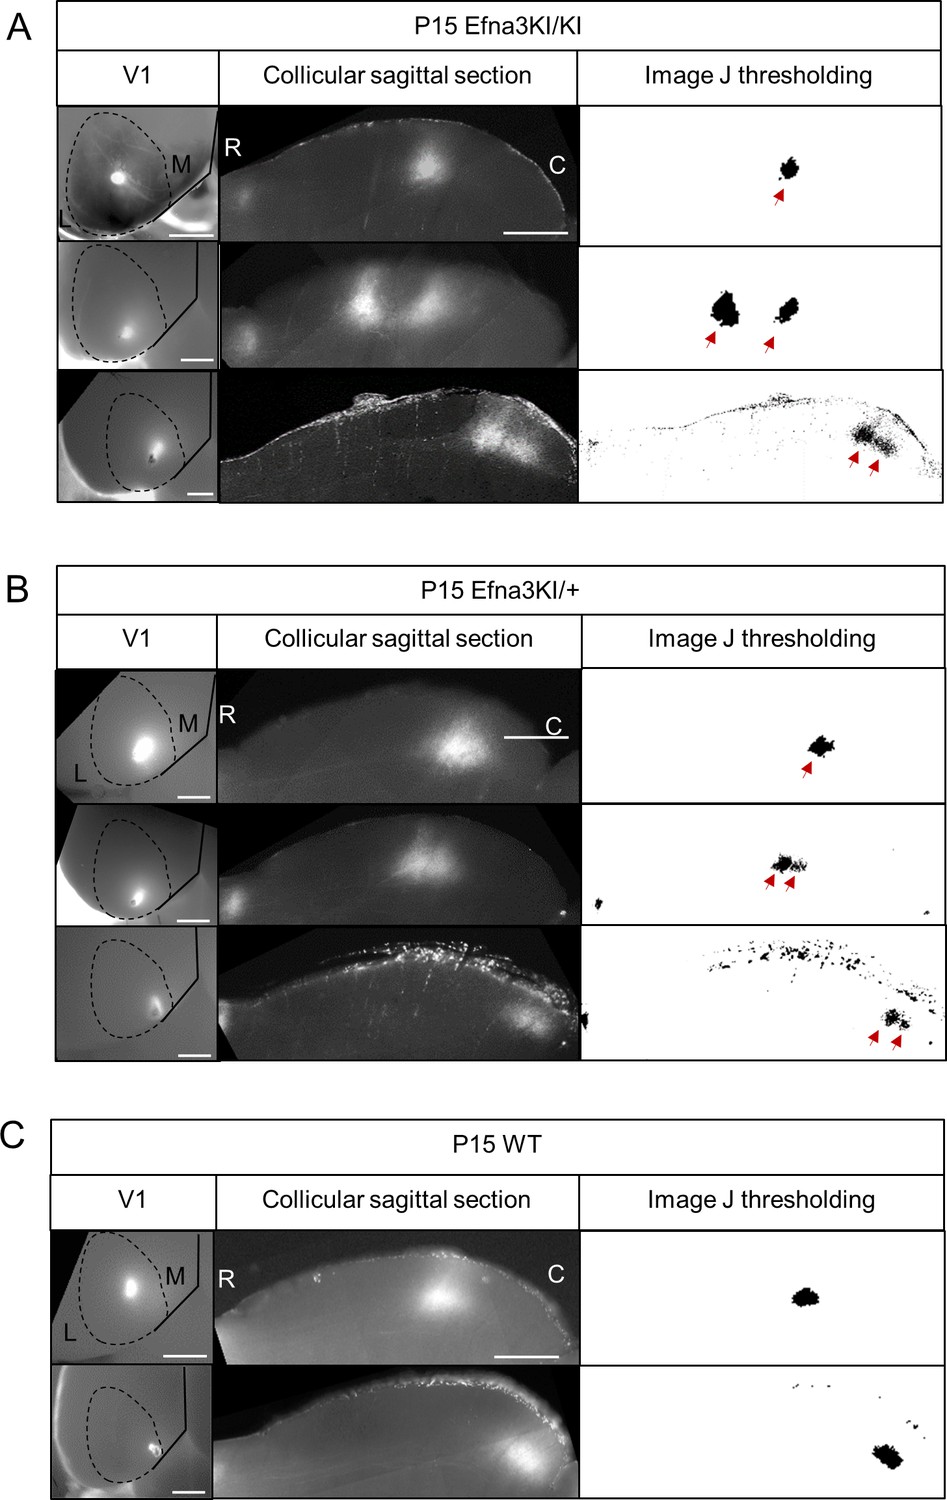
Representative examples of collicular parasagittal sections showing cortical terminations zones and the corresponding injections in V1 in Efna3KI/KI (A), Efna3KI/+ (B) and WT (C) P15 littermates.
White panels show the termination zones analyses using ImageJ. Scale bars represent 1 mm (V1 whole-mount), 500 μm (SC), R: rostral, C: caudal, L: lateral, M: medial; WT, wild-type.
Figure 4—figure supplement 2
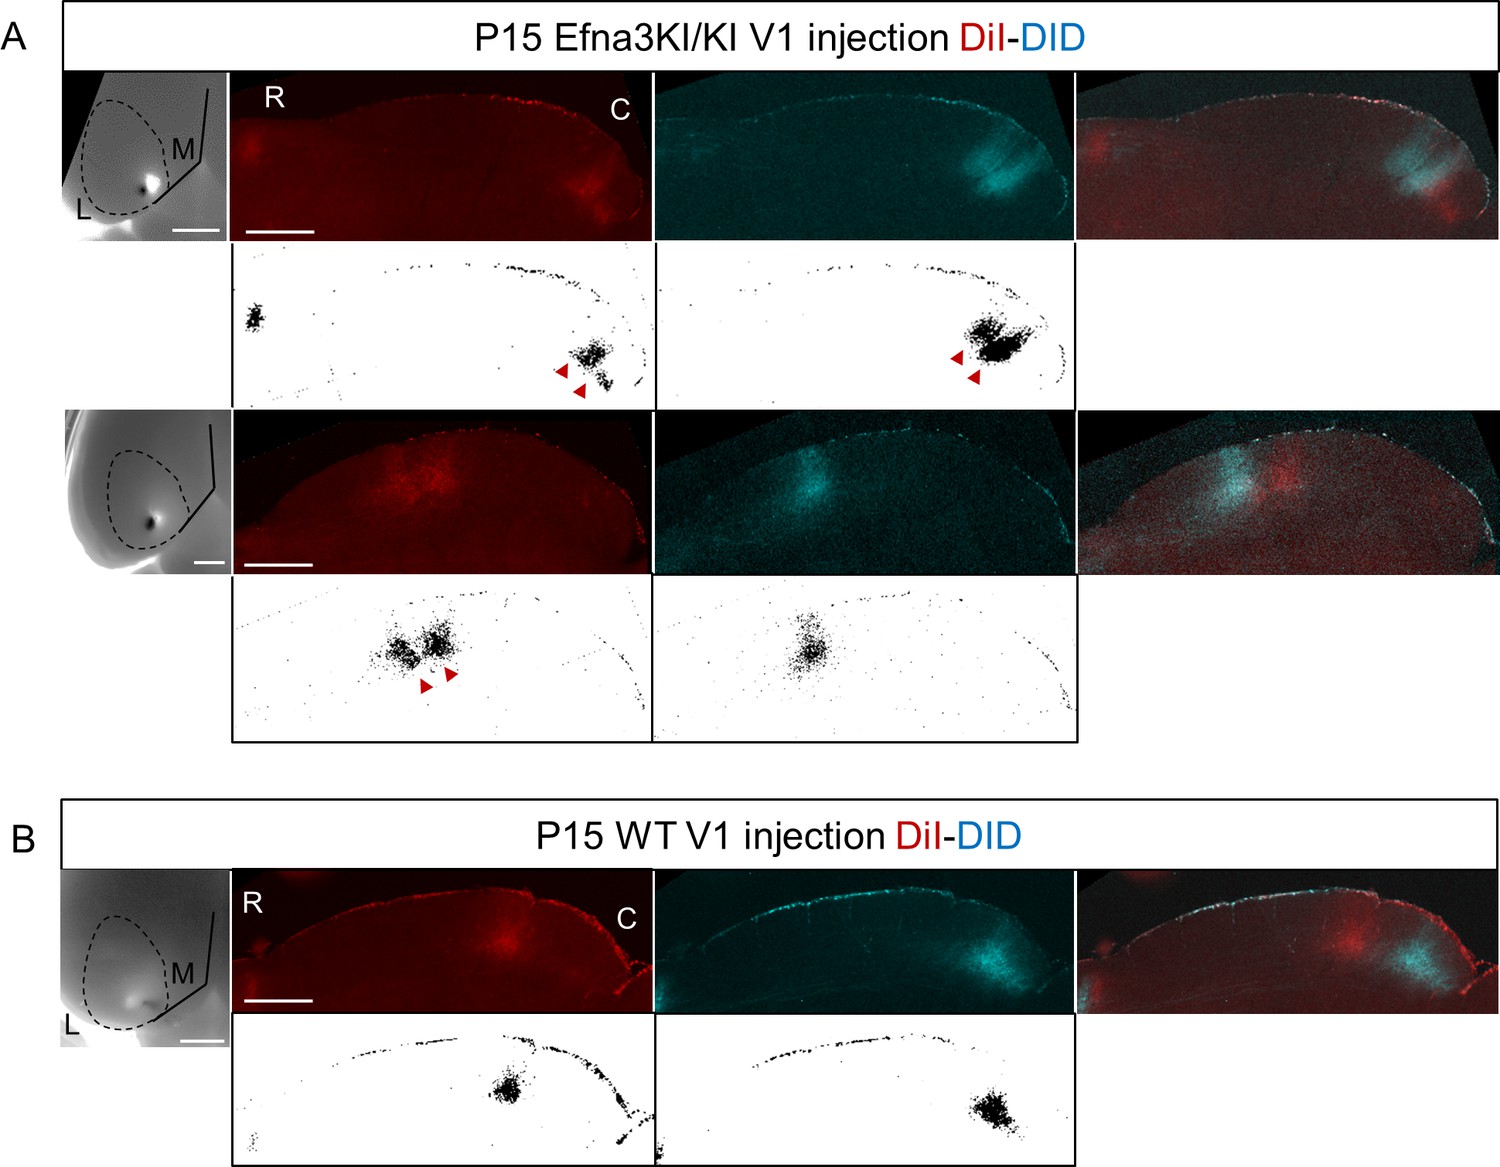
Collicular termination zones on parasagittal sections revealed after double DiI – DiD V1 anterograde injections in P15 Efna3KI/KI (A) and WT (B).
White panels show the corresponding ImageJ termination zones analyses. Scale bars represent 1 mm (V1) SC, 500 µm (SC). R, rostral; C, caudal; L, lateral; M, medial; SC, superior colliculus; WT, wild-type.
Figure 4—figure supplement 3

Immunostaining revealing EFNA3 expression (green) in P3 (A, D) and P8 (B–F) Efna3KI/KI and WT SC parasagittal sections after retinal anterograde DiI injection (red fibers).
Scale bars represent 30 µm (A, D), 10 μm (B - F).
Figure 4—figure supplement 4
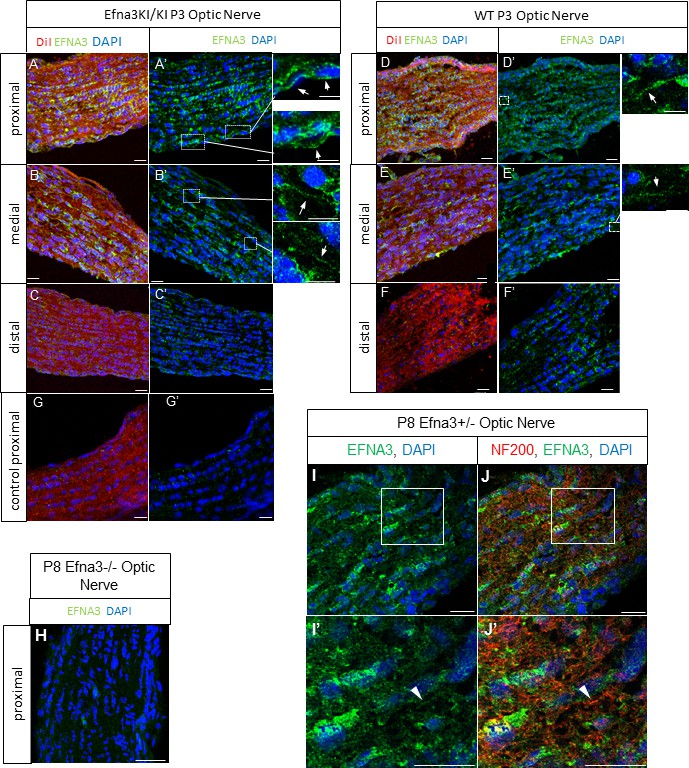
EFNA3 expression in Efna3 mutants and WT optic nerves.
(A–F) Immunohistochemical staining revealing EFNA3 expression (green) in P3 and P8 Efna3KI/KI and WT SC parasagittal sections after retinal anterograde DiI injection (red fibers). Scale bars represent 30 μm (A, D), 10 μm (B - F). (H) Absence of EFNA3 in P8 Efna3-/- proximal optic nerve. Scale bar represents 20 µm. (I–J’) Co-immunostaining of EFNA3 (green) (I–J’) and NF200 (red) (J, J’) on P8 Efna3+/- proximal optic nerves validating the specificity of the antibody staining. Insets in (I) and (J) correspond to (I’) and (J’) respectively. Arrowhead in (I’) and (J’) show co-stained fibers. Scale bars represent 20 µm.
Figure 5 with 1 supplement
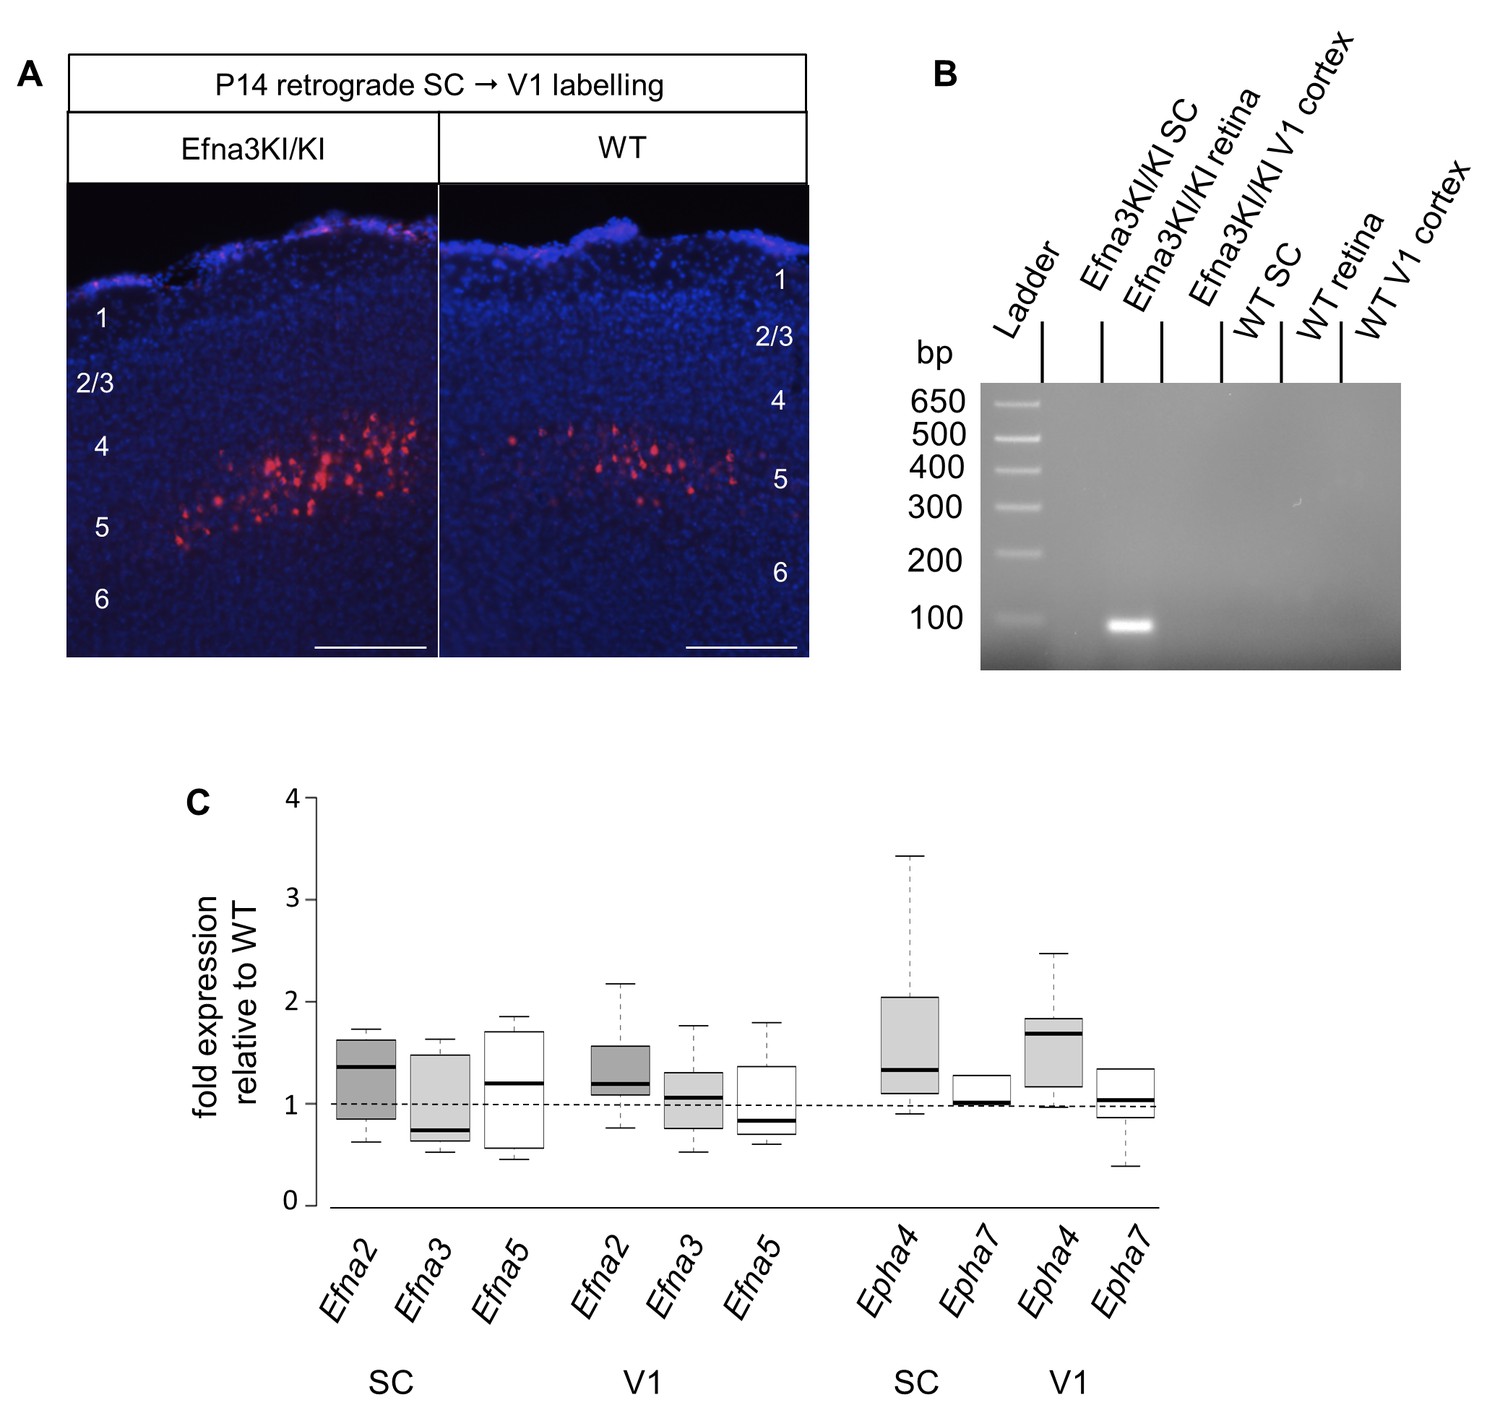
V1 retrograde labelling and Ephas/Efnas quantitative expression in V1 and SC.
(A) Retrograde labelling by collicular DiI injection in P14 Efna3KI/KI (n = 4 animals) and WT (n = 3 animals) showing the localization of the projecting V1 cortical neurons in layer V (DiI, red; DAPI, bue). Scale bars represent 100 µm. (B) PCR amplification products from P7 RNA (35 cycles) in Efna3KI/KI (n = 3 animals per genotype). A single amplicon of 90 bp, corresponding to an amplified sequence located in the ires cassette of the targeted construct, is observed only in Efna3KI/KI retina. (C) Box-plot of Efna2/a3/a5 and Epha4/a7 mRNA fold-expression levels relative to wild-type (WT) at P7 in the superior colliculus and V1 cortex of Efna3KI/KI mutants (n = 4 animals for each genotype, two colliculi/V1 per animal, variables are normally distributed, one sample t-test: superior colliculus: Efna2, p = 0.17; Efna3, p = 0.48; Efna5, p = 0.50; Epha4, p = 0.09; Epha7, p = 0.26 – V1 cortex: Efna2, p = 0.09; Efna3, p = 0.61; Efna5, p = 0.84; Epha4, p = 0.07; Epha7, p = 0.58).
Figure 5—figure supplement 1

EFNA3/DAPI immunohistochemical staining in P3 (A – A’, (C, C’) and P8 (B – B’, (D), (D’ E) Efna3KI/KI (A – B’), WT (C – D’) and Efna3-/- (E) SCs sagittal sections.
R, rostral; C, caudal. Scale bars represent 200 µm (A–D’), 100 µm (E).
Figure 6 with 1 supplement
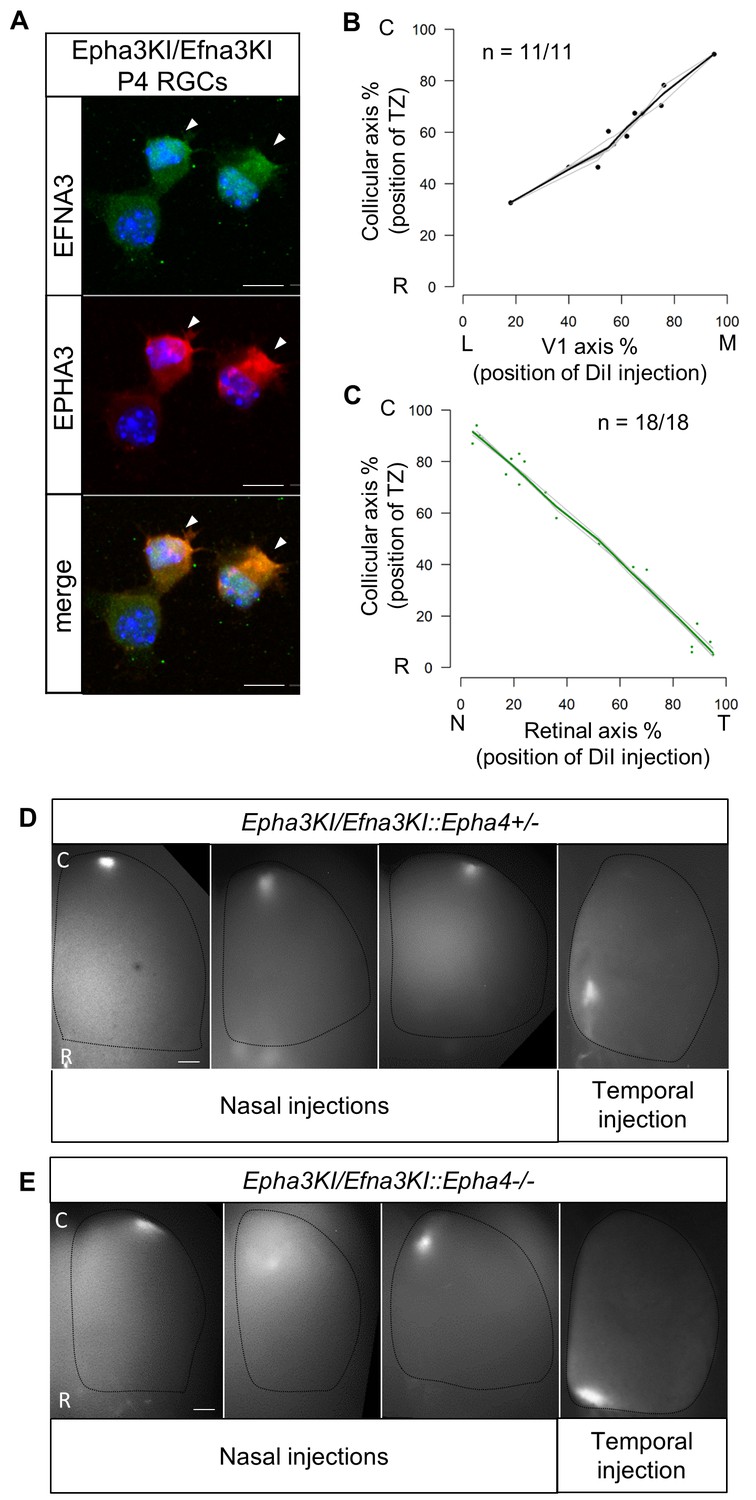
Retino- and cortico-collicular maps in Epha3KI/Efna3KI double heterozygous and compound Epha3KI/Efna3KI::Epha4 knock-in/out mutants.
(A) Co-immunostaining of EFNA3 (LS-C6547, LS-Bio; green) and EPHA3 (red) in P4 acutely isolated Epha3KI/Efna3KI (n = 8 animals/15 retinas) RGCs. Arrowheads indicate EPHA3/EFNA3 co-expression in the same RGCs. Scale bars represent 10 µm. (B, C) Cortico-collicular (n = 11 animals) (B) and retino-collicular (n = 18 animals) (C) maps generated by the Leave-One-Out method at P15 and P8 respectively in Epha3KI/Efna3KI double mutants. (D, E) Examples of retino-collicular projections for nasal and temporal retinal injections in P8 Epha3KI/Efna3KI::Epha4+/- (n = 6 animals) (D) and Epha3KI/Efna3KI::Epha4-/- (n = 6 animals) (E) mutants. Scale bars represent 200 µm. T, temporal; N, nasal; R, rostral; C, caudal; L, lateral; M, medial; RGCs, retinal ganglion cells.
Figure 6—figure supplement 1

Retino-collicular map in P7 Epha3KI/+ mutants (n = 11 animals).
T, temporal; N, nasal; R, rostral; C, caudal.
Figure 7
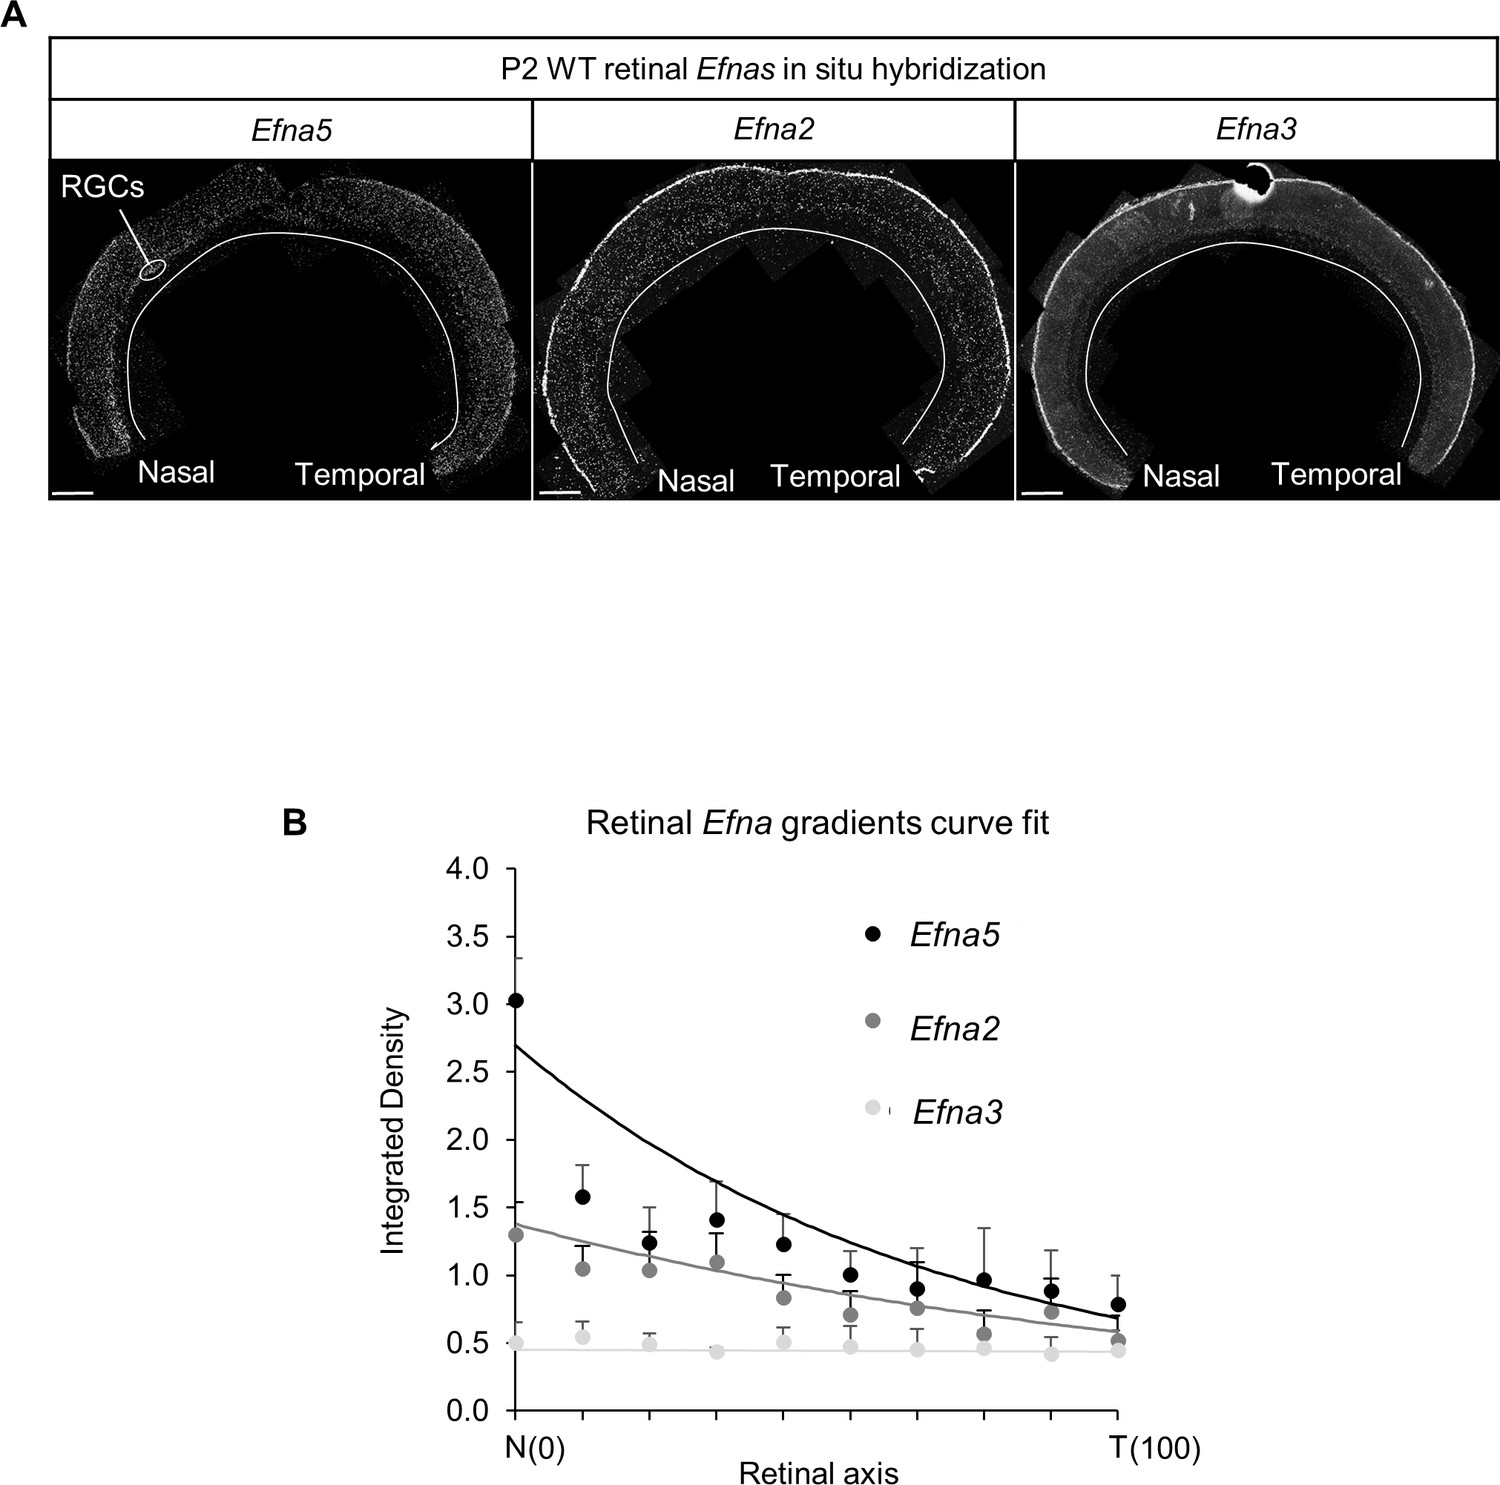
Retinal Efnas quantification.
(A) Section of P2 mouse retina (n = 6 retinas from three animals from different litters) hybridized with Efna5, Efna2 and Efna3 probes. Quantification was performed for 10 segments of the RGC layer along the nasal-temporal axis. Scale bar represent 100 µm. (B) Efna2/a3/a5 expression profiles (dots) fitted by the equations (lines) corresponding to equations (1), (2) and (3) respectively.
Figure 8
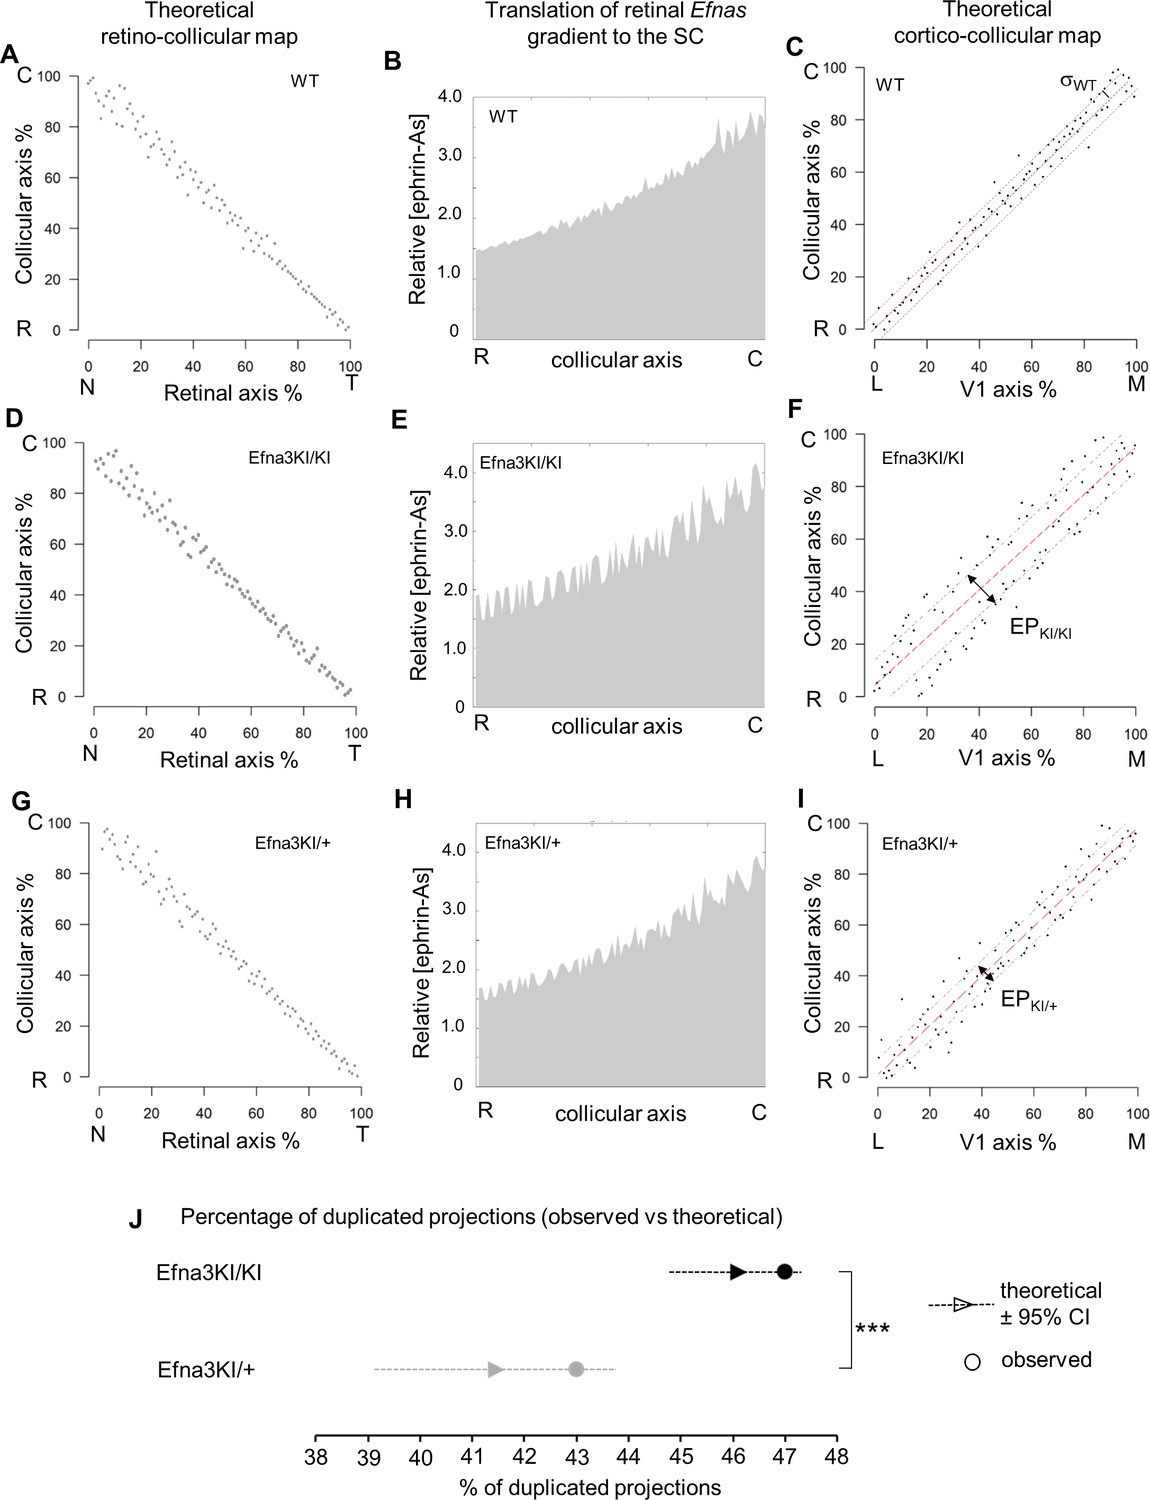
Theoretical analysis and modelling.
(A–I) Retino- (A, D, G) and cortico- (C, F, I) collicular maps generated by the 3-step Map alignment model in WT (A, C), Efna3KI/KI (D, F) and Efna3KI/+ (G, I) after n = 20 runs and 107 iteration/run. The parameters used for the retino-collicular modelling in the three genotypes are identical. Translated retinal Efn-As gradients (% of retinal expression: Efna2 = 100%, Efna3 = 100% and Efna5 = 80%) into the SC in WT (B), Efna3KI/KI (E) and Efna3KI/+ (H). Red lines in (C, F, I) represent the linear regression. Variability of the WT map in (C) is calculated by σWT = 2.18% (n = 20 runs). Grey lines in (F, I) represent the exclusion parameter (EP) corresponding to EP = σWT + ΔSexp: EPKI/KI = 15.18%, EPKI/+ = 9.18%. (J) Dot plot representation of the percentage of duplicated cortico-collicular projections (observed versus theoretical) for n = 20 runs in Efna3KI/KI (experimental = 47%, n = 9 animals; theoretical mean = 46.1%, ±95 %CI = 1.2%, one sample t-test, t = 1.42, 19 d.f., p = 0.17) and Efna3KI/+ (experimental = 43%, n = 7 animals; theoretical mean = 41.4%, ±95 %CI = 2.4%, variables are normally distributed, one sample t-test, t = 1.28, 19 d.f., p = 0.22) (theoretical Efna3KI/+ vs Efna3KI/KI, two-sample t-test, t = 3.4, 38 d.f., ***p = 0.0016). N, nasal; T, temporal; L, lateral; M, medial; R, rostral; C, caudal.
Figure 9
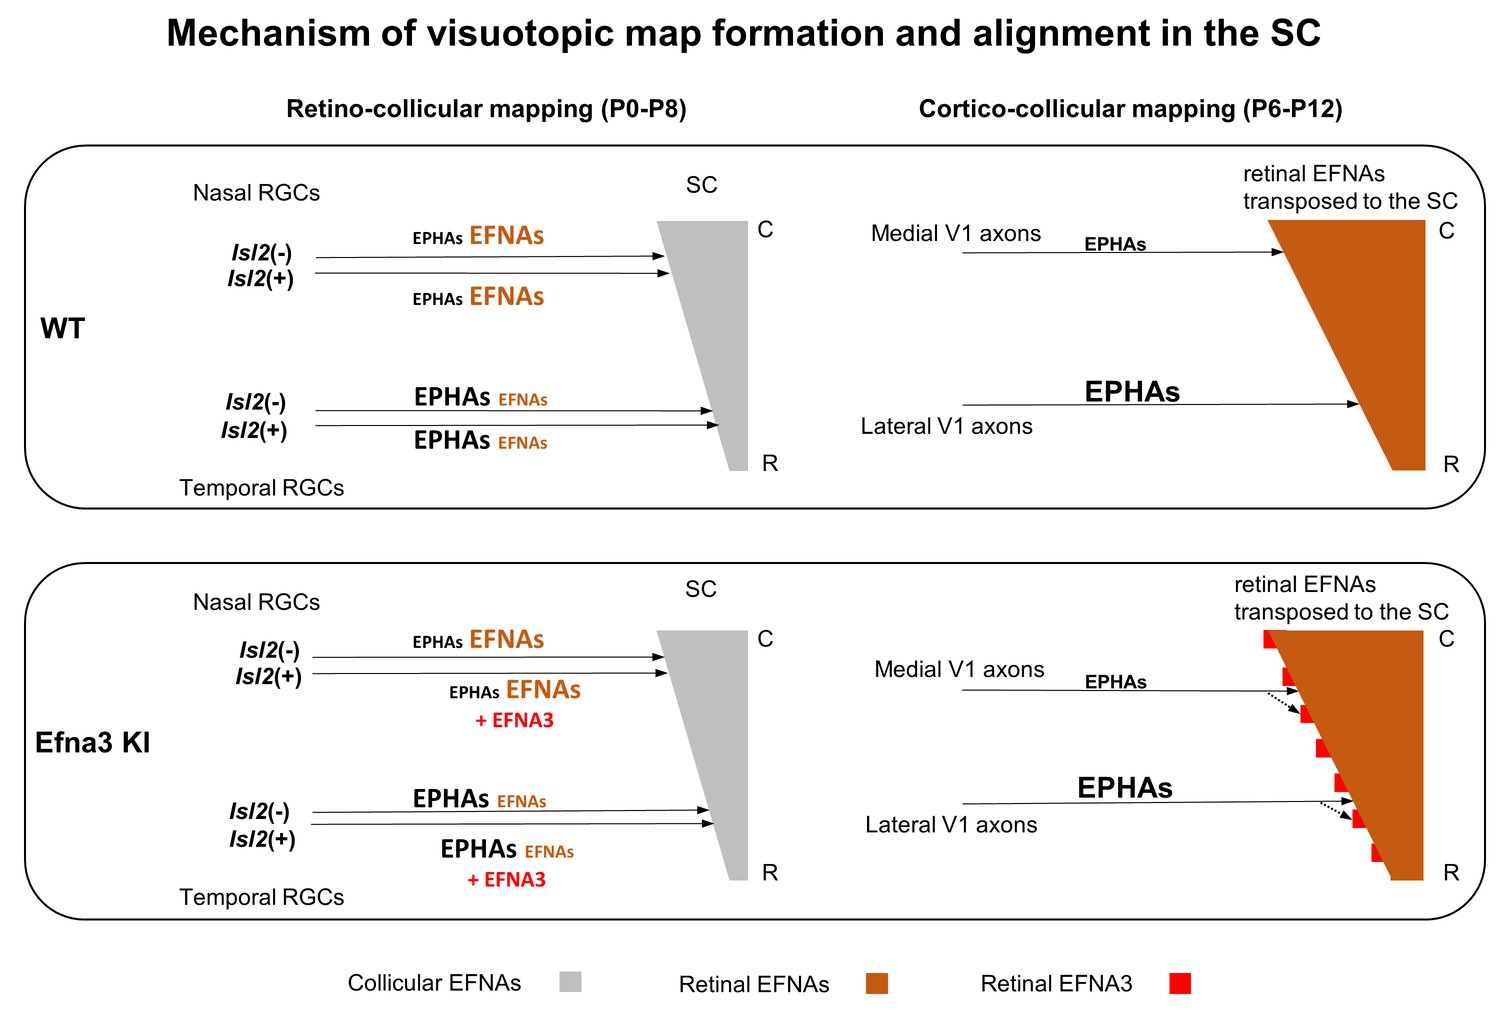
Schematic representation of the map alignment mechanism.
RGCs axons in WT and Efna3 KI animals project to the SC during the first postnatal week and form the retino-collicular map through forward signaling activated by collicular EFNAs and fiber-fiber interactions (left side). In both WT and Efna3 KI animals, the retino-collicular map is single and coherent. In WT and Efna3 KI, each RGCs axon is loaded with a different concentration of retinal EFNAs (high-nasal, low-temporal) carried to the SC. Due to the coherence of the retino-collicular map, a smooth retinal EFNAs gradient is formed in the SC in WT, whereas in Efna3 KI animals, Isl2(+) RGC axons carry extra EFNA3 (in red) which creates an oscillatory retinal EFNAs gradient once transposed in the SC (right side). During cortico-collicular mapping, V1 axons carrying EPHA receptors are facing a smooth gradient of retinal EFNAs in the SC, leading to a single coherent map in WT. In Efna3 KI animals, V1 axons carrying EPHA receptors are facing an oscillatory gradient of retinal EFNAs (due to ectopic expression of EFNA3 in Isl2(+) RGCs) which leads to the duplication of the cortico-collicular map (43% in Efna3KI/+ and 47% in Efna3KI/KI) through local neighbor–neighbor relationships of V1/RGCs TZs via repulsion. C, caudal; R, rostral; WT, wild-type; TZ, termination zone; RGCs, retinal ganglion cells.
Author response image 1
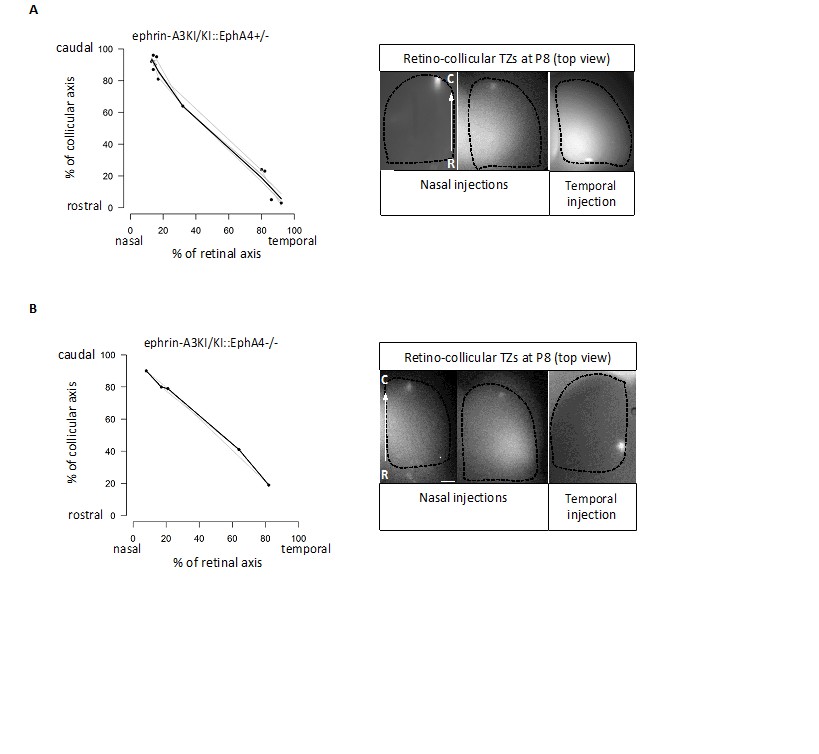
Retino-collicular projections analysis at P8 in ephrin-A3KI/KI∷EphA4+/- (A) and ephrin-A3KI/KI∷EphA4-/- (B) double mutants showing single retino-collicular maps (left panels) and examples of anterograde tracings (right panels: whole-mount confocal SCs images showing the single TZs – white spot).
Scale bars: 200 µm. R, rostral; C, caudal.
Author response image 2
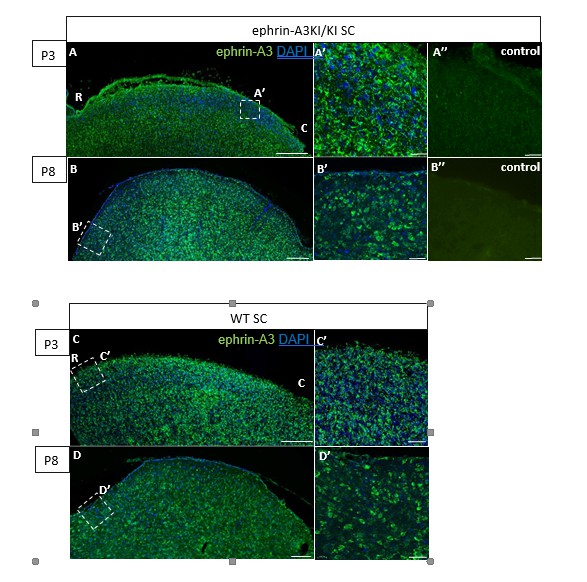
Immunohistochemical staining on P3 and P8 ephrin-A3KI/KI and WT SC parasagittal sections revealing ephrin-A3 expression in collicular cells (controls are without primary anti-ephrin-A3 antibody).
Scale bars: 200 µm (A – D), 30 µm (A’ – D’, A’’, B’’); R, rostral; C, caudal.
Author response image 3
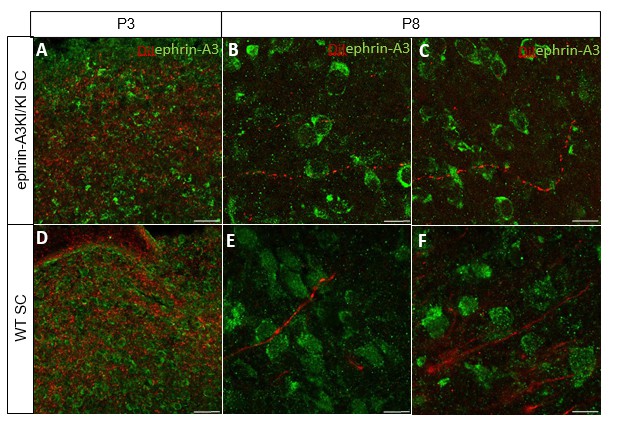
Immunostaining revealing ephrin-A3 expression (green) in P3 and P8 ephrin- A3KI/KI and WT SC parasagittal sections after retinal anterograde DiI injection (red fibers).
Scale bars: 30 µm (A, D), 10 µm (B – F).
Author response image 4
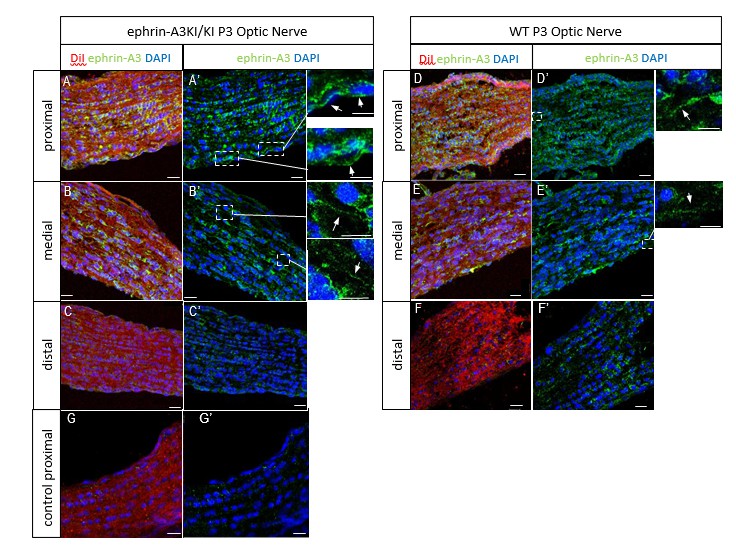
P3 ephrin-A3KI/KI (A-C’, G, G’) and WT (D-F’) optic nerve sections, at the proximal, medial and distal level from the optic disc, immunostained for ephrin-A3 (in green), DAPI (in blue) after retinal DiI injections (in red).
A control experiment (without ephrin-A3 antibody) is shown on ephrin-A3KI/KI proximal optic nerve section. Scale bars: 20 µm (A-G’), 10 µm (high magnification panels in A’, B’, D’, E’). Arrows in insets show ephrin-A3 positive fibers.
Author response image 5
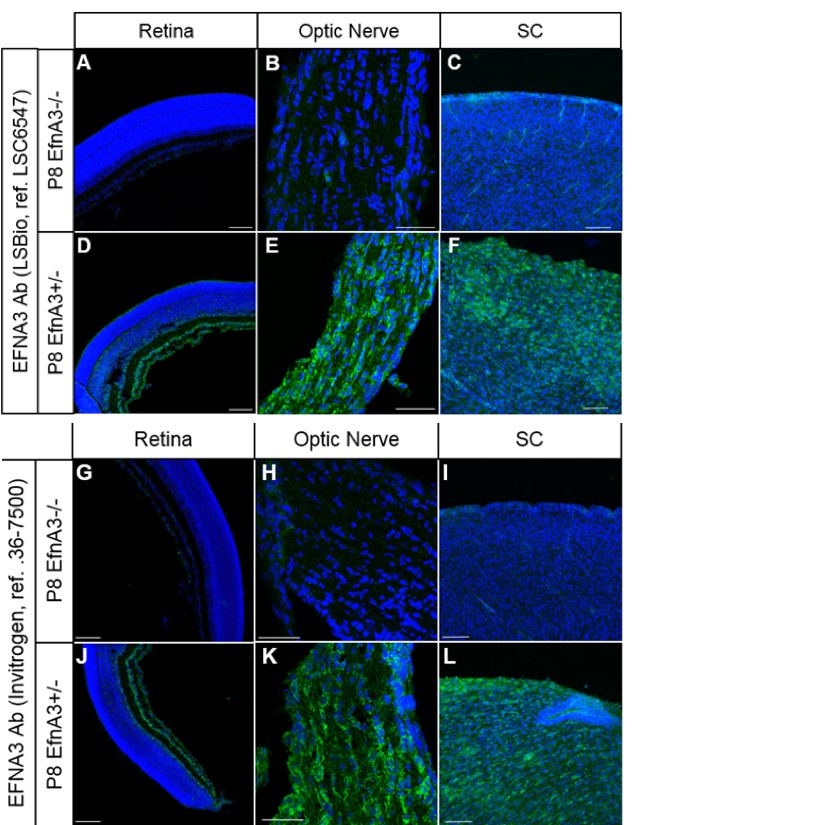
Immunohistochemistry on P8 Efna3-/- (A, B, C, G, H, I) and Efna3+/- (D, E, F, J, K, L) tissue sections using EFNA3 antibodies from LSBio (LSC6547) (A-F) and Invitrogen (36-7500) (G-L).
Scale bars, 100µm (A, C, D, F, G, I, J, L), 50 µm (B, E, H, K).
Additional files
-
Source code 1
Leave-one-out ‘Leave-one-out’ script in R.
- https://doi.org/10.7554/eLife.20470.020
-
Source code 2
3-step map alignment model 3-step map alignment script in MATLAB
- https://doi.org/10.7554/eLife.20470.021
-
Supplementary file 1
Sequences of the primers used for genotyping and expression analyses.
- https://doi.org/10.7554/eLife.20470.022
Download links
A two-part list of links to download the article, or parts of the article, in various formats.
Downloads (link to download the article as PDF)
Open citations (links to open the citations from this article in various online reference manager services)
Cite this article (links to download the citations from this article in formats compatible with various reference manager tools)
A molecular mechanism for the topographic alignment of convergent neural maps
eLife 6:e20470.
https://doi.org/10.7554/eLife.20470


