An NMDA receptor-dependent mechanism for subcellular segregation of sensory inputs in the tadpole optic tectum
- University of Wyoming, United States
Figures
Figure 1
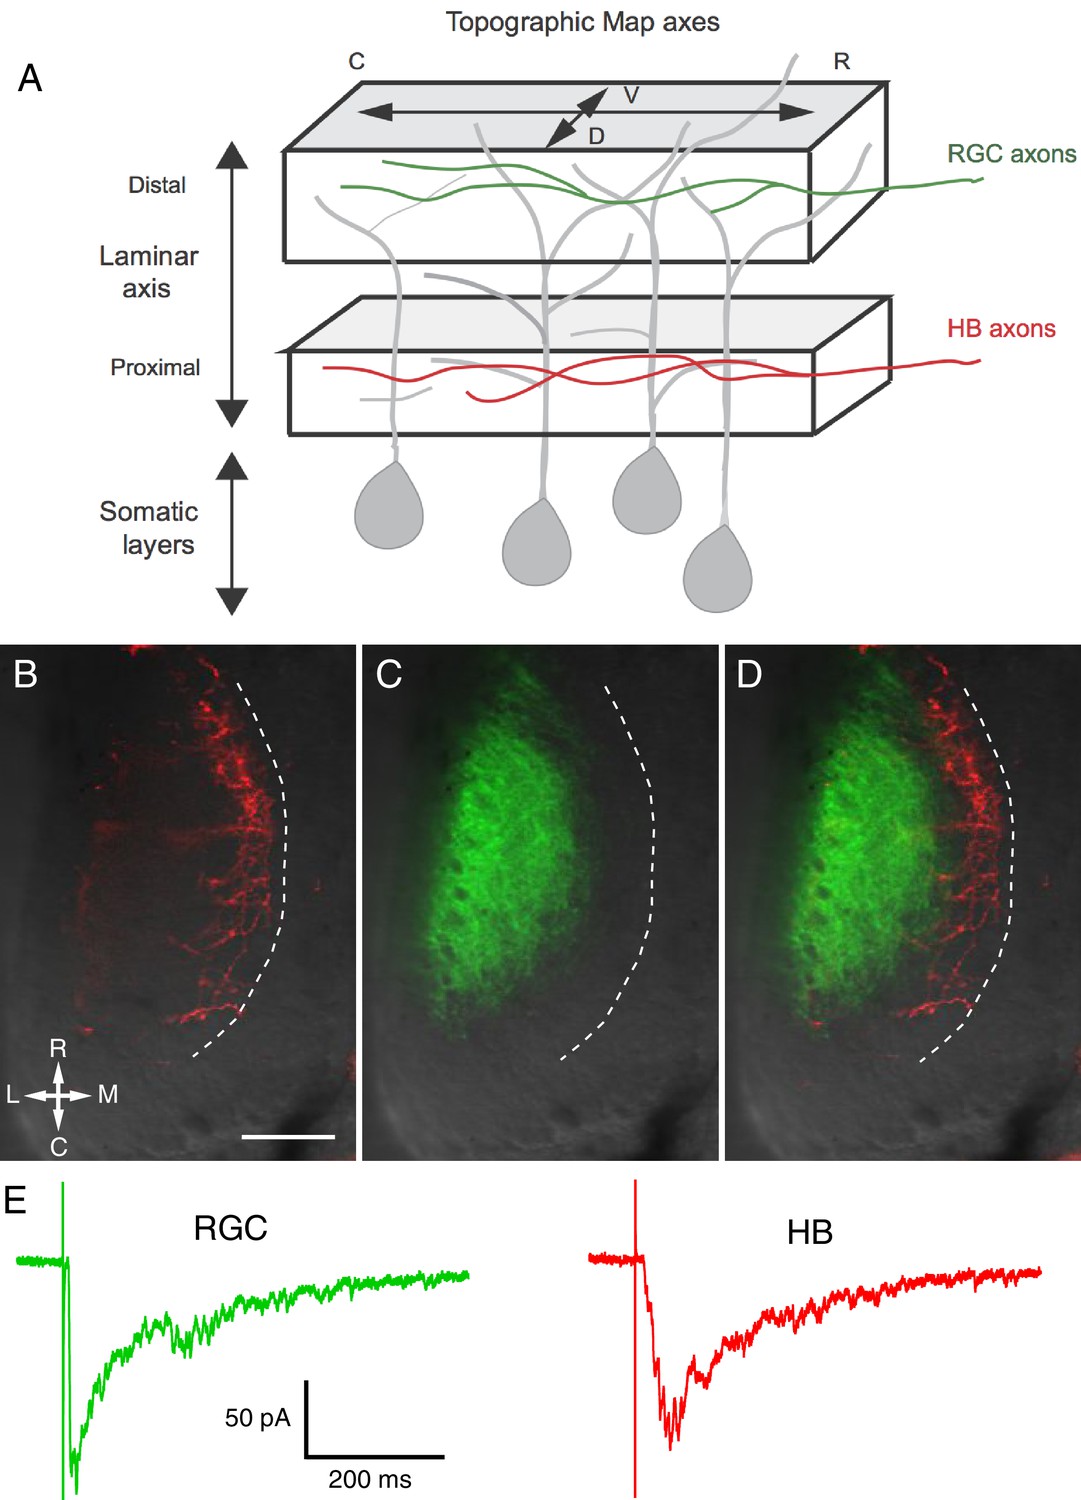
Visual and non-visual afferent inputs innervate different layers of the optic tectum neuropil and form synapses onto specific regions of tectal neuron dendrites.
(A) Schematic of the optic tectum neuropil showing RGC inputs innervating the more distal or region of the neuropil and mechanosensory (HB) inputs innervating the more proximal region. The dendrites of the tectal neurons span the entire laminar axis such that an individual dendrite receives synaptic input from both sensory inputs. Both sets of afferent inputs form topographic maps across the rostro-caudal (R-C) and dorsal-ventral (D-V) axes. (B) A brightfield image of a single stage 49 optic tectum overlaid with fluorescent images to show DiI-labeled ipsilateral and contralateral hindbrain input (red), (C) DiD-labeled contralateral RGC input (green), and (D) merged image of B and C. The laminar axis lies along the lateral (L) to medial (M) axis. Notice that the RGC and HB inputs are segregated across this axis. The dashed line indicates the border between the somatic layer and the neuropil. (E) Whole cell recordings from a single tectal neuron in response to activation of (left) RGC inputs and (right) mechanosensory (HB) inputs. Note that both inputs evoke a monosynaptic response followed by polysynaptic activity, indicating that single neurons receive direct monosynaptic input from both sensory modalities and that both inputs activate local polysynaptic activity within the tectum. Scale bar is 50 μm. R: rostral, C: caudal, L: lateral, M: medial.
Figure 2 with 1 supplement
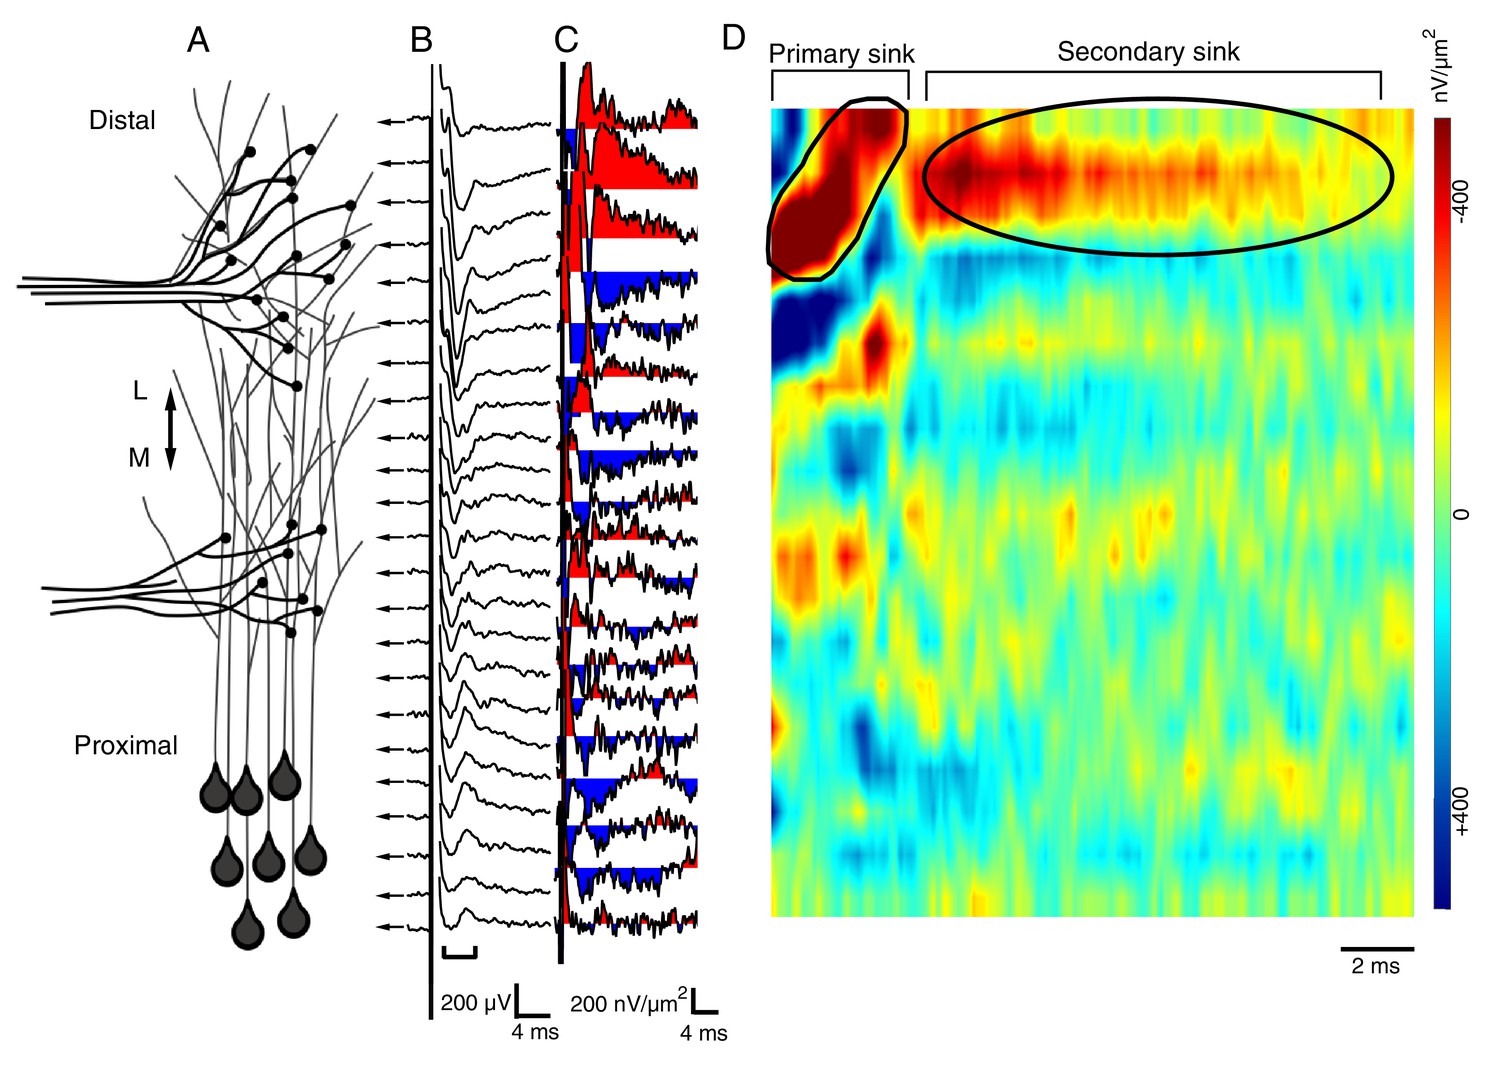
The spatial pattern of synaptic input is determined by recording RGC- and HB-evoked synaptic field potentials at equidistant points along the distal-proximal neuropil.
(A) Simplified schematic of the tectal neuropil showing RGC (distal) and HB (proximal) axonal inputs onto tectal neuron dendrites. RGC and HB-evoked synaptic field potentials are recorded every 10 µm along the distal-proximal axis of the neuropil. (B) An example of RGC-evoked FPs recorded from across the distal-proximal axis of a single optic tectum. (C) Corresponding current-source density (CSD) profile derived using spatial differentiation grid of 20 µm. (D) Corresponding image plot generated using same CSD data. Red indicates current sink, blue indicates current source. Main RGC-evoked sink is localized at the distal end of the neuropil (circled primary sink). A small, more proximal sink is also commonly observed. Note that the main primary sink is followed by the recurrent portion of the response (circled secondary sink), which consistently appears in the same region as the primary sink. L: lateral, M: medial.
Figure 2—figure supplement 1
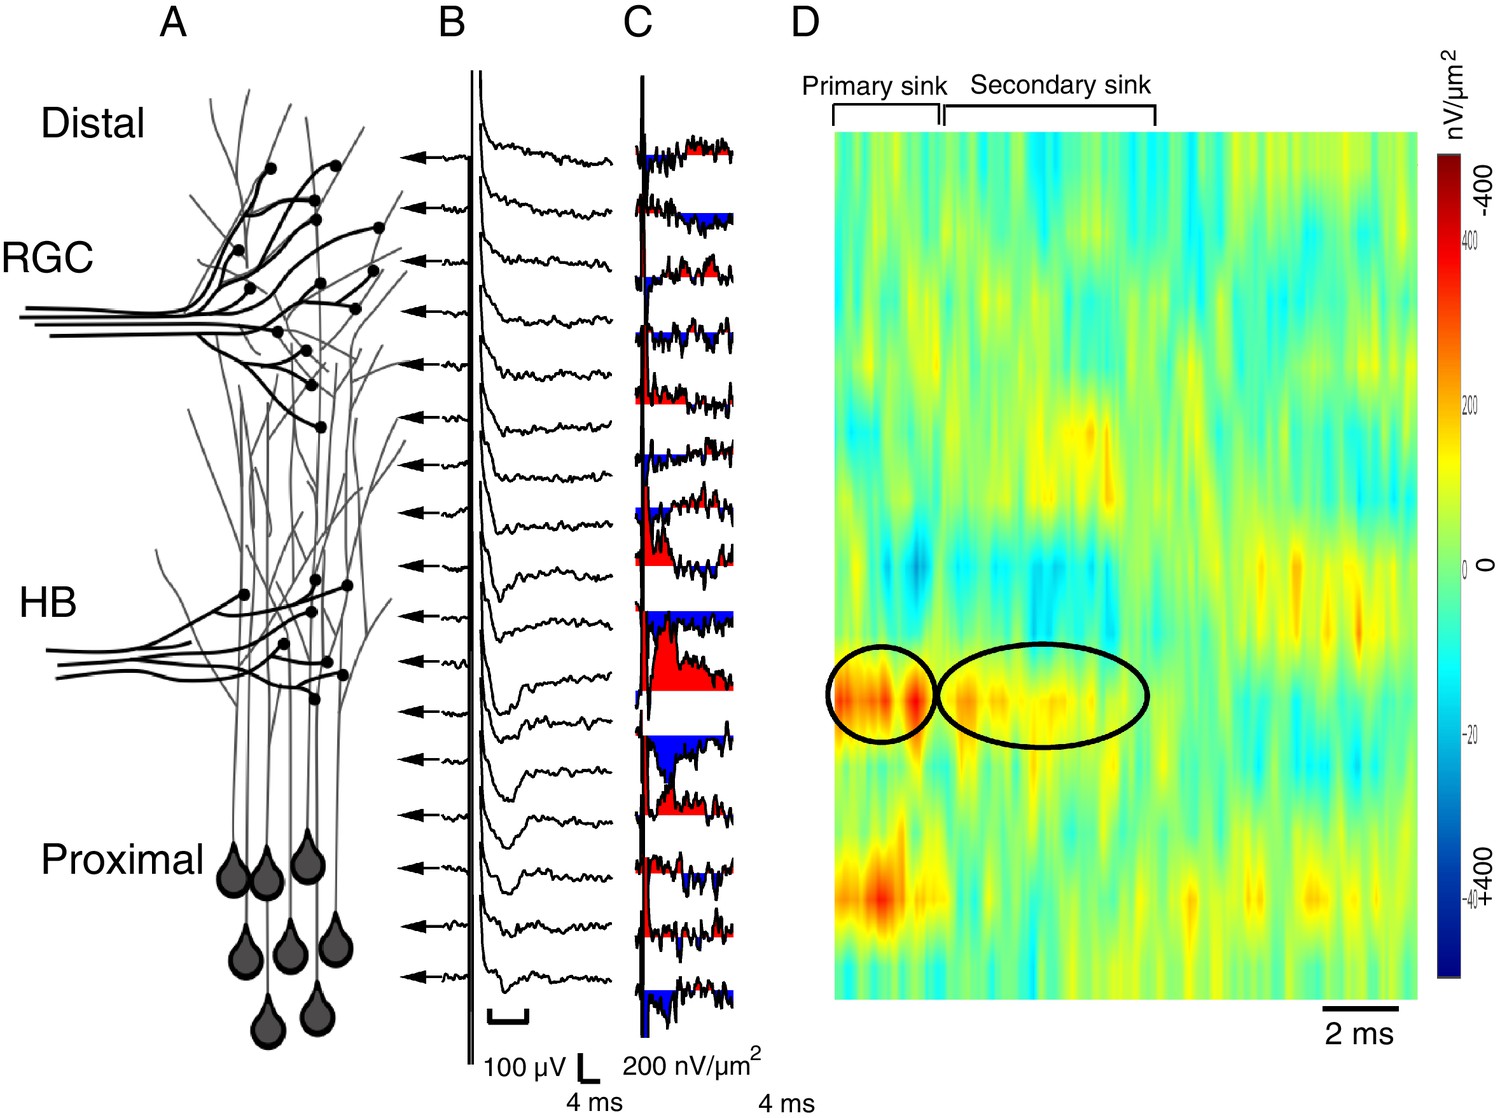
Spatial pattern of synaptic input is determined by recording RGC- and HB-evoked synaptic field potentials at equidistant points along the distal-proximal neuropil, an example of an HB-evoked response.
(A) Simplified schematic of the tectal neuropil showing RGC (distal) and HB (proximal) axonal inputs onto tectal neuron dendrites. RGC and HB-evoked synaptic field potentials are recorded every 10 µm along the distal-proximal axis of the neuropil. (B) An example of HB-evoked FPs recorded from across the distal-proximal axis of a single optic tectum. (C) Corresponding current-source density (CSD) profile derived using spatial differentiation grid of 20 µm. (D) Corresponding image plot generated using same CSD data. Red indicates current sink, blue indicates current source. Main HB-evoked sink is localized to the proximal region of the laminar axis of the neuropil (circled primary sink). Note that, as with the RGC-evoked response, the main primary sink is followed by the recurrent portion of the response (circled secondary sink), which consistently appears in the same region as the primary sink. L: lateral, M: medial.
Figure 3
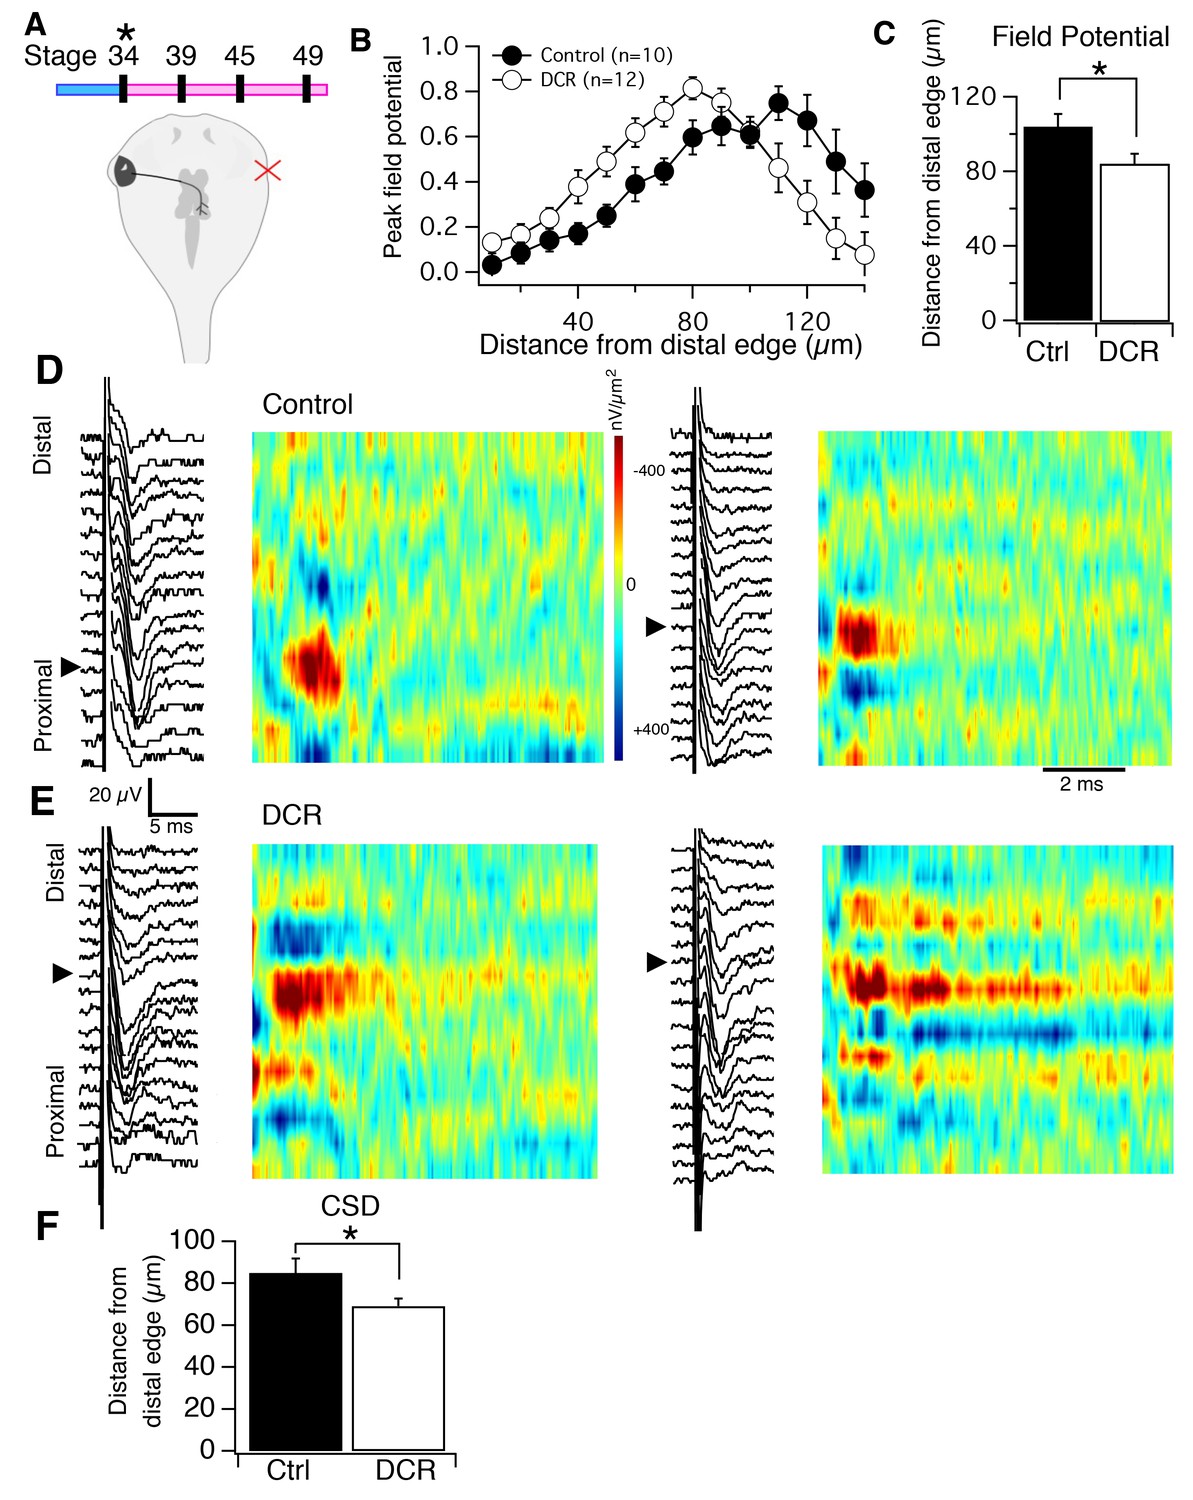
Monocular enucleation at stage 34 shifts HB inputs towards the distal neuropil.
(A), top) Timeline of when enucleation and then recording was carried out, and schematic showing monocular enucleation resulting in one tectal lobe (left) devoid of contralateral RGC axons (DCR) and the other tectal lobe (right) receiving normal contralateral RGC input. (B) Average normalized peak FPs of HB-evoked sinks from control tectal lobe (black) and the DCR tectal lobe (red) from the same brains, n = number of tecta. (C) Average distance from the distal edge at which the largest HB-evoked FP occurred in the control (black) and DCR (white). (D) HB-evoked FPs from two control (i.e. tectum with normal RGC inputs) with corresponding image plots. Note that the main HB-evoked sink is localized to the proximal region of the laminar axis in both examples. (E) HB-evoked FPs from two DCR tecta with corresponding image plots. Note that in both image plots the main HB-evoked sink has shifted to a more distal region along the laminar axis. Also notice that the pattern appears more dispersed along the axis in the example on the right. (F) Average distance from distal edge at which the largest HB-evoked CSD sink occurred in the control (black) and DCR (red). For all figures: * = p<0.05, ** = p<0.01, and *** = p<0.001.
Figure 4
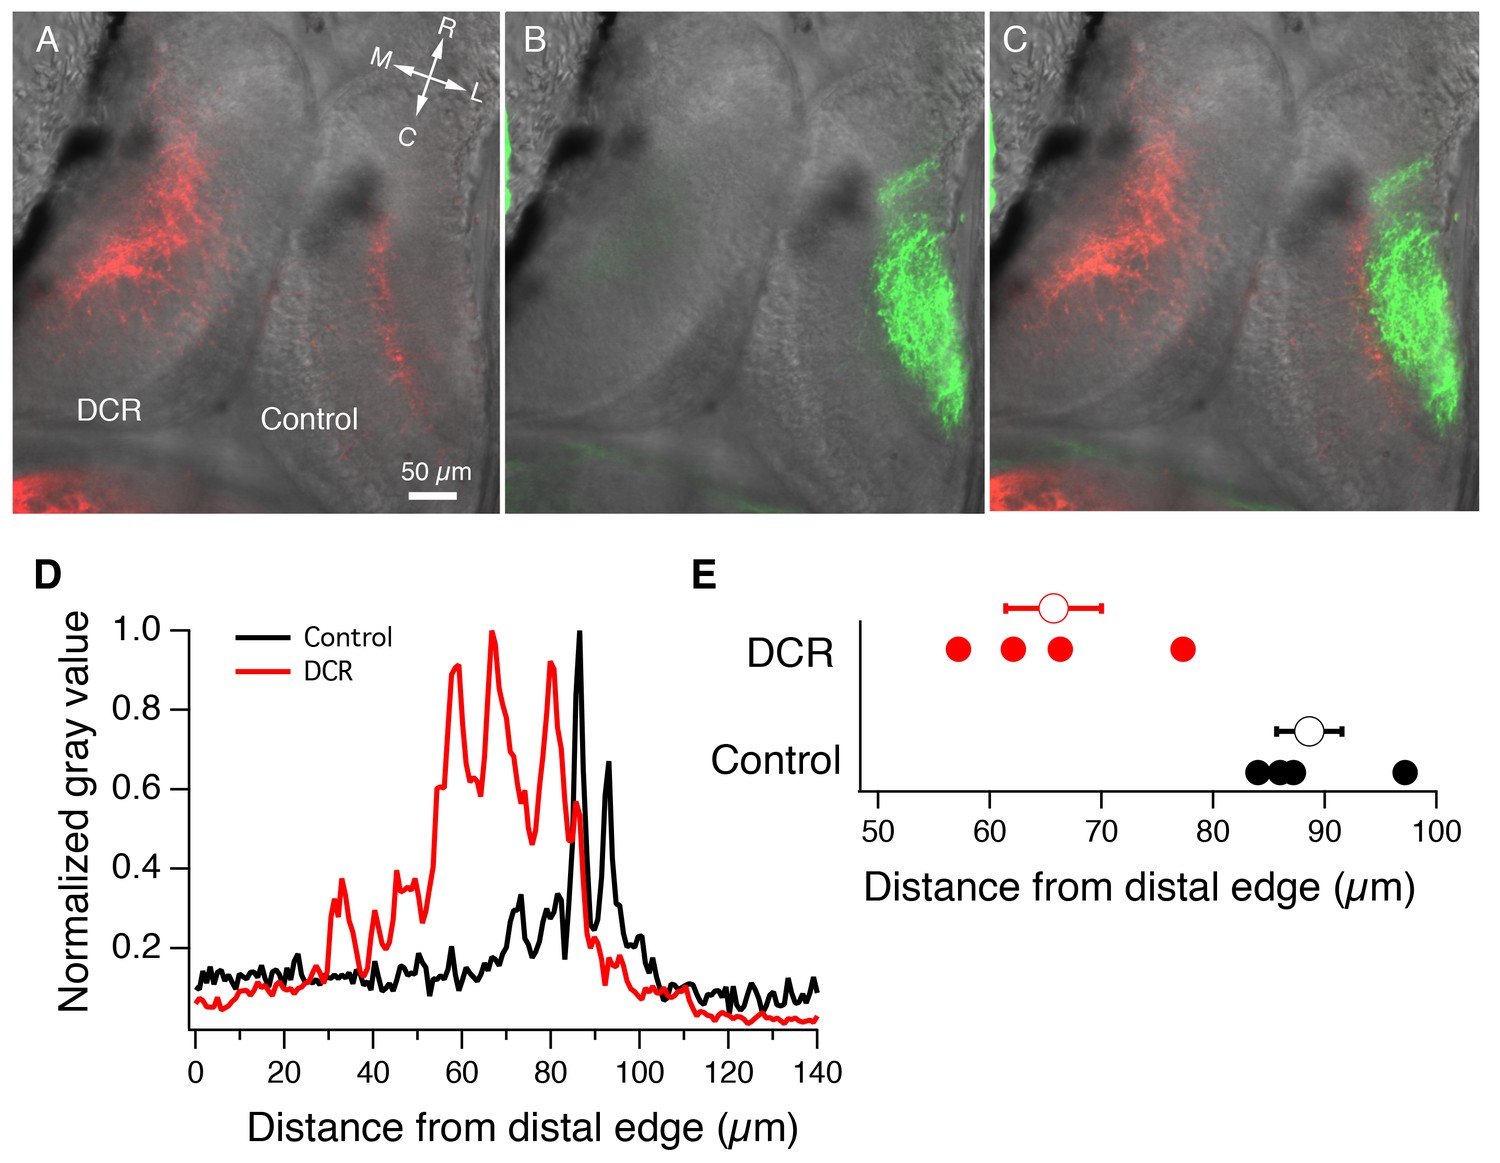
Monocular enucleation at stage 34 results in extended innervation of tectal neuropil by HB axons.
(A) Bilateral DiI (red) labeling of HB inputs shows extensive HB axon innervation of the region of neuropil normally occupied by RGC axons in the DCR tectum. (B) DiD (green) labeling of the RGC inputs coming from the intact eye shows RGC axon innervation of control tectum. (C) Merged image of panels A and B. All fluorescent images are superimposed on transmitted light images to show relationship of multisensory axons relative to the tectum. R: rostral, C: caudal, L: lateral, M: medial. (D) Spatial fluorescence intensity plots for the HB axon innervation of control and DCR tectum shown in panel A. Fluorescence intensity is expressed as 8-bit gray value and has been normalized to optimize comparison of the relative profiles of control and DCR tecta. Notice that the profile for the HB axons of the DCR tectum is shifted distally compared to control. (E) A plot showing the distance from the distal edge at which HB fluorescence peaks, for individual control and DCR tecta. Each solid dot represents an individual tecta, and the larger, empty circle shows the corresponding average distance from distal edge at which maximum HB axon fluorescence for control and DCR is observed.
Figure 5
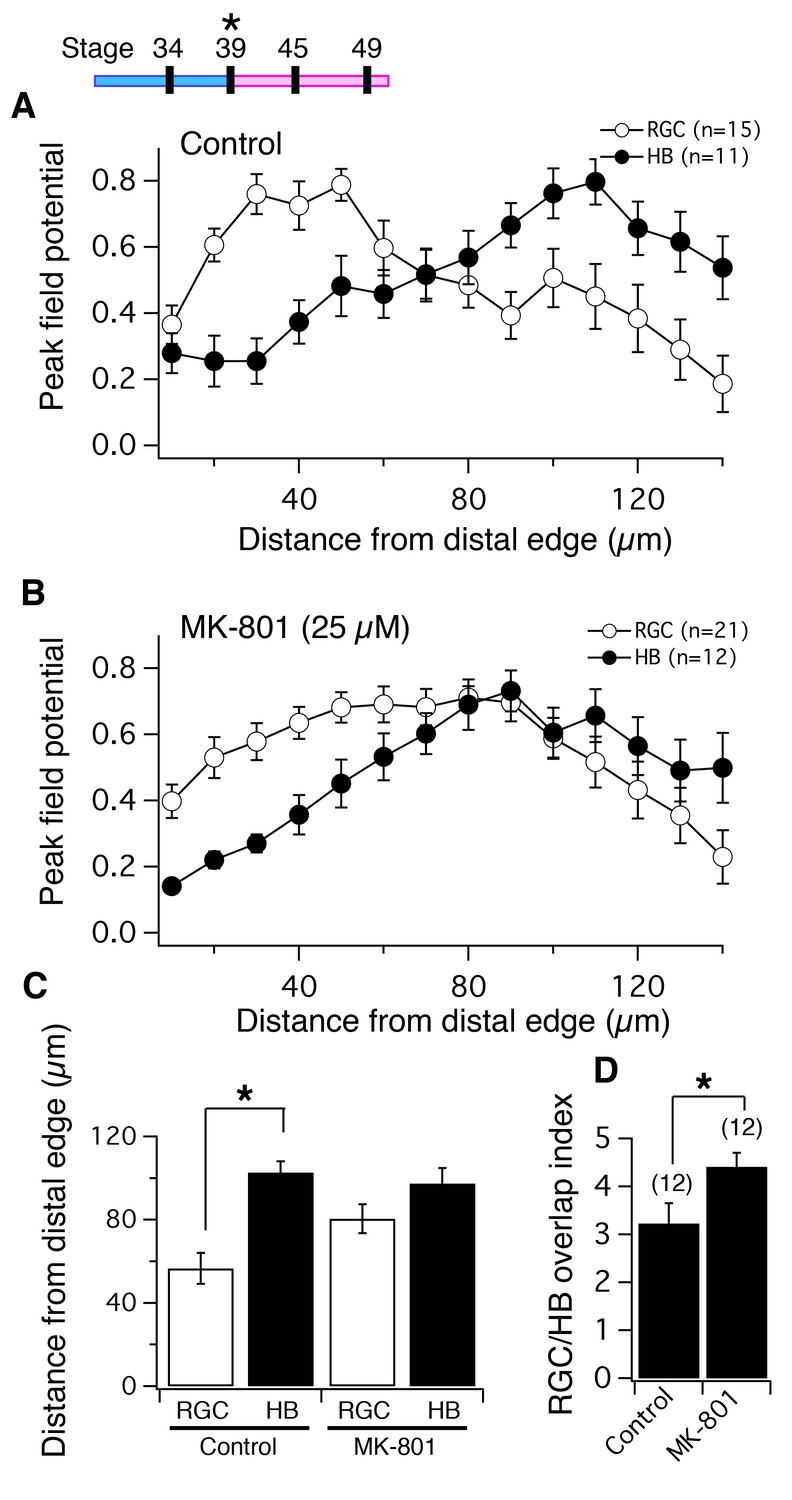
NMDA receptor blockade, starting at stage 39, disrupts the normal degree of spatial segregation between RGC and HB synaptic inputs measured by peak FPs.
(Top Left) timeline of experiment. Average normalized peak FPs of RGC (white) and HB (black) inputs along the laminar axis for (A) control tadpoles and (B) tadpoles reared in MK-801. The spatial FP profiles in A show distinct and separated peaks formed by RGC and HB inputs, and this pattern is disrupted in MK-801-reared tadpoles. (C) Average distance from the distal edge at which the largest RGC- and HB-evoked FP amplitudes occurred in control and MK-801 tecta. Notice that this distance is significant in controls but not MK-801-reared tadpoles indicating less segregation. (D) RGC/HB axon overlap, expressed as the overlap index, in control and MK-801-reared tadpoles. There is significantly more overlap in the MK-801 group. Numbers above bars represent number of tecta.
Figure 6
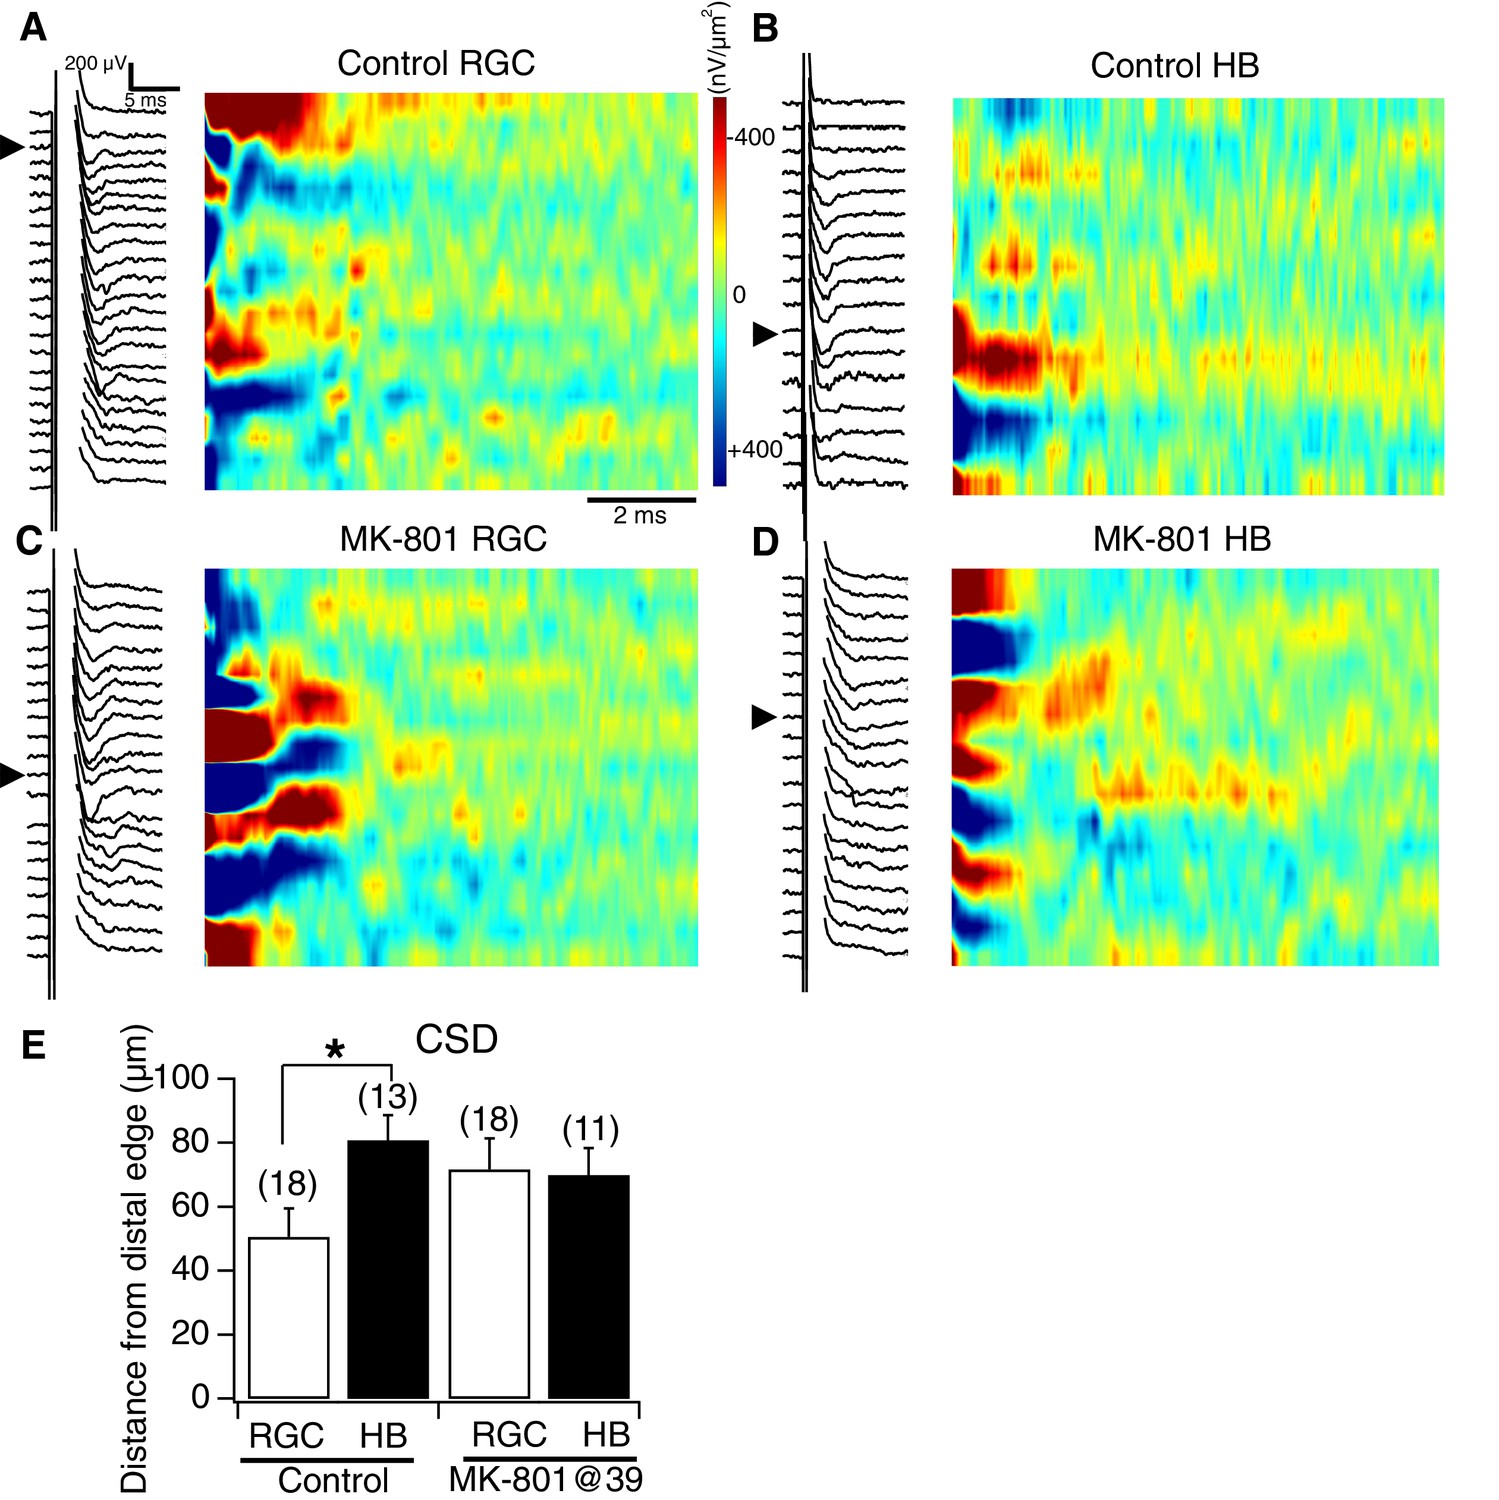
NMDA receptor blockade, starting at stage 39, disrupts the normal degree of spatial segregation between RGC and HB synaptic inputs: sample image plots.
(A) Control RGC-evoked FPs with corresponding image plot. Main RGC-evoked sink is localized to the most distal end of the neuropil, with an additional minor sink in the proximal region. (B) Control HB-evoked FPs with corresponding image plot. Main HB sink is localized to the proximal region of the tectal neuropil. (C) MK-801 RGC-evoked FPs with corresponding image plot. Main RGC-evoked sink now appears in the proximal region of the neuropil instead of the distal region. (D) MK-801 HB-evoked FPs with corresponding image plot. Main HB-evoked sink now appears in both the distal region and proximal region of the tectal neuropil. Arrowheads refer to the site of the largest peak FP. (E) Bar graph summarizing the location of major RGC- and HB- evoked CSD sinks along the distal-proximal axis. For control tecta, the distance between the major RGC- and HB-evoked CSD sinks is significant, but not for tecta exposed to MK801 at stage 39.
Figure 7
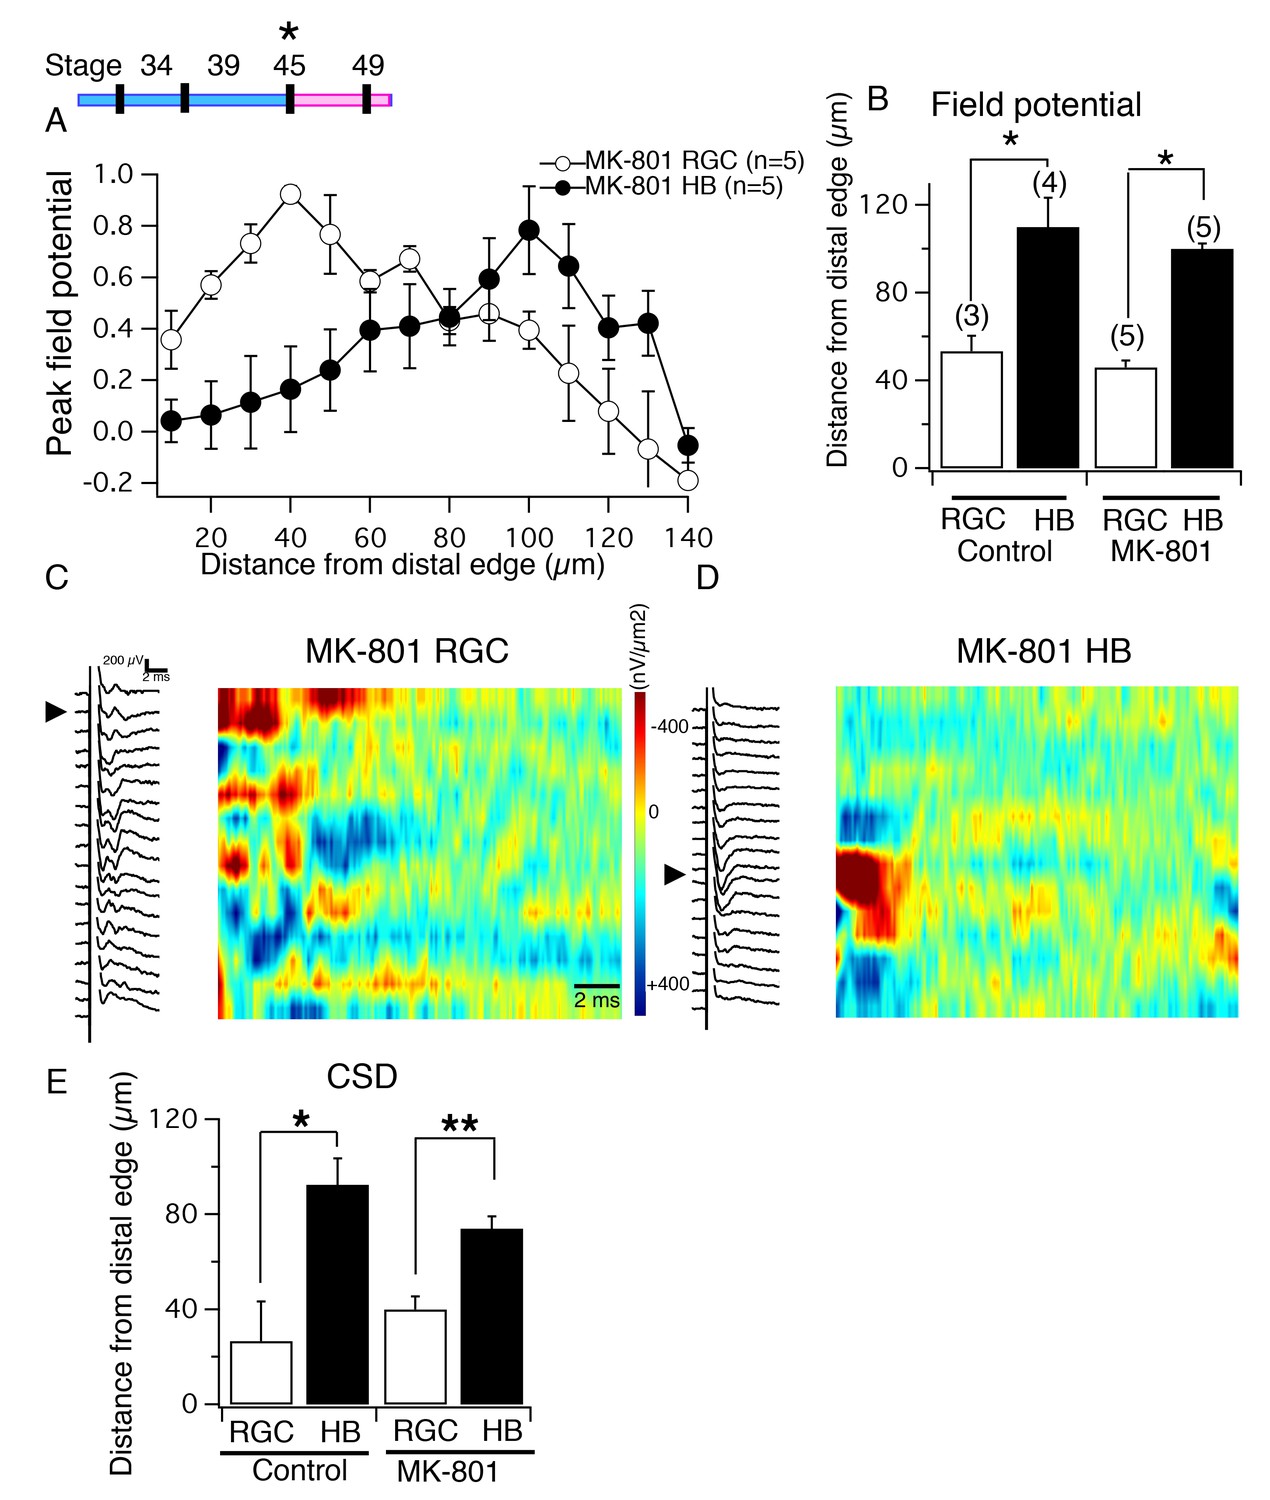
NMDA receptor blockade, starting at stage 45, does not disrupt the normal degree of spatial segregation between RGC and HB synaptic inputs.
(Top, left) Timeline of experiment. (A) Average normalized peak FPs of RGC-evoked (white) and HB-evoked (black) inputs along the laminar axis of MK-801-reared tadpoles. The spatial FP profiles show distinct and separated peaks formed by RGC and HB inputs. (B) Average distance from the distal edge at which the largest RGC-evoked and HB-evoked FP amplitudes occurred in control and MK-801-reared tecta. (C) RGC-evoked FPs with corresponding image plot showing the largest RGC-evoked sink localized to the most distal region of the laminar axis. (D) HB-evoked FPs with corresponding image plot showing the largest HB-evoked sink localized to the proximal region of the laminar axis. (E) Bar graph summarizing the location of major RGC- and HB- evoked CSD sinks along the distal-proximal axis. For both control tecta and tecta exposed to MK-801 at stage 45, the distance separating the major RGC- and HB-evoked CSD sinks is significant.
Figure 8
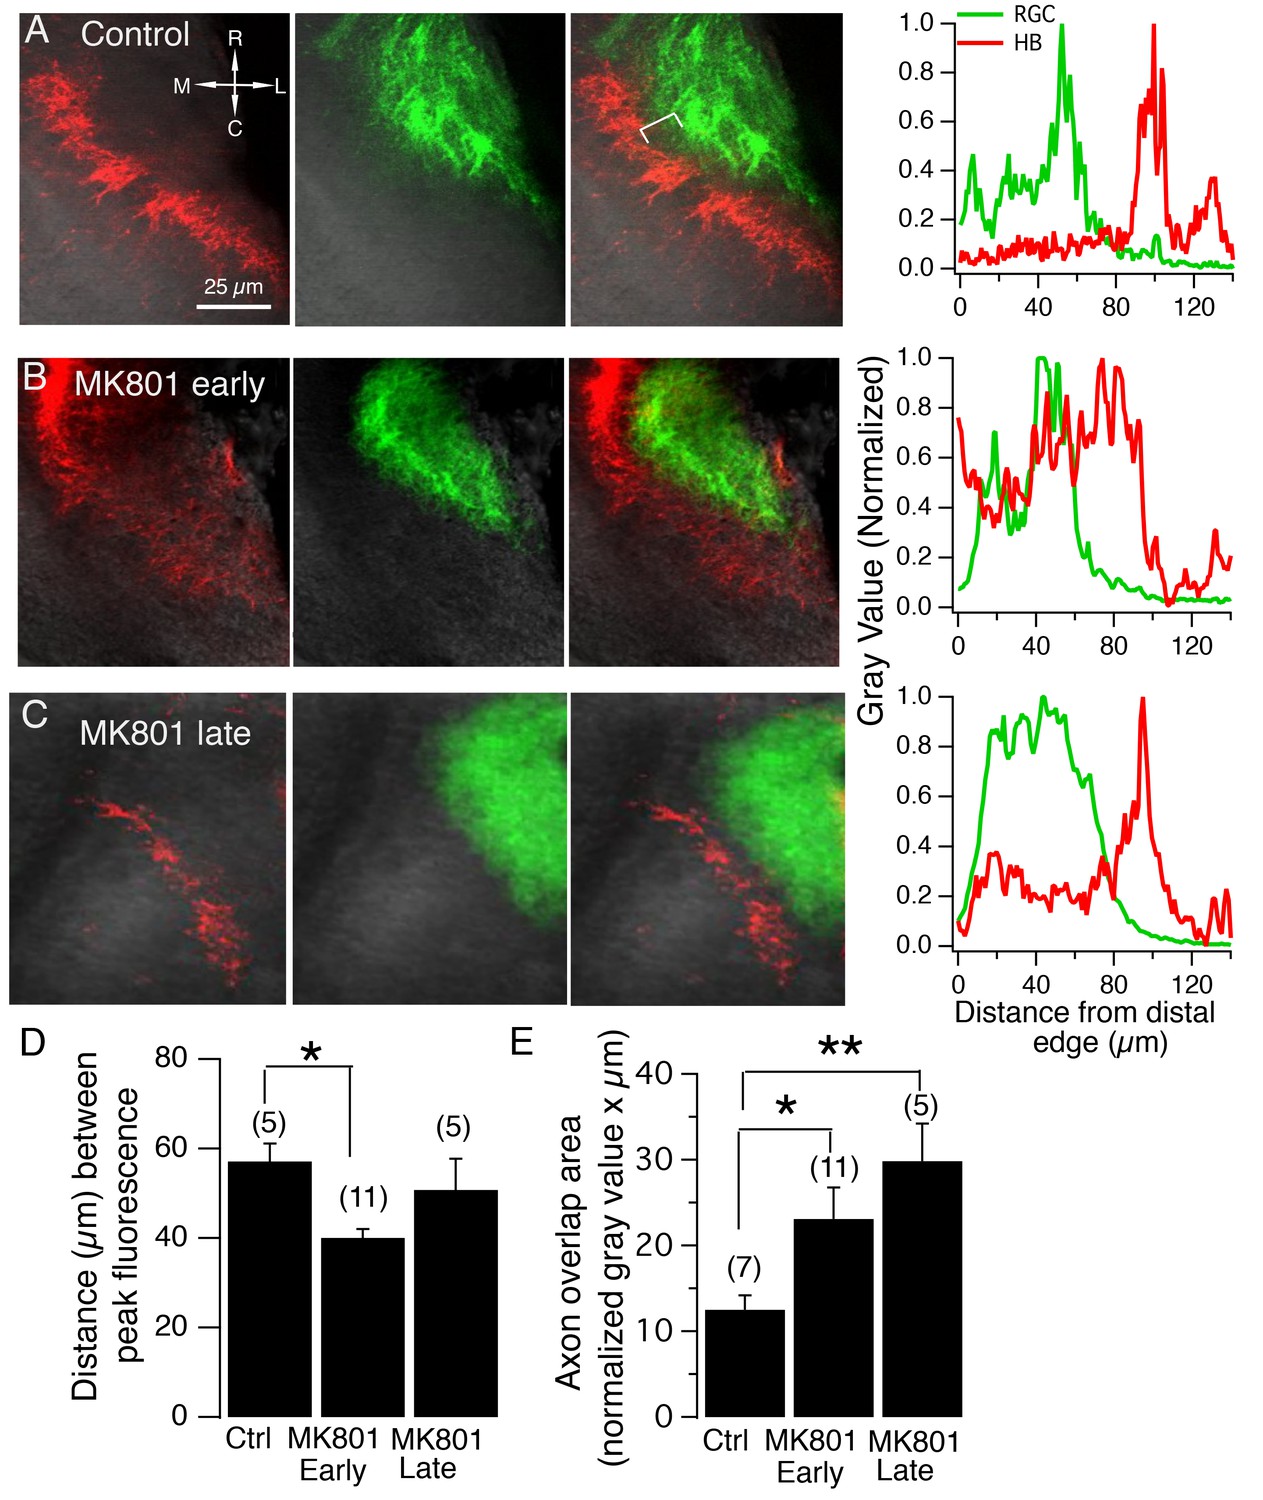
NMDA receptor blockade, starting at stage 39, but not stage 45, disrupt the normal degree of spatial segregation between RGC and HB axons.
(A) Control HB afferent input (red) projects to the proximal (medial) region of the tectal neuropil, RGC afferent input (green) projects to the distal (lateral) region of the tectal neuropil. In the merged image, notice the gap, indicated by the white bracket, between two sets of sensory input, and the corresponding gap in peak axon fluorescence shown in the corresponding fluorescent intensity profile (far right). (B) HB and RGC axons innervating the tectum of a tadpole exposed to MK801 at stage 39 (‘early’) and corresponding fluorescent profile (far right). There appears to be a less distinct gap between the two inputs, suggesting less segregation. (C) HB and RGC axons of a tadpole exposed to MK801 at stage 45 (‘late’), and corresponding fluorescent profile (far right). The merged image and fluorescent profile suggest that MK-801 rearing at stage 45 does not disrupt the segregation along the tectal neuropil at stage 49. Notice the gap between the two sets of input. (D) Bar graph summarizing the distance between peak HB and RGC axon fluorescence. (E) Bar graph summarizing the amount of overlap between HB and RGC axons. R: rostral, C: caudal, L: lateral, M: medial.
Figure 9

A summary figure showing the effect of monocular enucleation and NMDAR blockade at stage 39.
RGC and HB afferent inputs arrive to the tectum at the same time (stage 39) and remain segregated along the laminar axis. Monocular enucleation before as RGC axons are just exiting the eye (stage 34) results in HB axons extending into tectal dendritic territory normally occupied by RGC axons. NMDAR blockade during synapse formation (stage 39), but not after synapses have been stabilized (stage 45), results in the desegregation of RGC and HB axons in the laminar axis.
Download links
A two-part list of links to download the article, or parts of the article, in various formats.
Downloads (link to download the article as PDF)
Open citations (links to open the citations from this article in various online reference manager services)
Cite this article (links to download the citations from this article in formats compatible with various reference manager tools)
An NMDA receptor-dependent mechanism for subcellular segregation of sensory inputs in the tadpole optic tectum
eLife 5:e20502.
https://doi.org/10.7554/eLife.20502


