Dyslexics’ faster decay of implicit memory for sounds and words is manifested in their shorter neural adaptation
- The Hebrew University of Jerusalem, Israel
- Princeton University, United States
Figures
Figure 1
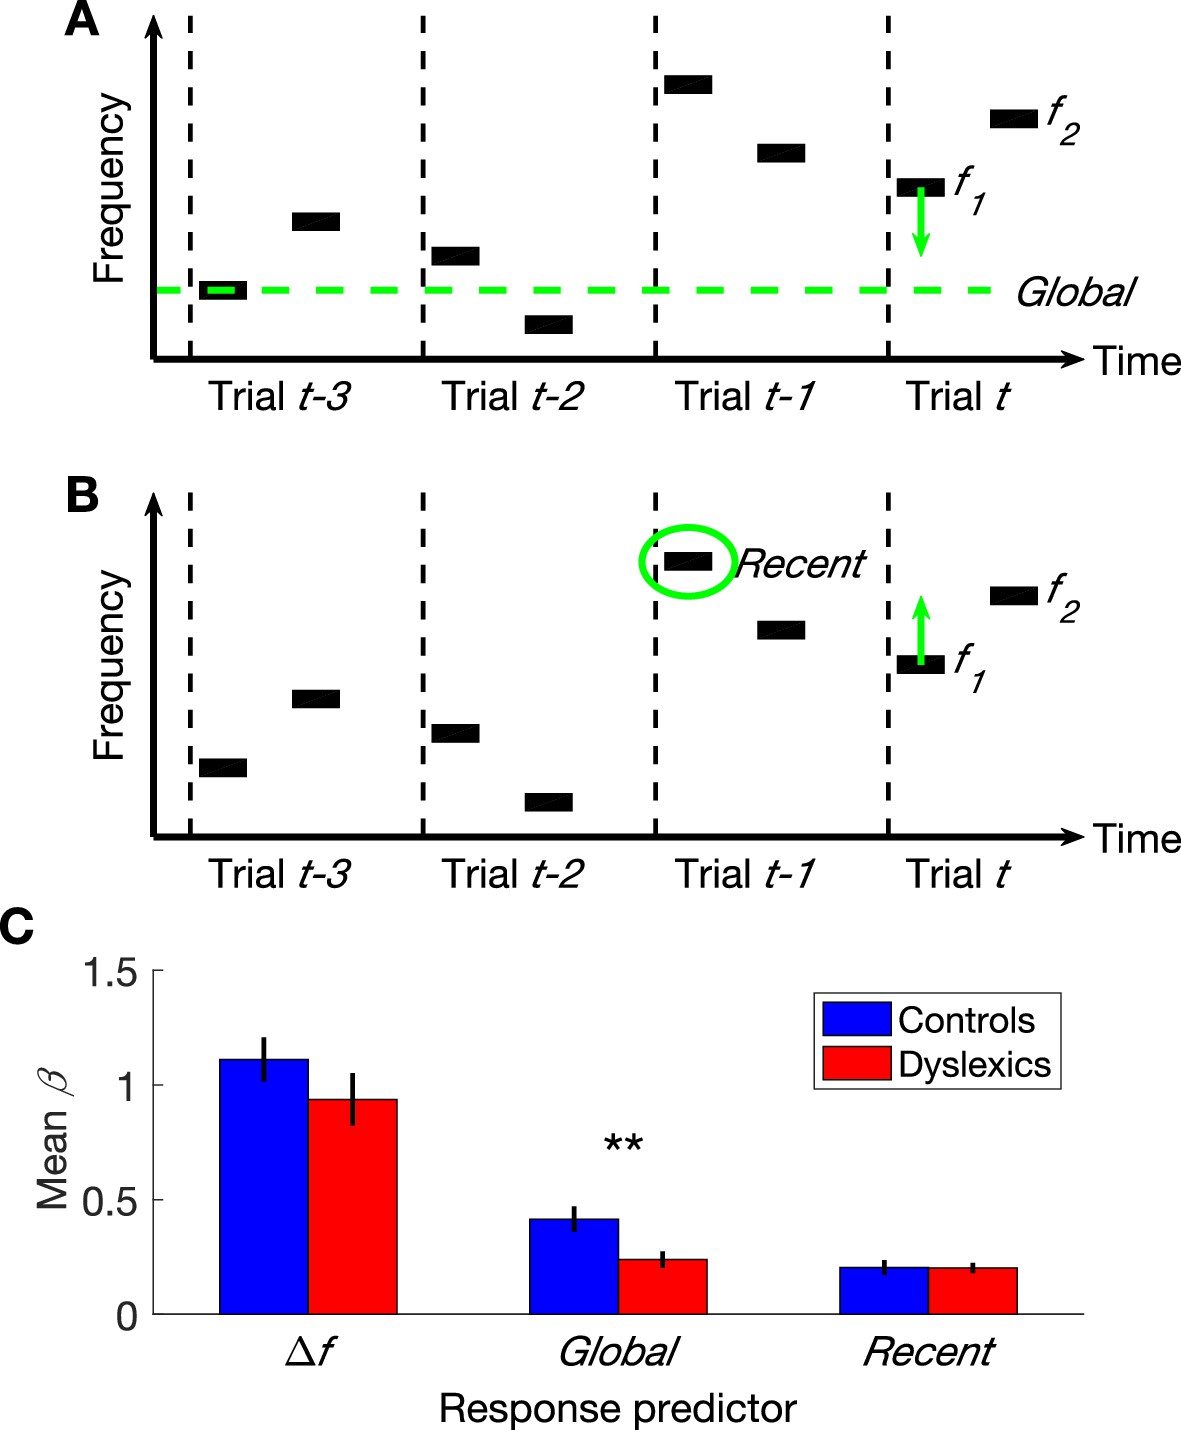
The three parameters that additively determine performance in frequency discrimination: frequency difference within a trial (), Global context (the difference between the current and the global mean) and Recent context (the difference between the current and the previous ).
(A) A schematic illustration of the Global bias:four trials and the direction of the contraction, which contracts the representation of the first tone in the trial towards the global mean. (B) A schematic illustration of the same four trials and the direction of the Recent bias, which pulls the representation of this tone towards the recent frequency. (C) The estimated contribution () of each of the three parameters to the overall performance of each group. Dyslexics differed from controls only in the smaller magnitude of the contribution of their Global predictor (p<0.01). Filled bars denote the mean values; controls in blue and dyslexics in red. Error bars denote SEM.
Figure 2
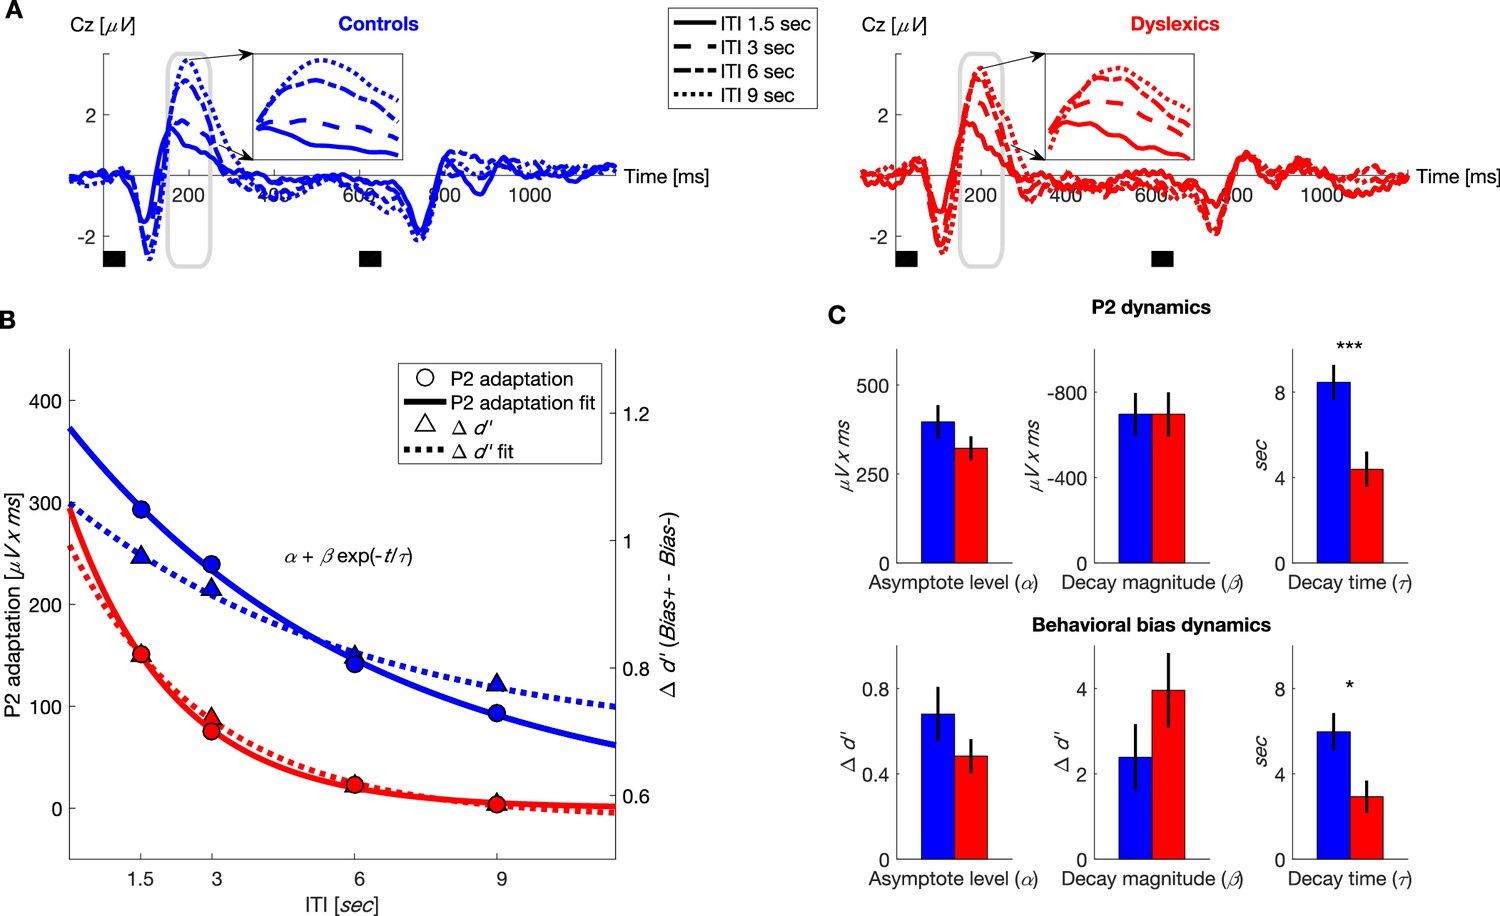
Dyslexics’ decay of both neural adaptation and behavioral contraction bias was faster than controls’.
(A) Grand average ERPs, plotted separately for blocks with different ITIs, for controls (n = 23; blue, left) and dyslexics (n = 25; red, right). Timing of the two tones in each trial is denoted by the short black bars under the plots. Insets: P2 range (denoted in gray) enlarged. Dyslexics’ P2 area was similar for 6 and 9 s ITIs, whereas controls’ P2 was larger for the 9 s interval. (B) The decrease in P2 adaptation (solid lines, circles, left scale; estimated magnitude at asymptote minus fitted curve) and the decrease in contraction bias (dashed lines, triangles, right scale; reflecting implicit memory decay) as a function of ITI. Symbols denote groups’ means, and plotted curves were fitted to these means. (C) Groups’ means and SEMs of the individually fitted parameters (to an exponential decay) of both P2 adaptation (top) and behavioral contraction bias (bottom). In both, dyslexics differed from controls only in the estimated rate of decay (P2: p<0.0005; : p<0.05).
Figure 3
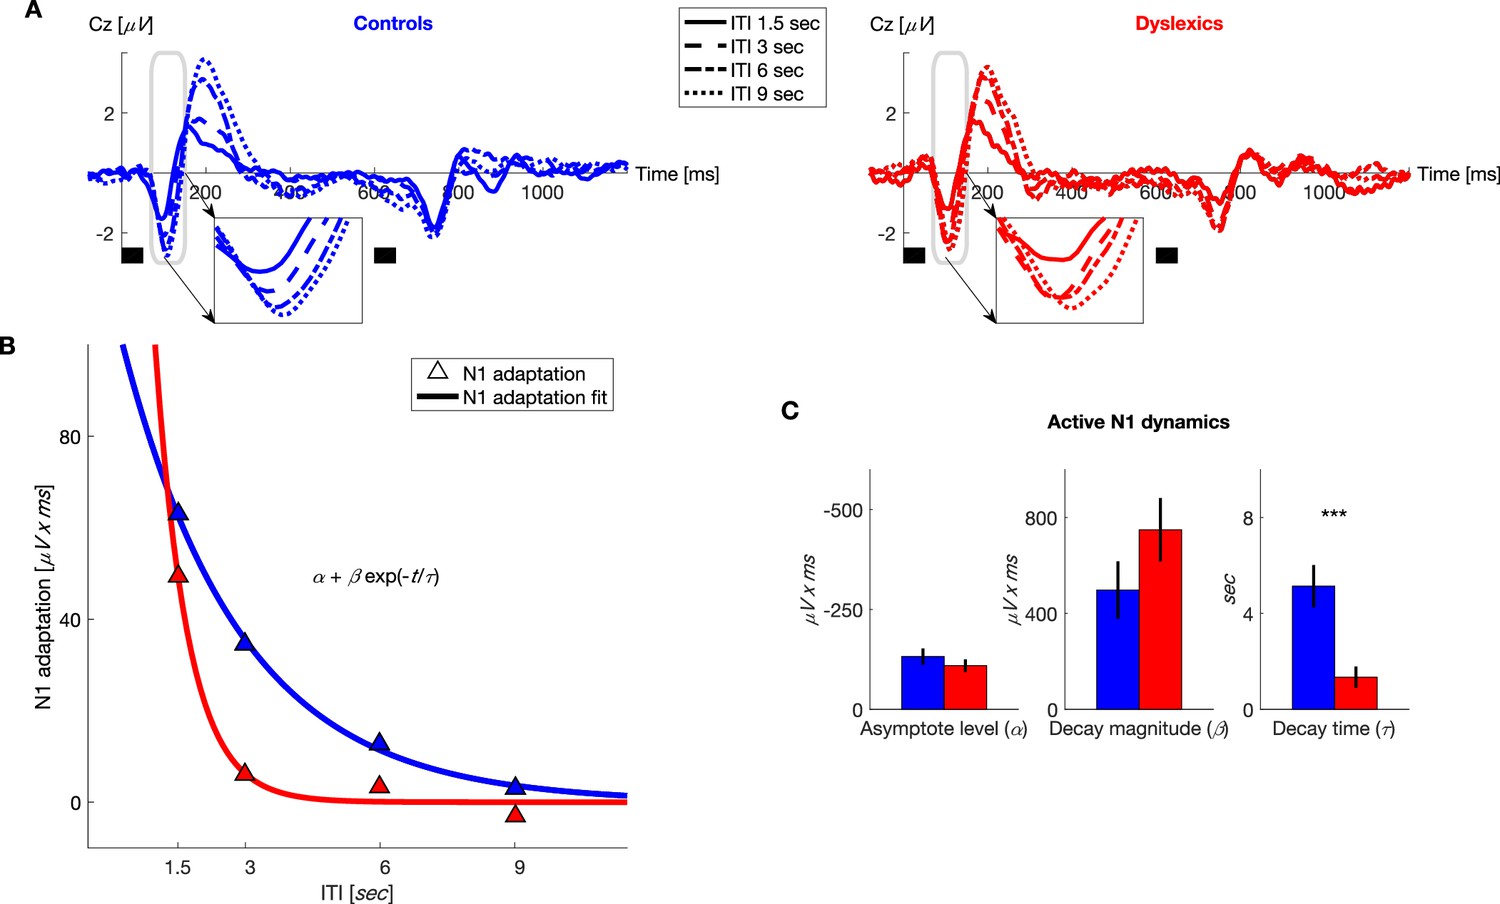
Dyslexics’ decay of N1 adaptation was faster than that of controls.
(A) Grand average ERPs, plotted separately for blocks with different ITIs, for controls (n = 23; blue, left) and dyslexics (n = 25; red, right). Timing of the two tones in each trial is denoted by the short black bars under the plots. Insets: N1 range enlarged. Dyslexics’ N1 almost reached its full magnitude at an ITI of 3 s, whereas controls’ N1 reached its near-full magnitude only at an ITI of 6 s. (B) The decrease in N1 adaptation (circles) and the fitted exponential decay model (lines) as a function of ITI (curves were fitted to groups’ means). (C) Groups’ mean and SEMs of individually fitted estimated parameters of the exponential decay model of N1 recovery from adaptation. Only significantly differed between the two groups (p<0.0001).
Figure 4
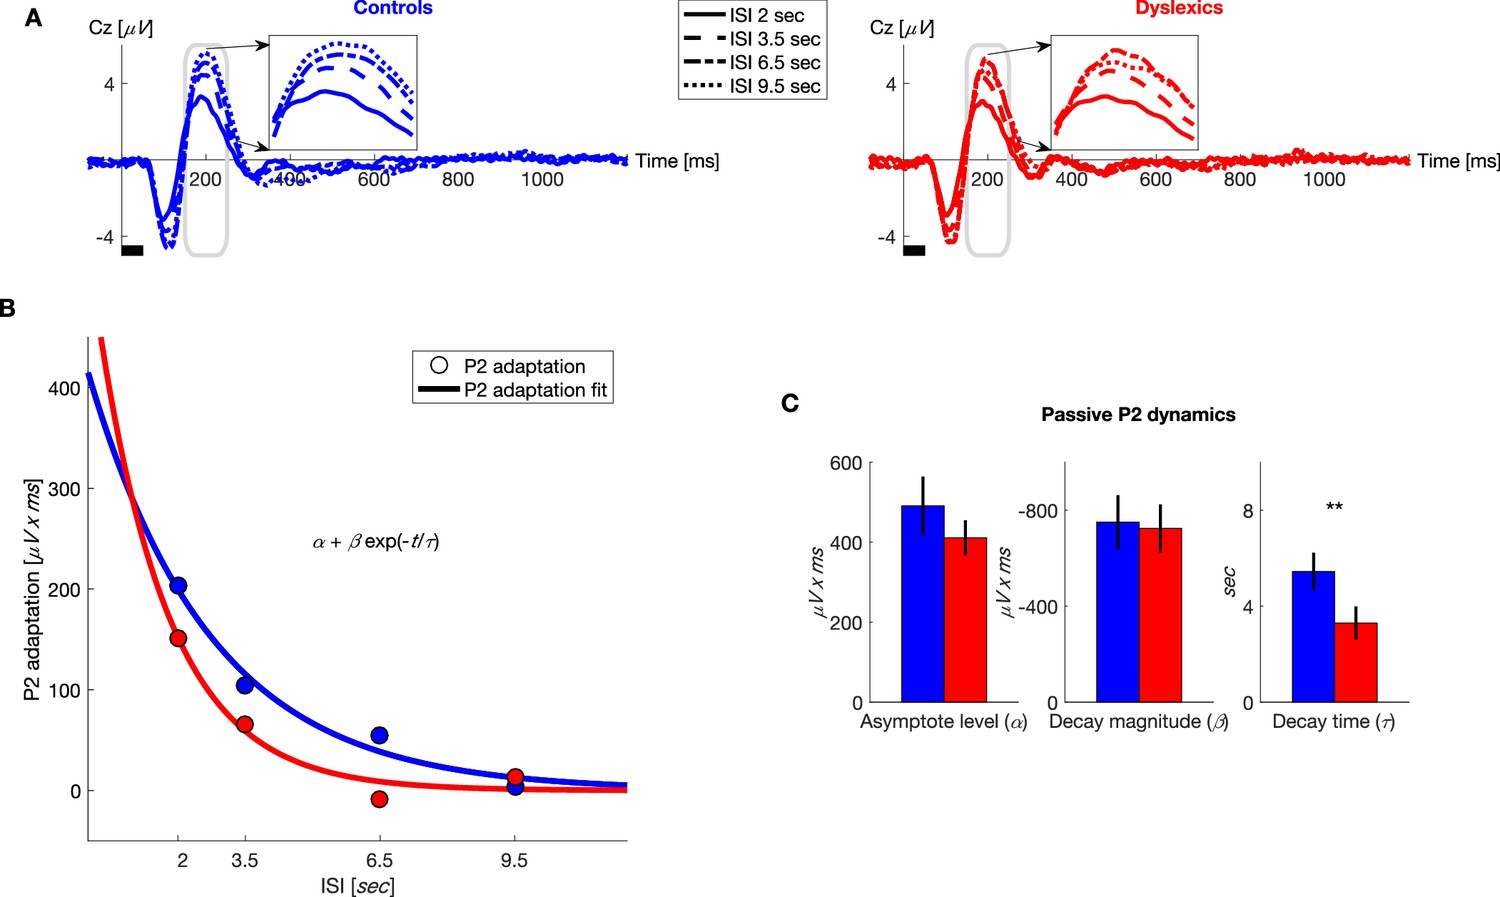
Under passive conditions, dyslexics’ P2 adaptation is shorter than controls’.
(A) Grand average ERPs, plotted separately for blocks with different ISIs, for controls (blue, left) and dyslexics (red, right). Insets: P2 range enlarged. Dyslexics’ P2 area was largest for the 6.5 s ISI, whereas controls’ P2 was largest for the 9.5 s ISI. (B) The magnitude of P2 adaptation as a function of time from the previous stimulus (ISI) under passive condition (circles) fitted with an exponential decay model (solid line). Controls in blue; dyslexics in red. (C) Groups’ mean and SEM of individually fitted estimated parameters of P2 recovery from adaptation. Dyslexics differed from controls only in the estimated rate of decay (p<0.005).
Figure 5
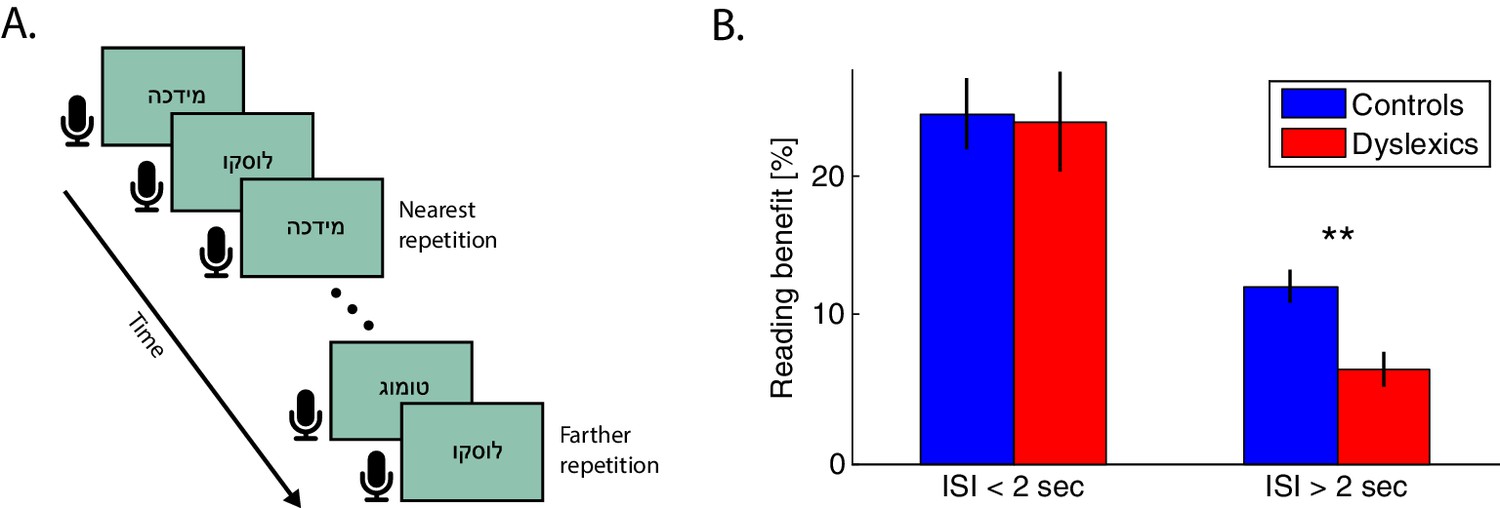
Dyslexics’ benefit from a previous exposure to the same non-word decayed faster than controls’.
(A) Schematic illustration of the reading task. Subjects were asked to read the non-words aloud as quickly as possible. Presentation switched to the next word with the subject’s voice offset. The closest repetition of the same non-word was with one intervening non-word (i.e. an ITI of <2 s). (B) Benefit in RTs (response times from visual word presentation to vocal onset) as a function of the time interval between the first and second presentation of the same non-word. Improvement was calculated as the difference in RT between the first and second presentation of the same non-word in the block. At very short intervals (<2 s), the benefit was similar for both groups. However, this benefit decayed faster (at interval >2 s) among dyslexics (red) than among controls (blue; p<0.005). Error bars denote standard error (SEM).
Author response image 1
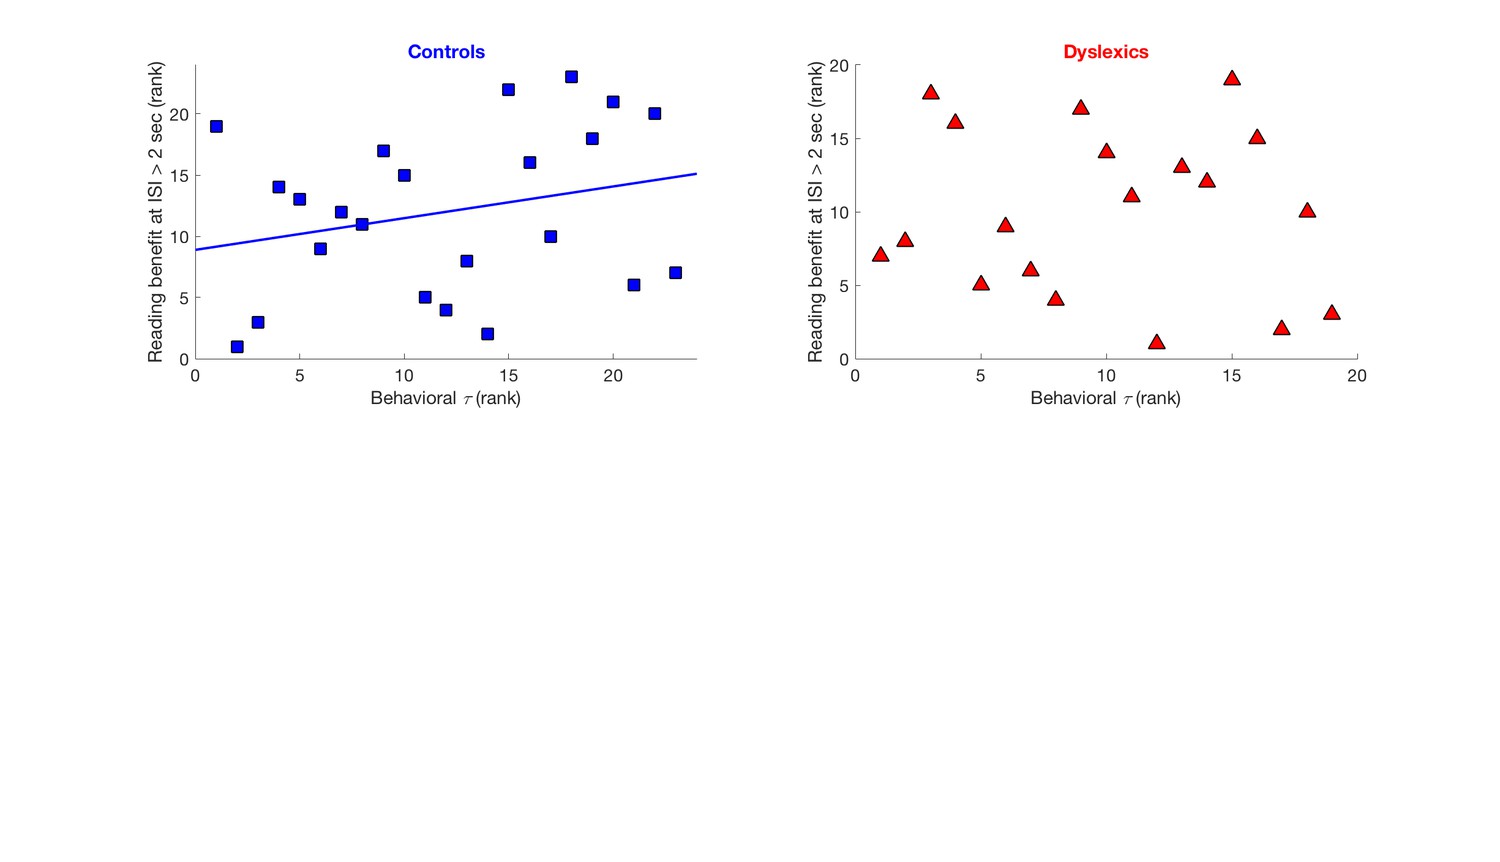
Cross-subject correlation between behavioral time constants of implicit memory decay and behavioral benefits in reading a repeated non-word, when repetition occurred with more than 2 seconds intervals.
Left: Significant correlation among controls (Spearman’s R = 0.48, p < 0.05). Right: no correlation among dyslexics (Spearman’s R = -0.28, n.s.). Data shown as rank order to correspond with the statistical test which was applied.
Tables
Table 1
Cognitive scores for the dyslexic and control groups (mean and standard deviation). Dyslexics differed from their good-reader peers in all phonological tasks and in verbal working memory, but not in their general reasoning skills (Mann-Whitney U tests).
Test | Control (STD) N = 30 | Dyslexic (STD) N = 30 | Mann-Whitney z value |
|---|---|---|---|
Age (years) | 25.8 (3.0) | 24.3 (3.1) | 1.6 |
General cognitive (scaled) | |||
Block Design | 12.4 (2.9) | 12.1 (3.5) | 0.3 |
Digit Span | 11.1 (2.8) | 7.8 (1.7) | 4.7*** |
Phonological speed [items/minute] | |||
Pseudo-word reading rate | 58.4 (24.4) | 32.2 (10.5) | 4.4*** |
Single-word reading rate | 96.8 (32.5) | 68.3 (25.8) | 3.3** |
Word pattern recognition rate | 68.1 (15.2) | 39.9 (13.5) | 5.6*** |
Passage reading rate | 140.4 (23.8) | 97.8 (22.3) | 5.7*** |
Spoonerism rate | 10.0 (3.0) | 5.8 (3.2) | 4.6*** |
Phonological accuracy [% correct] | |||
Pseudo-word reading accuracy | 89.7 (11. 2) | 62.4 (18.3) | 5.1*** |
Single-word reading accuracy | 97.1 (4.3) | 87.6 (8.3) | 4.8*** |
Word pattern recognition accuracy | 100 (0) | 96.2 (6.4) | 4.3*** |
Passage reading accuracy | 98.6 (1.4) | 94.8 (4.5) | 4.9*** |
Spoonerism accuracy | 92.2 (6.8) | 77.9 (18) | 3.2** |
-
*p<0.05; **p<0.005; ***p<0.0005.
Download links
A two-part list of links to download the article, or parts of the article, in various formats.
Downloads (link to download the article as PDF)
Open citations (links to open the citations from this article in various online reference manager services)
Cite this article (links to download the citations from this article in formats compatible with various reference manager tools)
Dyslexics’ faster decay of implicit memory for sounds and words is manifested in their shorter neural adaptation
eLife 6:e20557.
https://doi.org/10.7554/eLife.20557


