Sub-synaptic, multiplexed analysis of proteins reveals Fragile X related protein 2 is mislocalized in Fmr1 KO synapses
- Stanford University School of Medicine, United States
- Allen Institute for Brain Science, USA
- INSERM 1024, Ecole Normale Supérieure, France
Figures
Figure 1 with 1 supplement
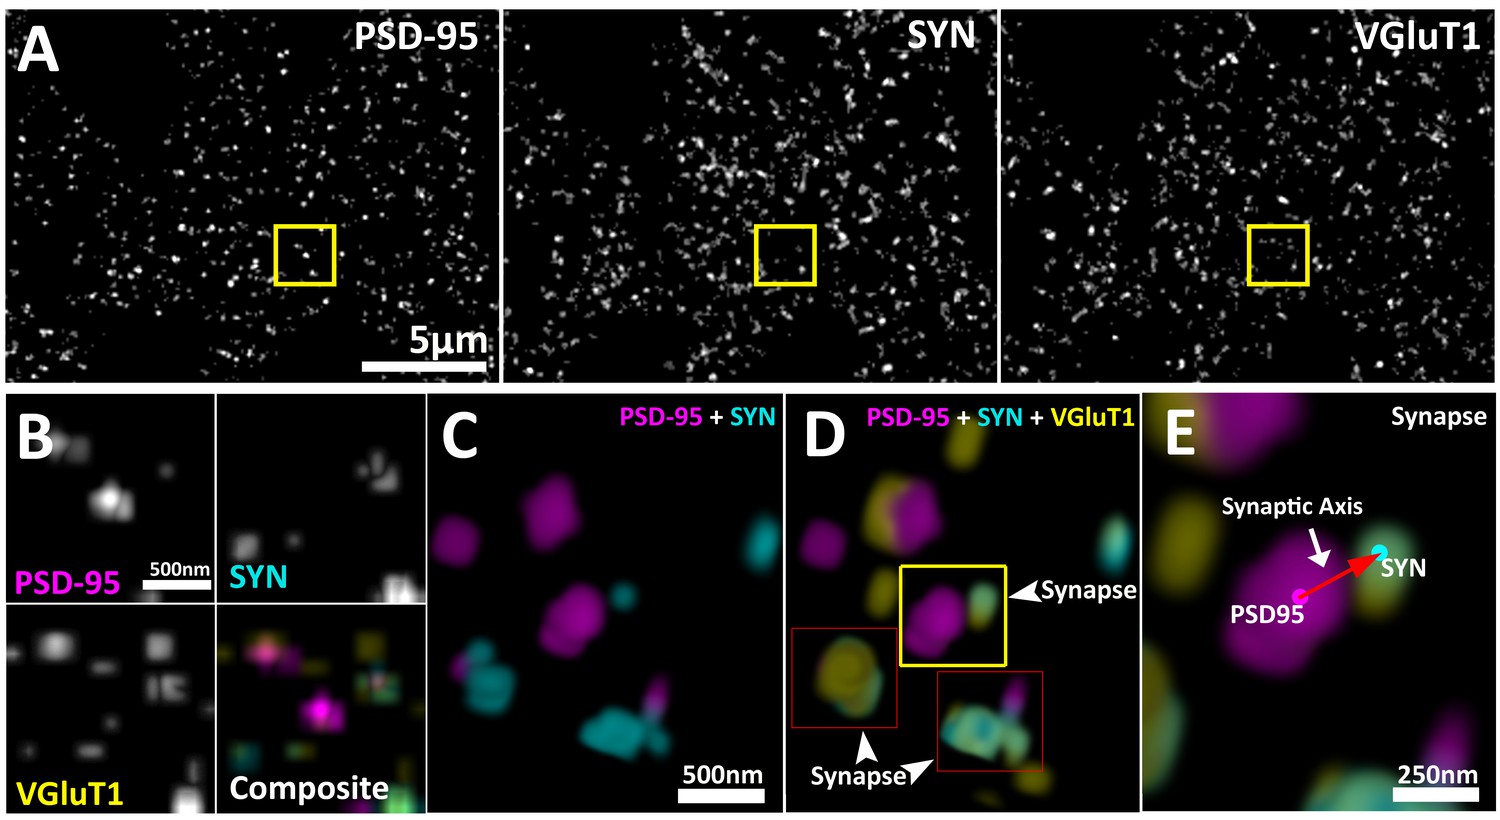
Multiplexed visualization of synaptic proteins in AT.
(A) Representative maximum (max) projections (25 µm by 20 µm by 1.5 µm) of PSD95, SYN and VGluT1. Scale bar = 5 µm. (B) Up-sampled view of the highlighted regions in panel (A) that represents a volume of 1.5 µm x 1.5 µm x 1.5 µm. Scale bar = 500 nm. (C–E) Composite 3D rendering and rotational perspectives of PSD95 and SYN, and PSD95, SYN and VGluT1 volumes highlighted in panel (B). Scale bar = 500 nm. (D) Arrow heads point to putative synapses revealed by the structured localization of synaptic proteins. (E) Expanded panel of the central synapse in panel (C) (Yellow box). Red arrow illustrates a synaptic axis drawn from the center of mass of a PSD95 punctum to a SYN punctum. Scale bar = 250 nm.
Figure 1—figure supplement 1
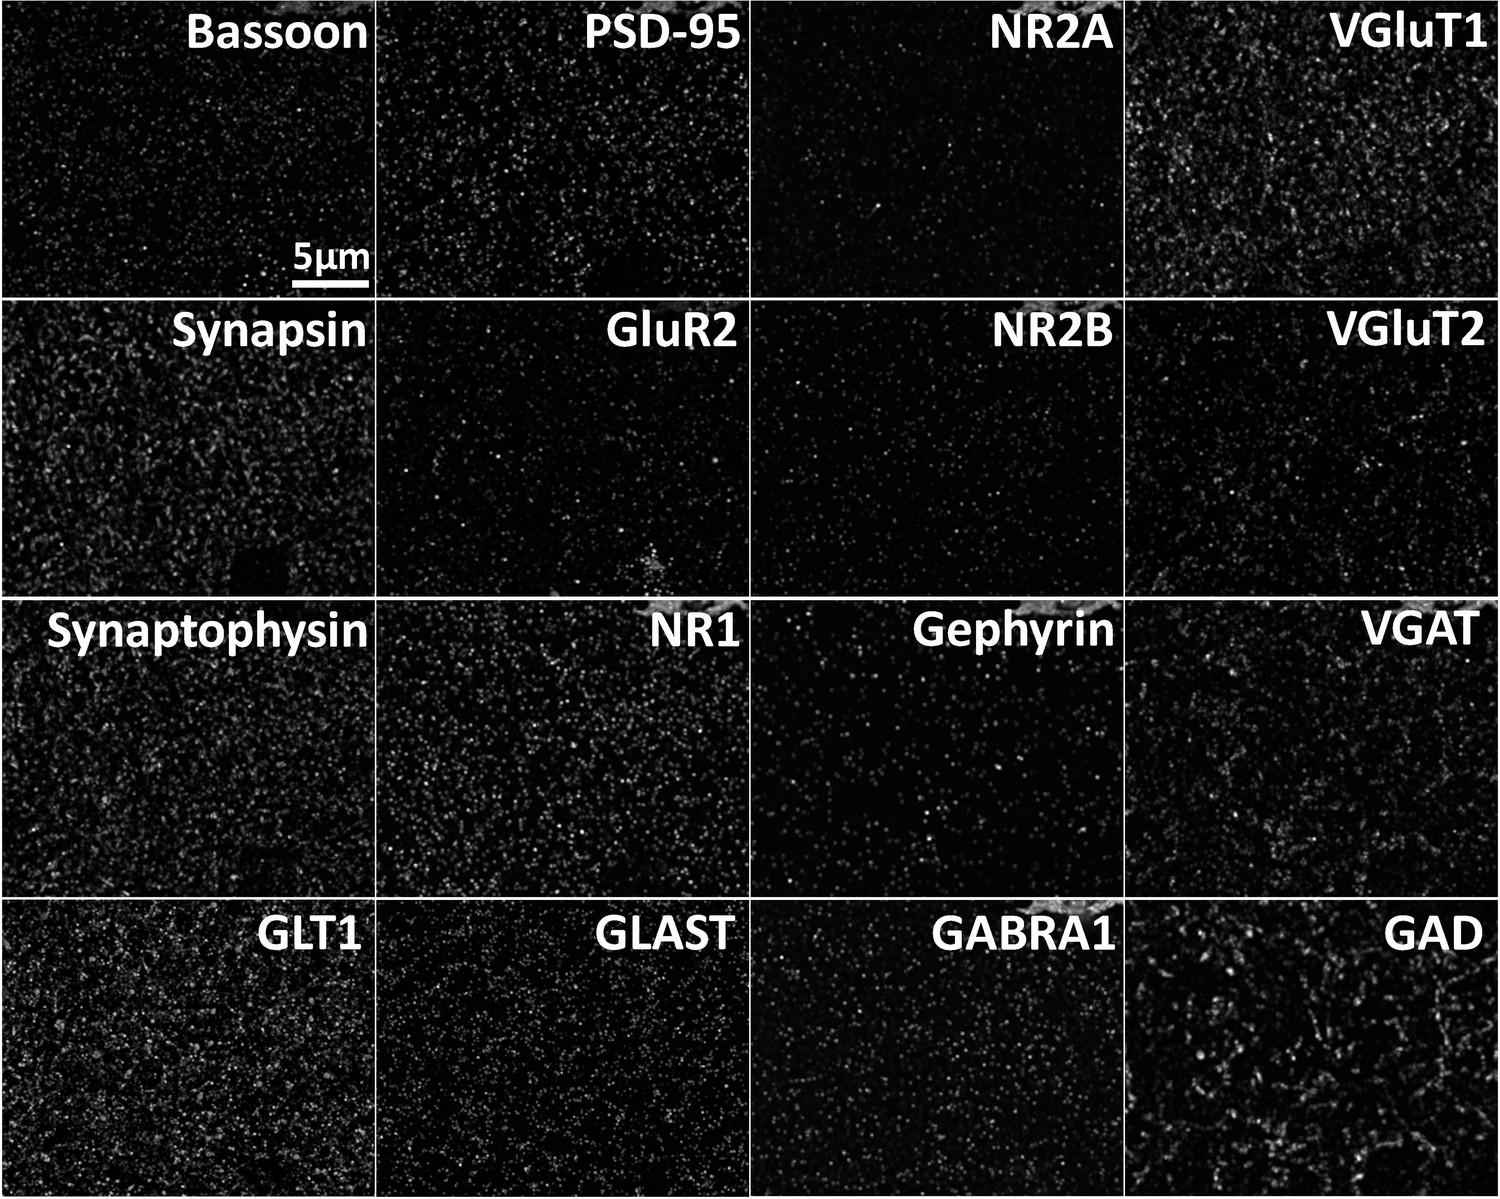
Array tomography generates spatially registered volumes of multiplexed protein data.
Max projection of multiple proteins imaged in the same volume of cortex. Max projection of 25 µm x 20 µm x 0.7 µm of array tomography image volume. Scale Bar = 5 µm.
Figure 2
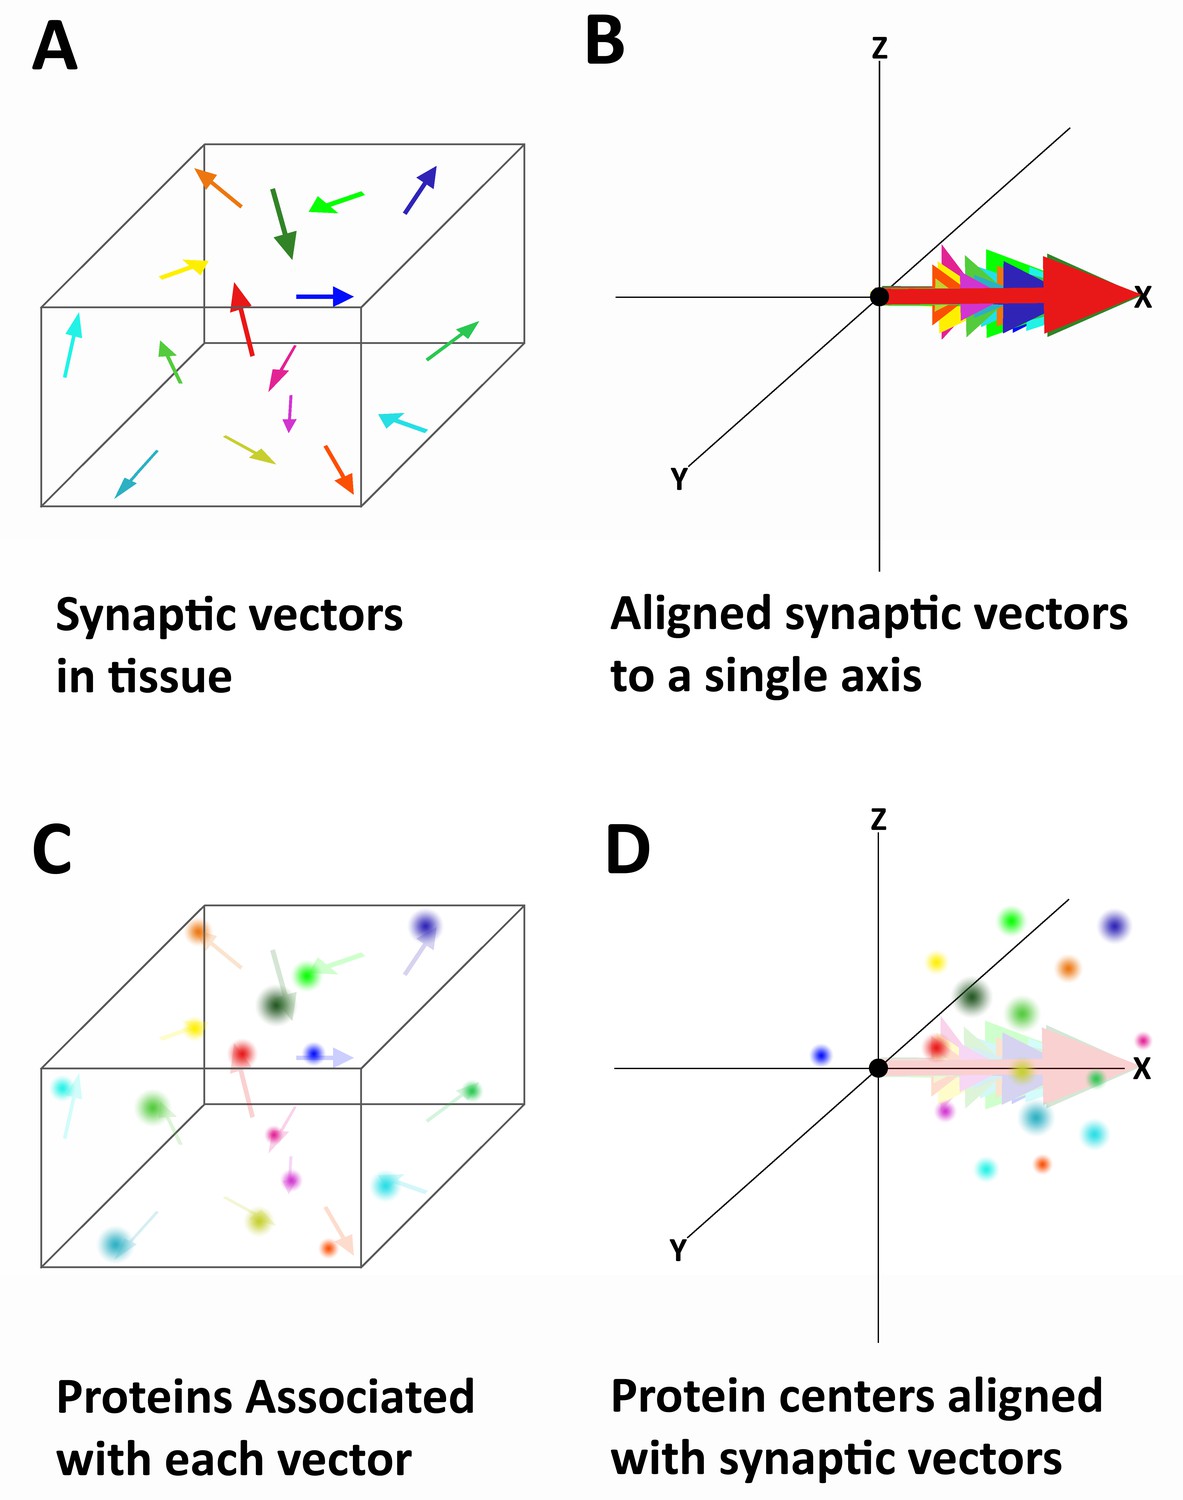
Alignment of synaptic axes into a single spatial coordinate system.
(A) Diagrammatic representation of the random orientation of synaptic axes in normal cortical tissue. (B) All the axes are translated to a single origin and then computationally rotated on to a single axis. This creates a single space in which all of the synapses are aligned along the synaptic axis. (C) Proteins associated with each synapse are disorganized in space, but have a structured relationship with the synaptic axis. This is difficult to see in tissue because the synapses are not ordered. (D) Once the synapses are aligned, the proteins associated with each synapse are also aligned and any non-random structure of their relationship to the synaptic axis is revealed.
Figure 3 with 1 supplement
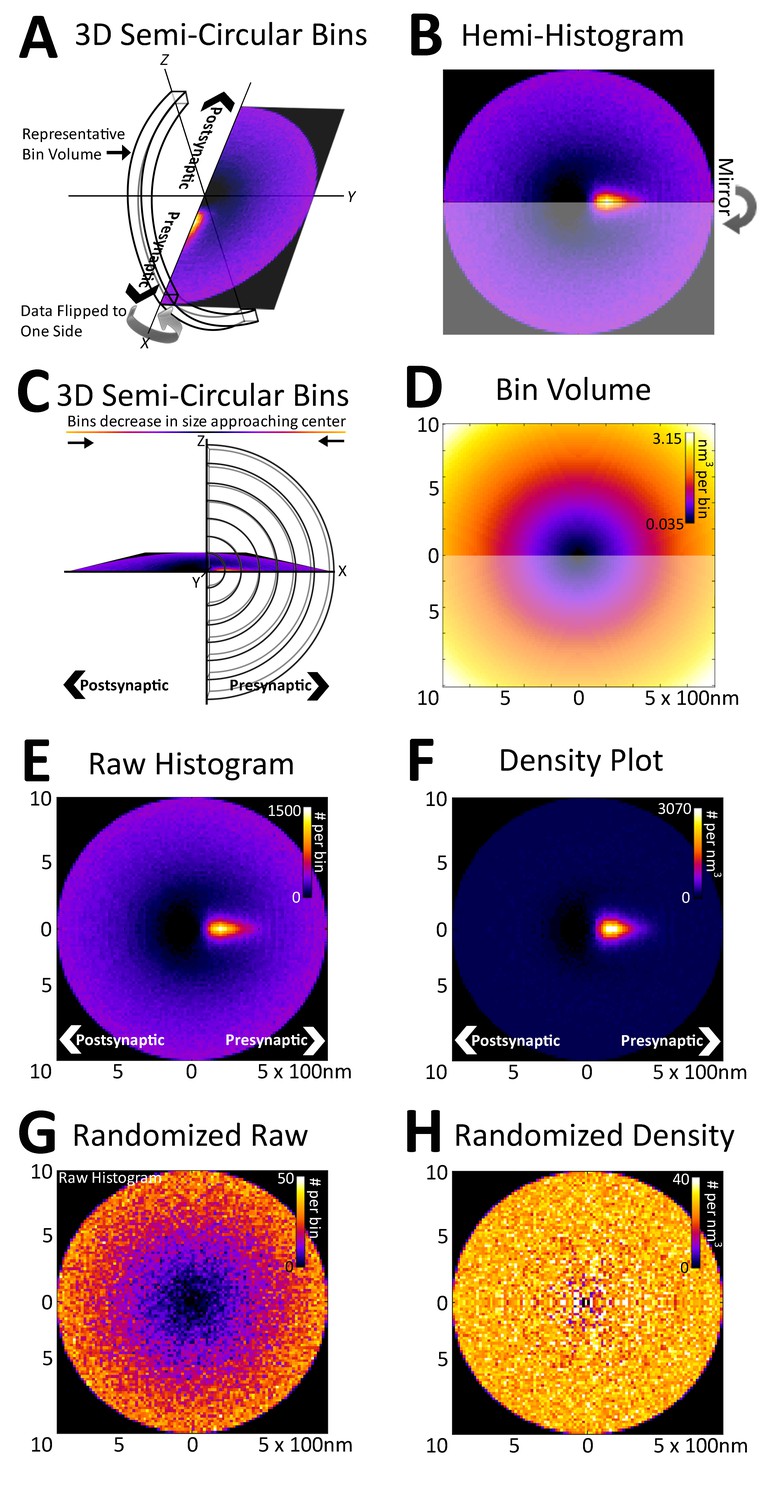
Registration of synapses reveals a nanometer-resolution probability distribution of synaptic proteins.
(A) Protein centers from registered synapses are summed using bins that are slices of spherical shells to maintain the distance of each center to the origin. As there is no rotational invariance along the x-axis, the data are binned into a hemi-histogram. (B) This hemi-histogram is then mirrored to provide a better representation of the full synapse. (C) A profile view of the bins further depicts the size change of the bins as they move from the center. (D) A graphical depiction of bin volumes moving from the center of the figure. (E) This raw 2D histogram is generated for all the VGluT1 centers within a 1 µm radius sphere around the central PSD95 (origin) of VGluT1 class synaptic axes (n = 36,997). (F) The raw histogram is normalized by the calculated volume of each bin to create the density histogram. The density histogram represents the probability of a VGluT1 center landing in that location in the average synapse of that population. (G) The relationship of VGluT1 centers to their associated synaptic axes is randomized and the resulting histogram is plotted, which looks very much like (D). (H) The density histogram created from these randomized data shows no probability bias, thus creating a flat and featureless image.
Figure 3—figure supplement 1
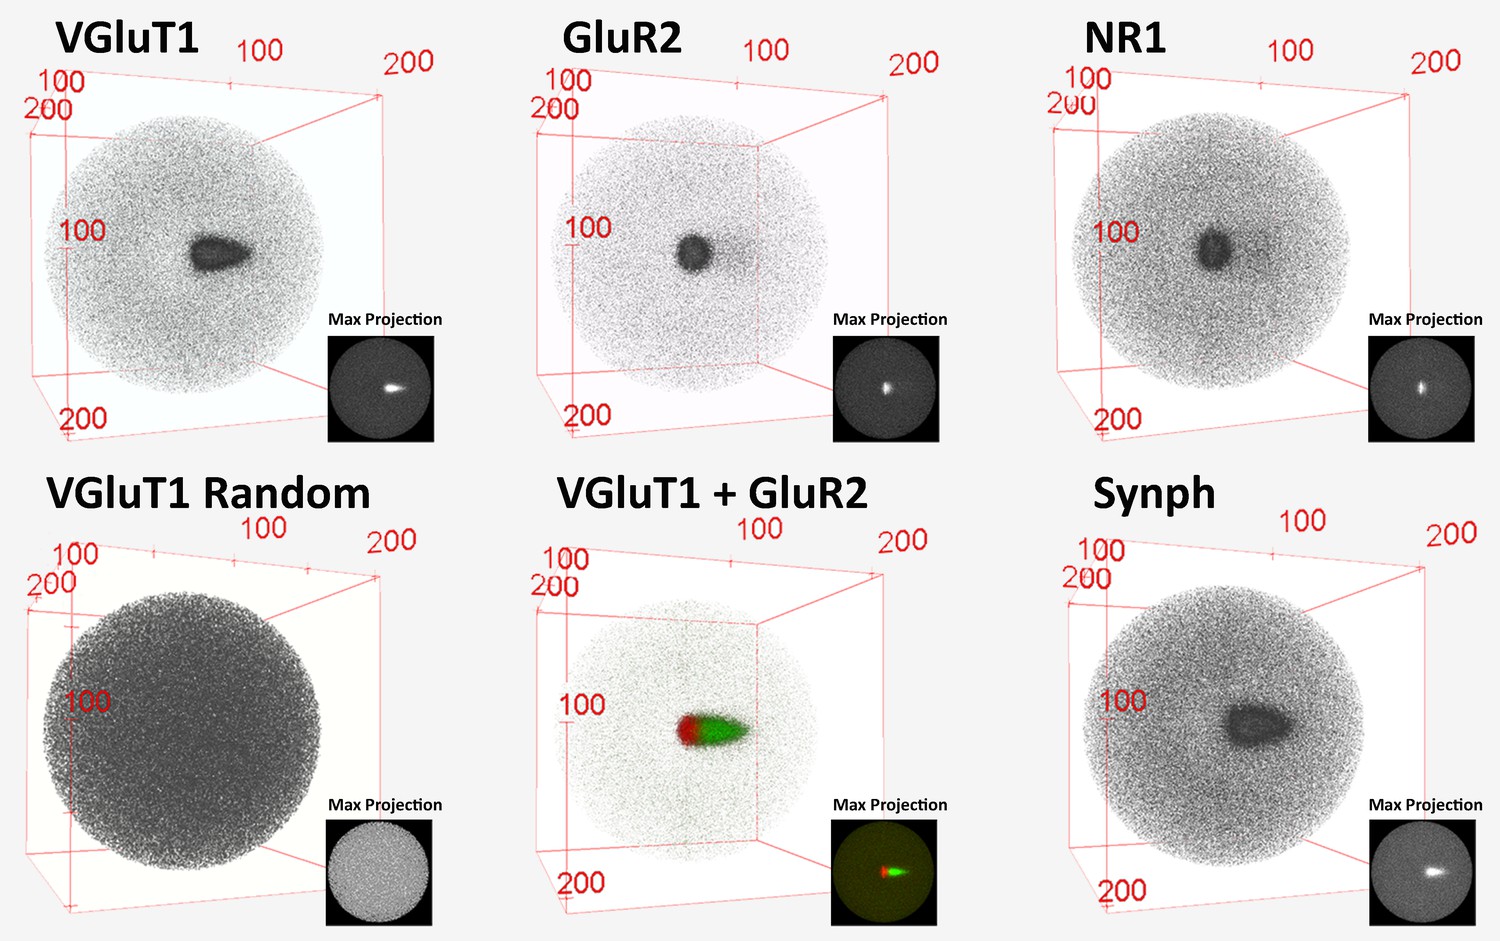
3D histograms of SubSynMAP data.
3D visualization of pre-2D projection VGluT1, GluR2, NR1, SYNPH and randomized VGluT1 data. The bins of the 3D histograms are of equal volume, 10 nm3. Note that the random data produce a sphere and the composite VGluT1 and GluR2 showed pre- and post-synaptic alignment.
Figure 4

Quantitative differences in the nanometer distribution of synaptic proteins in layer 4 VGluT1 synapses.
Volume-normalized 2D probability plots were generated from 36,997 classified VGluT1 synapses in Layer 4 of mouse cortex. Each channel reveals specific information regarding the distribution of those proteins in relation to the synaptic axis. The 2D distributions are further reduced to a 1D distribution to ease the visual and statistical comparison of the data. The dashed red line represents the putative location of the synaptic cleft. The y-axis scale is in percentage points, because density is converted to percent probability by dividing the number of protein centers per bin by the number of synapses. This generates an estimated percent probability that a protein center can be found at a position in space in the average synapse of that class. (A–F) Pre- and post-synaptic protein distributions are clearly differentiated. The distributions of presynaptic vesicular proteins (VGluT1 and SYNPH) are significantly different from those of the presynaptic active zone protein BSN. (G–J) Astrocytic proteins are distributed as halos surrounding the synapse center. (J) The exclusion at the center of the GLT1 halo fits the distribution of the presynaptic and postsynaptic proteins nicely.
Figure 5 with 1 supplement
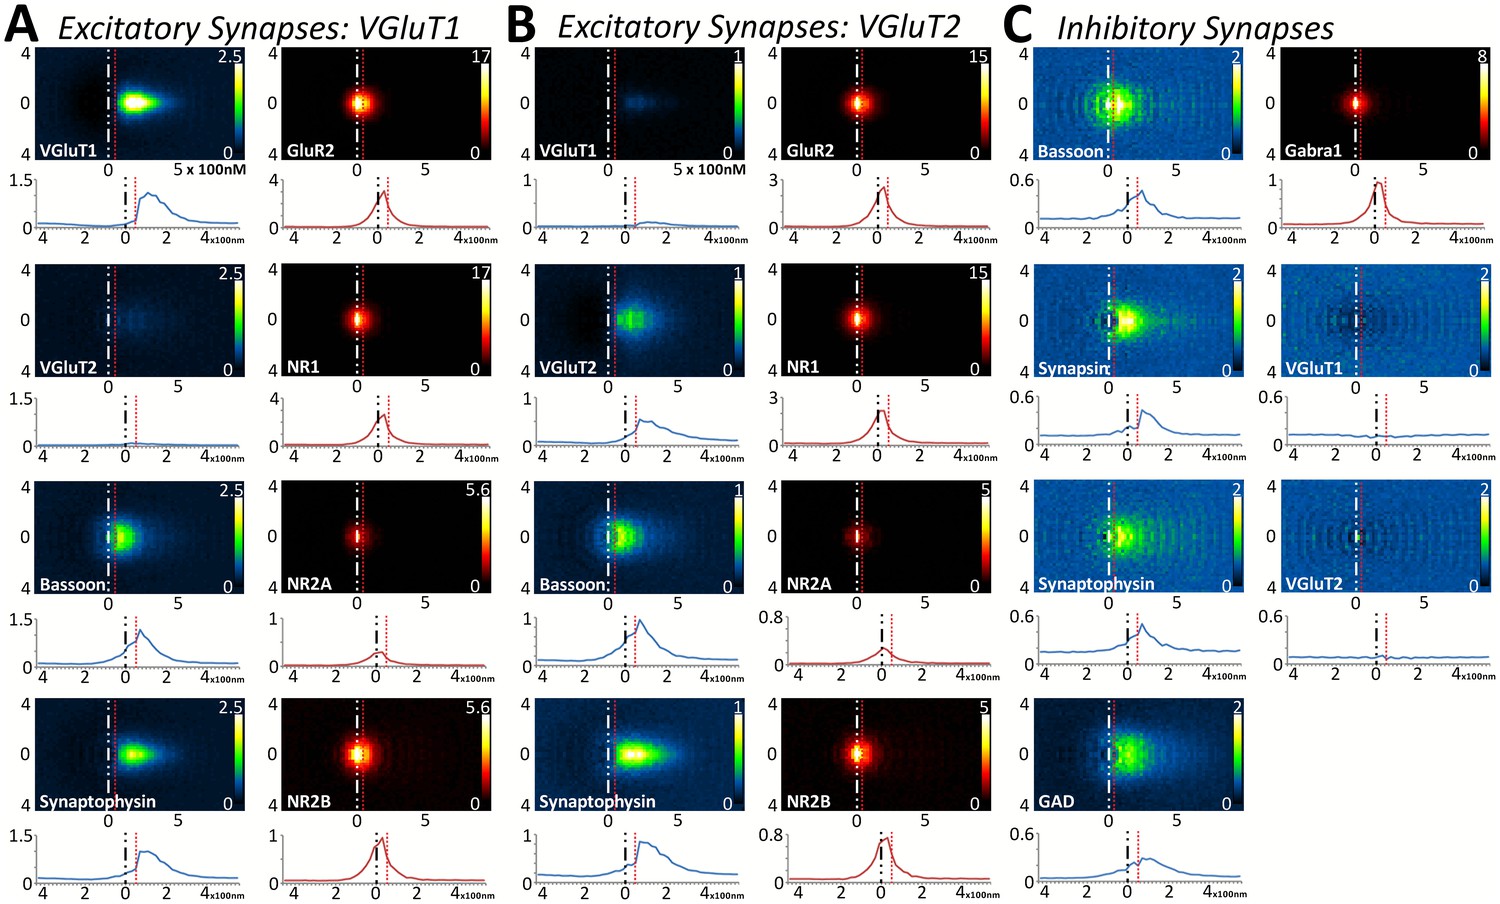
Multiplexed analysis of synaptic protein distribution across Layer 4 synapse classes.
(A–B) Probability distribution of proteins in glutamatergic synapses. (A) Probability distributions of proteins surrounding VGluT1 (n = 36,997). (B) Probability distributions of proteins surrounding VGluT2 (n = 6047). (C) Probability distribution of proteins in GABAergic synapses (n = 8100). Note that VGluT1 synapses have low levels of VGluT2, and VGluT2 synapses have low levels of VGluT1. Inhibitory synapses do not have VGluT1 or VGluT2. In fact, the dip in the center of histogram reveals that VGluT1 is anti-correlated with inhibitory synapses. Source data for the histograms in this figure can be found in Figure 5—source data 1.
-
Figure 5—source data 1
Multiplexed analysis of synaptic protein distribution across Layer 4 synapse classes.
Source data for the 1D histograms of protein distribution in Layer 4.
- https://doi.org/10.7554/eLife.20560.010
Figure 5—figure supplement 1
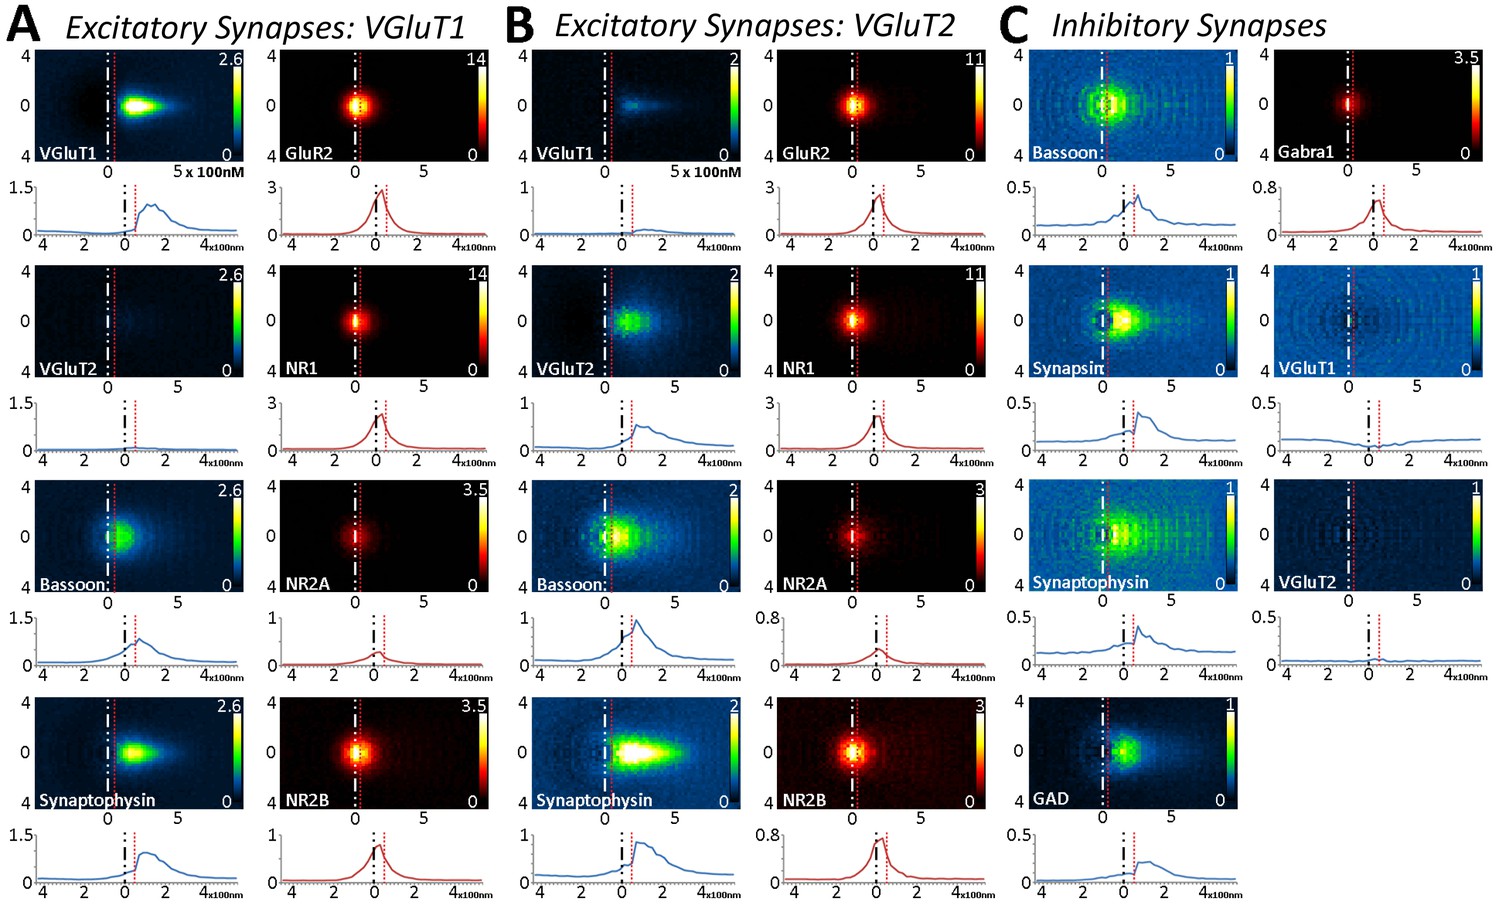
Large-scale analysis of synaptic protein distribution across Layer 5 synapse classes.
(A–B) Probability distribution of proteins in glutamatergic synapses. (A) Probability distributions of VGluT1 synapse proteins (n = 50,423). (B) VGluT2 (n = 5916). (C) GABAergic (n = 6252). Note that VGluT1 synapses have low levels of VGluT2, and VGluT2 synapses have low levels of VGluT1. Inhibitory synapses do not have VGluT1 or VGluT2. In fact, the dip in the center of histogram reveals that VGluT1 is anti-correlated with inhibitory synapses. Source data for the histograms in this figure can be found in Figure 5—figure supplement—source data 1.
-
Figure 5–figure supplement 1–source data 1
Multiplexed analysis of synaptic protein distribution across Layer 5 synapse classes.
Source data for the 1D histograms of protein distribution in Layer 5.
- https://doi.org/10.7554/eLife.20560.012
Figure 6
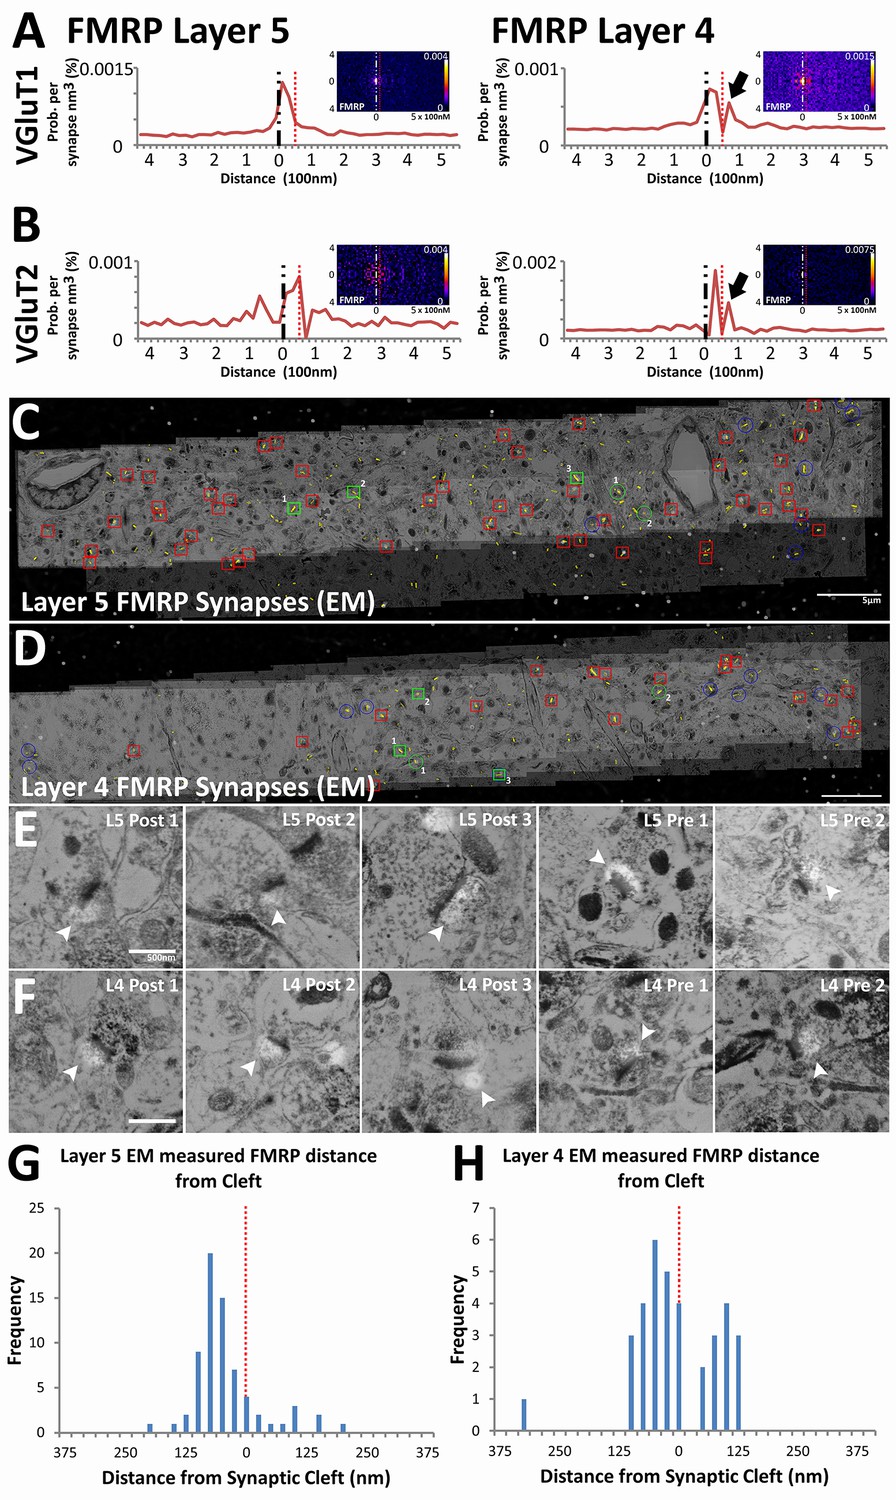
Presynaptic localization of FMRP is synapse class dependent.
(A) Synaptic distribution of FMRP in VGluT1 synapses of Layers 5 (n = 6877) and 4 (n = 11,346). FMRP peaks in the post-synapse for both Layer 5 and 4 VGluT1 class synapses, but only Layer 4 has a presynaptic peak too (black arrow). (B) Synaptic distribution of FMRP in VGluT2 synapses of Layers 5 (n = 487) and 4 (n = 1797). FMRP also peaks in the post-synapse in both Layer 5 and Layer 4 VGluT2 synapses. (C, D) Single-section images of EM micrographs aligned with single-section images of fluorescent FMRP staining. Red boxes are hand classified synapses with an associated FMRP punctum. Green boxes are exemplar synapses that are shown below in (E) and (F). (E, F) Example EM synapses with fluorescent FMRP labeling. Note the synaptic vesicles and PSD that allows for the delineation of the pre- and post-synapse. All images are single sections for both EM and fluorescence images. (G, H) Histograms of FMRP distance from the synaptic cleft (at 0), the presynaptic side is on the right and the postsynaptic side is on the left. (G) FMRP in Layer 5 is highly post-synaptic. (H) FMRP in Layer 4 is more evenly split between pre- and postsynapses. The EM histograms are also narrower, because of the z direction clipping of the EM dataset (210 nm in this figure), as compared to the light level dataset (2.8 µm in previous figures). Source data for the histograms in this figure can be found in Figure 6—source data 1 and 2.
-
Figure 6—source data 1
Presynaptic localization of FMRP is synapse-class dependent.
Source data for the 1D histograms of protein distribution at light level.
- https://doi.org/10.7554/eLife.20560.014
-
Figure 6—source data 2
Presynaptic localization of FMRP is synapse class dependent.
Source data for the 1D histograms of protein distribution at EM level.
- https://doi.org/10.7554/eLife.20560.015
Figure 7 with 2 supplements
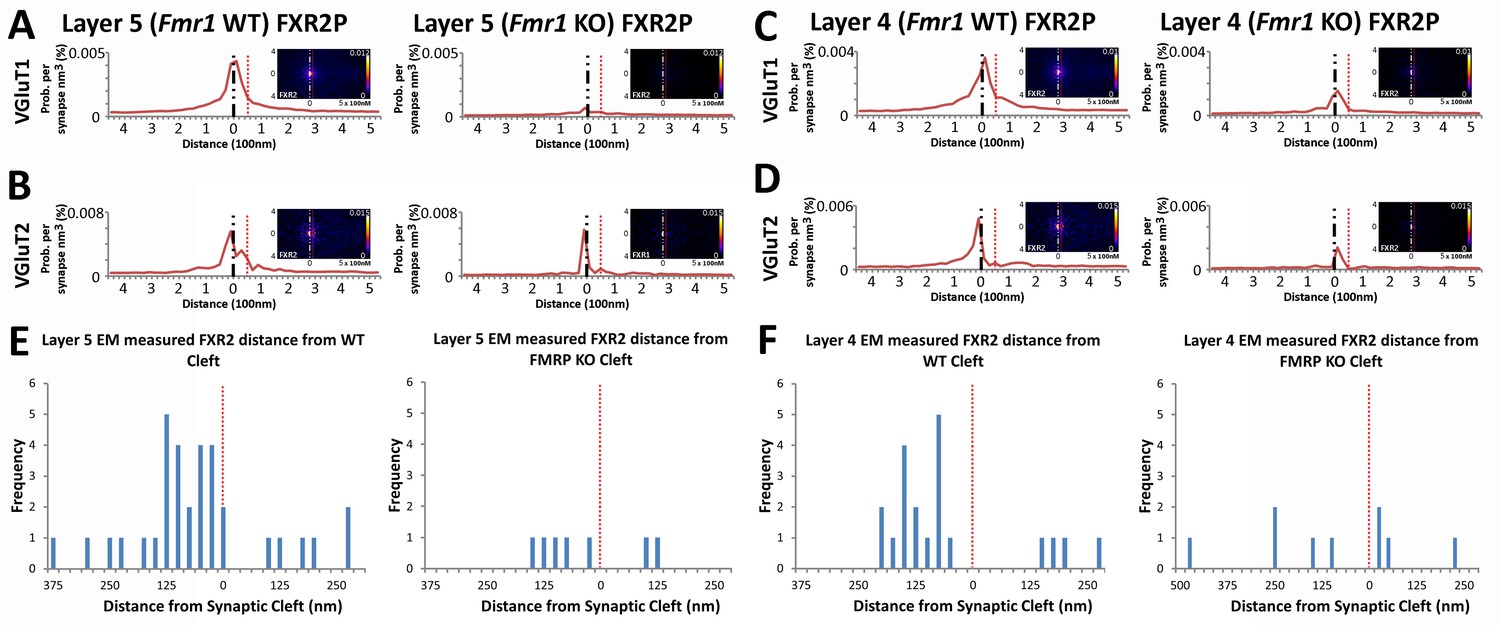
FXR2P synaptic localization is FMRP dependent.
(A) Synapse distribution of FXR2P in Layer 5 VGluT1 class synapses in both KO (n = 5381) and WT (n = 9481). FXR2P post-synaptic localization is dramatically reduced in Layer 5. (B) Synapse distribution of FXR2P in Layer 5 VGluT2 synapses in both KO (n = 563) and WT (n = 1483). FXR2P post-synaptic localization is reduced. (C) Synapse distribution of FXR2P in Layer 4 VGluT1 synapses in both KO (n = 5341) and WT (n = 9917). (D) Synapse distribution of FXR2P in Layer 4 VGluT2 synapses in both KO (n = 1207) and WT (n = 1783). Significance of distribution difference is tested via chi-squared two-sample tests (see 'Methods', p < 0.01). (E, F) EM distance histograms of FXR2 from synaptic cleft (at 0). Both Layers 4 and 5 show dramatic reduction of synaptic FXR2P. Source data for the histograms in this figure can be found in Figure 7—source data 1 and 2.
-
Figure 7—source data 1
FXR2P synaptic localization is FMRP dependent.
Source data for the 1D histograms of protein distribution at light level.
- https://doi.org/10.7554/eLife.20560.017
-
Figure 7—source data 2
FXR2P synaptic localization is FMRP dependent.
Source data for the 1D histograms of protein distribution at EM level.
- https://doi.org/10.7554/eLife.20560.018
Figure 7—figure supplement 1
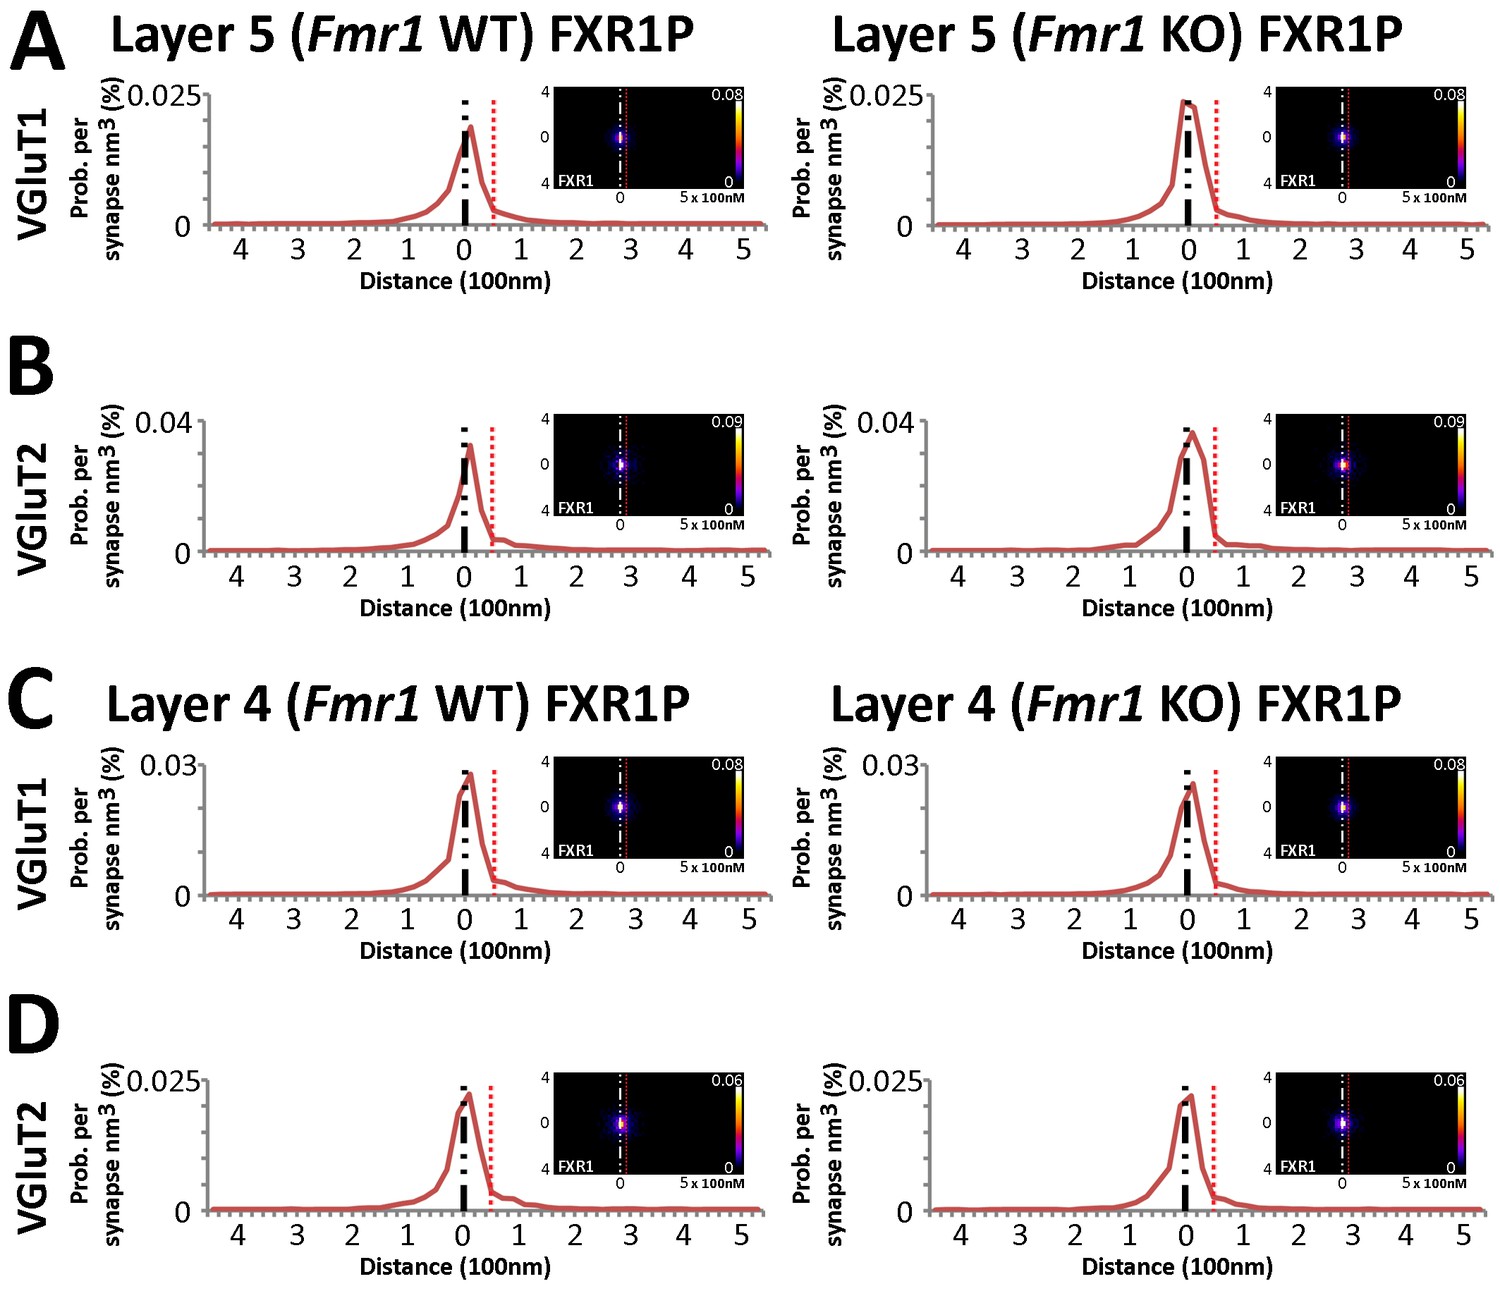
FXR1P synaptic localization is not FMRP dependent.
(A) Synapse distribution of FXR1P in Layer 5 VGluT1 synapses in both KO (n = 9838) and WT (n = 7948) mice. (B) Synapse distribution of FXR1P in Layer 5 VGluT2 synapses in both KO (n = 1008) and WT (n = 1338 )mice. (C) Synapse distribution of FXR1P in Layer 4 VGluT1 synapses in both KO (n = 9471) and WT (n = 11,091) mice. (D) Synapse distribution of FXR1P in Layer 4 VGluT2 synapses in both KO (n = 2009) and WT (n = 2027) mice. There is no significant change in FXR1P distribution in all layers and classes between KO and WT animals. Significance of distribution difference is tested via chi-squared two-sample tests (see 'Methods', p < 0.01). Source data for the histograms in this figure can be found in Figure 7—source data 1 and 2.
Figure 7—figure supplement 2
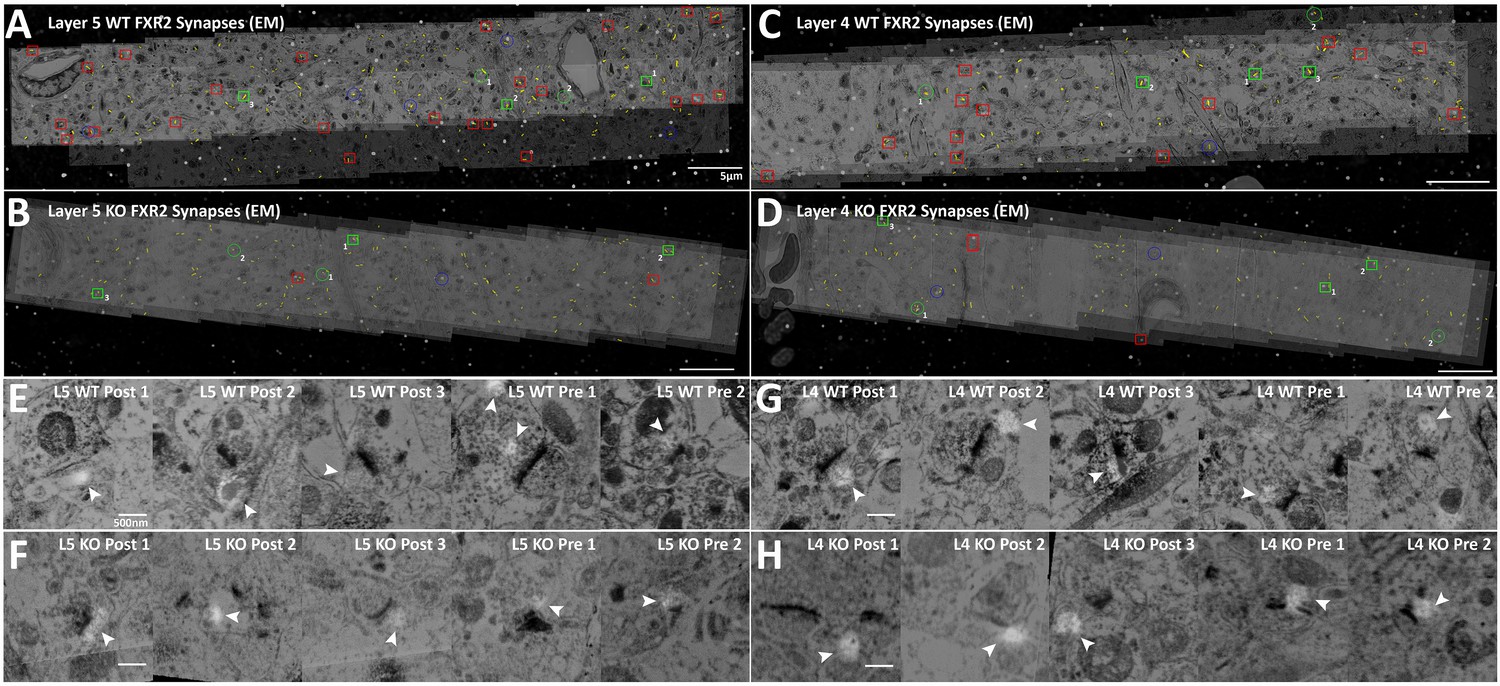
Conjugate EM visualization and localization of FXR2P synapses.
(A–D) Aligned images of EM micrographs with fluorescent FXR2P staining. Red boxes are hand classified synapses with an associated FMRP punctum. Green boxes are exemplar synapses that are shown below in (E–H). (E–H) Example EM synapses with fluorescent FXR2P labeling. Note the synaptic vesicles and PSD that allow for the delineation of the pre- and post-synapse.
Author response image 1
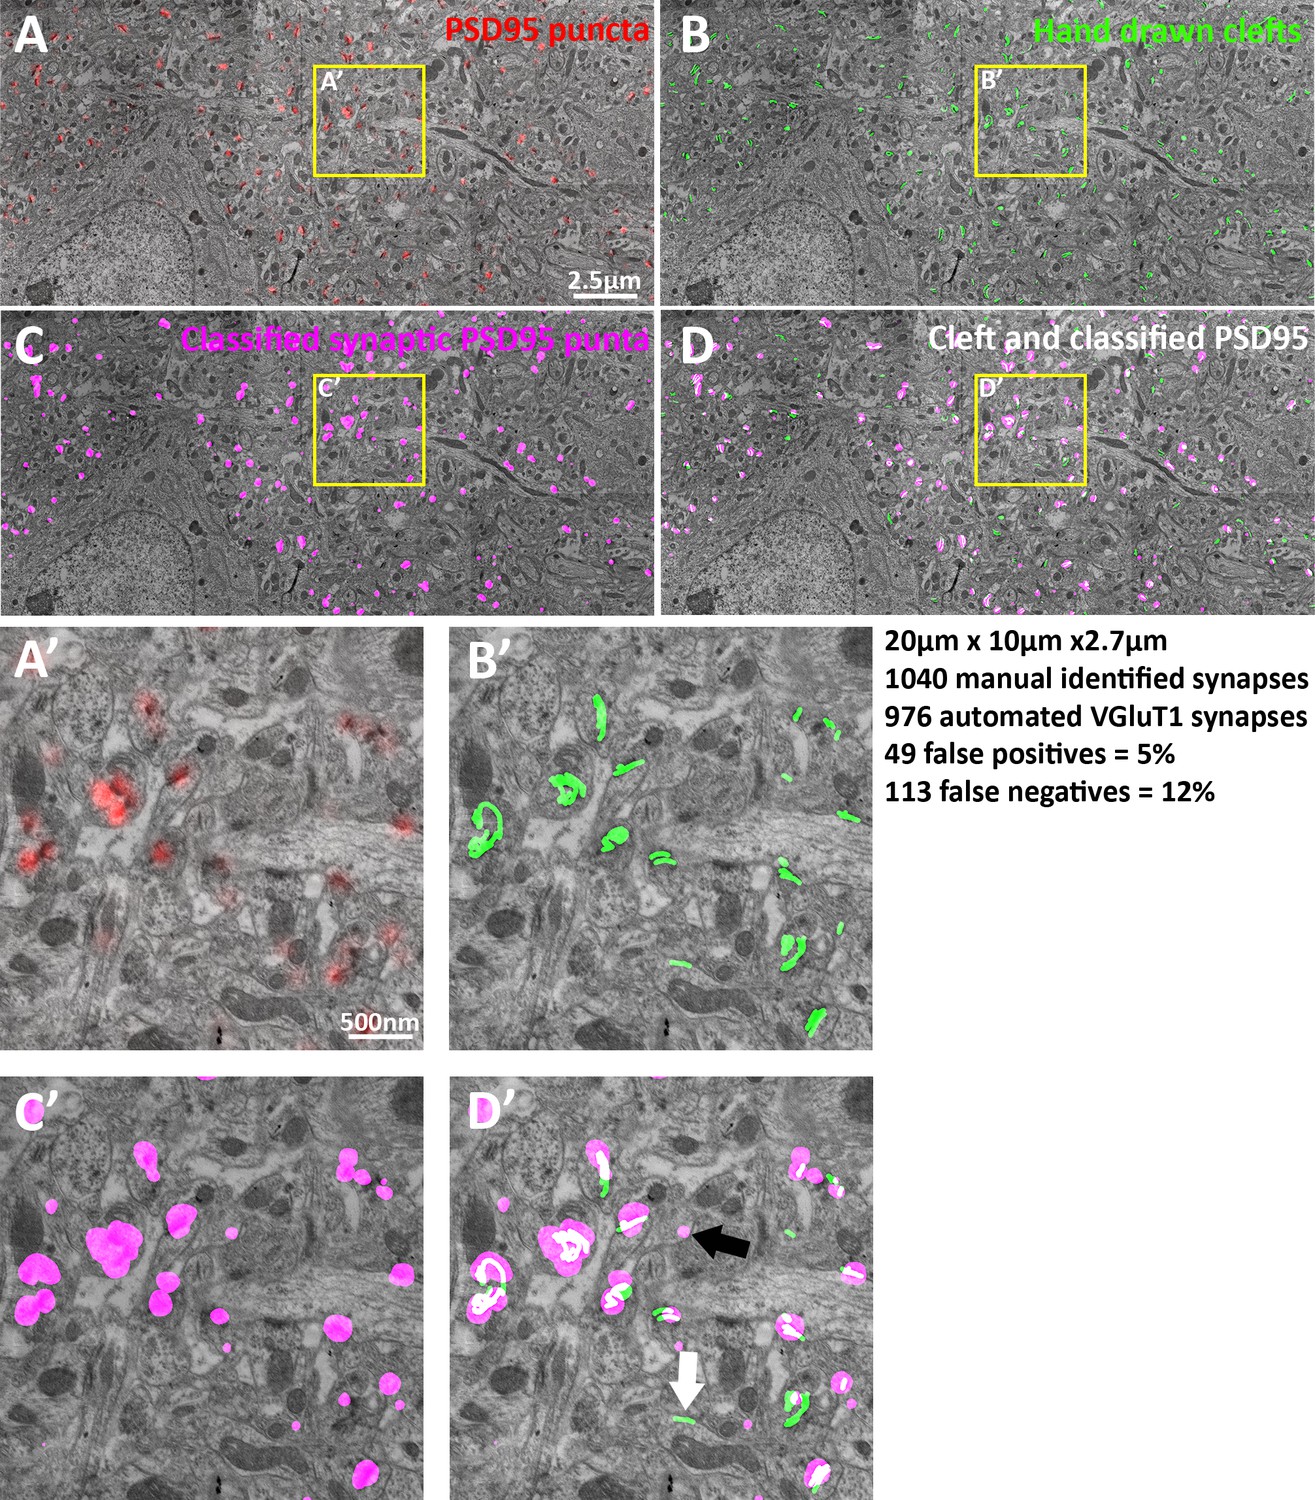
EM verification of excitatory synapse classification fidelity.
(A–D) Single large frame EM micrograph of mouse somatosensory cortex. (A) Raw PSD95 puncta from light level data superimposed on EM. (B) Hand traced synaptic clefts superimposed on EM. (C) Computer classified VGluT1 synapse post synaptic densities superimposed on EM. (D) Combination of B and C. (A’–D’) Zoomed in portions of the single EM micrograph. (D’) Black arrow point to a false positive and the white arrow point to a false negative. Note that the dataset is 3D thus some puncta not associated with clefts are associated in the z plane. Also due to the lack of a working VGluT2 antibody VGluT1 classified synapses are compared to all EM classified excitatory synapses, thus the false negative rate of VGluT1 is lower than the measured 12%.
Videos
Video 1
Histograms of SubSynMAP data.
3D visualization of VGluT1, GluR2, VGluT1 and GluR2 composite and of randomized VGluT1 data. The bins of the 3D histograms are of equal volume, 10 nm3. Note that the random data produces a sphere and the composite VGluT1 and GluR2 showed pre and post-synaptic alignment.
Download links
A two-part list of links to download the article, or parts of the article, in various formats.
Downloads (link to download the article as PDF)
Open citations (links to open the citations from this article in various online reference manager services)
Cite this article (links to download the citations from this article in formats compatible with various reference manager tools)
Sub-synaptic, multiplexed analysis of proteins reveals Fragile X related protein 2 is mislocalized in Fmr1 KO synapses
eLife 5:e20560.
https://doi.org/10.7554/eLife.20560


