Malaria parasite CelTOS targets the inner leaflet of cell membranes for pore-dependent disruption
- Washington University School of Medicine, United States
Figures
Figure 1 with 2 supplements
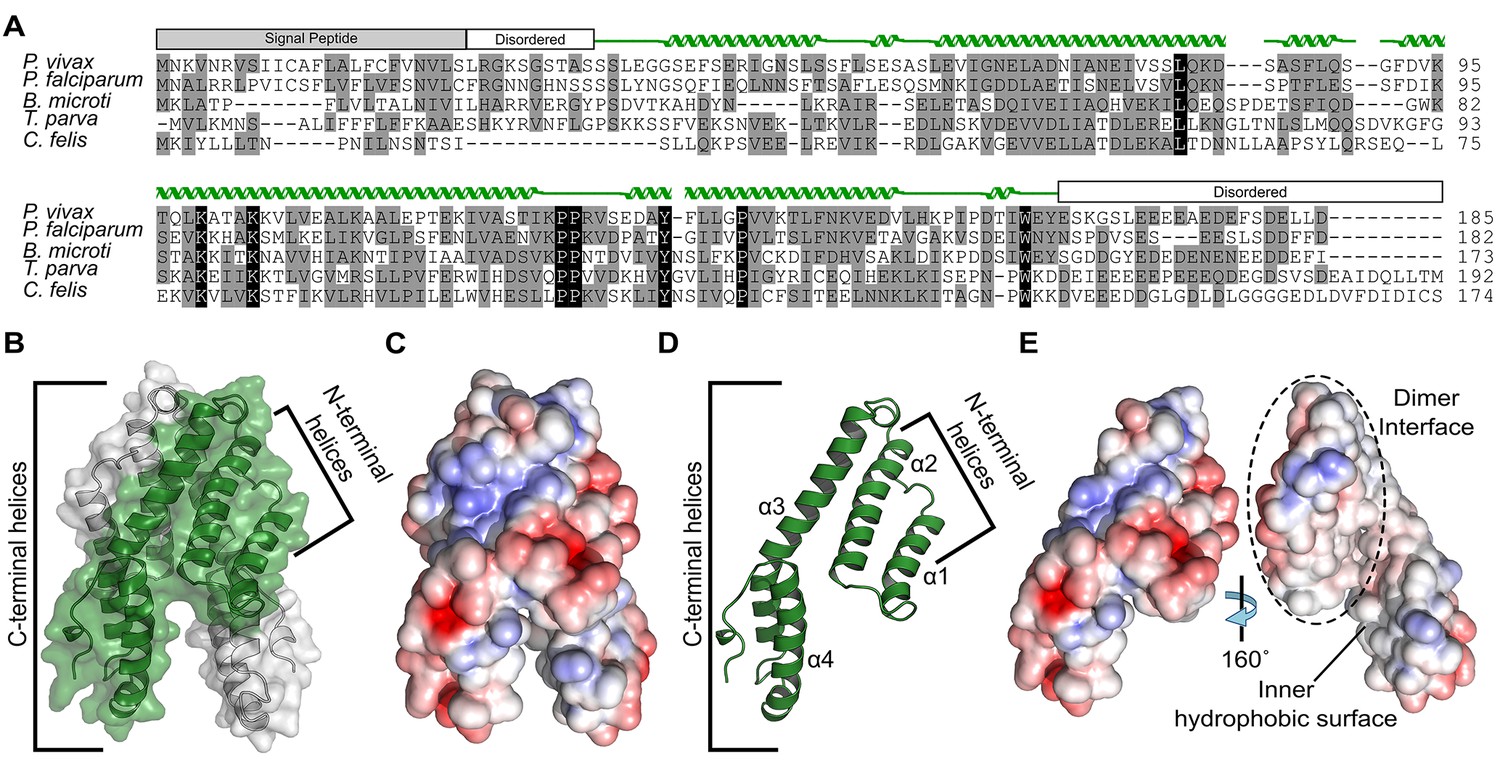
Alignment and structure of the conserved apicomplexan protein CelTOS from the human pathogen Plasmodium vivax (PvCelTOS).
(A) Alignment of CelTOS from apicomplexan parasites Plasmodium, Babesia, Theileria, Cytauxzoon, and mapping of the structural elements. In the alignment, grey shading represents similarity, black shading represents identity. The secondary structure features are based on the crystal structure of PvCelTOS and shown in green. Protein accession codes as follows: Plasmodium vivax [UniProtKB - A5JZX5], Plasmodium falciparum [UniProtKB - Q8I5P1], Babesia microti [UniProtKB - I7J9D8], Theileria parva [UniProtKB - Q4N982], Cytauxzoon felis [PiroplasmaDB - CF003135]. (B) PvCelTOS is an alpha helical dimer that resembles a tuning fork. Each monomer is in green or white ribbon and surface representation. (C) Surface maps of CelTOS dimer showing the electrostatic surface potential colored from red (−5 kT e−1) to blue (5 kT e−1). (D) The CelTOS monomer shown as ribbon representation can be separated into two distinct subdomains composed of N-terminal (α-helices 1 and 2) and C-terminal helices (α-helices 3 and 4). (E) Surface maps of CelTOS monomer reveals the inner hydrophobic surfaces composed of the dimer interface and one face of the tuning fork prongs. Coloring as in Figure 1C.
-
Figure 1—source data 1
Data collection, phasing and refinement statistics.
- https://doi.org/10.7554/eLife.20621.004
-
Figure 1—source data 2
Sedimentation equilibrium analytical ultracentrifugation analysis for Pf and PvCelTOS.
Three independent global fits for three concentrations and two speeds demonstrate Pf and PvCelTOS are dimers in solution. The theoretical monomer molecular weight for PfCelTOS and PvCelTOS are 18.655 kDa and 18.665 kDa, respectively.
- https://doi.org/10.7554/eLife.20621.005
Figure 1—figure supplement 1
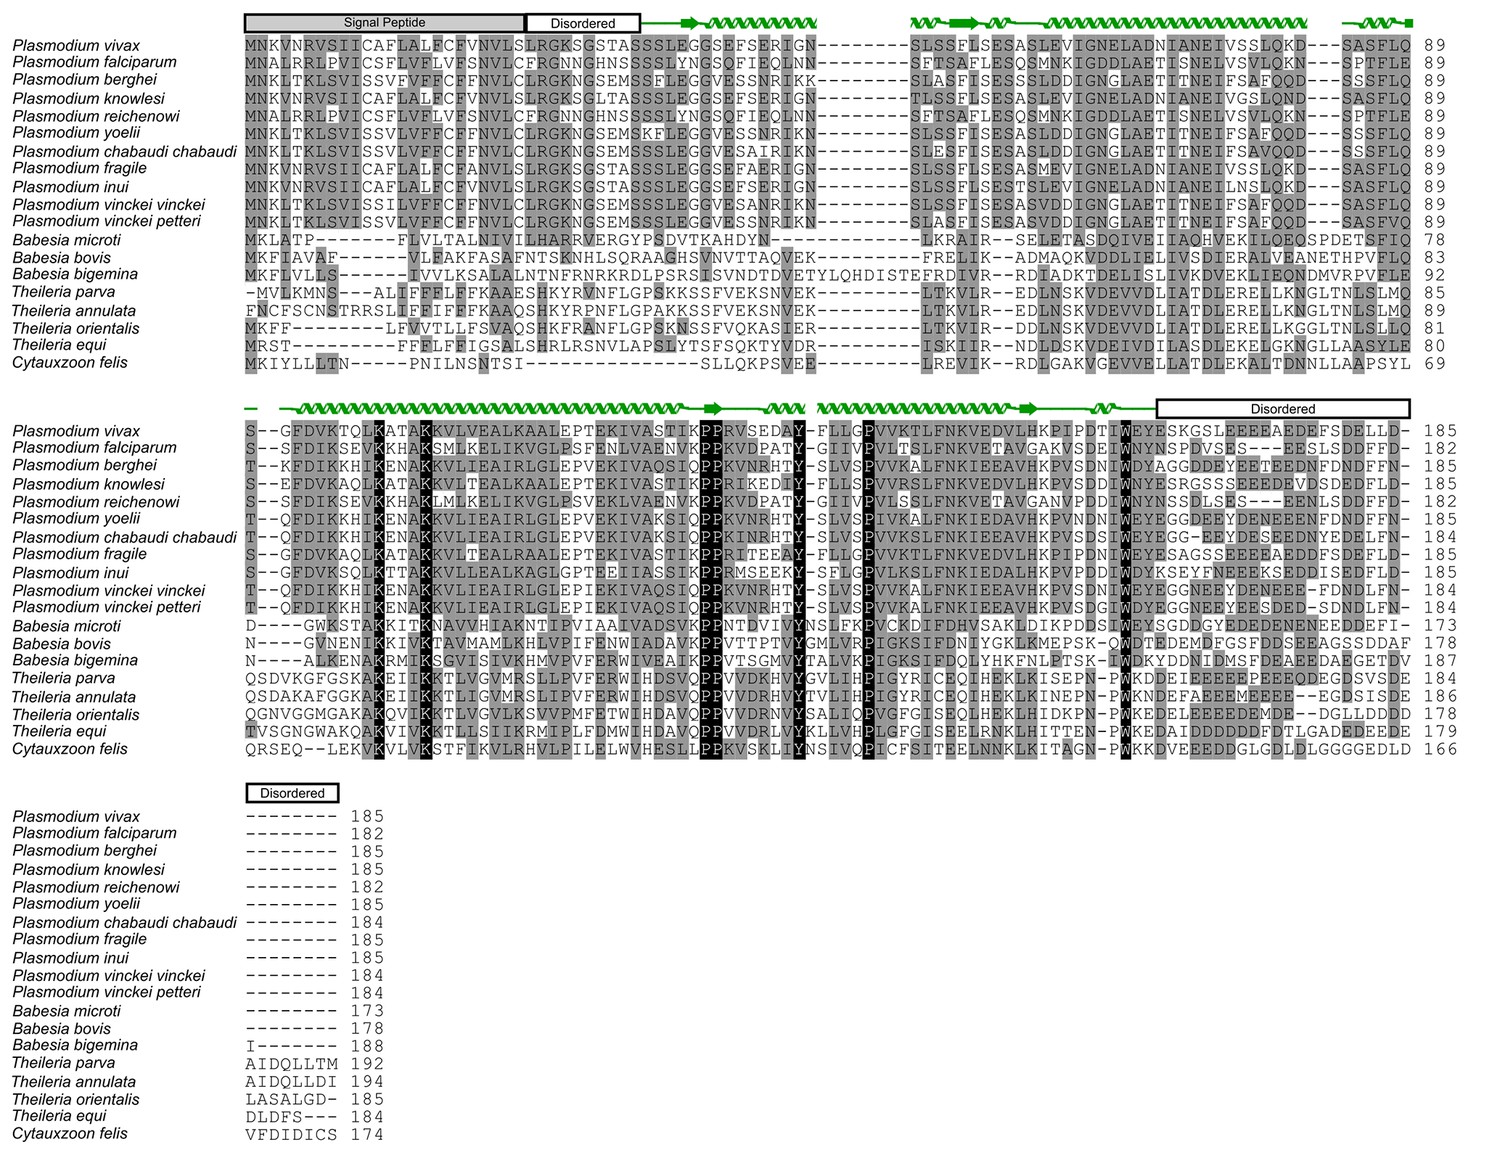
Alignment of CelTOS from Apicomplexan parasites and mapping of the structural elements.
In the alignment, grey shading represents similarity, black shading represents identity. Protein accession codes for CelTOS from the following Apicomplexan parasites are as follows: Plasmodium falciparum [UniProtKB - Q8I5P1], Plasmodium vivax [UniProtKB - A5JZX5], Plasmodium berghei [UniProtKB - Q4YC08], Plasmodium knowlesi [UniProtKB - B3LCG1], Plasmodium reichenowi [UniProtKB - A0A060RVP1], Plasmodium yoelii [UniProtKB - Q6T944], Plasmodium chabaudi chabaudi [UniProtKB - A0A077TR60], Plasmodium fragile [UniProtKB - A0A0D9QNC3], Plasmodium inui [UniProtKB - W7ABI3], Plasmodium vinckei vinckei [UniProtKB - W7B0C7], Plasmodium vinckei petteri [UniProtKB - W7B0C7], Babesia microti [UniProtKB - I7J9D8], Babesia bovis [UniProtKB - A7AQQ4], Babesia bigemina [UniProtKB - A0A061DAC2], Babesia equi [UniProtKB - L0AZQ6], Theileria parva [UniProtKB - Q4N982], Theileria annulata [UniProtKB - Q4UGH3], Theileria orientalis [UniProtKB - J7M8E0], Theileria equi [NCBI Reference Sequence: XP_004830035.1] and Cytauxzoon felis [PiroplasmaDB - CF003135].
Figure 1—figure supplement 2
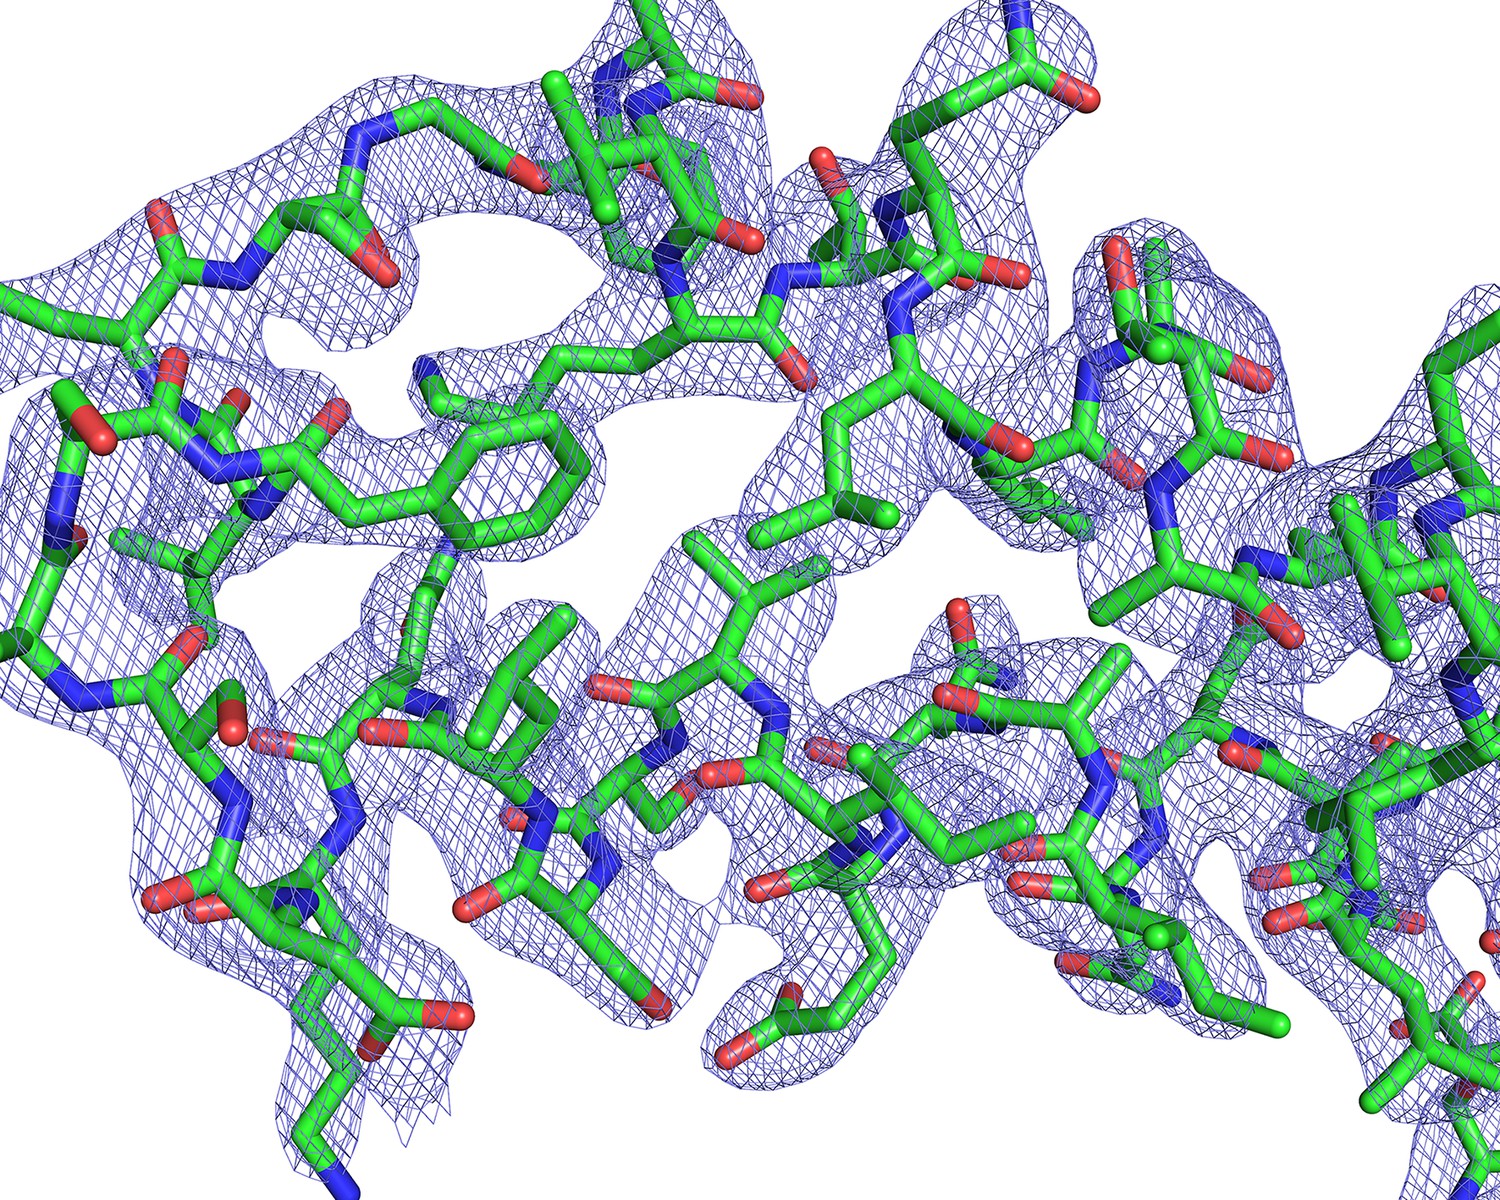
Electron-density maps.
2Fo-Fc electron density contoured at 1.5σ around a representative section of PvCelTOS.
Figure 2
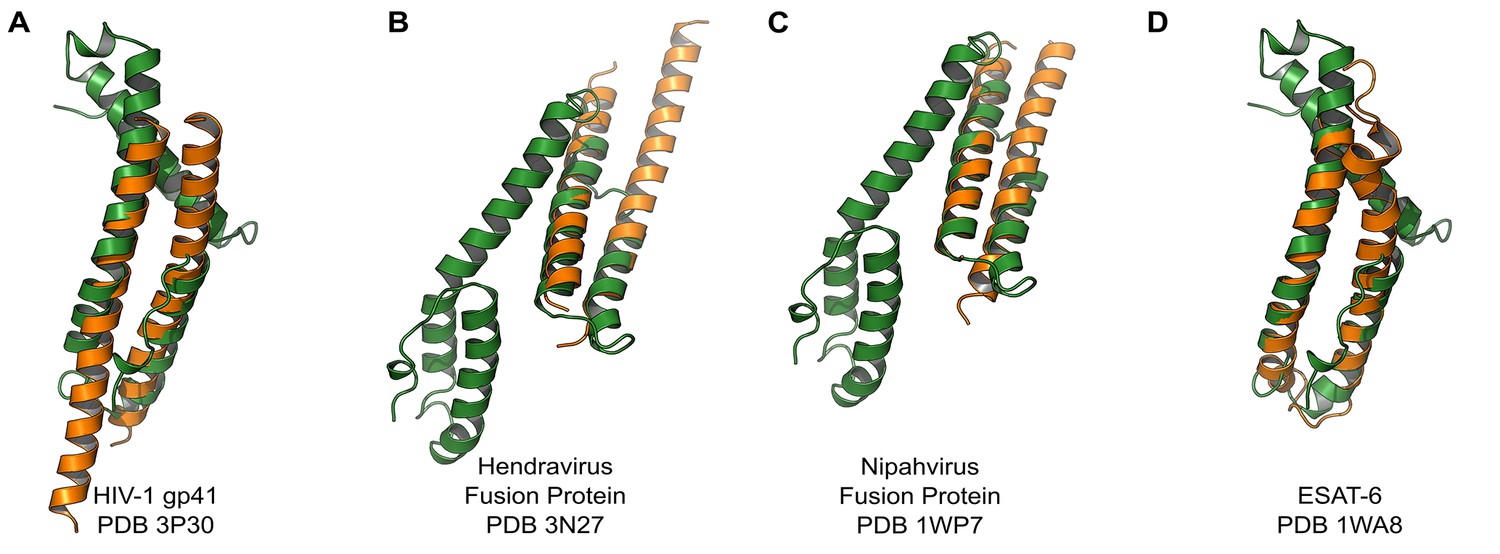
PvCelTOS is structurally similar to viral and bacterial proteins that disrupt membranes.
All panels are structural overlays of PvCelTOS (green) with pathogenic membrane disrupting proteins (orange): (A) HIV-1 gp41 PDB 3P30 (Dali Z-score: 3.2, rmsd 3.2), (B) Hendravirus fusion protein PDB 3N27 (Dali Z-score: 3.1, rmsd 3.3) (orientation of CelTOS is rotated 60° along the y-axis compared to Figure 2A), (C) Nipahvirus fusion protein PDB 1WP7 (Dali Z-score: 3.3, rmsd 2.9) (orientation of CelTOS is rotated 60° along the y-axis compared to Figure 2A), and (D) Mycobacterium bovis ESAT-6 PDB 1WA8 (Dali Z-score: 2.6, rmsd 2.3).
Figure 3
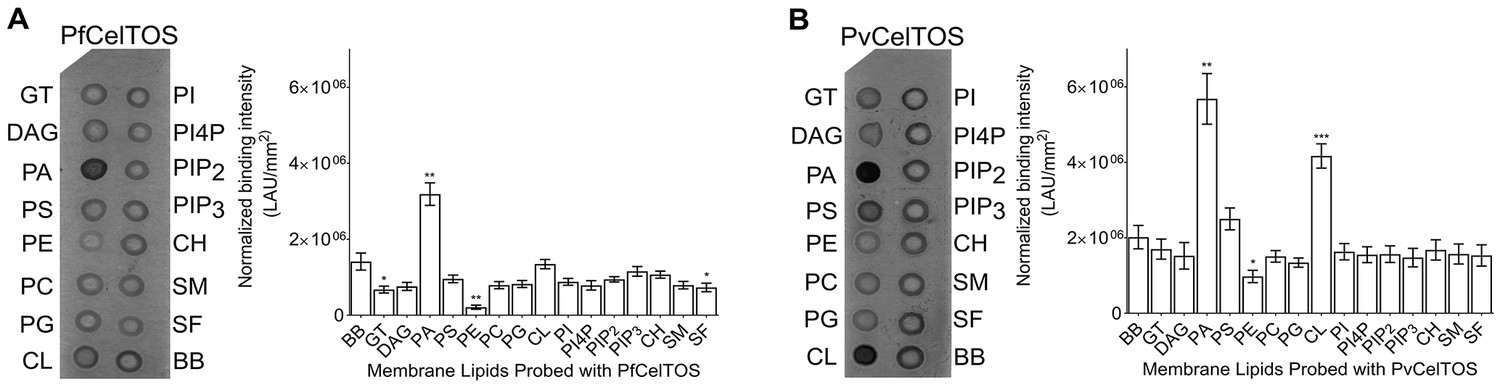
CelTOS binds the inner leaflet cell membrane lipid phosphatidic acid.
(A) Spotted lipid array probed with PfCelTOS demonstrates significant binding to PA compared to the negative control (BB) in lipid arrays. Right panel: Normalized binding intensity from eight experiments shown as mean ± s.e.m. Statistical differences were determined by one-way ANOVA with matched replicates, followed by Dunnett’s multiple comparison test; *p<0.05, **p<0.01, ***p<0.001. GT - Glyceryl tripalmitate, DAG - Diacylglycerol, PA - Phosphatidic Acid, PS - Phosphatidylserine, PE - Phosphatidylethanolamine, PC - Phosphatidylcholine, PG - Phosphatidylglycerol, CL - Cardiolipin, PI - Phosphatidylinositol, PI4P - Phosphatidylinositol (4)-phosphate, PIP2 - Phosphatidylinositol (4,5)-bisphosphate, PIP3 - Phoshatidylinositol (3,4,5)-trisphosphate, CH - Cholesterol, SM - Sphingomyelin, SF - 3-sulfogalactosylceramide, and BB - Blue blank. (B) Spotted lipid array probed with PvCelTOS demonstrates significant binding to PA and PS compared to the negative control (BB) in lipid arrays. Right panel: Normalized binding intensity from three experiments shown as mean ± s.e.m. Statistical differences were determined by one-way ANOVA with matched replicates, followed by Dunnett’s multiple comparison test; *p<0.05, **p<0.01, ***p<0.001. Acronyms as in Figure 3A.
Figure 4 with 1 supplement
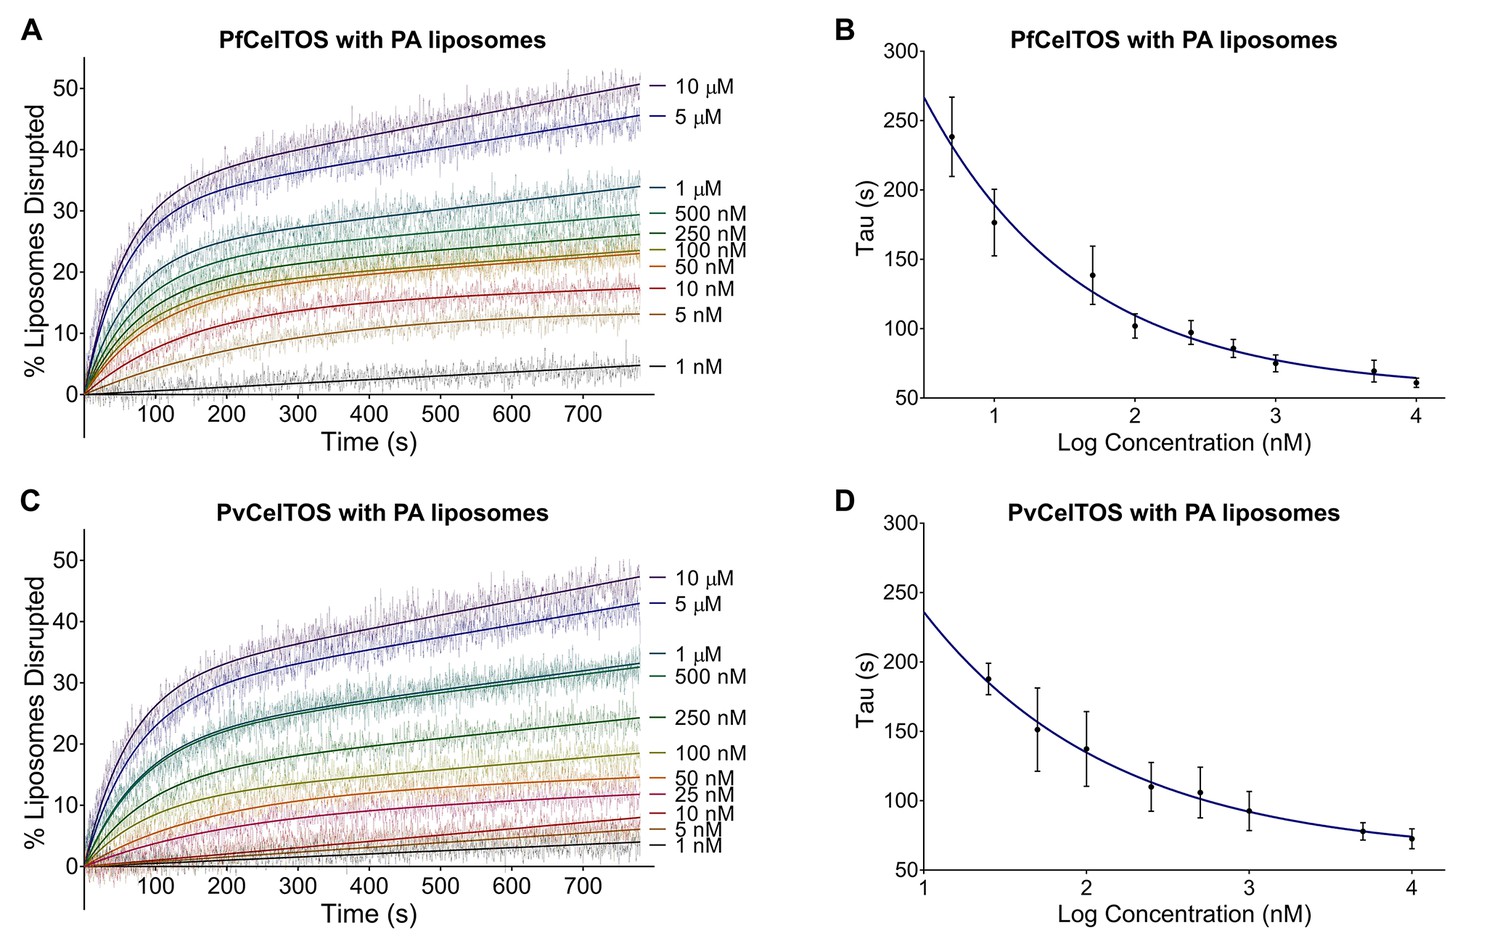
CelTOS disrupts liposomes containing phosphatidic acid (PA liposomes).
(A) Time dependence of liposome disruption at various concentrations of PfCelTOS, a representative plot of three independent experiments is presented. The solid lines represent the fit of liposome disruption to Equation 2 and the dashed lines represent the raw data of liposome disruption. (B) The time constant, Tau, determined from the fit to Equation 2, is plotted against the concentration of PfCelTOS for three technical replicates is shown as mean ± s.e.m. (C) Time dependence of liposome disruption at various concentrations of PvCelTOS. (D) The time constant, Tau, plotted against the concentration of PvCelTOS.
Figure 4—figure supplement 1
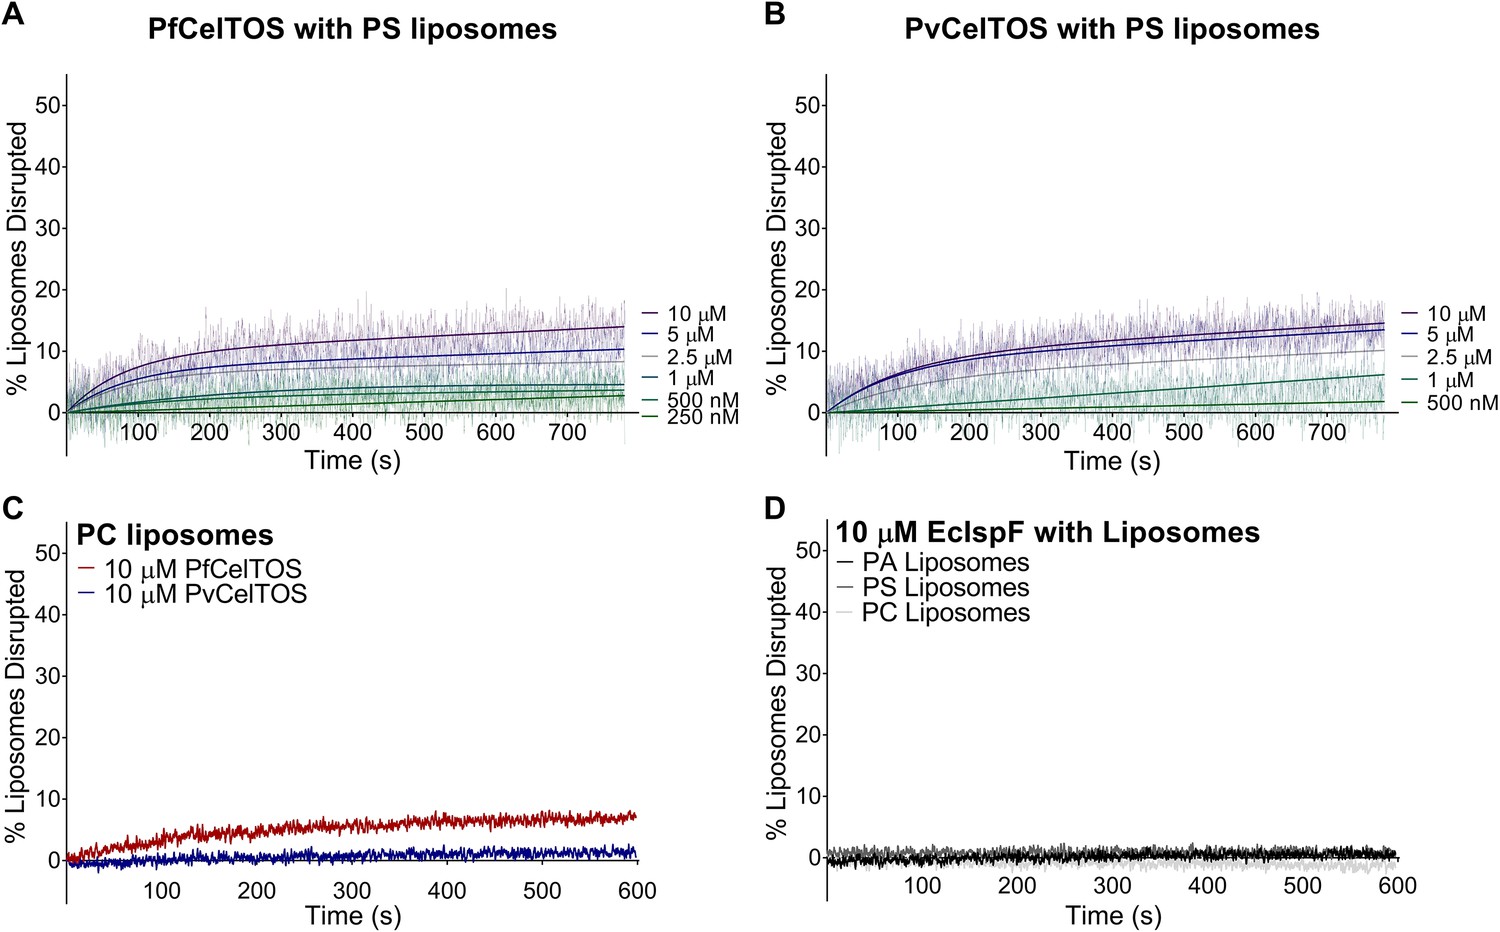
CelTOS minimally disrupts liposomes composed of phosphatidylserine and phosphatidylcholine, and the negative control protein EcIsPF does not disrupt the liposomes composed of the aforementioned lipids and phosphatidic acid.
(A,B) Time dependence of PS liposome disruption at various concentrations of PfCelTOS and PvCelTOS respectively, a representative plot of three independent experiments is presented. The solid lines represent the fit of liposome disruption to Equation 2and the dashed lines represent the raw data of liposome disruption. (C) Time dependence of PC liposome disruption with 10 µM PfCelTOS and PvCelTOS respectively, a representative plot of three independent experiments is presented. (D) Time dependence of PA, PS and PC liposome disruption with 10 µM E. coli IspF, a control protein with similar mass, charge and purification protocol as CelTOS.
Figure 5 with 2 supplements

CelTOS forms pores in lipid membranes and a 500 kDa Dextran (Stoke’s radius = 14.7 nm) blocks the release of carboxyfluorescein from PA liposomes disrupted by PfCelTOS and PvCelTOS.
Time dependence of PA liposome disruption by (A) PfCelTOS or (B) PvCelTOS at 250 nM in the presence of dextran molecules of various molecular weights, a representative plot is presented. The solid lines represent the fit of liposome disruption to Equation 2 and the dashed lines represent the raw data of liposome disruption. (C) Transmission electron microscopy of negative stained liposomes alone (left), liposomes treated with PfCelTOS (middle), and liposomes treated with PvCelTOS (right) reveals CelTOS-dependent pores (red arrows).
Figure 5—figure supplement 1
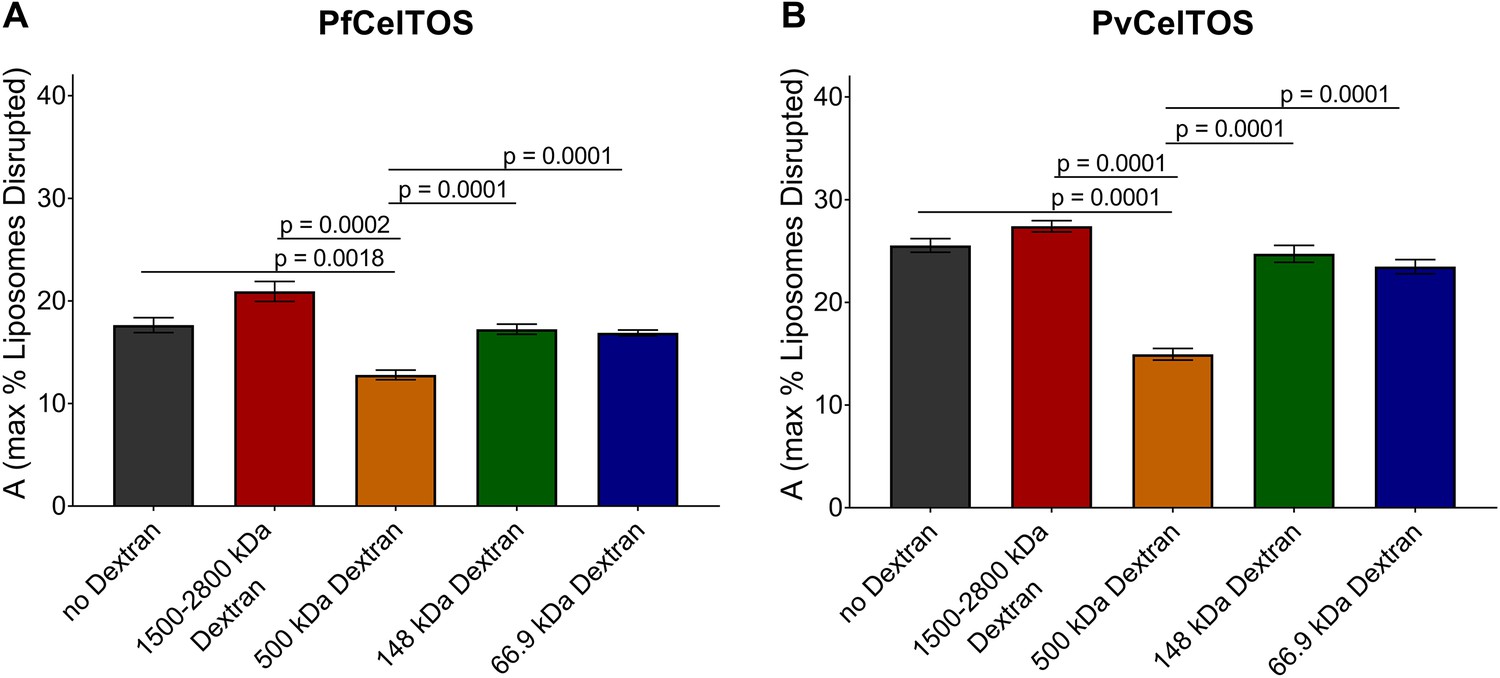
Quantitation of the dextran block experiment.
Reduction in the maximum amount of liposomes disrupted (A from Equation 2) in the presence of dextran molecules after incubation with 250 nM of (a) PfCelTOS or (b) PvCelTOS. The maximum amount of liposomes disrupted of three technical replicates is shown as mean ± s.e.m. Statistical differences were determined for seven replicates by one-way ANOVA with matched replicates, followed by Dunnett’s multiple comparison test.
Figure 5—figure supplement 2
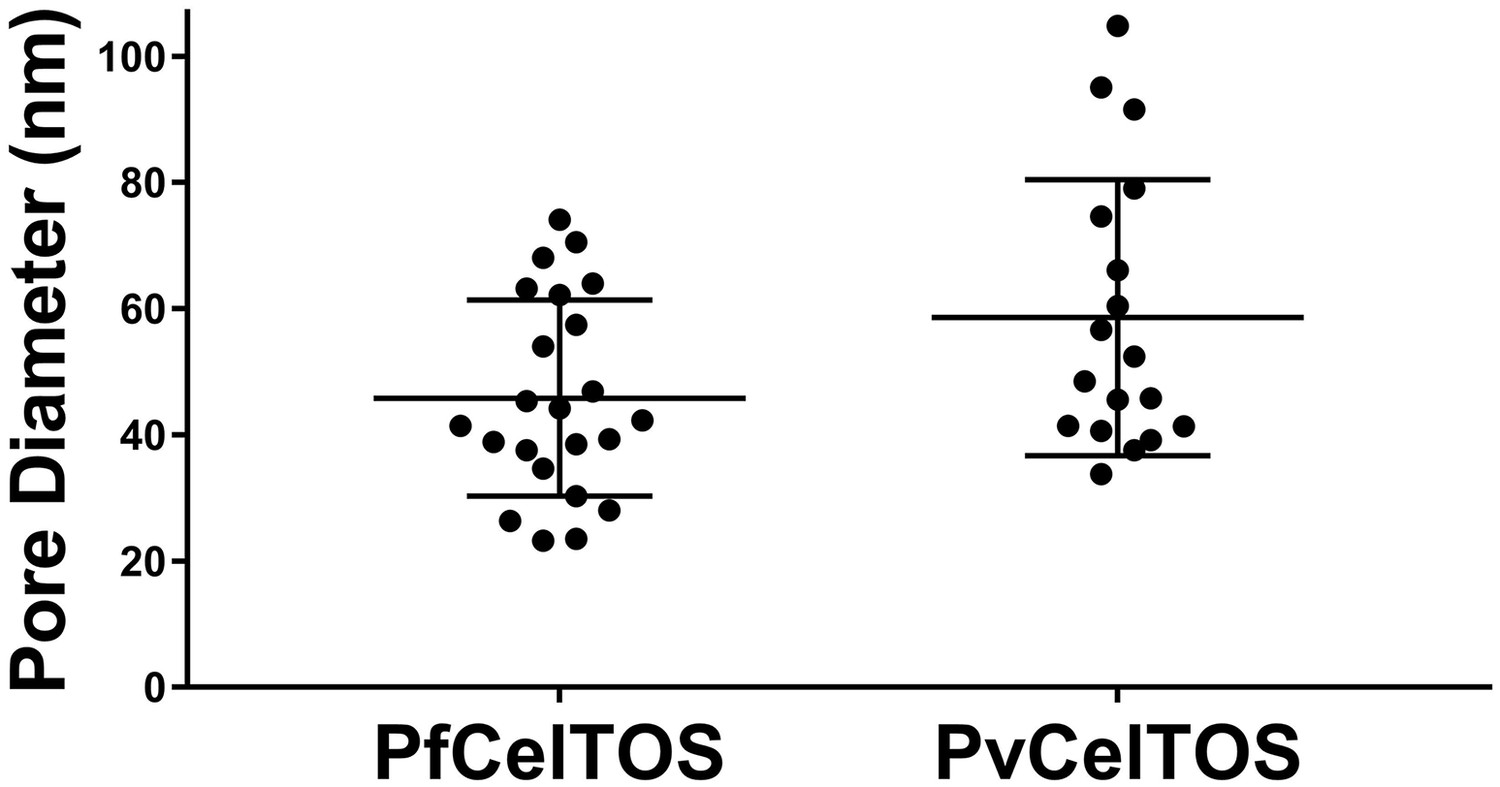
Diameters of pores in liposomes formed by CelTOS.
Diameters of pores in liposomes formed by PfCelTOS (45.85 ± 15.55 nm) and PvCelTOS (58.62 ± 21.86 nm) determined by transmission electron microscopy. Diameters are reported as mean ± s.d. for 23 PfCelTOS-pores and 18 PvCelTOS-pores.
Figure 6 with 1 supplement

CelTOS disrupts cells by directly binding the cytosolic face of cell plasma membranes.
(A) Microinjection of Xenopus oocytes with CelTOS results in membrane damage. Cells were incubated at room temperature and examined 24 hr post-injection. Five representative images from 24 individually microinjected oocytes per condition are shown. Scale bar represents 0.2 mm. (B) Percent of oocytes with damaged membranes from six independent experiments each with 24 technical replicates. Statistical differences were determined by Kruskal-Wallis and Dunn’s multiple comparison tests. The graph is shown as mean ± s.e.m. (C) RAW 264.7 macrophages used in a cytotoxicity assay demonstrate CelTOS is unable to disrupt cells from the extracellular surface. Membrane damage was measured by uptake of a membrane-impermeable fluorescent dye. Statistical differences were determined for three independent experiments each with three technical replicates by Kruskal-Wallis and Dunn’s multiple comparison test. The graph is shown as mean ± s.e.m.
Figure 6—figure supplement 1
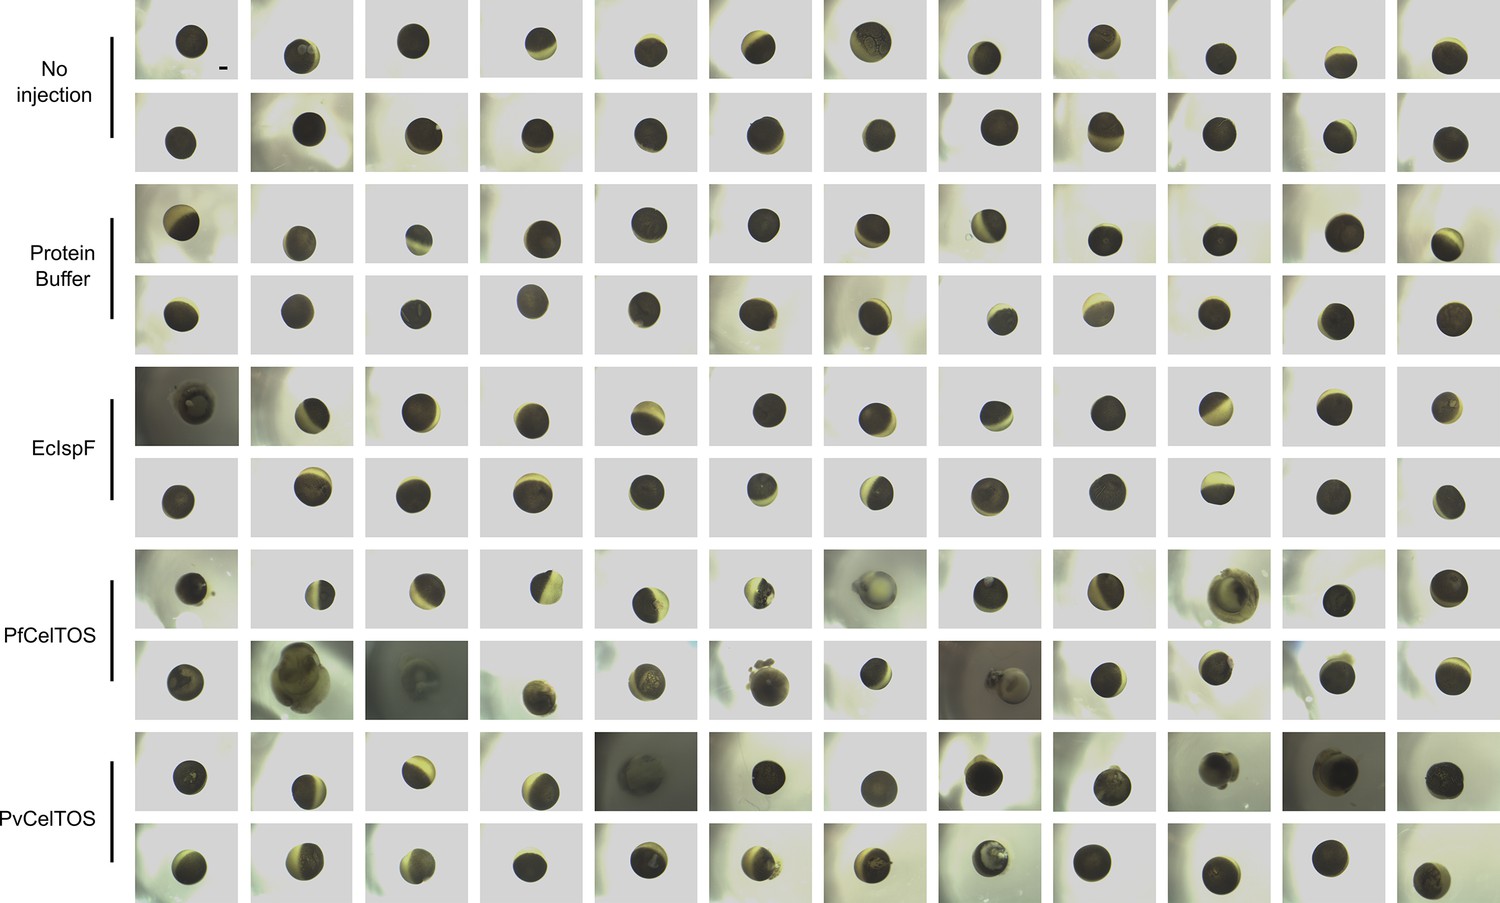
Complete images for a representative experiment of Xenopus oocyte microinjection.
Images were collected 24 hr after treatment of oocytes, and the treatment is denoted of the left. Scale bar represents 0.2 mm.
Figure 7

Model for CelTOS in cell traversal.
(A) During the pre-erythrocytic stage, malaria parasite sporozoites traverse various host cells including Kupffer cells and hepatocytes. CelTOS forms pores and disrupts the cell membranes of these cells to allow exit of the sporozoites to complete traversal. The inset shows CelTOS is localized to the surface of sporozoites and disrupts plasma membranes by directly binding to phosphatidic acid (PA), colored brown, in the inner leaflet to create a pore that enables sporozoite exit. EEF – exo-erythrocytic form. (B) During the mosquito stage, malaria parasite ookinetes traverse the mosquito midgut epithelium to reach the basal lamina where it develops into oocysts. CelTOS forms pores and disrupts vector cell membranes to direct ookinete exit during traversal through the mosquito midgut epithelium. The inset shows CelTOS is localized to the surface of ookinetes and disrupts plasma membranes by directly binding to phosphatidic acid (PA), colored brown, in the inner leaflet to create a pore that enables ookinete exit.
Download links
A two-part list of links to download the article, or parts of the article, in various formats.
Downloads (link to download the article as PDF)
Open citations (links to open the citations from this article in various online reference manager services)
Cite this article (links to download the citations from this article in formats compatible with various reference manager tools)
Malaria parasite CelTOS targets the inner leaflet of cell membranes for pore-dependent disruption
eLife 5:e20621.
https://doi.org/10.7554/eLife.20621


