Synchronized excitability in a network enables generation of internal neuronal sequences
- Janelia Farm Research Campus, Howard Hughes Medical Institute, United States
- University of Nebraska-Lincoln, United States
Figures
Figure 1
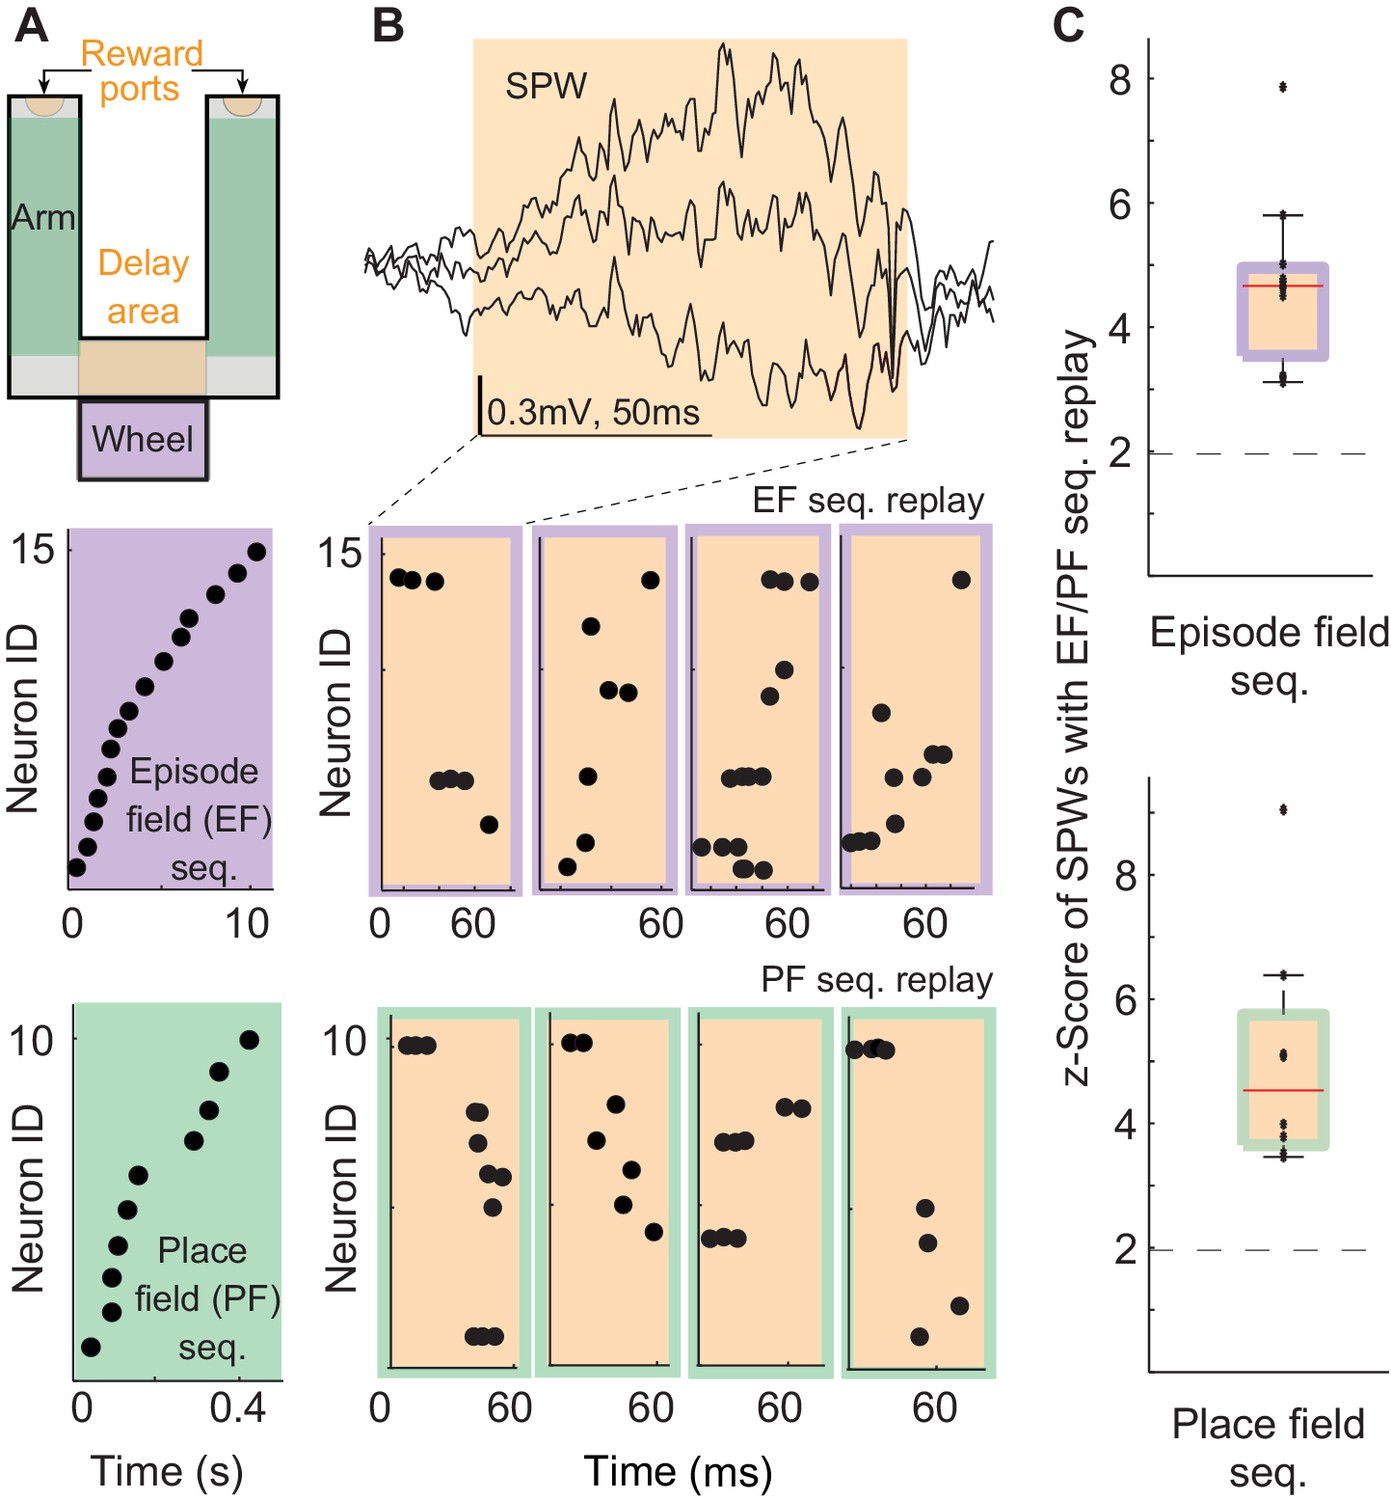
Episode field and place field sequence replay during sharp-waves (SPWs).
(A) An alternation task maze. Purple: an example episode field sequence. Green: an example place field sequence. Each dot represents the peak of an episode/place field. (B) An example SPW event. Orange/purple: example SPW sequences correlated with the example episode field sequence. Orange/green: example SPW sequences correlated with the example place field sequence. Each dot represents a spike. (C) Percentage of SPWs with sequences significantly correlated with episode field (top) and place field (bottom) sequences. Red line: median, error bars: 95%-tile. Dash line: 2SD.
Figure 2
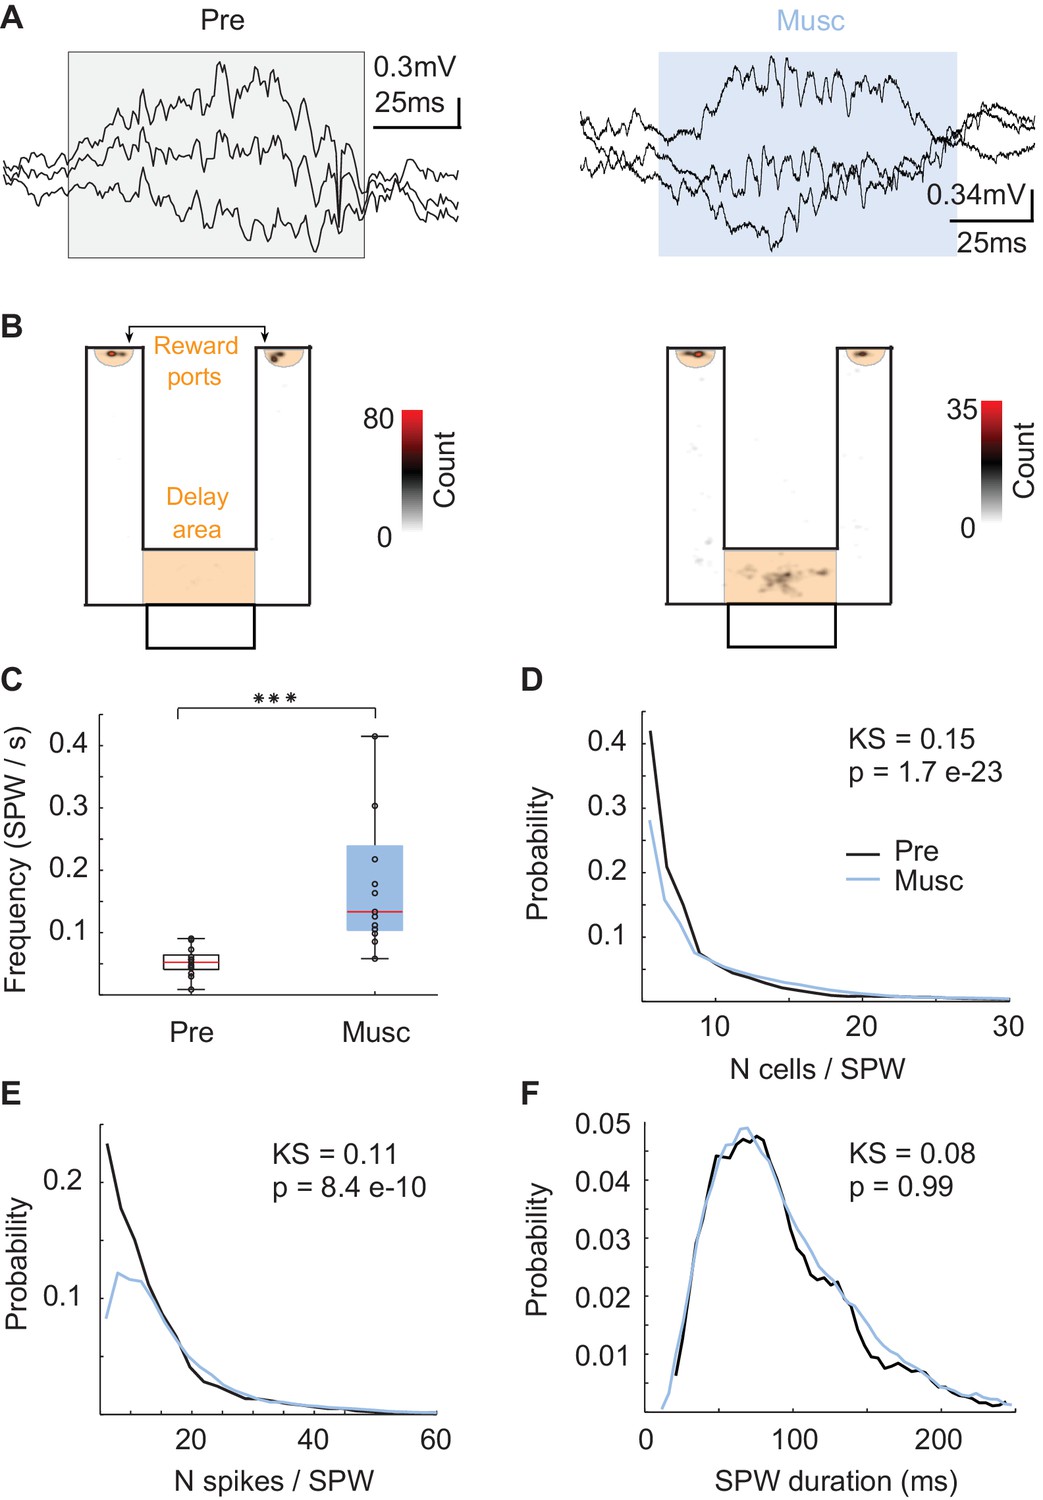
Characteristics of SPWs before and after medial septum (MS) inactivation.
(A) Example SPW event before (black) and after (blue) the inactivation. (B) Locations of SPW events before (left) and after (right) the inactivation. (C) Frequency of SPW events before (Pre) and after (Musc) the inactivation. (D) Number of active neurons during SPW events. (E) Number of spikes during SPW events. (F) Duration of SPW events.
Figure 3

SPW replay before and after MS inactivation.
(A) Left: Example episode field sequence before (purple) and after (blue/purple) MS inactivation. Right: example SPW sequences correlated with the pre-injection episode field sequence recorded before (orange/purple) and after (blue/purple) MS inactivation. (B) Normalized percentage of SPW events with episode field replay before (Pre) and after (Musc) MS inactivation. Dash line: 2SD. (C) Percentage of SPW events with episode field replay in time since the start of the recording. (D–F) the same as A–C but for place field sequences.
Figure 4
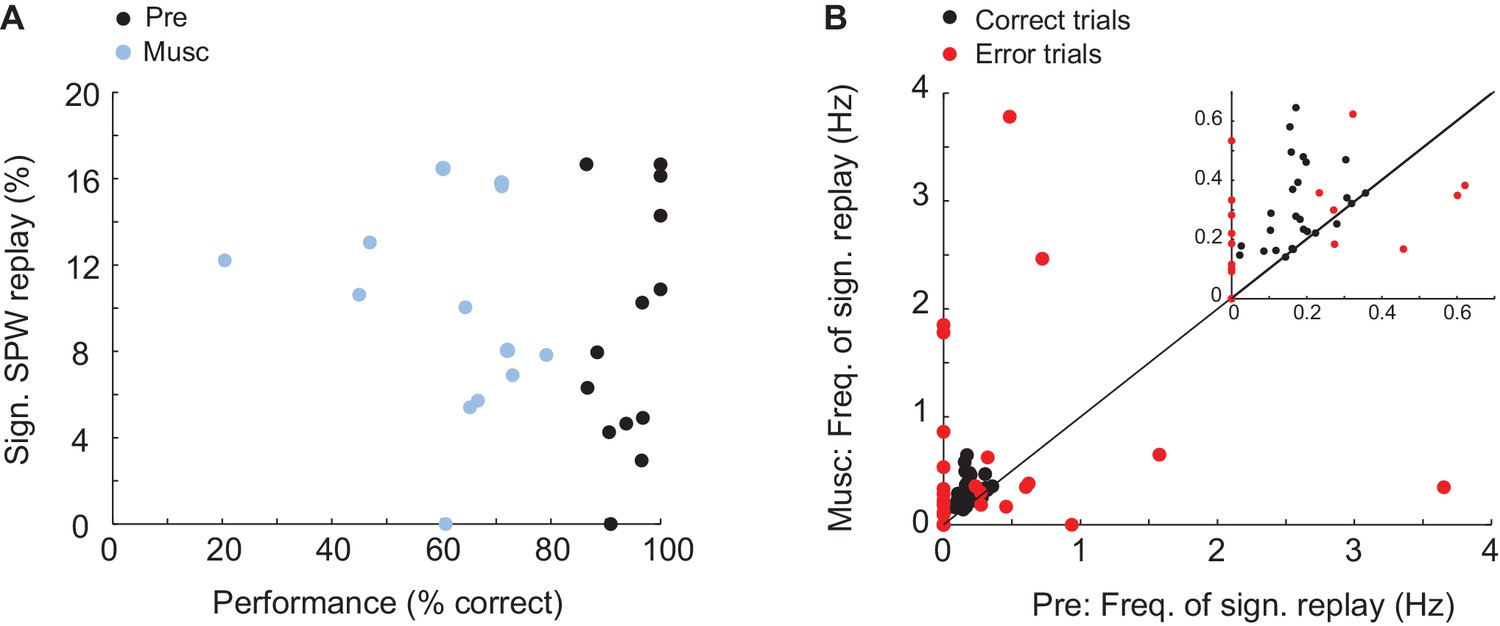
Relationship between memory performance and SPW replay.
(A) Relationship between animal performance in the task and percentage of significant sequence replay before (Pre) and after (Musc) MS injection. (B) Frequency of sequence replay before (x-axis) and after (y-axis) MS injection plotted separately for correct (red) and erroneous (red) trials. Each dot represents the mean of correct/erroneous trials from one recording.
Figure 5
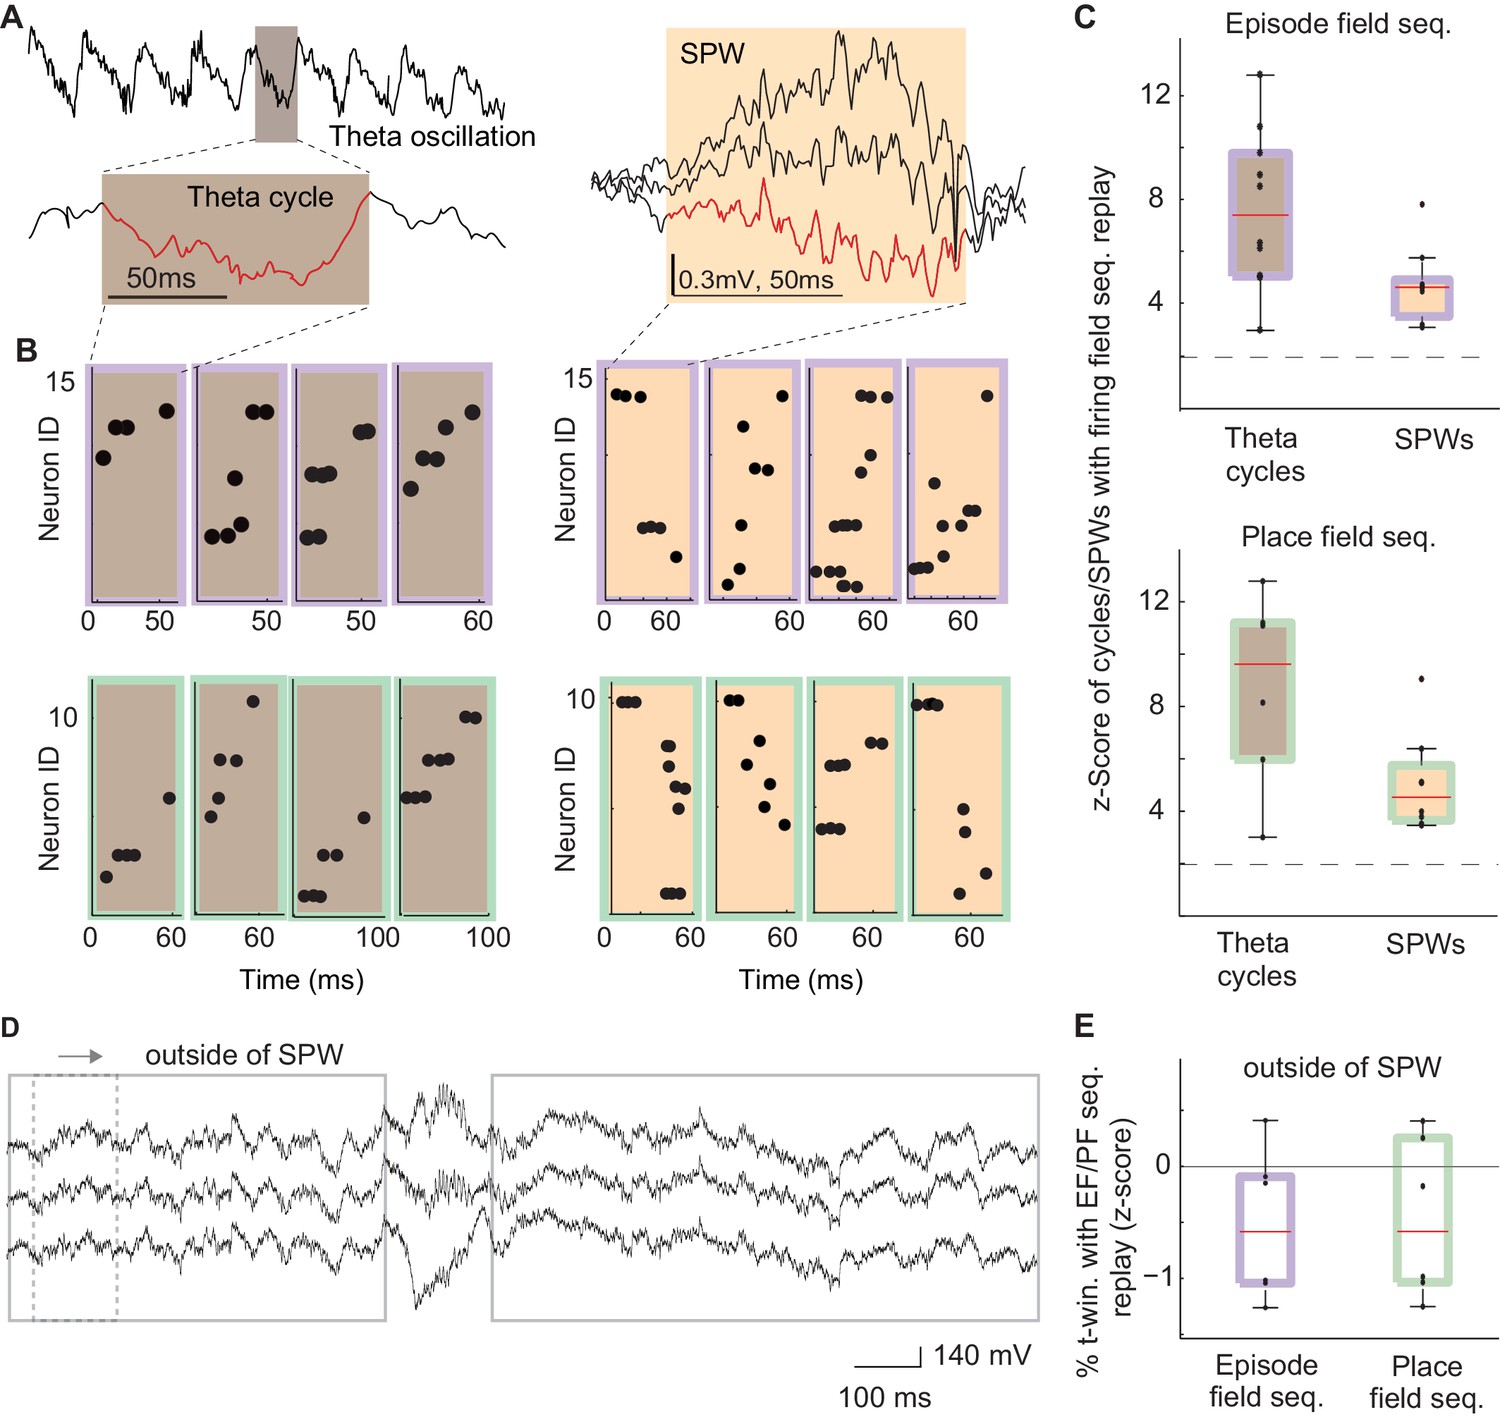
The frequency of theta and SPW sequences during and in between synchronized waves of excitability.
(A) Left: example electrode-signal with theta oscillations. One theta cycle is magnified (red). Right: example SPW event. (B) Left: example sequences generated during individual cycles of theta oscillations that were correlated with episode field (brown/purple) and place field (brown/green) sequences. Right: example SPW sequences correlated with episode field (orange/purple) and place field (orange /green) sequences. (C) Normalized percentage of theta cycles and SPW events that contained sequences significantly correlated with episode field (top) and place field (bottom) sequences. Dash line: 2SD. (D) The method used to detect replay in between SPW events. (E) Normalized percentage of time windows that contained sequences significantly correlated with episode field (purple) and place field (green) sequences in between SPWs.
Author response image 1
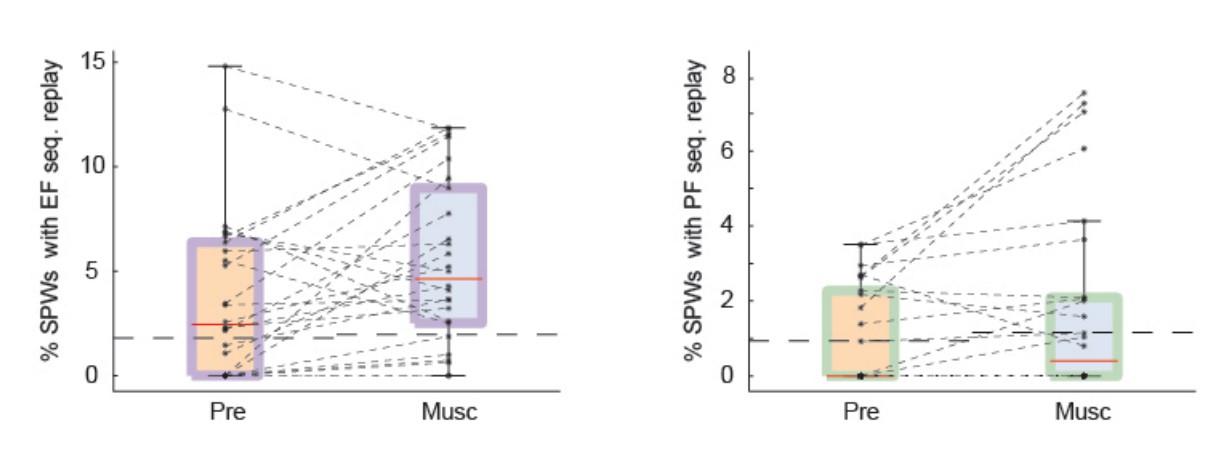
SPW replay of episode cell (left) and place cell (right) sequences during Pre-muscimol and Muscimol recordings.
In this analysis we eliminated all spikes from each burst except for the first one. We did not observe any drop in the prevalence of SPW replay during Muscimol. The chance level (dash line) is determined by the mean of the percentages of significant replay observed in the shuffled data.
Author response image 2
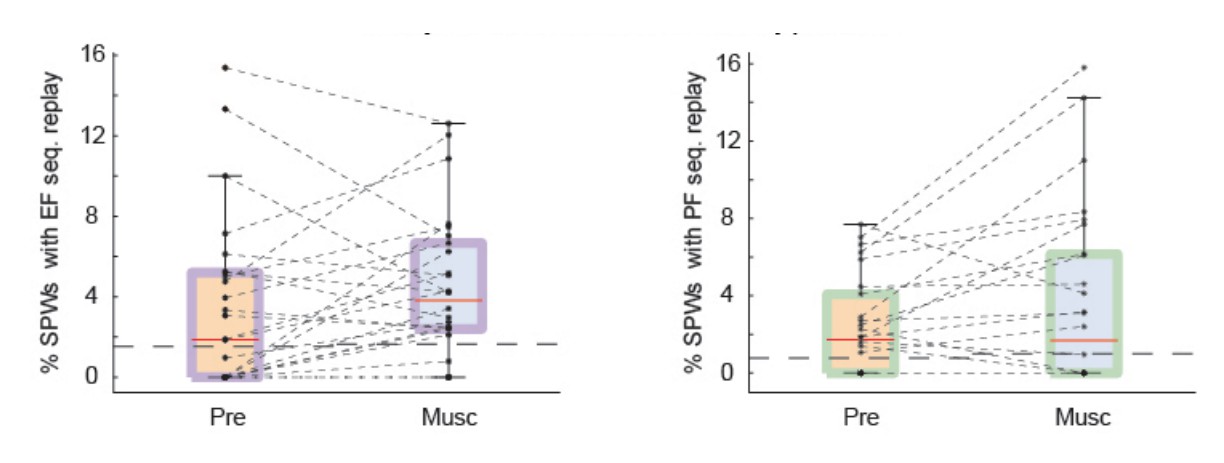
SPW replay of episode cell (left) and place cell (right) sequences during Pre-muscimol and Muscimol recordings.
In this analysis we shuffled the identity of cells and time stamps but preserved the autocorrelation function of each cell. The chance level (dash line) is determined by the mean of the percentages of significant replay observed in the shuffled data. We did not observe any drop in the prevalence of SPW replay during Muscimol.
Author response image 3
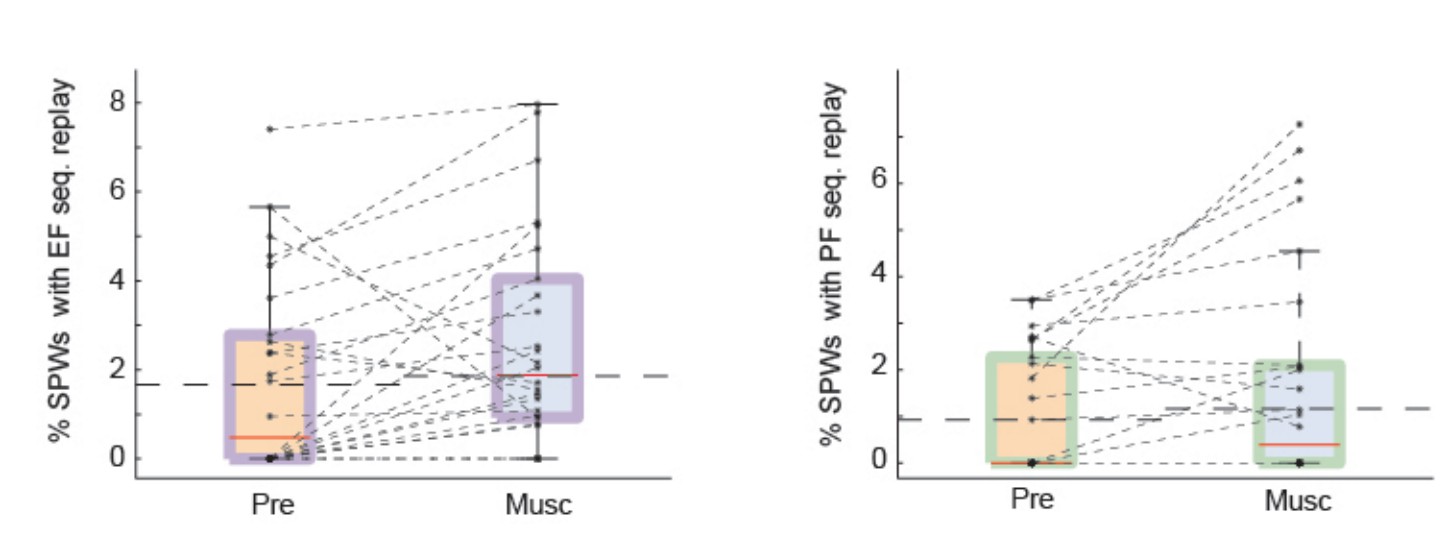
SPW replay of episode cell (left) and place cell (right) sequences during Pre-muscimol and Muscimol recordings.
In this analysis we shuffled the identity of neurons without altering the spike timing. The chance level (dash line) is determined by the mean of the percentages of significant replay observed in the shuffled data. We did not observe any drop in the prevalence of SPW replay during Muscimol.
Tables
Author response table 1
| Mean frequency of replay ± SEM: | Pre | Muscimol |
| Correct trials | 0.22Hz ± 0.014 | 0.32Hz ± 0.024 |
| Error trials | 0.5Hz ± 0.08 | 0.85Hz ± 0.25 |
Download links
A two-part list of links to download the article, or parts of the article, in various formats.
Downloads (link to download the article as PDF)
Open citations (links to open the citations from this article in various online reference manager services)
Cite this article (links to download the citations from this article in formats compatible with various reference manager tools)
Synchronized excitability in a network enables generation of internal neuronal sequences
eLife 5:e20697.
https://doi.org/10.7554/eLife.20697


