Novel adverse outcome pathways revealed by chemical genetics in a developing marine fish
- Institute of Marine Research, Norway
- University of Oslo, Norway
- Northwest Fisheries Science Center, National Marine Fisheries Service, United States
- University of Agder, Norway
Figures
Figure 1 with 1 supplement
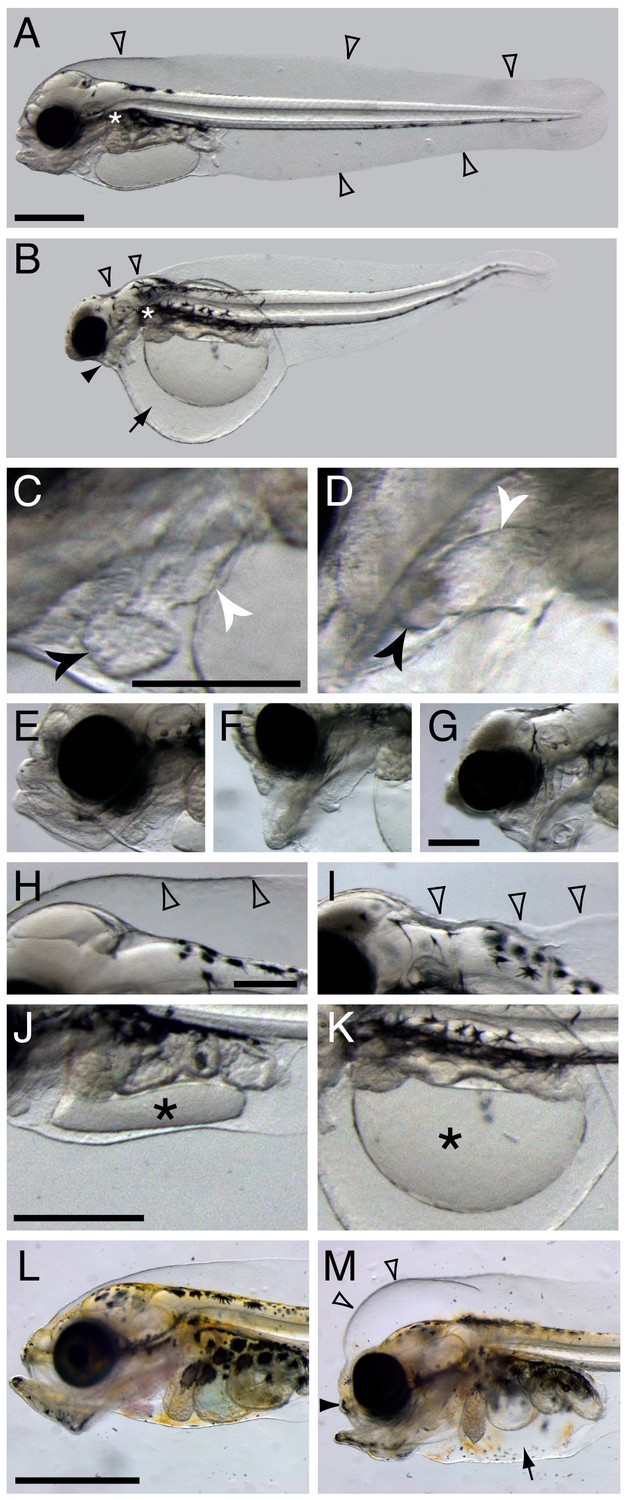
Terminal phenotypes after high dose exposure.
Control (A) and exposed (B) three days post hatch (dph) larvae (6 days post embryonic exposure). Open arrowheads in (A) indicate the marginal finfold surrounding the larvae and the white asterisk indicate the location of the connection between the dorsal space and the ventral yolk sac in the vicinity of the pectoral fin. In (B) the black arrowhead indicates severely reduced craniofacial outgrowth, while the black arrow indicates yolk sac edema. The ventricle and atrium in control (C) and embryonically exposed (D) animals are indicated by black and white arrows, respectively. (E) Normal craniofacial structure in control, and (F) moderate and (G) severe craniofacial defects in exposed animals. (H) Normal marginal finfold in control, (I) exposed animals with severe reduction of anterior marginal finfold (open arrowheads). Yolk mass (*) in control (J) and embryonically exposed larvae (K). (L) Control and (M) exposed 18 dph larvae. Open arrowheads indicate increased anterior marginal finfold, black arrowhead indicates reduced upper jaw outgrowth, and black arrow indicates edema formation in the peritoneal cavity in oil-exposed larvae (M). Scale bar: 0.2 mm (C,D; E–G; H–K) and 1 mm (A,B and L,M).
Figure 1—figure supplement 1
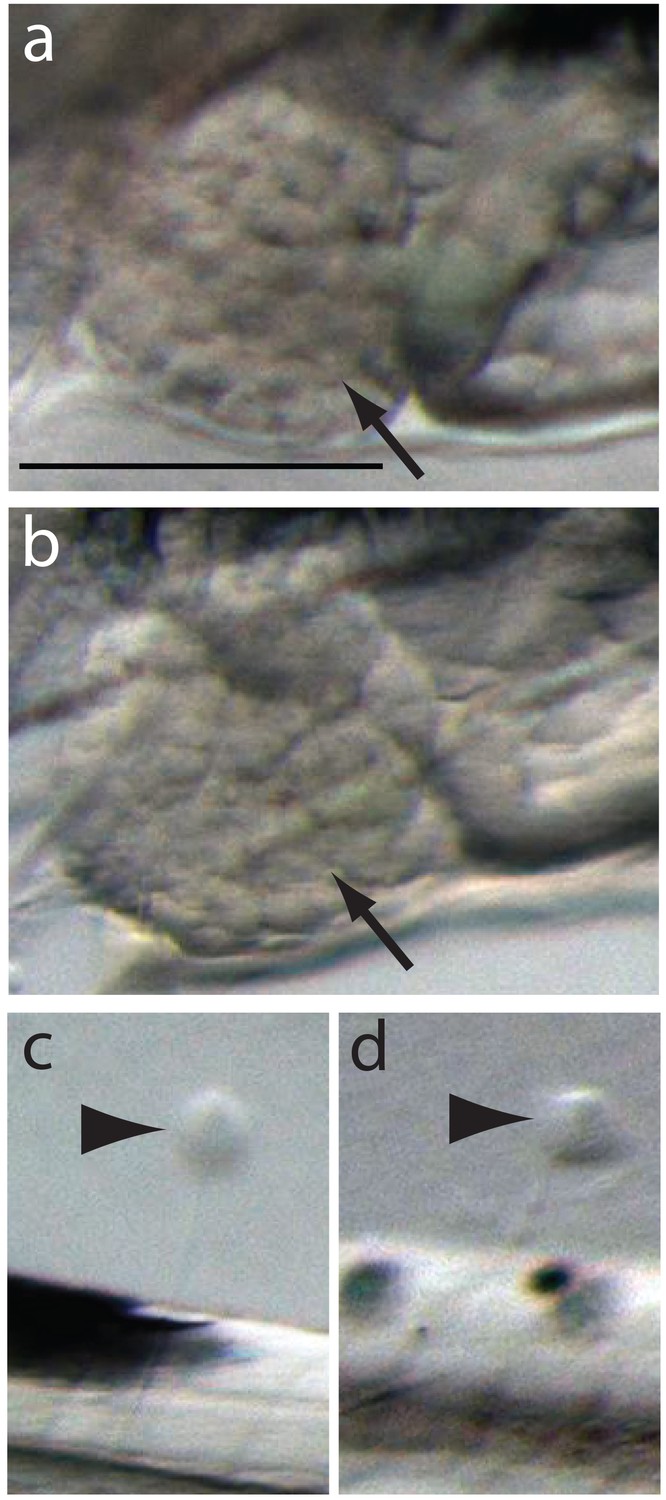
Normal development of liver and lateral line in the severe phenotypes.
Normally developed livers and neuromast cells are indicated by black arrows and arrowheads in control (A, C) and severely affected hunchback phenotypes (B, D), respectively. Scale bar 0.2 mm.
Figure 2
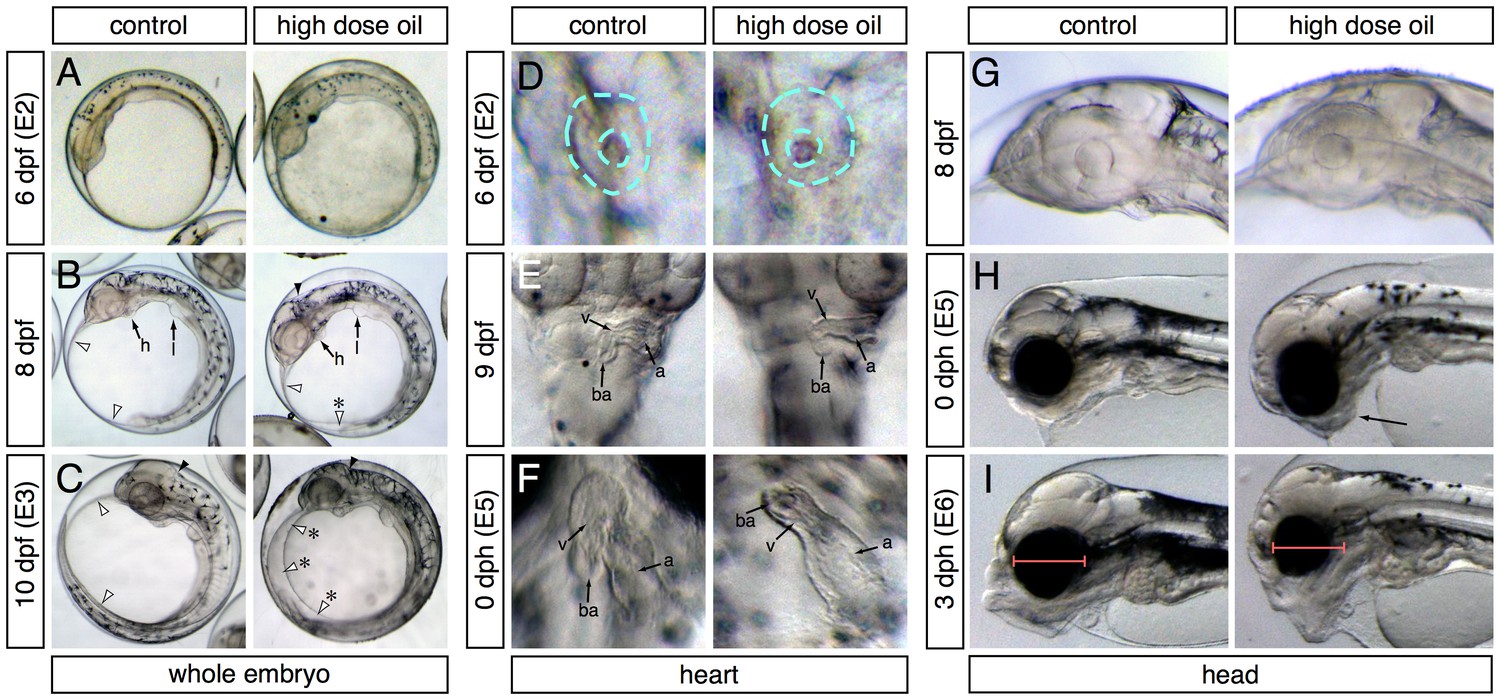
Appearance of phenotypes over time.
In each panel control and high-dose-exposed embryos are shown on the left and right, respectively. (A–C) Lateral overview of whole embryos showing accumulation of edema (anterior to the left). (A) 6 dpf/E2 sampling point. (B) 8 dpf (between E2 and E3 sampling points). Heart (h) and liver bud (l) are indicated. White arrowheads indicate outer margins of the yolk sac membranes; asterisk indicates small pocket of edema. Black arrowheads indicate the hindbrain ventricle. (C) 10 dpf/E3 sampling point. Arrowheads same as (B); asterisks indicate expanded yolk sac edema. (D–E) High-magnification ventral views of the heart (anterior at top). (D) 6 dpf/E2. Dashed turquoise lines indicate outer border and lumen of midline cardiac cone. (E) 9 dpf (between E2 and E3). Arrows indicate the atrium (a), ventricle (v) and bulbus arteriosus (ba). (F) 0 dph (E5 sampling point). Chambers indicated as in (E). (G–I) Lateral views of the developing head (anterior to the left). (G) 8 dpf (between E2 and E3). (H) 0 dph (E5). Arrow indicates abnormal lower jaw cartilages in oil-exposed larva. (I) 3 dph (E6 sampling point). Red bars indicate difference in eye diameter between control and exposed larvae.
Figure 3 with 2 supplements
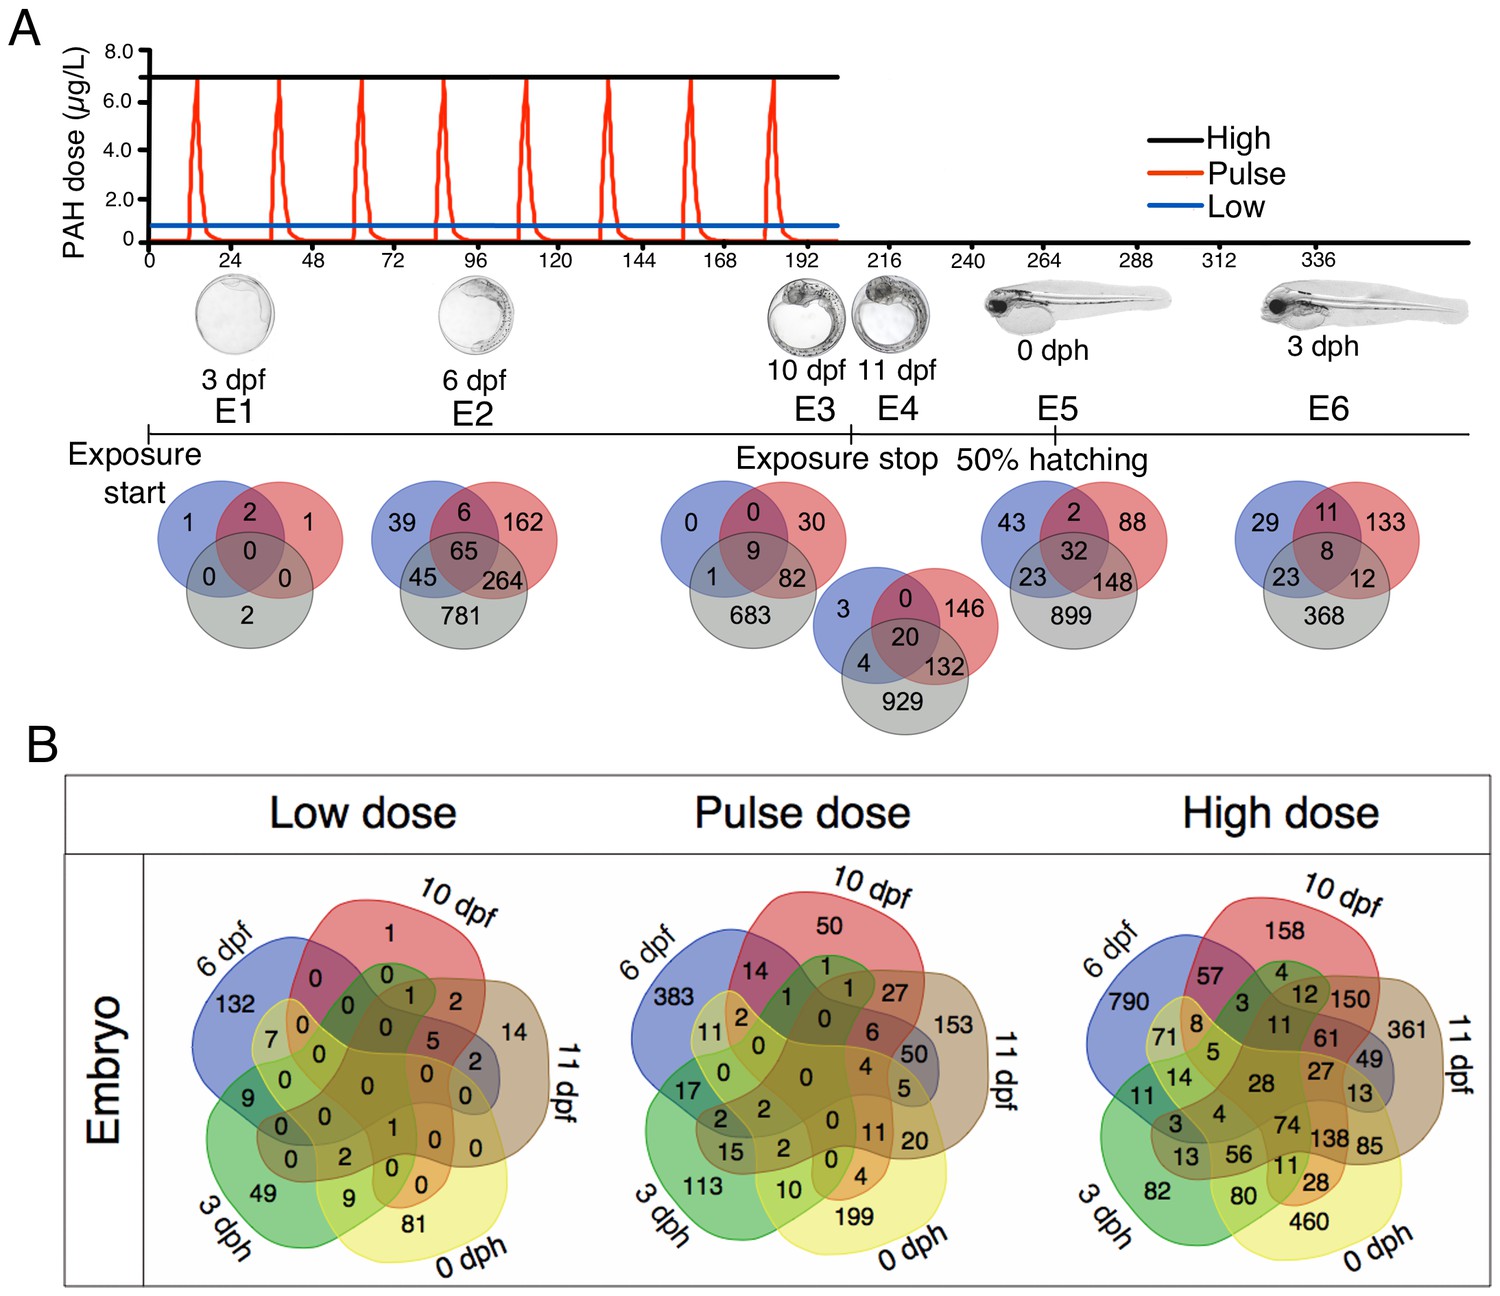
Exposure regimes and differentially expressed genes (DEGs) during embryonic development.
(A) Embryos were exposed to a continuous high dose (black line; 6.7 ± 0.2 μg/L TPAH), a pulsed dose (red line; 0.09 ± 0.02–6.8 ± 1.0 μg/L TPAH) and a continuous low dose (blue line; 0.58 ± 0.05 μg/L TPAH) of crude oil. Photos indicate normal developmental progress at each of six sampling time points (E1–E6). Venn diagrams show shared and exclusive DEGs for each of the three oil exposures at E1–E6. (B) Venn diagrams illustrating the number of shared and exclusive DEGs at each stage in development up to hatching for the three exposure regimes.
Figure 3—figure supplement 1
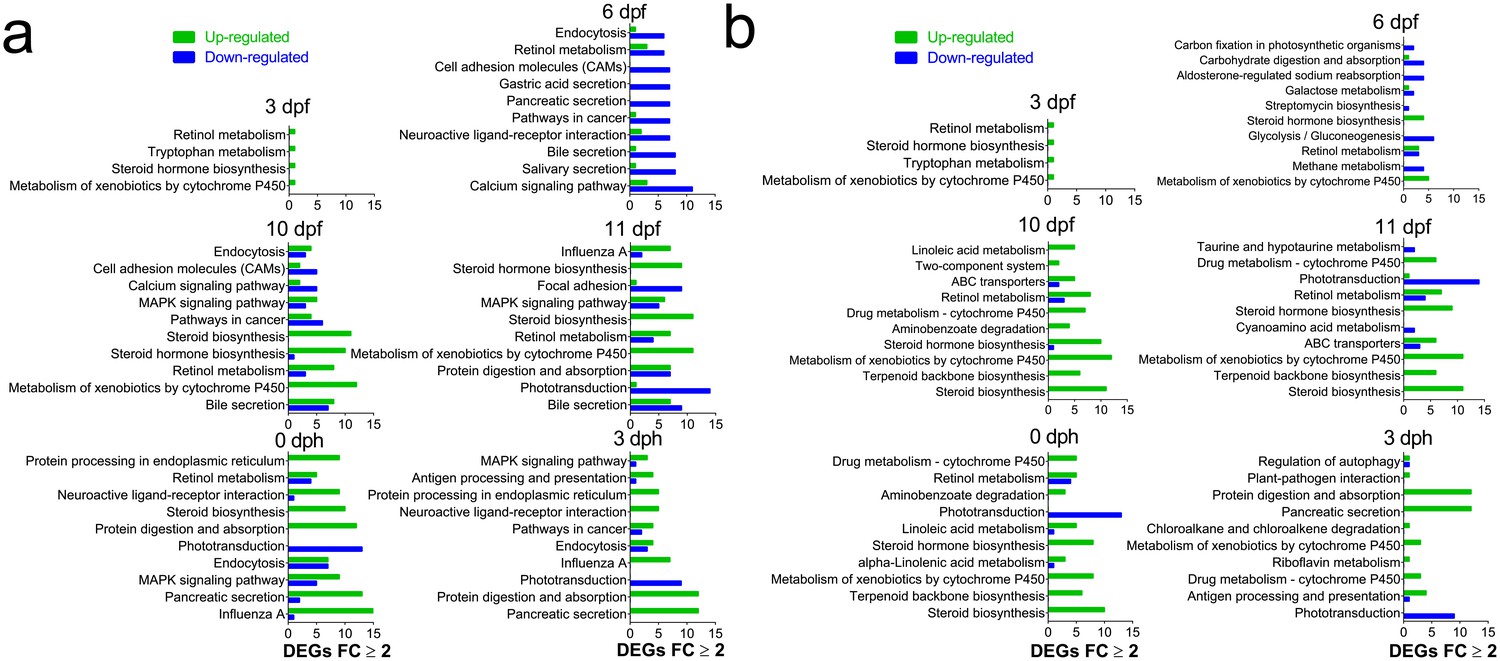
Most regulated KEGG pathways.
(A) Pathways (Total) with highest number of DEGs ≥2 FC during and after embryonic exposure. (B) Pathways with the largest fraction of DEGs ≥2 FC/ Total number of genes in pathway (Normalized) during and after embryonic exposure.
Figure 3—figure supplement 2
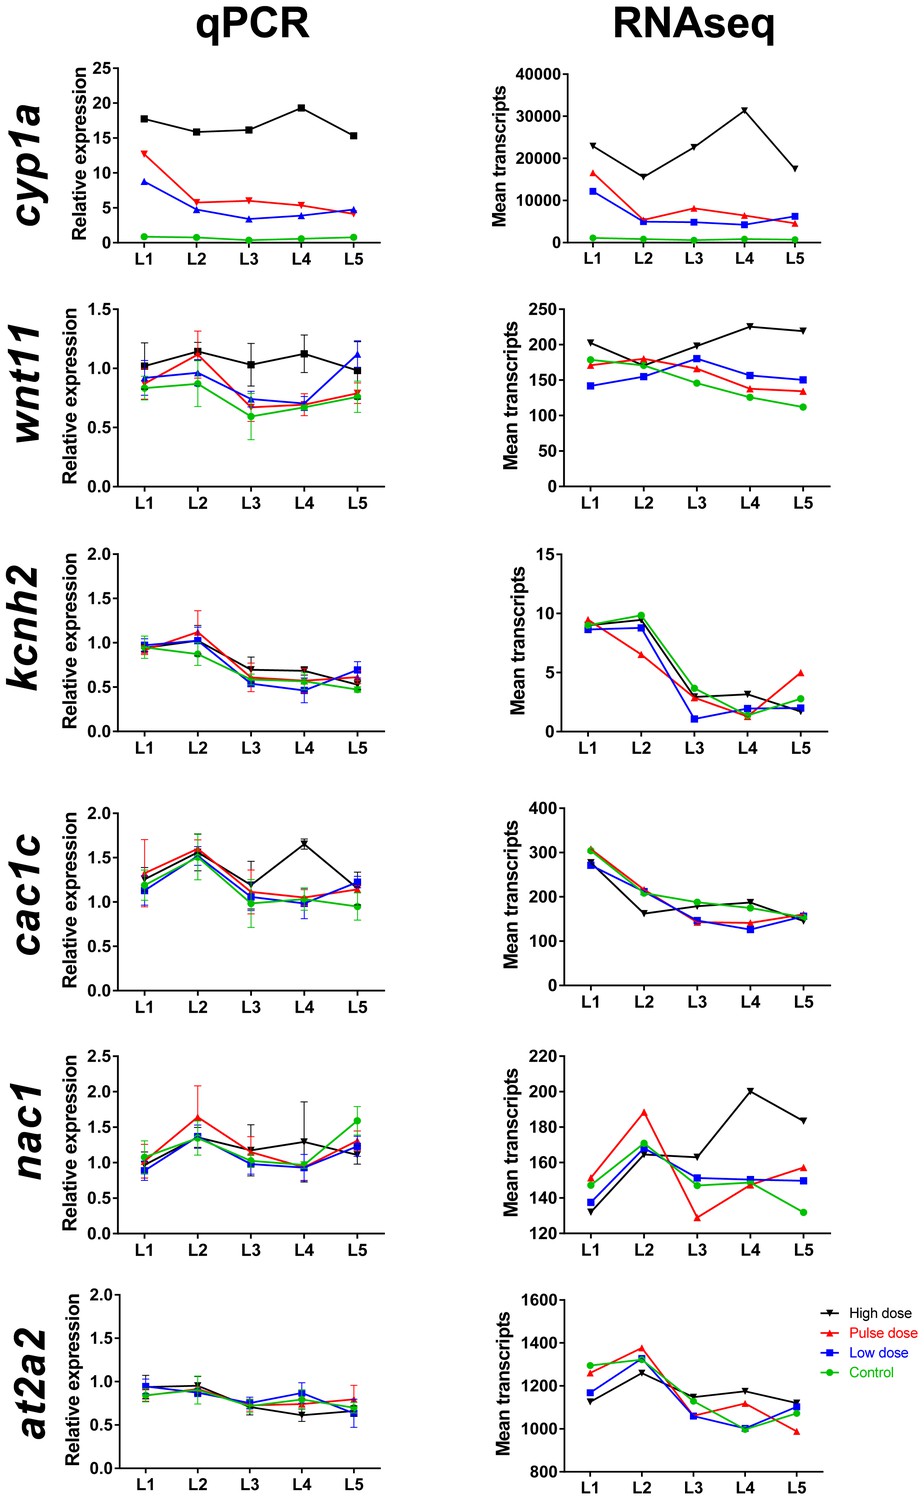
Comparison of mRNA read count data with real-time qPCR for selected genes during and after embryonic exposure.
Genes include cp1a (cytochrome p450 1 a), wnt11 (wingless-type MMTV integration site family member 11), kcnh2 (potassium voltage-gated channel subfamily H member 2), cac1c (voltage-dependent L-type calcium channel), nac1 (sodium/calcium exchanger 1), at2a2 (sarcoplamsic-endoplasmic reticulum calcium ATPase). (A) Real-time qPCR. (B) Read count data from RNA sequencing. Data were normalized as described in Materials and methods.
Figure 4 with 2 supplements

Exposure regimes and differentially expressed genes (DEGs) during larval development.
(A) Larvae were exposed to a continuous high dose (black line; 7.6 ± 0.7 μg/L TPAH), a pulsed dose (red line; 0.3 ± 0.3–6.1 ± 0.5 μg/L TPAH), and a continuous low dose (blue line; 0.65 ± 0.08 μg/L TPAH) of crude oil. Photos indicate normal developmental progress at each of five sampling time points (L1–L5). Venn diagrams show shared and exclusive DEGs for each of the three oil exposures at L1–5. (B) Venn diagrams illustrating the number of shared and exclusive DEGs at each larval stage for the three exposure regimes.
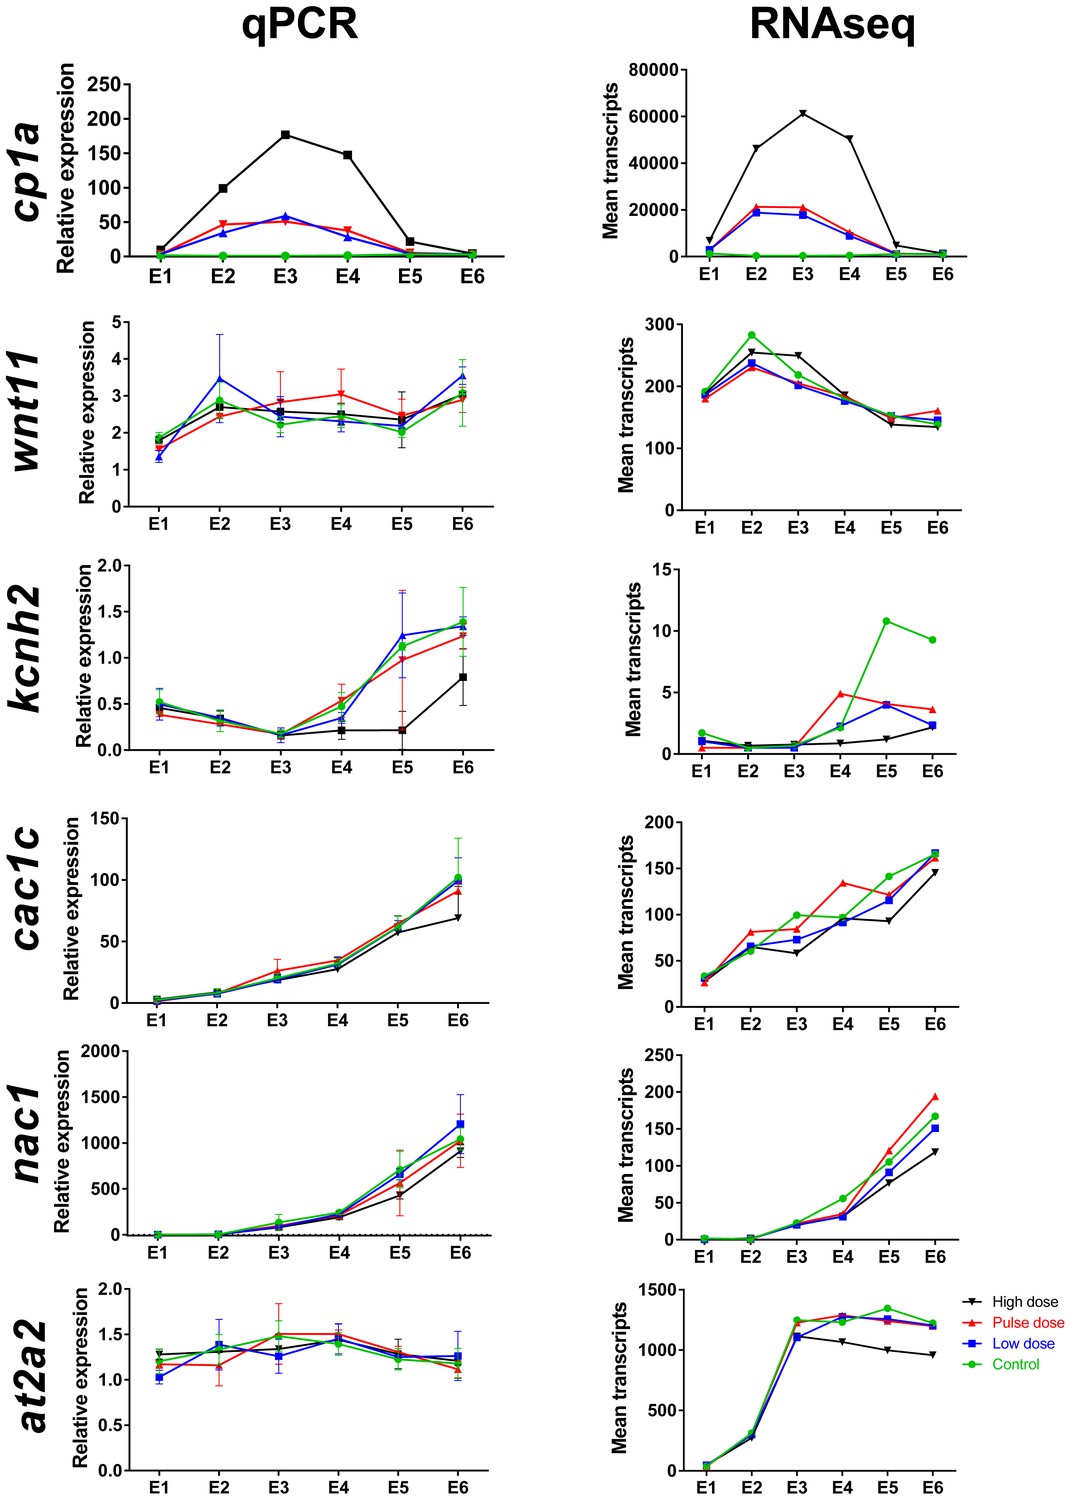
Figure 4—figure supplement 1

Most regulated KEGG pathways.
(A) Pathways (Total) with highest number of DEGs ≥2 FC during larval exposure. (B) Pathways with the largest fraction of DEGs ≥2 FC/ Total number of genes in pathway (Normalized) during and after embryonic exposure.
Figure 4—figure supplement 2
Comparison of mRNA read count data with real time qPCR for selected genes during larval exposure.
Genes include cp1a (cytochrome p450 1 a), wnt11, kcnh2 (potassium voltage-gated channel subfamily H member 2), cac1c (voltage-dependent L-type calcium channel), nac1 (sodium/calcium exchanger 1), and at2a2 (sarcoplamsic-endoplasmic reticulum calcium ATPase). (A) Real-time qPCR. (B) Read count data from RNA sequencing. Data were normalized as described in Materials and methods.
Figure 5
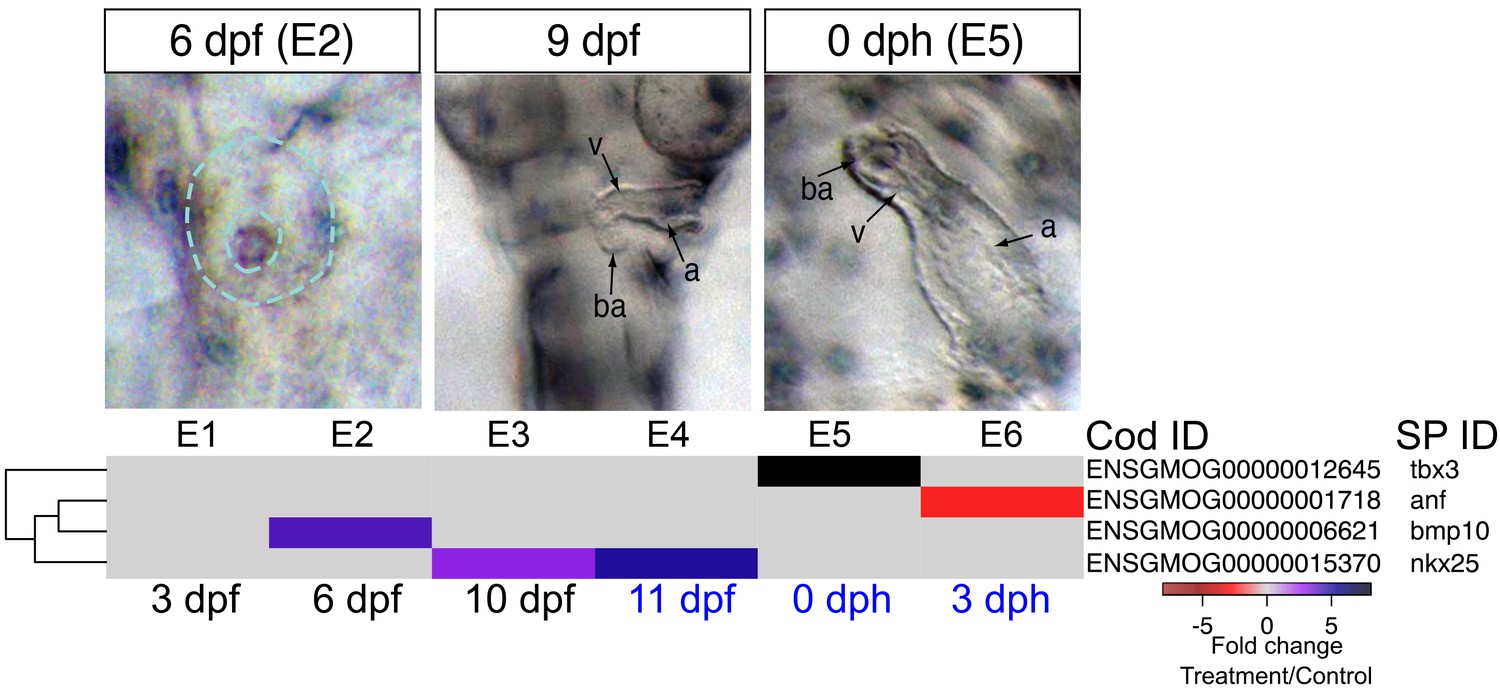
DEGs involved in cardiogenesis.
Regulation of genes involved in cardiogenesis during and after embryonic exposure. Purple: increased expression, red: decreased expression in exposed group.
Figure 6
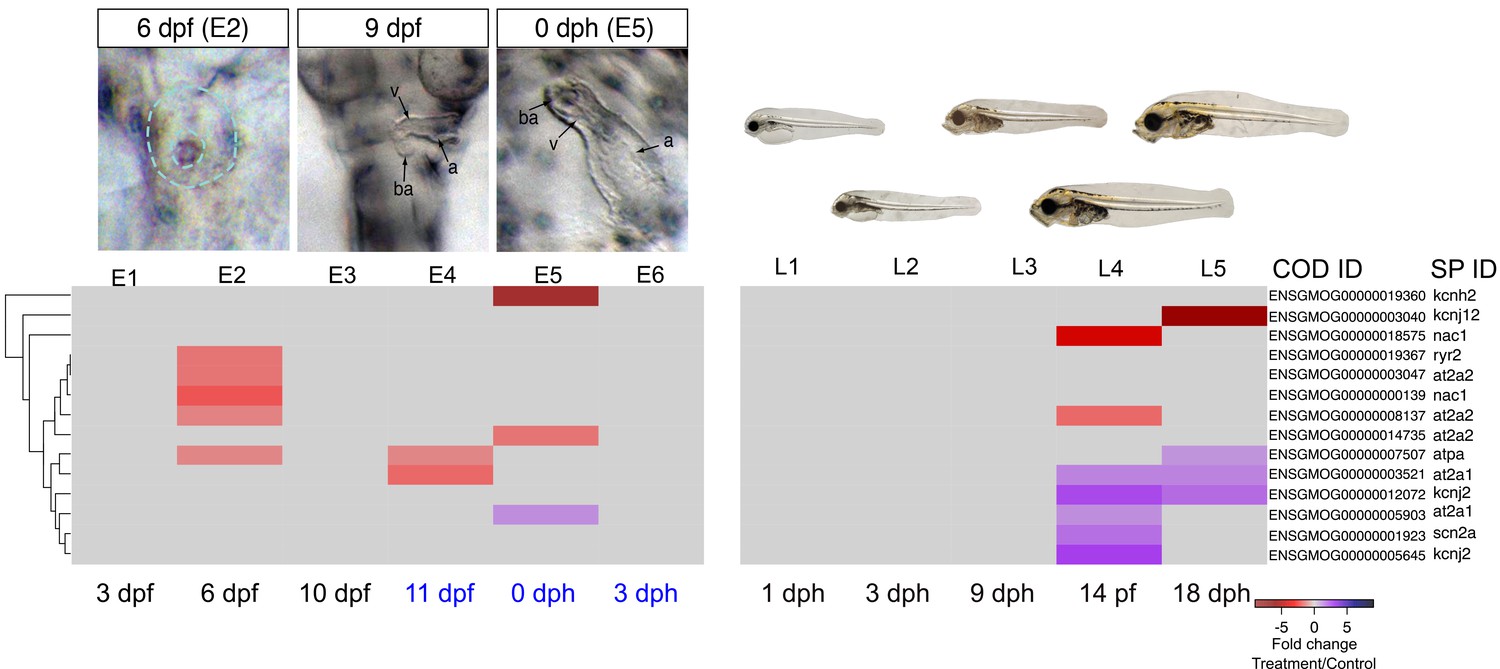
DEGs involved in E–C coupling.
Embryonic developmental samples (E1–6) were collected during (black lettering) and after (blue lettering) crude oil exposure. Oil exposure was continuous across the larval sampling points (L1–5).
Figure 7

DEGs involved in craniofacial development.
(a) Regulation of genes involved in craniofacial development during and after embryonic exposure. (b) Regulation of myosin heavy chain genes. Purple: increased expression, red: decreased expression in exposed group.
Figure 8
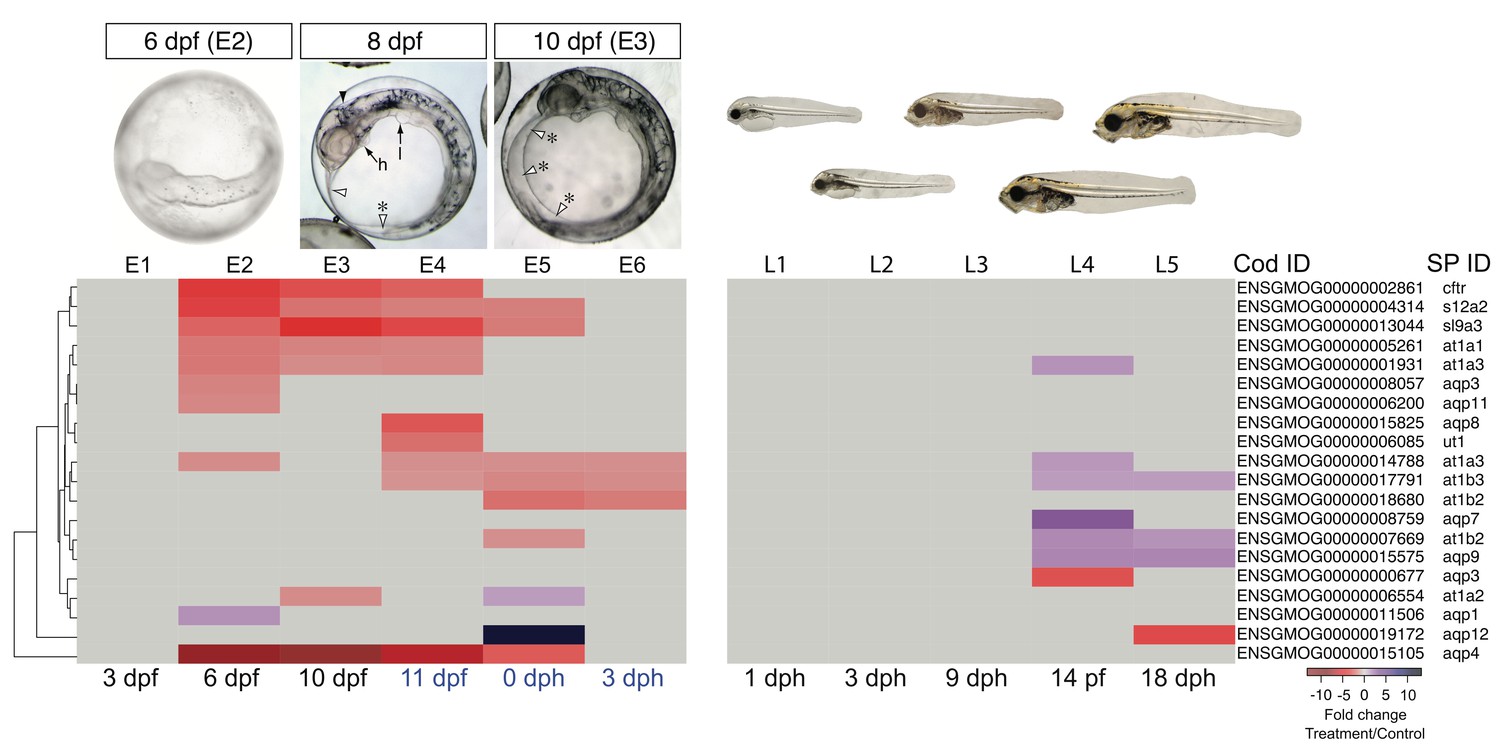
DEGs involved in osmoregulation.
E1–E6: Embryonic exposure, L1–L5: Larval exposure. Black letters: during exposure, blue letters: after exposure.
Tables
Table 1
Genes expressed at all stages during and after embryonic exposure (E2–E6) in high dose group. SP, swissprot; GB, genebank; IE; increased expression; DE; decreased expression.
Cod ID | Swissprot annotation | SP ID | GB ID | Category | Regulation |
|---|---|---|---|---|---|
ENSGMOG00000018302 | Fumarylacetoacetase | faaa | fah | Tyrosine metabolism | IE |
ENSGMOG00000000318 | Cytochrome P450 1A1 | cp1a1 | cyp1a1 | xenobiotic metabolism and stress | IE |
ENSGMOG00000012518 | Glutathione S-transferase P | gstp1 | gstp1 | xenobiotic metabolism and stress | IE |
ENSGMOG00000016016 | Glutathione S-transferase omega-1 | gsto1 | gsto1 | xenobiotic metabolism and stress | IE |
ENSGMOG00000018752 | 3-hydroxyanthranilate 3,4-dioxygenase | 3hao | haao | xenobiotic metabolism and stress | IE |
ENSGMOG00000006796 | 3-beta-hydroxysteroid-Delta(8),Delta(7)-isomerase | ebp | ebp | xenobiotic metabolism and stress | IE |
ENSGMOG00000007636 | Glutamine synthetase | glna | glul | xenobiotic metabolism and stress | IE |
ENSGMOG00000015234 | Heat shock protein HSP 90-alpha | h90a1 | hsp90a.1 | xenobiotic metabolism and stress | IE |
ENSGMOG00000012029 | Peptidyl-prolyl cis-trans isomerase | ppia | - | xenobiotic metabolism and stress | IE |
ENSGMOG00000000218 | Ammonium transporter Rh type A OS=Mus | rhag | rhag | xenobiotic metabolism and stress | Mainly IE |
ENSGMOG00000003353 | Ferritin, middle subunit | frim | - | xenobiotic metabolism and stress | IE |
ENSGMOG00000018206 | Filamin-C | flnc | Flnc | myofibrillar establishment and repair | IE |
ENSGMOG00000001317 | Iron-sulfur cluster assembly enzyme ISCU, mitochondrial | iscu | Iscu | cardiac defects | IE |
ENSGMOG00000010446 | Fatty acid-binding protein, heart | fabph | fabp3 | cardiac defects and repair | IE |
ENSGMOG00000007115 | Lanosterol 14-alpha demethylase | cp51a | cyp51a1 | Cholesterol syntheis | IE |
ENSGMOG00000005565 | Squalene monooxygenase | erg1 | Sqle | Cholesterol syntheis | IE |
ENSGMOG00000018991 | Farnesyl pyrophosphate synthase | fpps | fdps | Cholesterol syntheis | IE |
ENSGMOG00000005774 | 3-hydroxy-3-methylglutaryl-coenzyme A reductase | hmdh | hmgcr | Cholesterol syntheis | IE |
ENSGMOG00000015657 | Epididymal secretory protein | npc2 | npc2 | Cholesterol syntheis | IE |
ENSGMOG00000001249 | Putative adenosylhomocysteinase | sahh3 | ahcyl2 | cardiac defects | DE |
ENSGMOG00000013374 | Peptide Y OS=Dicentrarchus | py | - | CNS function and development | IE |
ENSGMOG00000014820 | Complement C1q-like protein | c1ql2 | c1ql2 | CNS function and development | IE |
ENSGMOG00000017148 | Augurin-A OS=Danio rerio | augna | zgc:112443 | CNS function and development | IE |
ENSGMOG00000001072 | C-4 methylsterol oxidase | erg25 | sc4mol | CNS function and development | IE |
ENSGMOG00000013980 | Fatty acid-binding protein, brain | fabp7 | fabp7 | CNS function and development | IE |
ENSGMOG00000014938 | Maltase-glucoamylase, intestinal | mga | mgam | ATP metabolism | IE |
ENSGMOG00000003530 | ADP/ATP translocase | adt3 | slc25a6 | ATP metabolism | DE |
ENSGMOG00000006172 | IEF0762 protein C6orf58 homolog | cf058 | - | not known | IE |
Table 2
Genes expressed at all stages during larval exposure (L1–L5) in high-dose group. SP, swissprot; GB, genebank; IE; increased expression; DE; decreased expression.
Cod ID | Swissprot annotation | SP ID | GB ID | Category | Regulation |
|---|---|---|---|---|---|
ENSGMOG00000009114 | Aryl hydrocarbon receptor repressor | ahrr | ahrr | Xenobiotic metabolism | IE |
ENSGMOG00000020141 | Cytochrome P450 1B1 | cp1b1 | cyp1b1 | Xenobiotic metabolism | IE |
ENSGMOG00000006842 | Cytochrome P450 1B1 | cp1b1 | cyp1b1 | Xenobiotic metabolism | IE |
ENSGMOG00000019790 | Cytochrome P450 1B1 | cp1b1 | cyp1b1 | Xenobiotic metabolism | IE |
ENSGMOG00000000318 | Cytochrome P450 1A1 | cp1a1 | cyp1a1 | Xenobiotic metabolism | IE |
ENSGMOG00000014967 | Keratinocyte growth factor | fgf7 | fgf7 | Myocardial development and tissue repair | IE |
ENSGMOG00000020500 | Forkhead box protein Q1 | foxq1 | foxq1 | Transcription factor | IE |
ENSGMOG00000000218 | Ammonium transporter Rh type A | rhag | rhag | Gas transport | IE |
Table 3
Time course of pathway enrichment relating to affected and unaffected developmental and functional phenotypes.
Phenotype† | Development stage* | |||||
|---|---|---|---|---|---|---|
3 dpf/E1 | 6 dpf/E2 | 10 dpf/E3 | 11 dpf/E4 | 0 Dph/E5 | three Dph/E6 | |
Cardiovascular | 0 (0/8) | 22.4 (11/49) | 5.7 (4/70) | 7.0 (4/57) | 4.7 (2/43) | 2.1 (1/48) |
Craniofacial | 0 (0/8) | 12.2 (6/49) | 10 (7/70) | 5.3 (3/57) | 7.0 (3/43) | 2.1 (1/48) |
Liver | 12.5 (1/8) | 0 (0/49) | 5.7 (4/70) | 8.8 (5/57) | 0 (0/43) | 0 (0/48) |
Eye | 0 (0/8) | 4.1 (2/49) | 20 (14/70) | 48.6 (17/35) | 51.2 (22/43) | 50.0 (24/48) |
Osmoregulation | -- | 43.3 (13/30) | 29.3 (12/41) | 15.0 (3/20) | 16 (4/25) | -- |
Cholesterol | 0/30 | 0 (0/27) | 27.1 (13/48) | 31.3 (10/32) | 25.5 (12/47) | -- |
Lipid | 0/30 | 40.7 (11/27) | 35.4 (17/48) | 50.0 (16/32) | 48.9 (23/47) | -- |
-
*Percentage of total enriched pathways (absolute values).
-
†Numbers of affected pathways representing Cardiovascular, Craniofacial, Liver and Eye were extracted from the combined Development category in IPA results; numbers of pathways representing osmoregulation/ion transport were extracted from the Molecular Transport category; numbers of pathways affecting Cholesterol/sterol metabolism and other non-cholesterol lipids (Lipid) were extracted from the Lipid Metabolism category.
Additional files
-
Supplementary file 1
Tables.
(A) Read count data for a selection of genes expressed in distinct tissues. (B) Ten most regulated Ingenuity Pathway Analysis (Categories: Development, Lipid metabolism, Molecular transport) in high dose at stages E1-E6. #, number of molecules (C) Ingenuity Pathway Analysis. Top five pathways in low, pulse and high dose at all time points during and after embryonic exposure in the categories: Top canonical pathways, Molecular and cellular functions, Physiological system development and function and Cardiotoxicity. #, number of molecules (D) Ten most up- and down-regulated genes. Genes that are represented among the ten most at more than one stage are collapsed into one row. SP, swissprot; E1-E6, embryonic exposure; L1-L5, larval exposure; PMID, PubMed identification. (E) Regulation of differentially expressed genes involved in cardiogenesis SP, swissprot; GB, genebank; FC, fold change; E1-E6, embryonic exposure; C, control; H, high dose. (F) Manually curated list of genes involved in cardiac development and function and craniofacial development and bone and cartilage maintenance. SP, swissprot; GB, genebank; Ref, references; PMID: National Center for Biotechnology Information (NCBI) PubMed identification. (G) List of excitation contraction coupling genes examined. SP, swissprot; GB, genebank. (H) Regulation of differentially expressed genes involved in excitation contraction coupling in exposed haddock. SP, swissprot; GB, genebank; FC, fold change; E1-E6, embryonic exposure; C, control; H, high dose; L1-L5, larval exposure. (I) Regulation of differentially expressed genes involved in craniofacial development. SP, swissprot; GB, genebank; FC, fold change; E1-E6, embryonic exposure; C, control; H, high dose. (J) Regulation of differentially expressed myosin heavy chain genes. SP, swissprot; GB, genebank; FC, fold change; E1-E6, embryonic exposure C, control; H, high dose. (K) Regulation of differentially expressed key genes involved in osmoregulation. SP, swissprot; GB, genebank; FC, fold change; E1-E6, embryonic exposure; C, control; H, high dose; L1-L5, larval exposure. (L) Differentially expressed genes involved in osmoregulation. SP, swissprot; GB, genebank; IE, increased expression; DE, decreased expression. (M) Genes involved in liver and lateral line development. SP, swissprot; GB, genebank. (N) Primers and probes for real time qPCR. SP, swissprot.
- https://doi.org/10.7554/eLife.20707.019
Download links
A two-part list of links to download the article, or parts of the article, in various formats.
Downloads (link to download the article as PDF)
Open citations (links to open the citations from this article in various online reference manager services)
Cite this article (links to download the citations from this article in formats compatible with various reference manager tools)
Novel adverse outcome pathways revealed by chemical genetics in a developing marine fish
eLife 6:e20707.
https://doi.org/10.7554/eLife.20707


