Assessing the mechanism and therapeutic potential of modulators of the human Mediator complex-associated protein kinases
- The Institute of Cancer Research, United Kingdom
- Merck KGaA, Germany
- Cardiff University, United Kingdom
Figures
Figure 1 with 2 supplements
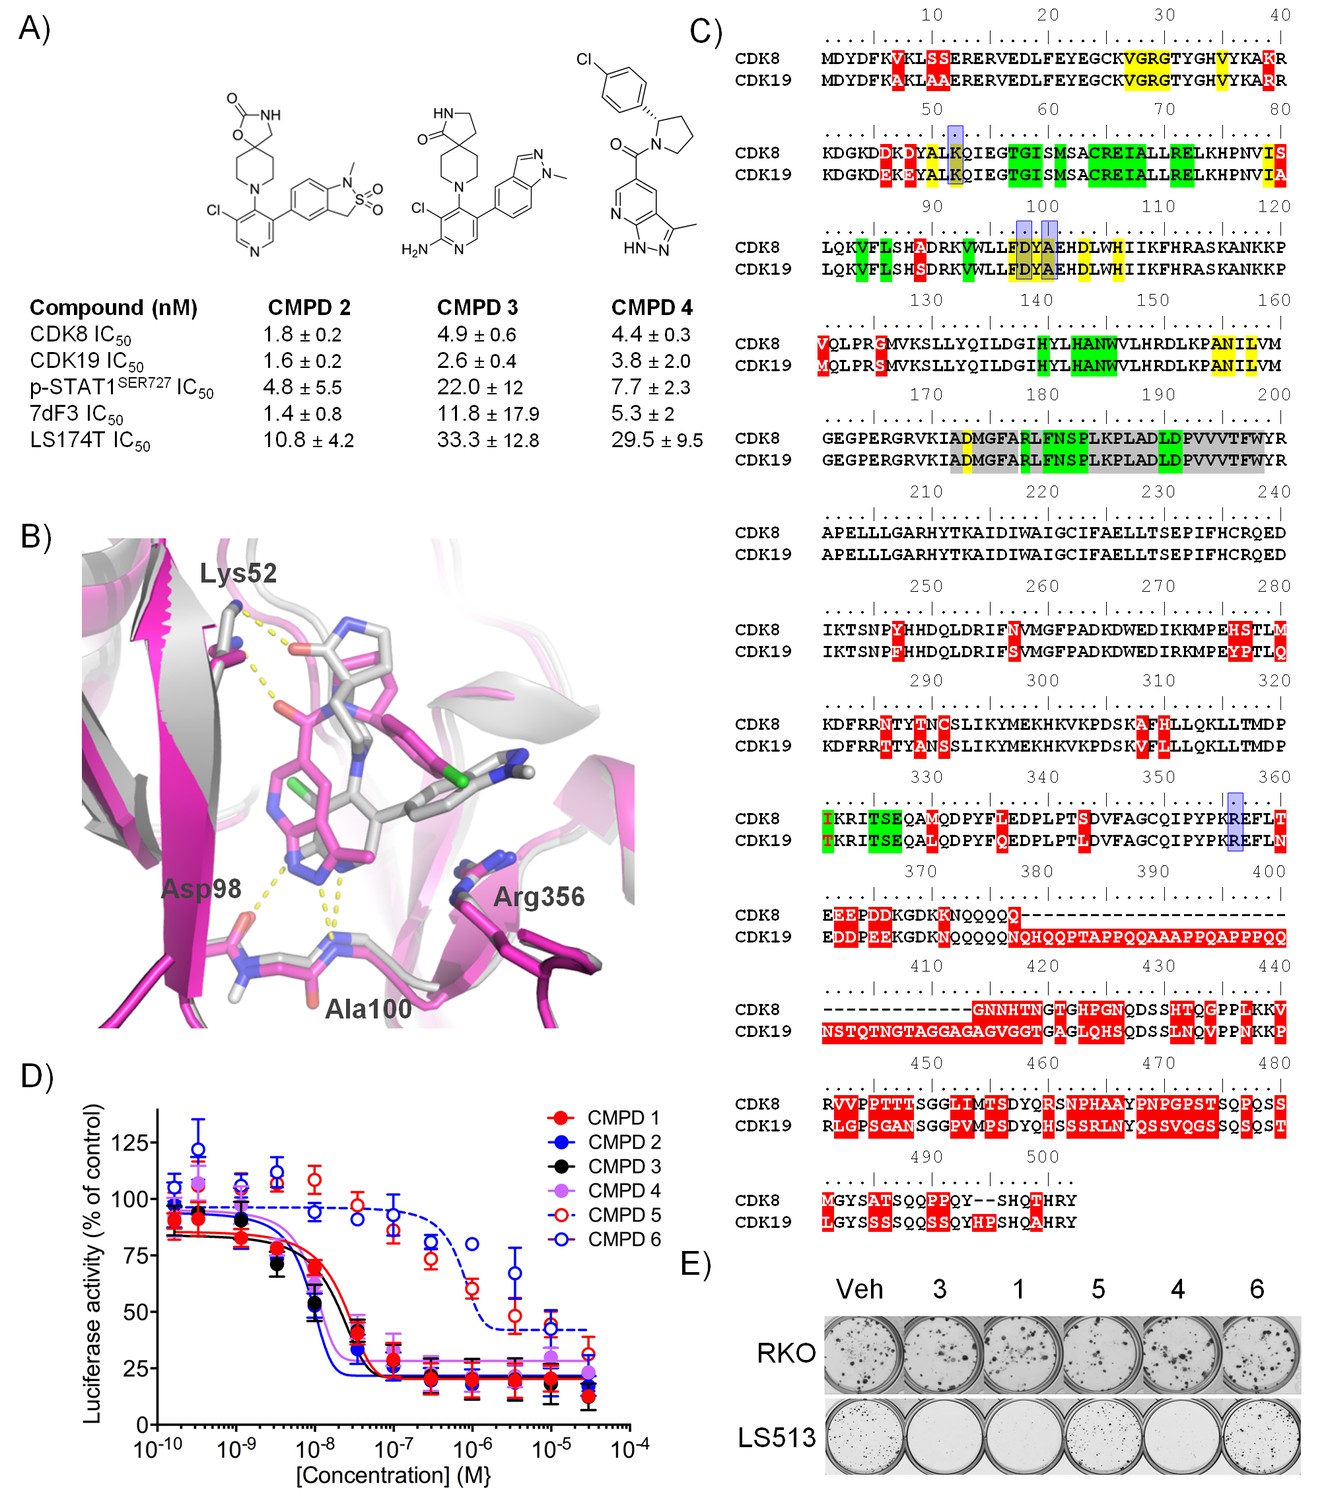
Optimised compounds for exploring CDK8 and CDK19 function.
(A) Chemical structure and activity of compounds 2, 3 and 4 (n > 2, mean ± s.d.). (B) Overlay of 3 (grey; ocd 5HBJ) and 4 (pink; Pdb code: 5IDN) bound to CDK8/CCNC. Key interactions (yellow) and residues are shown. Residues 23 – 39 and 359 – 361 have been cropped for clarity. (C) Amino acid sequence alignment for human CDK8 and CDK19. Red, sequence differences; yellow, ATP binding; green, CCNC binding; gray, activation loop; blue, inhibitor binding. (D) Luciferase activity in COLO205-cl4 cells containing a TCF/LEF reporter gene construct following 24 hr compound treatment (n = 4, mean ± s.d.). (E) Colony assay. Plates were seeded with LS513 or insensitive RKO cells and treated for 14 d.
-
Figure 1—source data 1
Properties of CDK8/19 ligands and their effects on reporter expression and cell proliferation in a human colorectal cancer cell line panel.
- https://doi.org/10.7554/eLife.20722.004
Figure 1—figure supplement 1
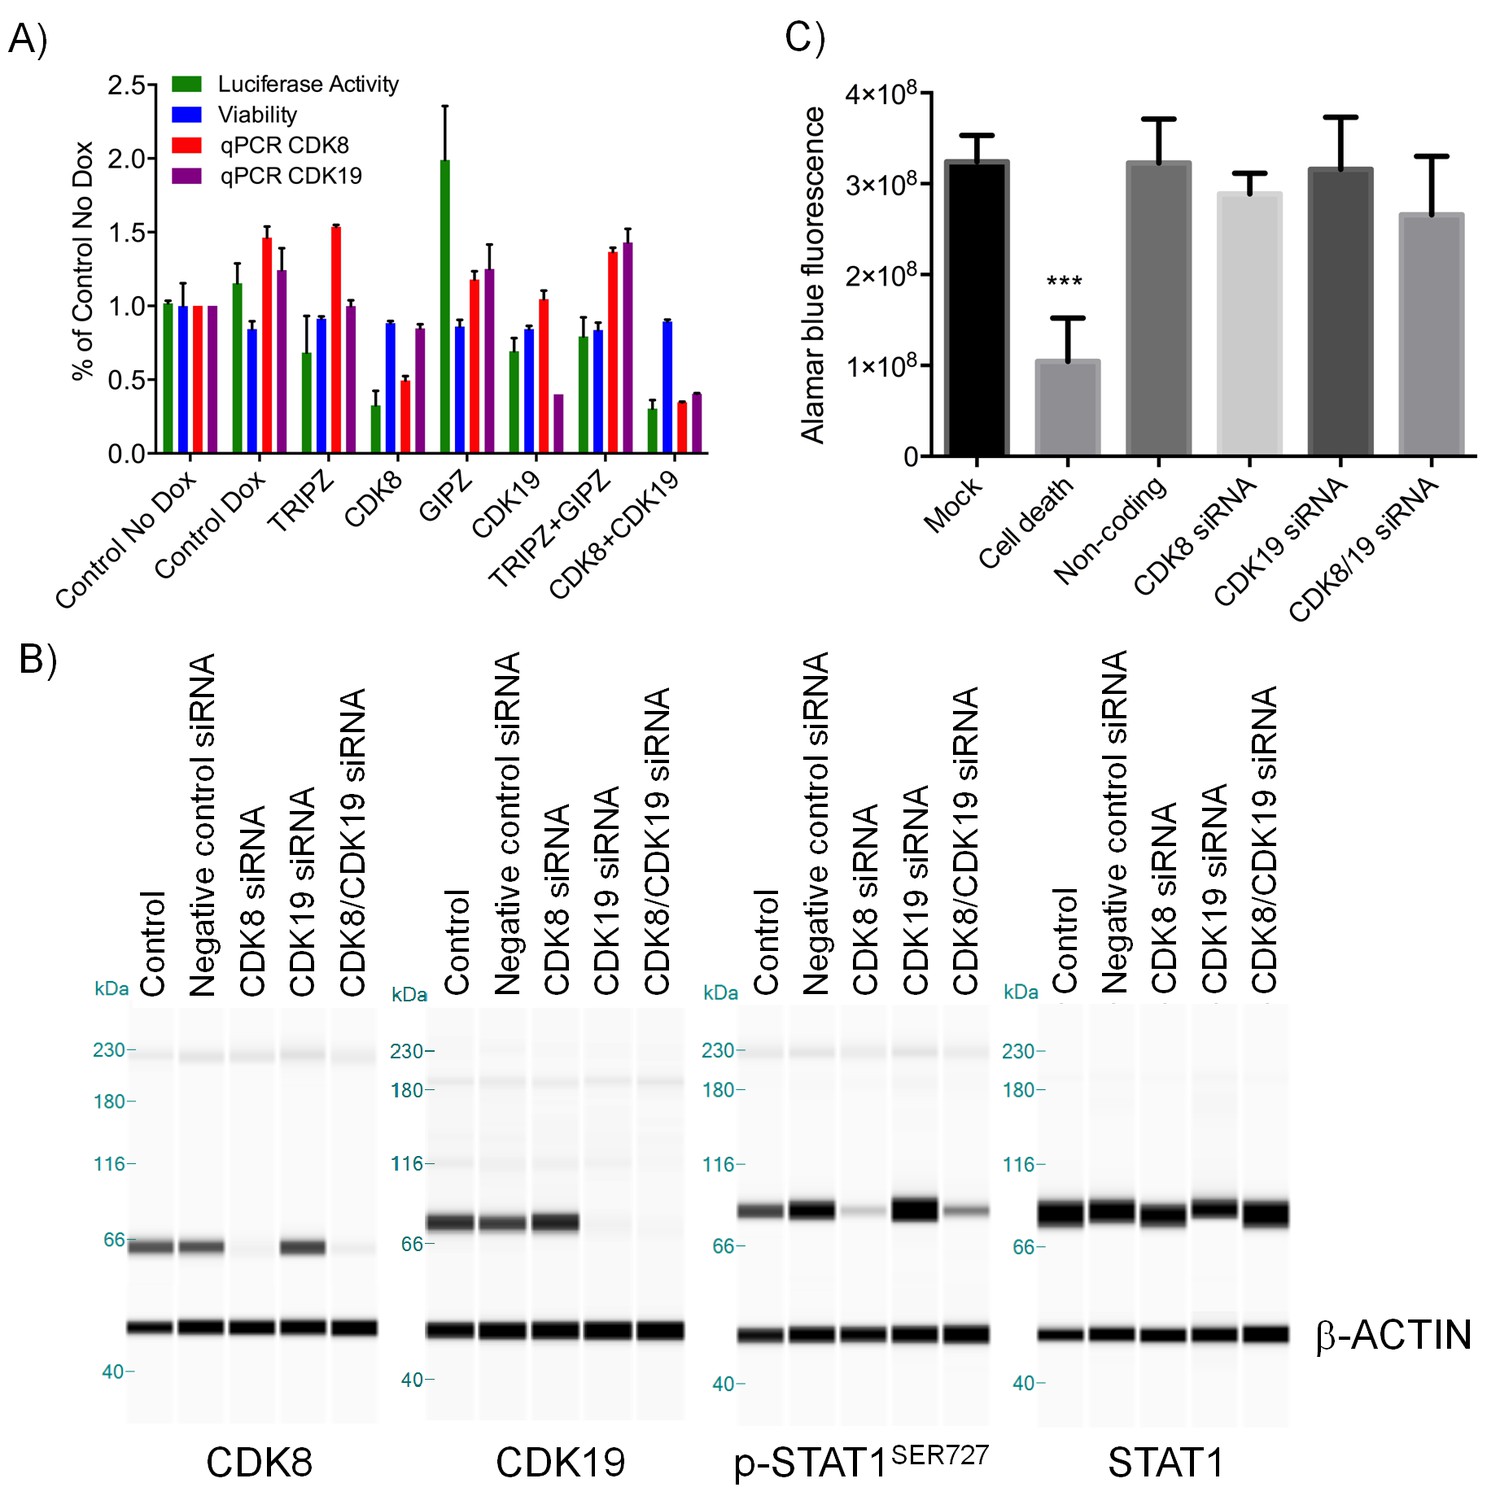
Effect of CDK8 and CDK19 shRNA and siRNA treatment in CDK8-amplified human colorectal cancer cell lines.
(A) WNT pathway reporter activity, cell viability and CDK8/19 transcript levels in COLO205-cl4 TCF/LEF reporter cells expressing either an inducible CDK8 shRNA, a constitutive CDK19 shRNA, an inducible CDK8 plus constitutive CDK19 shRNA or a non-targeting constitutive (GIPZ) or inducible (TRIPZ) control shRNA. Reporter activity and viability were measured following 8 d 1µg/ml Dox induction (mean ± s.e.m, n = 3). CDK8, CDK19, p-STAT1SER727 and STAT1 levels (B) and HT29 cell viability (C) following 5 d treatment with CDK8 and/or CDK19 siRNA (Mock = no siRNA, Death = positive control siRNA, Non-coding = negative control siRNA). In B, β-actin was used as the loading control.
Figure 1—figure supplement 2
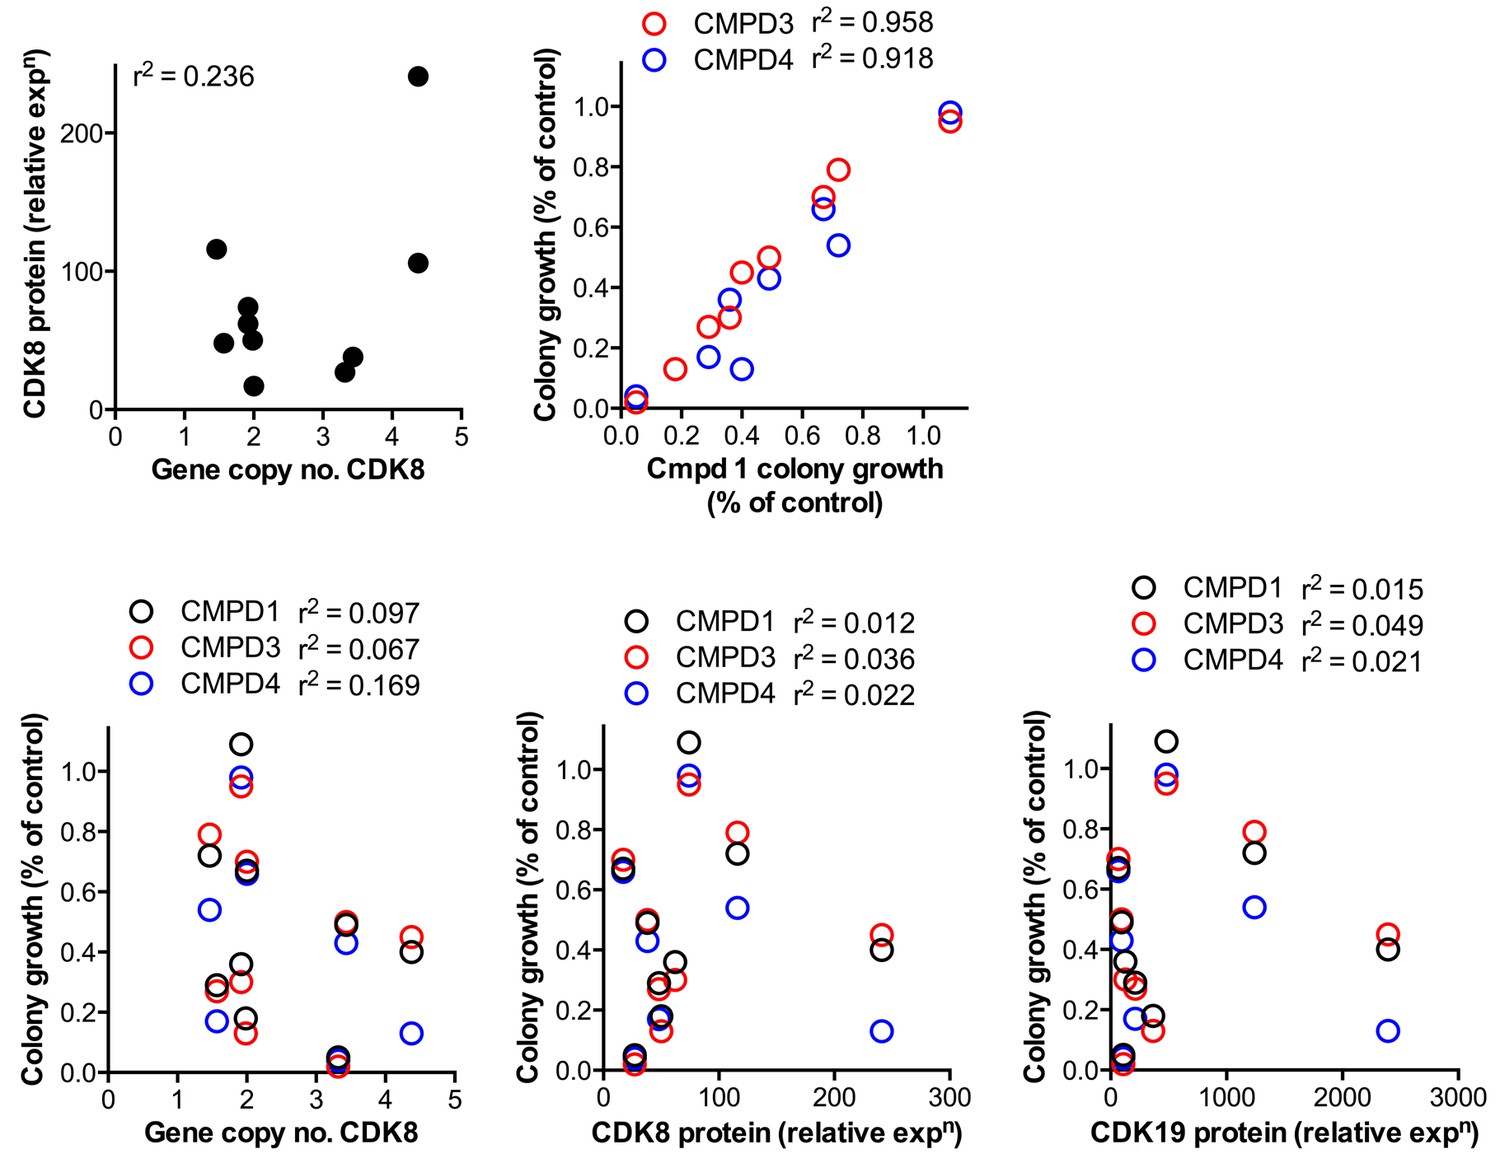
Comparison of CDK8 and CDK19 gene copy number or protein expression with sensitivity to treatment with compound.
Data from Figure 1—source data 1 for CDK8 gene copy number or protein expression, or CDK19 protein expression, were compared with the effects of 1, 3 and 4 on 14 d colony growth assay. Pearson r2 correlation values are shown.
Figure 2 with 4 supplements

Target inhibition and antitumor activity of CDK8/19 ligands 3 and 4 in established human colorectal cancer cell line xenografts.
(A) Level of p-STAT1SER727 in SW620 human colorectal cancer xenografts following a single dose of 4, relative to the p-STAT1SER727 level in vehicle-treated mice. Significance was determined by Kruskal-Wallis test and Dunn’s post-test (*p=<0.001; ). (B, C) Modelling of experimental data, including data from (A) and Figure 2—figure supplement 2D, of STAT1SER727 phosphorylation following (B) single or (C) twice daily doses of 30 mg/kg 3 (black) or 30 and 100 mg/kg 4 (orange and purple). (D) Volume of SW620 xenografts in mice treated with 4 or a vehicle control. (E) Level of p-STAT1SER727, relative to control, in SW620 tumor xenografts at the stated time following the final dose of 4 (from D).
-
Figure 2—source data 1
Details of human colorectal cancer cell line xenograft studies.
- https://doi.org/10.7554/eLife.20722.008
Figure 2—figure supplement 1
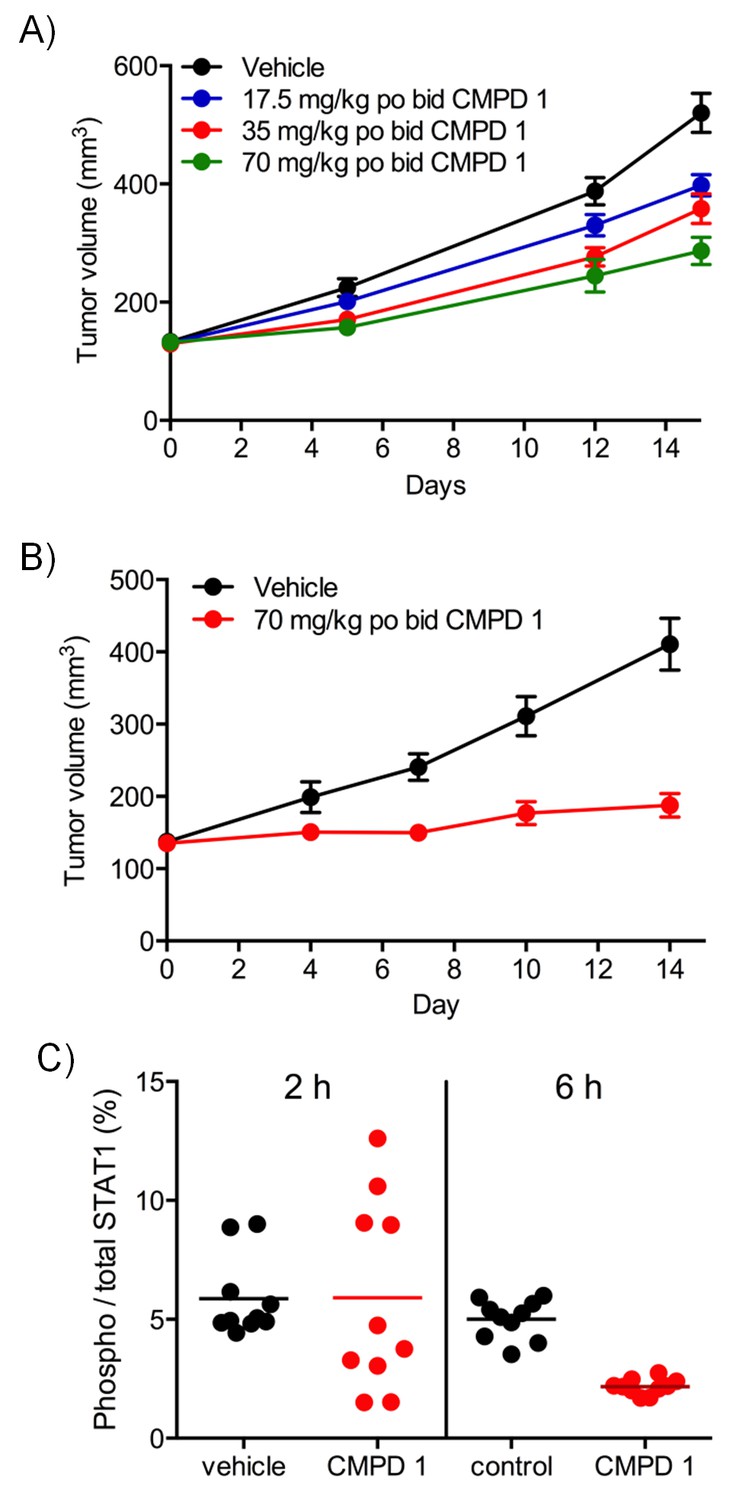
Differential antitumor activity in human LS513 colorectal cancer xenografts treated with CDK8/19 ligand 1.
Antitumor activity in (A) HCT116 and (B) LS513 colorectal cancer xenografts treated with 1. (C) target engagement in LS513 colorectal cancer xenografts treated with 1. STAT1 and p-STAT1SER727 levels 2 or 6 hr after the final dose.
Figure 2—figure supplement 2
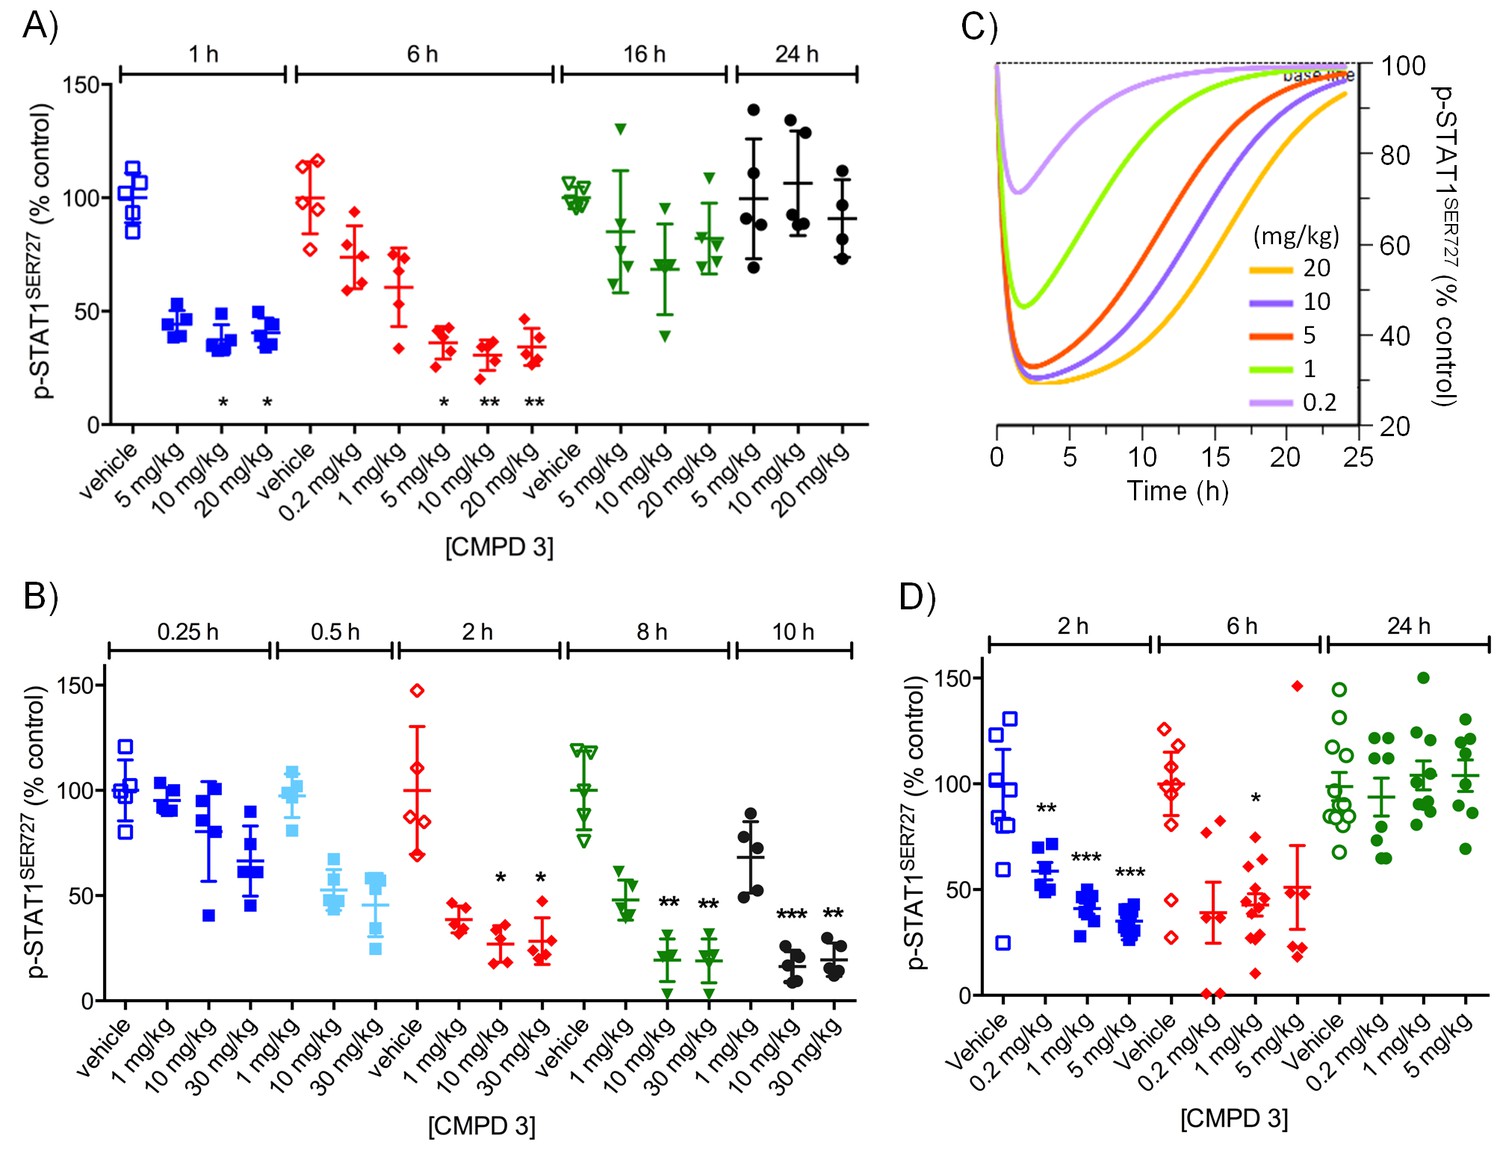
Pharmacodynamic profiling of CDK8/19 ligand 3 in human colorectal cancer xenografts.
(A, B) Level of p-STAT1SER727 in HCT116 colorectal cancer xenografts in mice treated with single doses of 3. Significance was determined by Kruskal-Wallis test and Dunn’s post-test (*p=<0.001, **p=<0.0001). (C) Simulation of PD dose-dependence of 3 in HCT116 colorectal cancer xenografts. (D) Level of p-STAT1SER727 in SW620 colorectal cancer xenografts after the mice were treated with a single dose of 3.
Figure 2—figure supplement 3
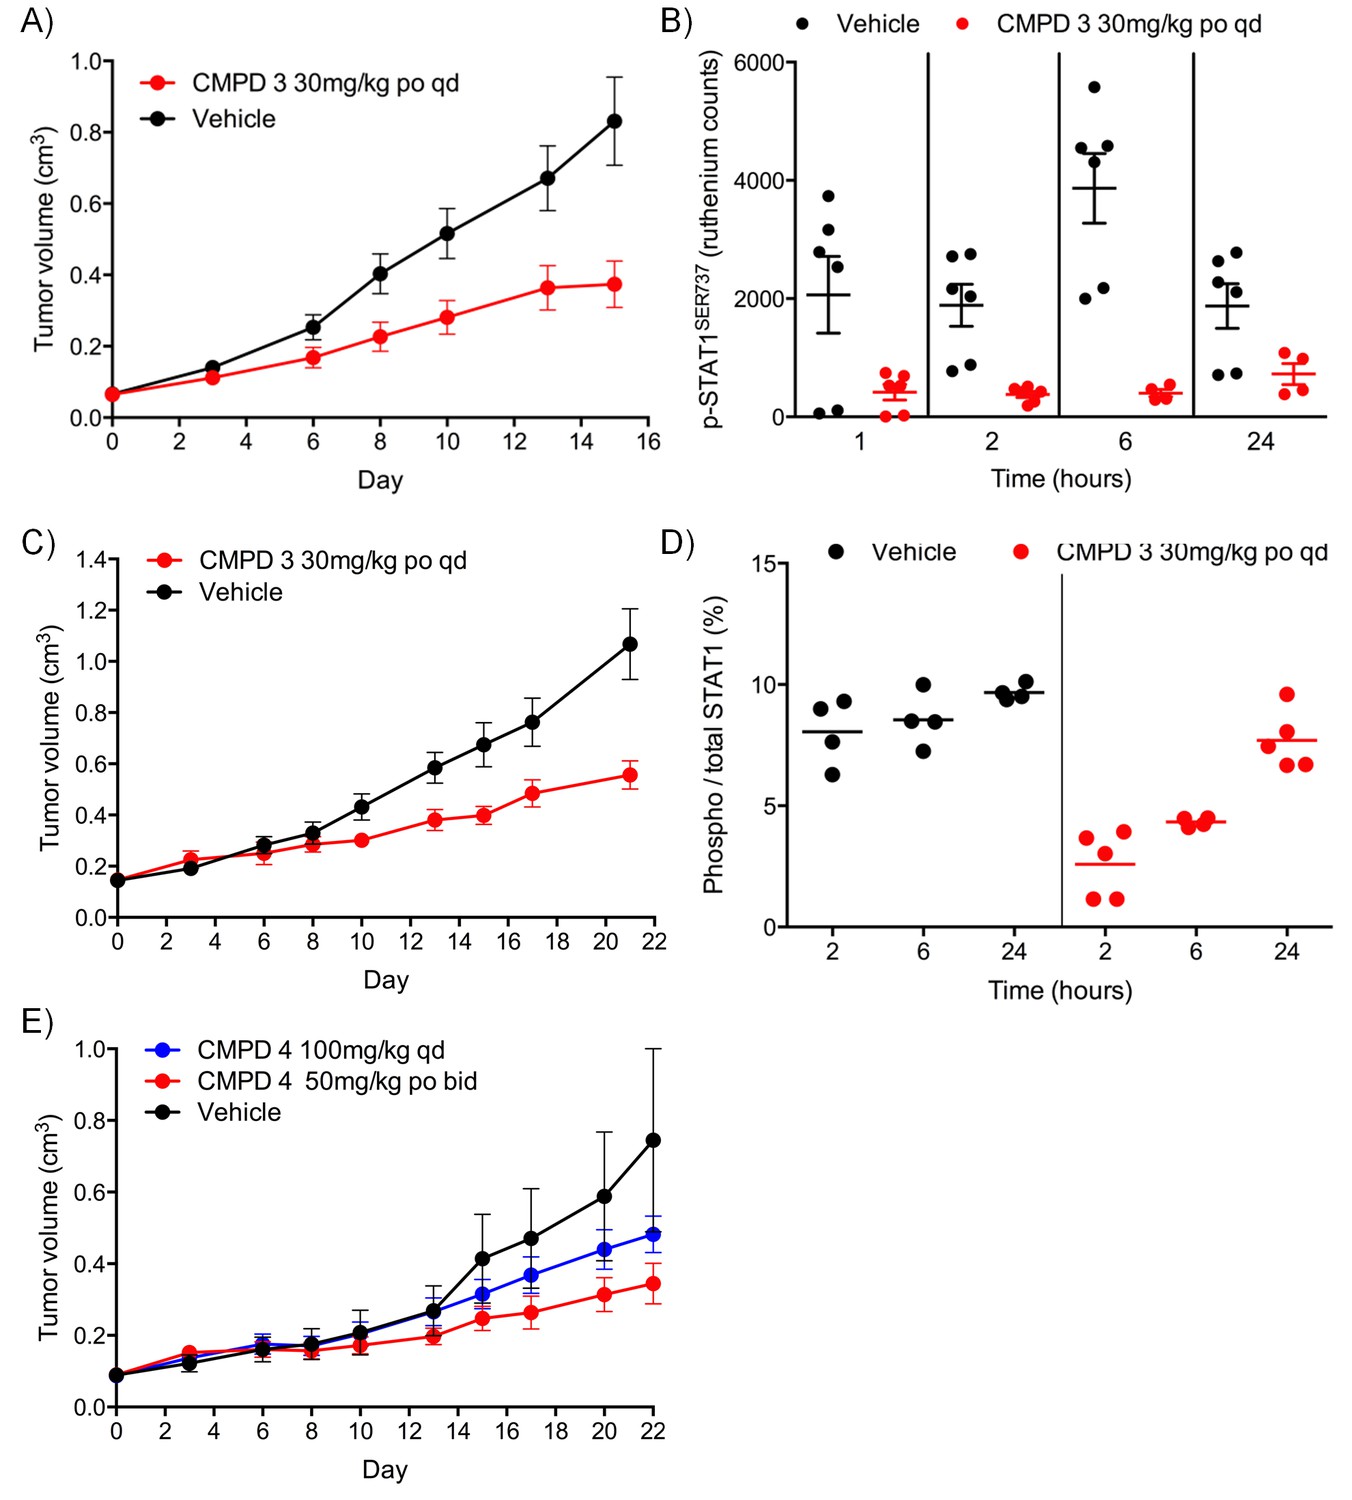
Antitumor activity and target engagement in human colorectal cancer xenografts treated with CDK8/19 ligands 3 and 4.
(A, B) Antitumor activity (A) and target engagement (B) in SW620 colorectal cancer xenografts treated with 3. (C, D) Antitumor activity (C) and target engagement (D) in LS1034 colorectal cancer xenografts treated with 3. Antitumor activity (E) in LS1034 colorectal cancer xenografts treated with 4. In (E) p-STAT1SER727 was decreased by 58% 2 hr post-treatment (p-STAT1SER727 values normalised to total STAT1 levels; control: 1719 ± 174; CMPD 4: 719 ± 46; (n = 4, mean ± s.e.m). p-STAT1SER727 and total STAT1 levels were determined at the specified times after the final dose.
Figure 2—figure supplement 4
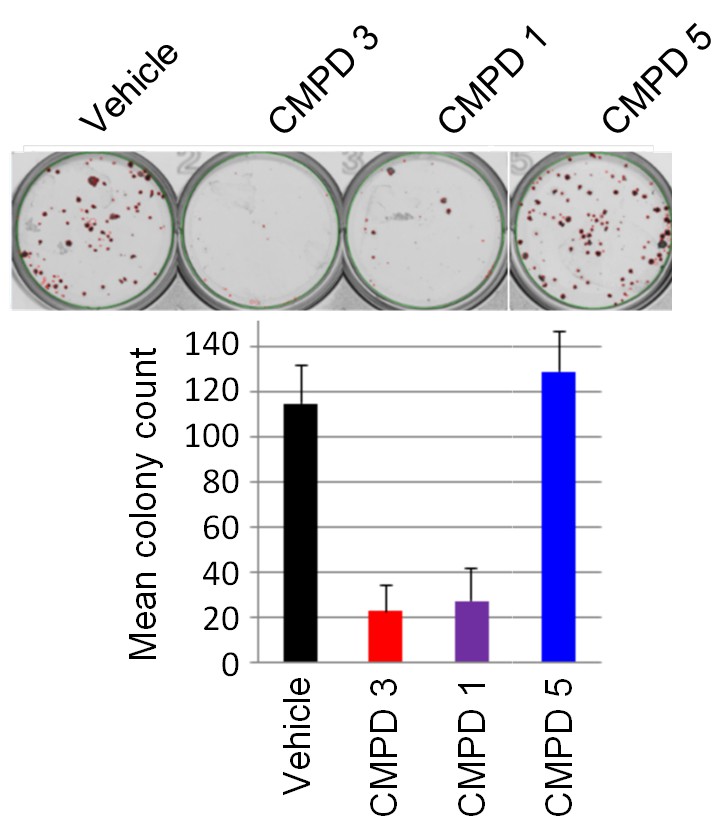
LS1034 colony assay.
(A) Growth of LS1034 cell colonies treated for 14 d with 350 nM test compounds 1, 3 and 5 (n = 3, mean ± s.d.).
Figure 3 with 2 supplements
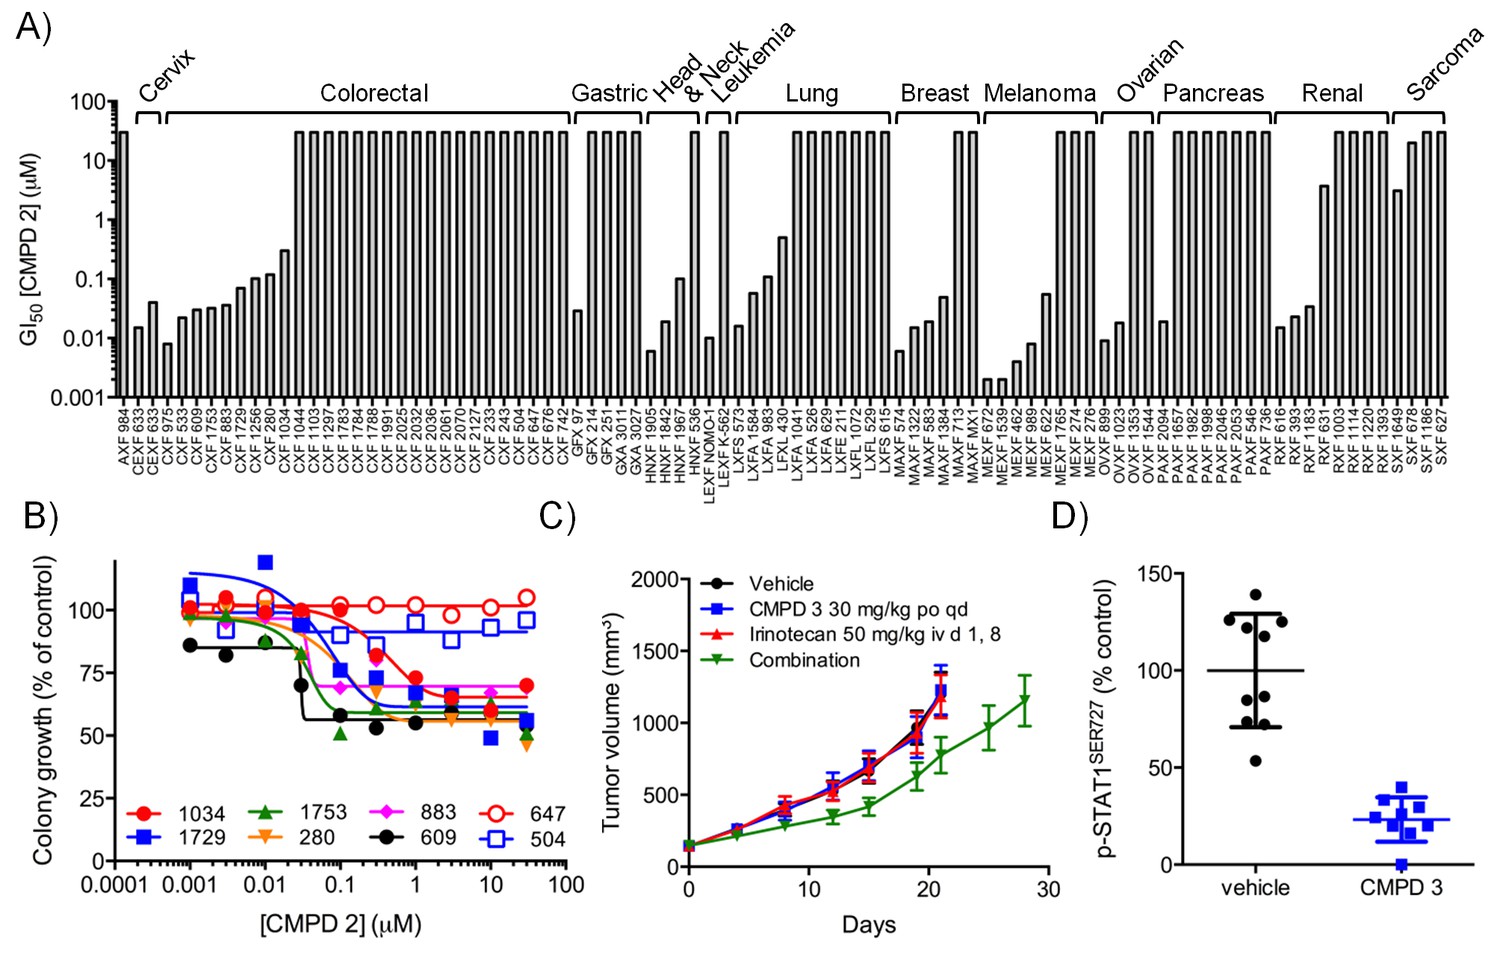
In vitro and in vivo activity of CDK8/19 ligands in patient-derived tumour xenograft models.
(A) GI50 values for 2 in PDX soft agar colony cultures. (B) Exemplar dose-response profiles for selected colorectal cancer clonogenic assays treated with 2. (C) Volume of human colorectal cancer CXF 1034 (CTNNB1MUT, PIK3CAMUT, PTENMUT) PDXs in mice treated with vehicle, 3 and / or irinotecan (mean values ± s.e.m., n = 10 per cohort). Tumor volume was significantly different (p=<0.001; 2 way ANOVA and Tukey’s multiple comparison test) in mice receiving the combination treatment, compared with the monotherapy groups. (D) Level of p-STAT1SER727, relative to control, in CXF 1034 xenografts in mice treated with 3 measured 1 hr after the final dose (p=<0.0001, Mann-Whitney test; mean values ± s.d., n = 10 per cohort).
Figure 3—figure supplement 1
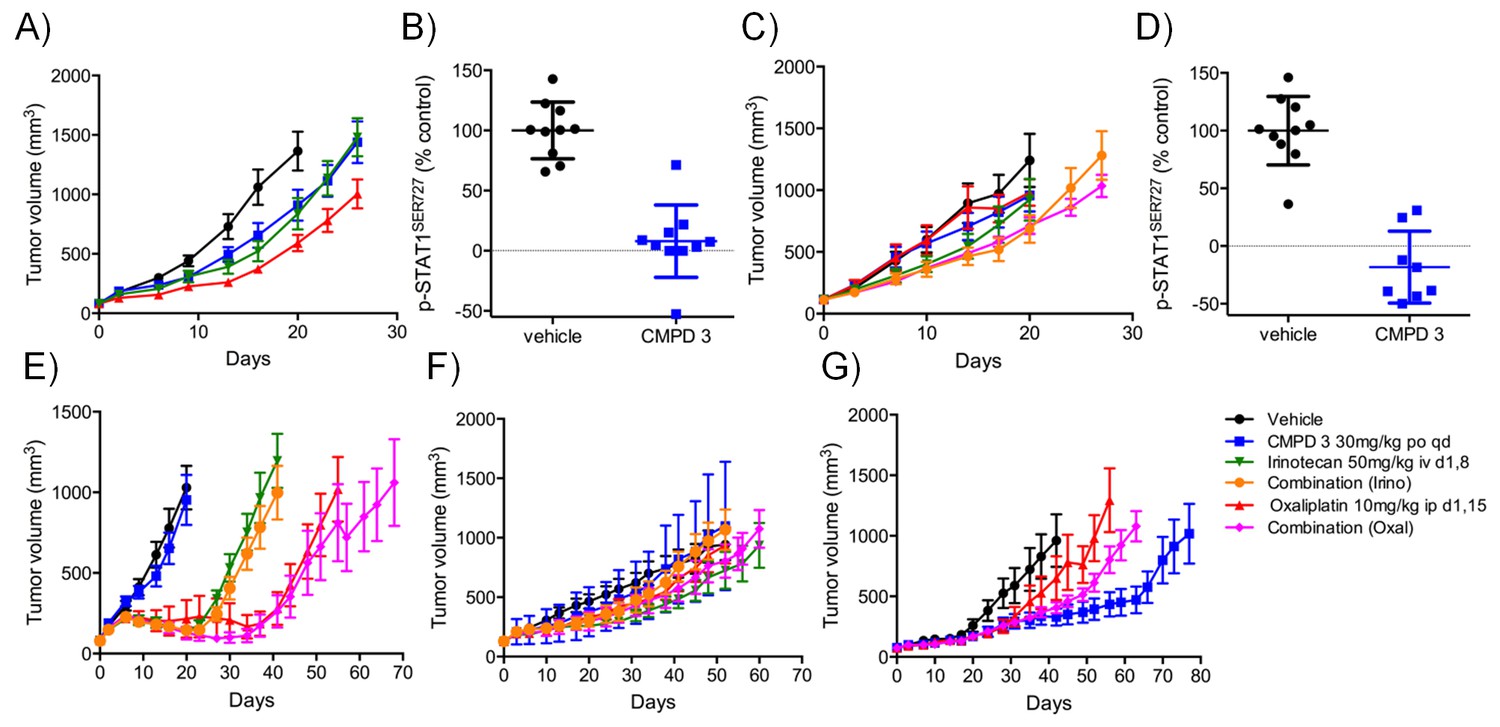
In vivo activity of CDK8/19 ligand 3 in PDXs.
Volume of PDXs treated with vehicle, 3 and/or irinotecan/oxaliplatin, 0 (n = 10, mean ± s.e.m). Xenografts tested: A, CFX 883 (KRASMUT, CTNNB1MUT, PTENMUT); C, CFX 1729 (p53MUT); E, CFX 280 (KRASMUT, APCMUT, p53MUT); F, CFX 609 (KRASMUT, APCMUT, p53MUT); G, CFX 1753 (NRASMUT, PIK3CAMUT, APCMUT). Ratio of p-STAT1SER727 to total STAT1, expressed relative to the vehicle control, in (B) CFX883 and (D) CFX1729 xenografts treated with 3. p-STAT1SER727 and STAT1 levels were assayed 1 hr after the last dose (n = 10, mean ± s.d.) and a statistically significant difference detected (p=<0.0001, Mann-Whitney two-tailed test).
Figure 3—figure supplement 2
Pharmacodynamic and antitumor activity of 3 and 4 in AML models.
(A) Percentage of AML Nomo-1 cells detected in the peripheral blood of NOD/Shi-SCID/IL-2Rγnull mice treated with 10 mg/kg po bid 3 or a vehicle control (p=<0.001, Kruskal-Wallis and Dunn’s post test). (B) Percentage of AML cells detected in the spleen and bone marrow of mice from A after 21 d treatment with 3 or the vehicle control (p=<0.05). (C) Antitumor activity in MV-4-11 AML xenografts treated with po 5/7 bid, 2/7 qd 4 or the vehicle control, relative to day 0. (D) p-STAT1SER727 to STAT1 ratio in MV-4-11 AML xenografts from C treated with 4 or the vehicle control. Protein levels were determined 2 and 6 hr after the last dose was administered (p<0.001, Mann-Whitney two-tailed test).
Figure 4 with 1 supplement
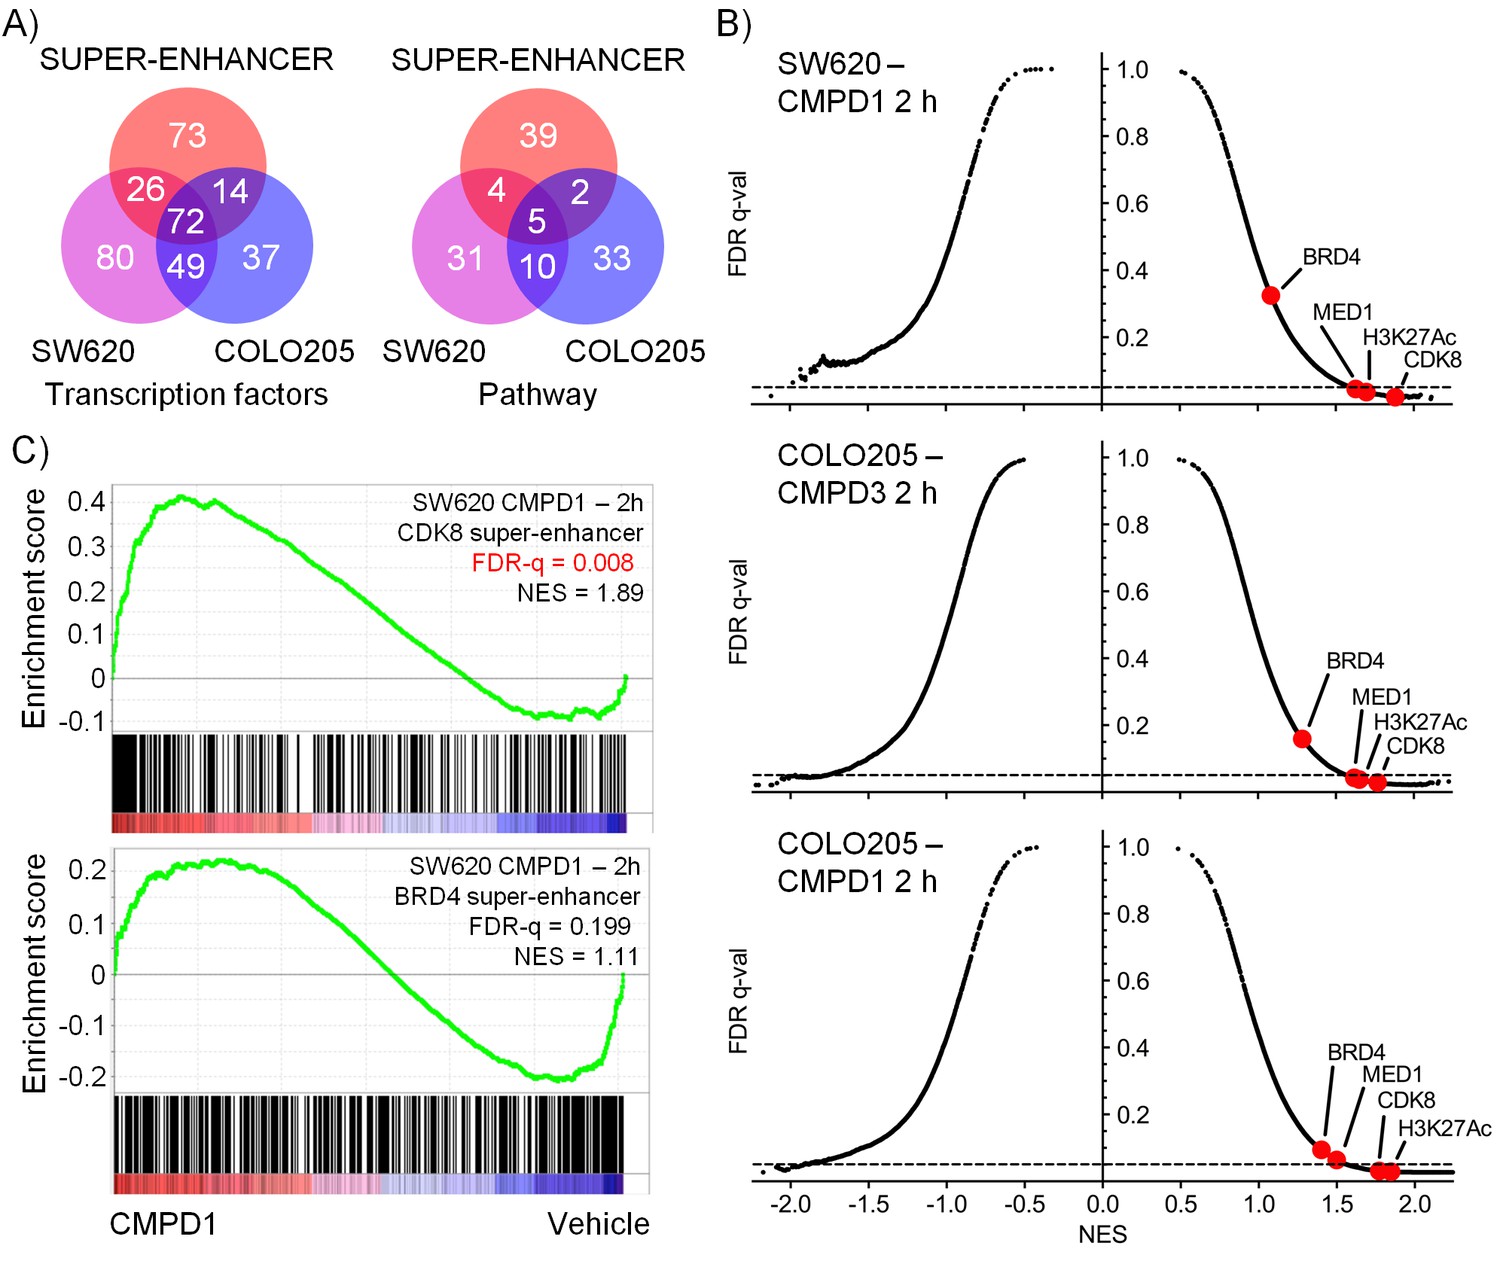
Microarray gene expression profiling following in vivo treatment of human colorectal cancer xenografts with CDK8/19 ligands.
Mice were treated with 70 mg/kg po 1 (SW620 and COLO205), 20 mg/kg po 3 (COLO205). (A) Venn plots of transcription factor-associated genesets or those encoding or regulating pathways enriched in genes whose expression was significantly altered by treatment (Supplementary Dataset). (B) GSEA of CDK8 or BRD4-associated super-enhancer genes in treated human tumor xenografts. (C) Scatterplot of false discovery rate (FDR-q) versus normalized enrichment score (NES) for indicated gene sets evaluated by GSEA (n=10,218), signatures include those from MSigDB, dbSUPER and the ChIP-seq data from Pelish and colleagues (Pelish et al., 2015).
-
Figure 4—source data 1
Geneset expression analysis of microarray data following in vivo treatment of SW620 or COLO205 cells.
- https://doi.org/10.7554/eLife.20722.017
Figure 4—figure supplement 1
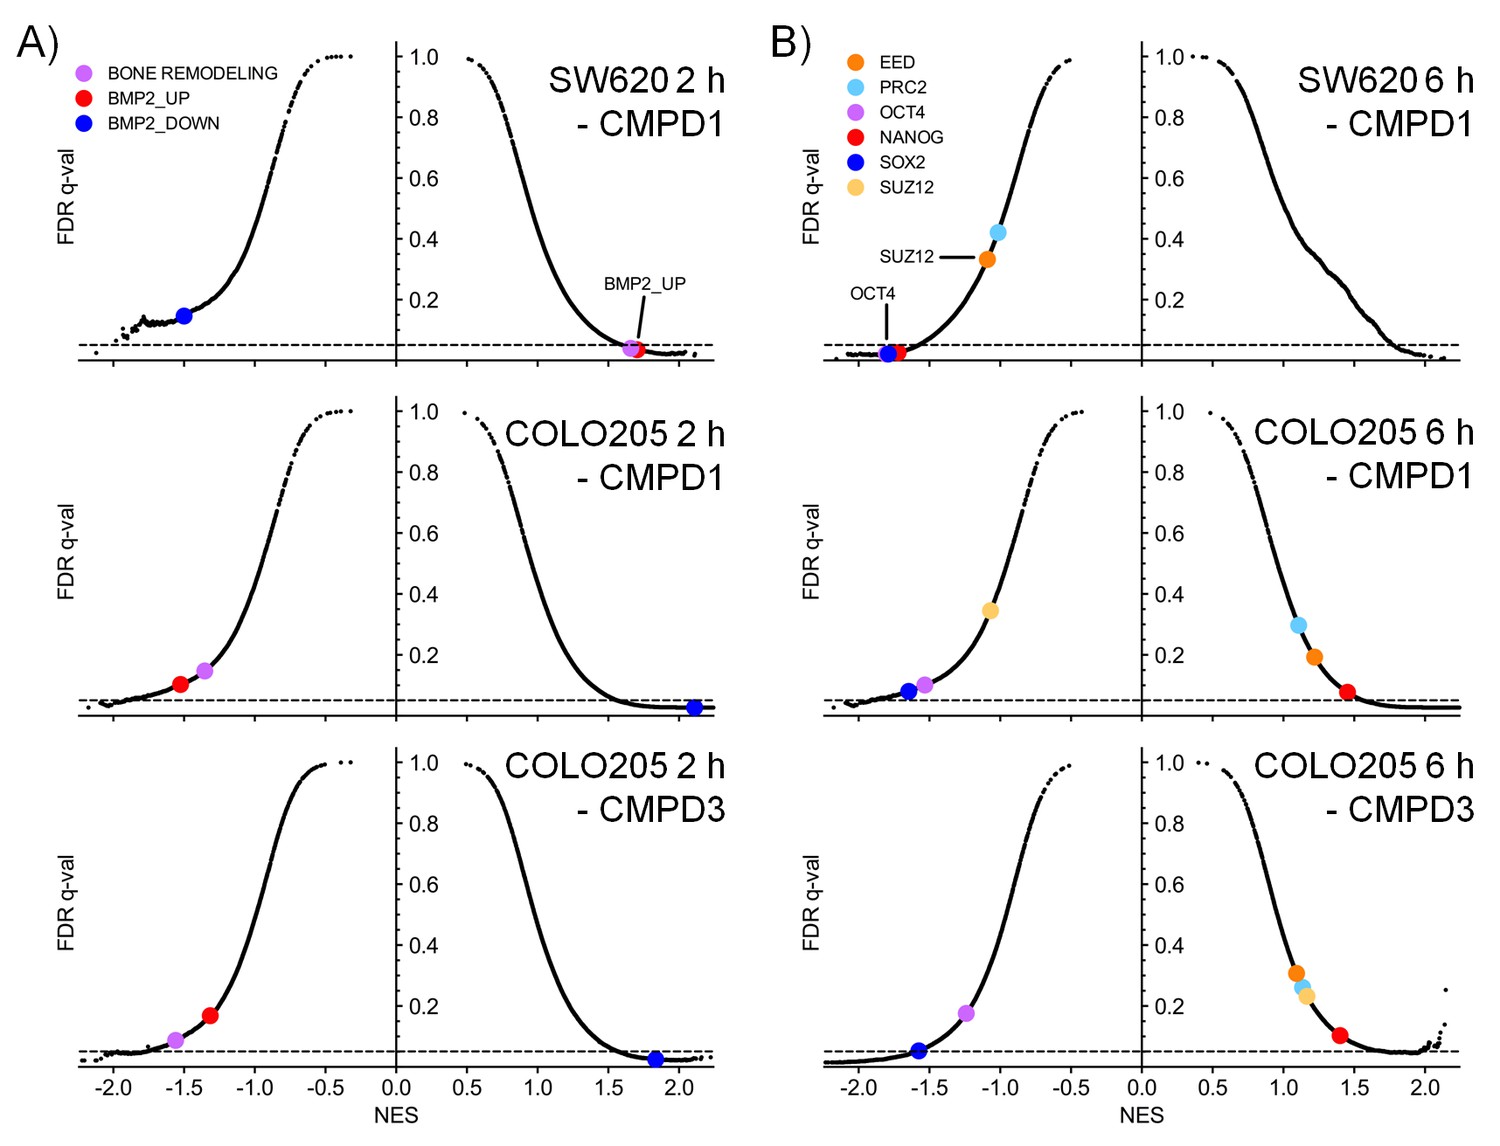
Microarray gene expression profiling following in vivo treatment of colorectal cancer cell line xenografts.
Xenografts were treated with 70 mg/kg po 1 (SW620 and COLO205) and 20 mg/kg po 3 (COLO205). Scatterplots of false discovery rate (FDR-q) versus normalized enrichment score (NES) for indicated gene sets evaluated by GSEA (n=10,218), signatures include those from MSigDB, dbSUPER and the ChIP-seq data from Pelish and colleagues (Pelish et al., 2015). Scatter plots highlighting A, BMP2 and bone remodelling genesets or B, genesets regulated by the polycomb group complex (EED, PRC2 or SUZ12) or transcription factors associated with pluripotency (NANOG, OCT4 or SOX2).
Figure 5 with 1 supplement

Treatment with CDK8/19 ligand 1 reduces the hyperplastic crypt stem cell population.
Gene expression, measured by RT-PCR, in the intestinal epithelial stem and TA cells isolated from mice expressing a Dox-inducible activated β-catenin transgene. (A) Transcript abundance, relative to control, in stem and TA cells following induction with 2 mg/ml Dox. (B) Abundance of different cell types following treatment with Dox and compound 1. (C) Proportion of stem versus TA cells following treatment. (D) Fold changes in transcript abundance in stem (D) and TA (E) cells following treatment. All data are mean values ± s.d., n = 3.
-
Figure 5—source data 1
Antibodies and PCR primers used for analysis of mouse intestinal epithelial cells.
- https://doi.org/10.7554/eLife.20722.020
Figure 5—figure supplement 1
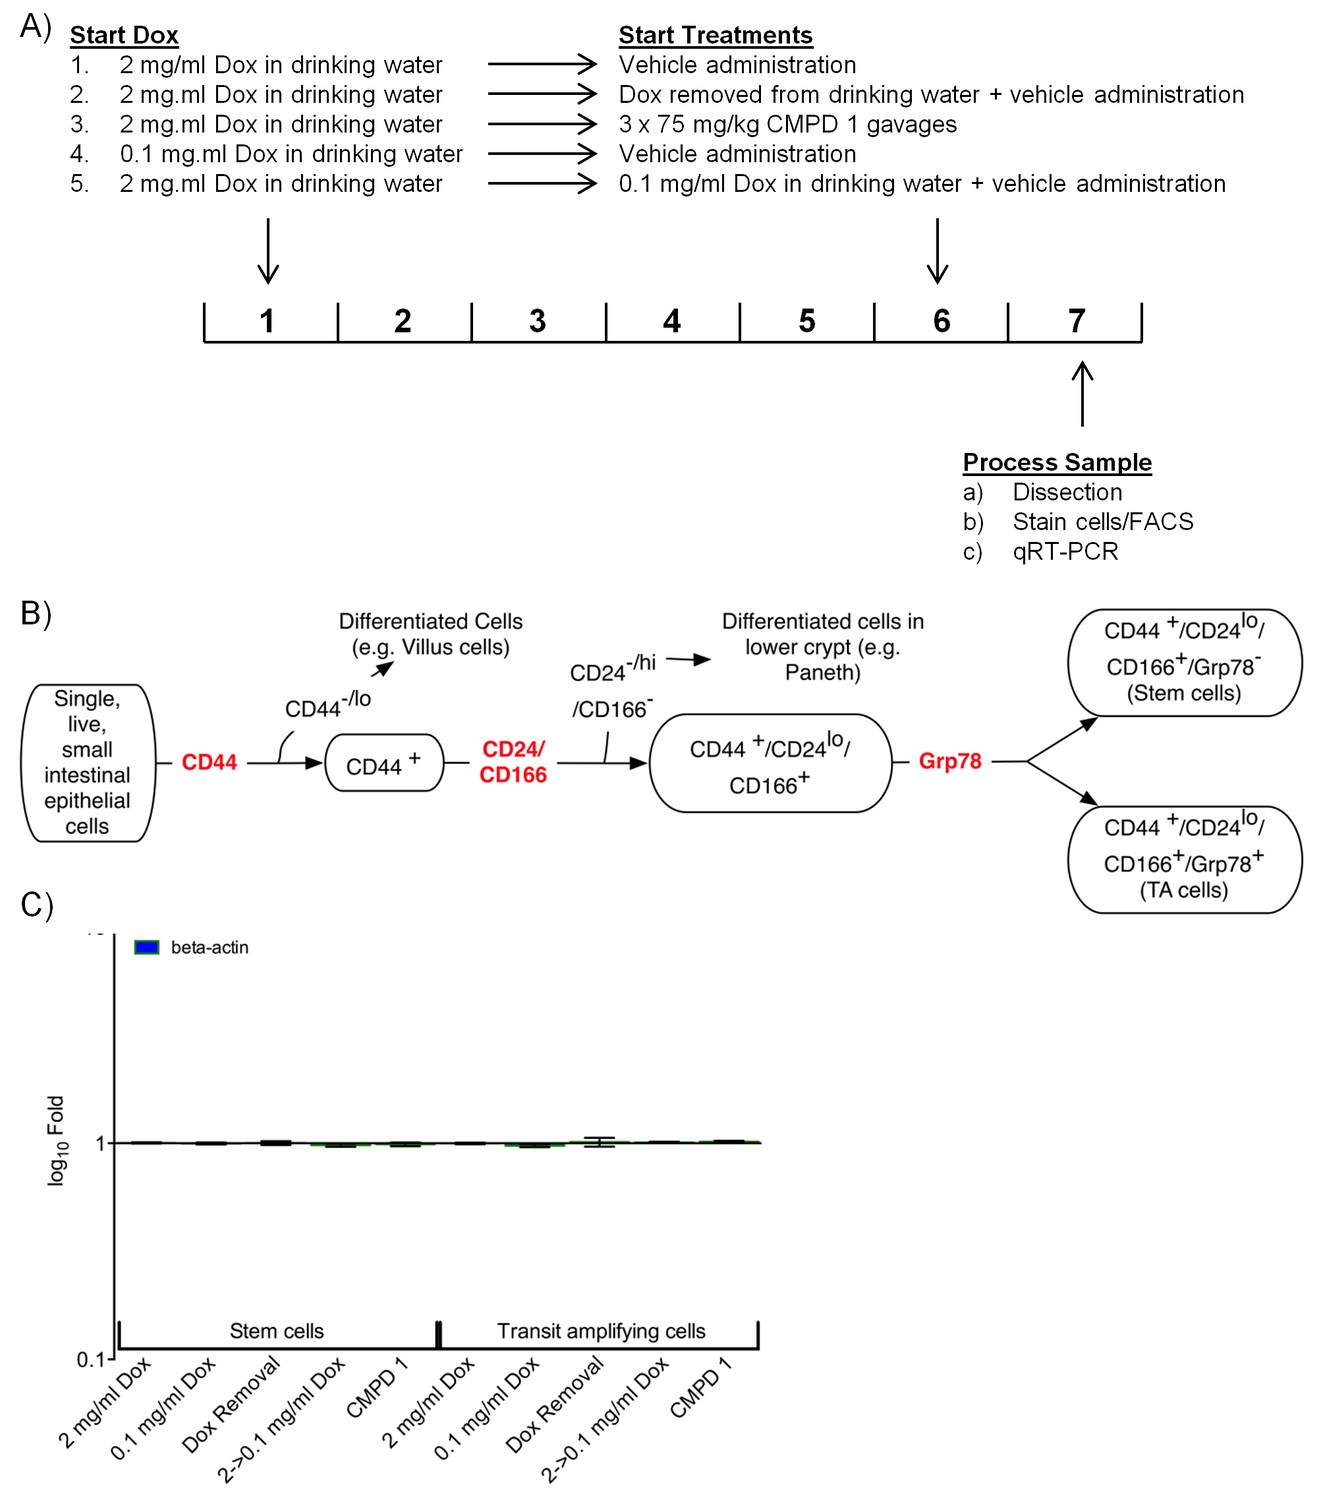
Analysis of stem and TA cells isolated from the hyperplastic crypts of mice expressing a Dox-inducible activated β-catenin transgene.
(A) Experimental design. (B) FACS approach used to isolate the stem and TA cells. (C) Abundance of beta-actin control transcripts following treatment.
Figure 6 with 1 supplement

Effect of CDK8/19 chemical ligands on bone development and the immune response in model systems.
Mouse KS483 osteoprogenitor cells were treated with LGK974 (red) or compound 3 (black) for 13 d and bone matrix formation determined by measuring (A) N-terminal propeptide of type I procollagen (PINP) and (B) calcium, in the external medium (mean ± s.d., n = 6). Blue region, level following 50 ng/ml BMP-2 (positive control); red region, basal level. (C) Heat map showing the 10 biomarkers most affected by compound treatment in cell co-culture models. Data are log2 ratios of biomarker levels following compound treatment relative to control (range: −0.874 to 0.396). Blue, decreased ratio; red, increased ratio. (D) Plasma IL-12 levels in Wistar rats treated with 5 – 20 mg/kg po qd 3. Two rats per cohort.
-
Figure 6—source data 1
Culture conditions and data from CDK8/19 ligand profiling in the culture/co-culture cell model panel.
- https://doi.org/10.7554/eLife.20722.023
Figure 6—figure supplement 1
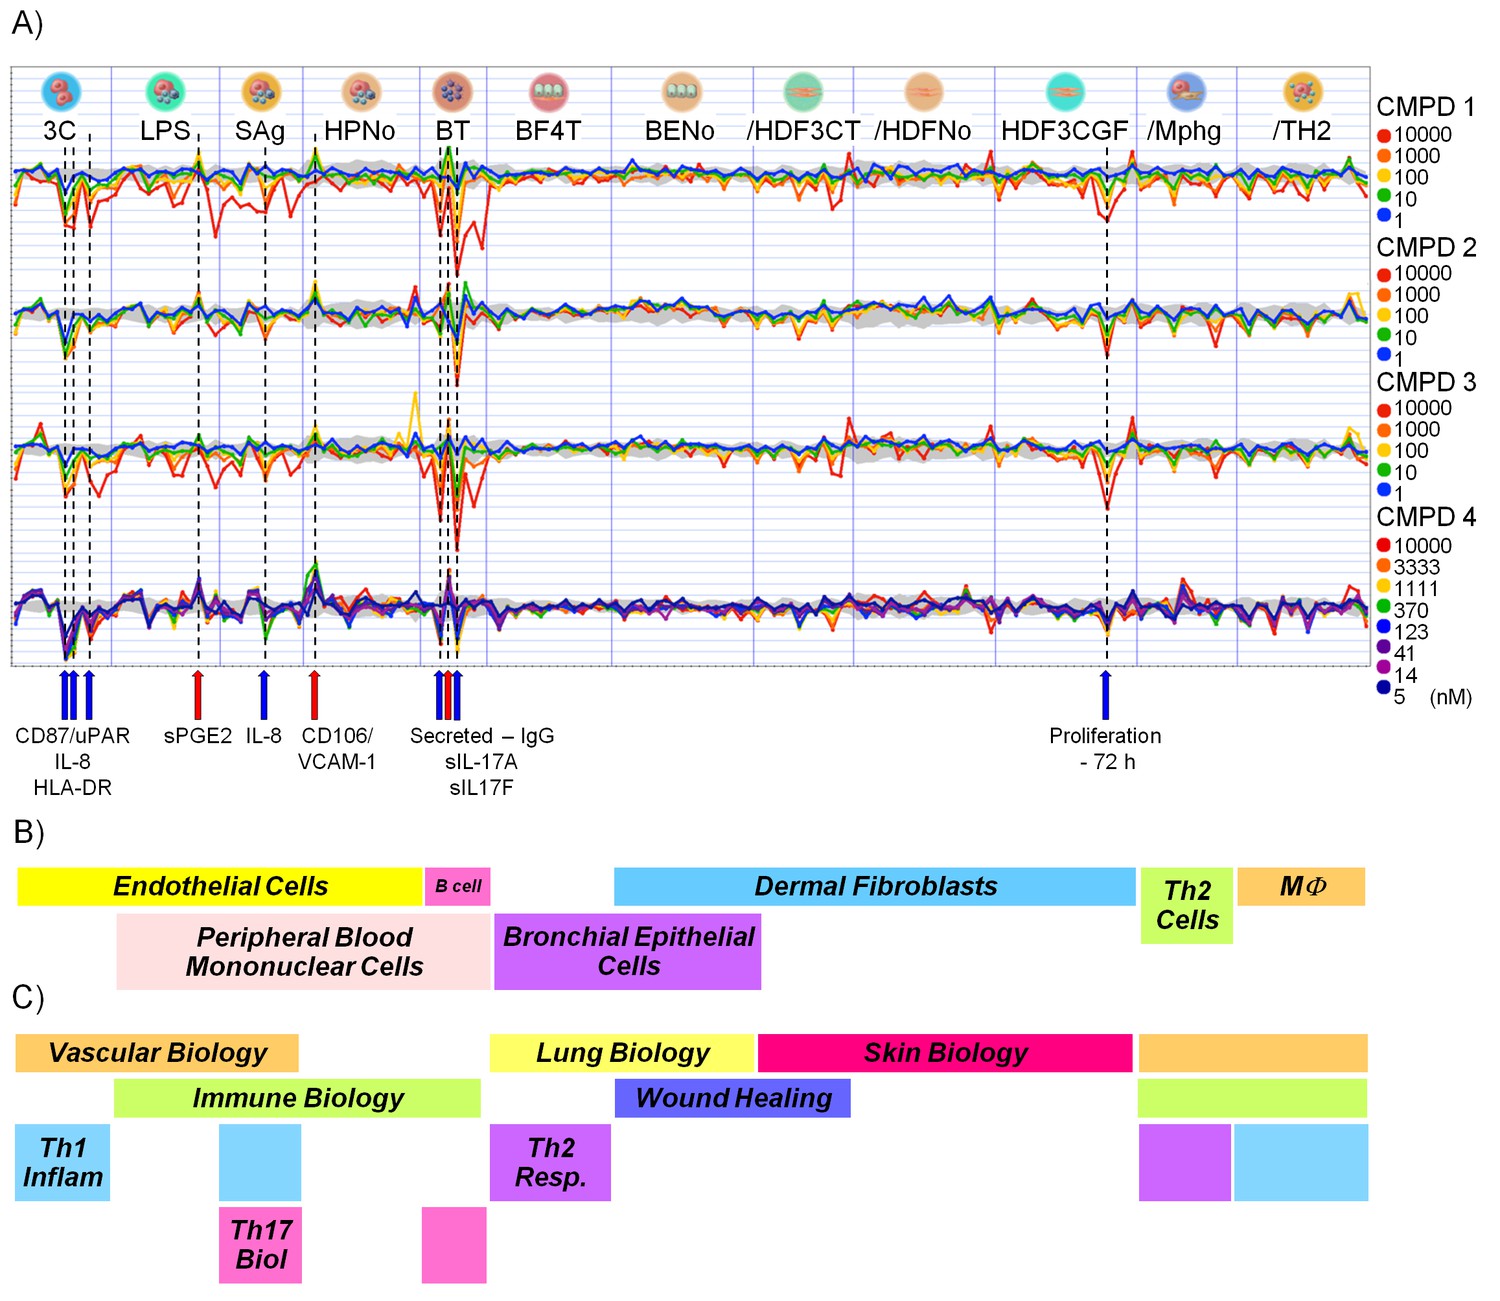
Effect of CDK8/19 ligands 1-4 on 12 culture/coculture cell models.
(A) Log2 ratio of cell model biomarkers plotted relative to levels under control conditions. The gray area indicates the control envelope (>95% confidence). Points outside this area were considered significant. The ten markers consistently altered by all four compounds are indicated on the x-axis. (B) Cell types used and (C) biology covered by the 12 culture/co-culture models.
Figure 7 with 1 supplement
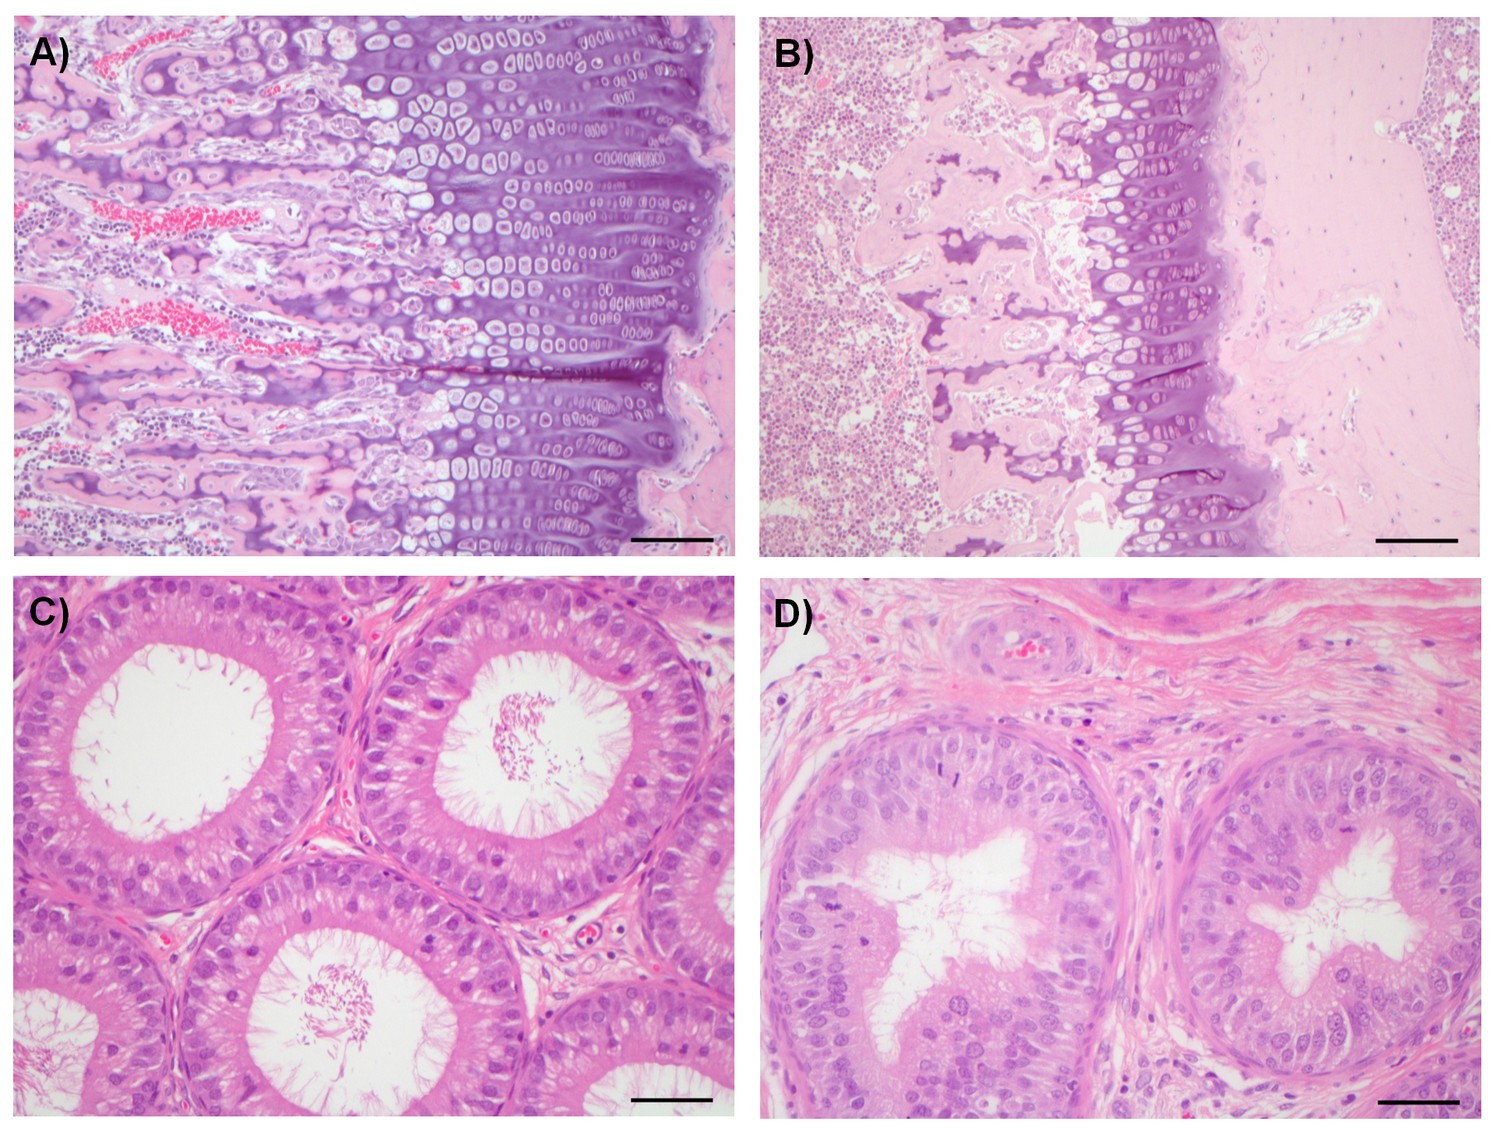
Examples of degenerative and proliferative lesions in rats treated with CDK8/19 ligands 3 or 4.
(A) Intact proliferative zone in the bone growth plate of a control rat. (B) Dysplastic proliferative zone, showing disturbance of regular endochondrial ossification, from a rat treated with 20 mg/kg 3. Scale bar in A and B = 100 µm. (C) Intact epididymides, with epididymal cells, isolated from a control rat. (D) Epididymides with epithelial hyperplasia (distal corpus) isolated from a rat treated with 60 mg/kg 4. Scale bar in C and D = 50 µm.
Figure 7—figure supplement 1
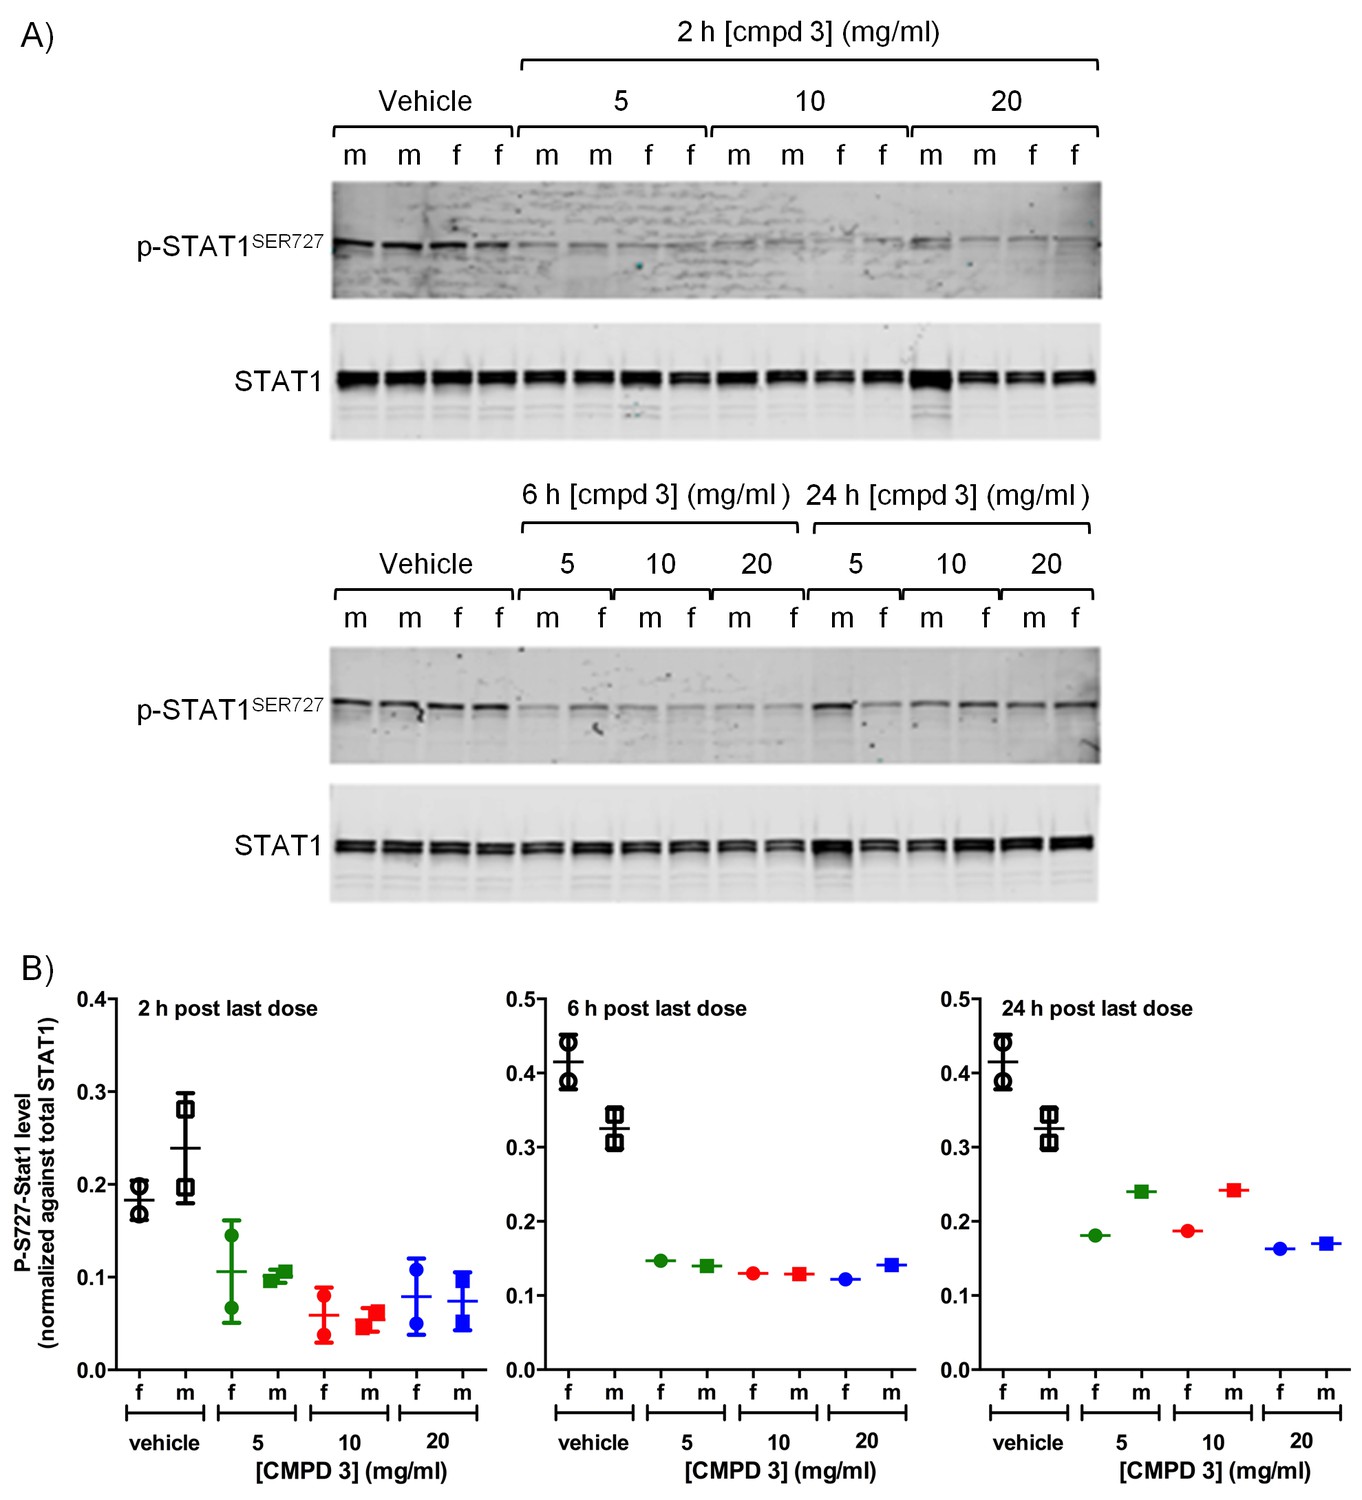
Pharmacodynamic response in Wistar rats treated with CDK8/19 ligand 3.
(A) Immunoblot showing p-STAT1SER727 and STAT1 levels in lysates made from rat spleens harvested 2, 6 or 24 hr after the final dose of 3. (B) Ratio of p-STAT1SER727 to STAT1 in data from A.
Tables
Table 1
CDK8/19 ligands 3 and 4 adversely affect multiple organs in rats and dogs.
Wistar rats (5 male and 5 female per cohort) or Beagle dogs (2 male and 2 female per cohort for 3 and 1 male and 1 female for 4) received a daily oral dose of 3 or 4 for 14 days. In the rat study of 4, all animals were prematurely culled at 60 mg/kg and one male and female at 20 mg/kg, as a result of compound toxicity. In the dog studies, all animals were prematurely culled in the study of 3 and one female following exposure to 4 as a result of toxicity. The most severely affected organs are indicated in bold. The fold efficacious dose was calculated from a plasma PK measurement of compound exposure in satellite animals run in parallel to the tolerability study and compared to exposures at efficacious doses in human tumour xenograft models in mice (m – male and f – female).
| Rat | Dog | |||
|---|---|---|---|---|
| Low dose | Mid dose | High dose | Low dose | |
| CMPD 3 (mg/kg) | 5 | 10 | 20 | 5 |
| Target organs | Bone, bone, marrow, heart, liver, lung, lymph nodes, pancreas, reproductive tract (m), spleen, thymus. | Bone, bone marrow, heart, liver, lung, lymph nodes, pancreas, reproductive tract (m and f), spleen, thymus. | Bone, bone marrow, heart, liver, lung, lymph nodes, pancreas, reproductive tract (m and f), spleen, thymus. | Bone marrow, gastrointestinal mucosa, heart, lymphatic system |
| Fold of efficacious dose; 10 mg/kg | ~0.3 (m) – 1.3 (f) | ~0.5 (m) – 2 (f) | ~1 (m) – 5 (f) | ~0.3 (m) – 0.3 (f) |
| CMPD 4 (mg/kg) | 10 | 20 | 60 | 20 |
| Target organs | Bone, bone marrow, intestines, liver, lung, lymph nodes, mammary gland, pancreas, reproductive tract (m and f), skin, spleen, stomach, thymus. | Bone, bone marrow, heart, intestines, liver, lung, lymph nodes, mammary gland, pancreas, reproductive tract (m and f), skin, spleen, stomach, thymus | Bone, bone marrow, brain, heart, intestines, liver, lung, lymph nodes, mammary gland, pancreas, reproductive tract (m and f), skin, spleen, stomach, thymus | Bone marrow, heart, Intestines, lymphatic system |
| Fold of efficacious dose; 10 mg/kg 30 mg/kg | ~0.9 (m) – 2.4 (f) ~0.3 (m) – 0.8 (f) | ~3.9 (m) – 5.7 (f) ~1.3 (m) – 1.9 (f) | ~10.8 (m) – 23.1 (f) ~3.6 (m) – 7.7 (f) | ~22 (m) – 46 (f) ~7 (m) – 15 (f) |
Download links
A two-part list of links to download the article, or parts of the article, in various formats.
Downloads (link to download the article as PDF)
Open citations (links to open the citations from this article in various online reference manager services)
Cite this article (links to download the citations from this article in formats compatible with various reference manager tools)
Assessing the mechanism and therapeutic potential of modulators of the human Mediator complex-associated protein kinases
eLife 5:e20722.
https://doi.org/10.7554/eLife.20722


