A PALB2-interacting domain in RNF168 couples homologous recombination to DNA break-induced chromatin ubiquitylation
- Leiden University Medical Center, The Netherlands
- CHU de Québec Research Center, HDQ Pavilion, Oncology Axis, McMahon, Canada
- Laval University Cancer Research Center, Canada
Figures
Figure 1 with 1 supplement
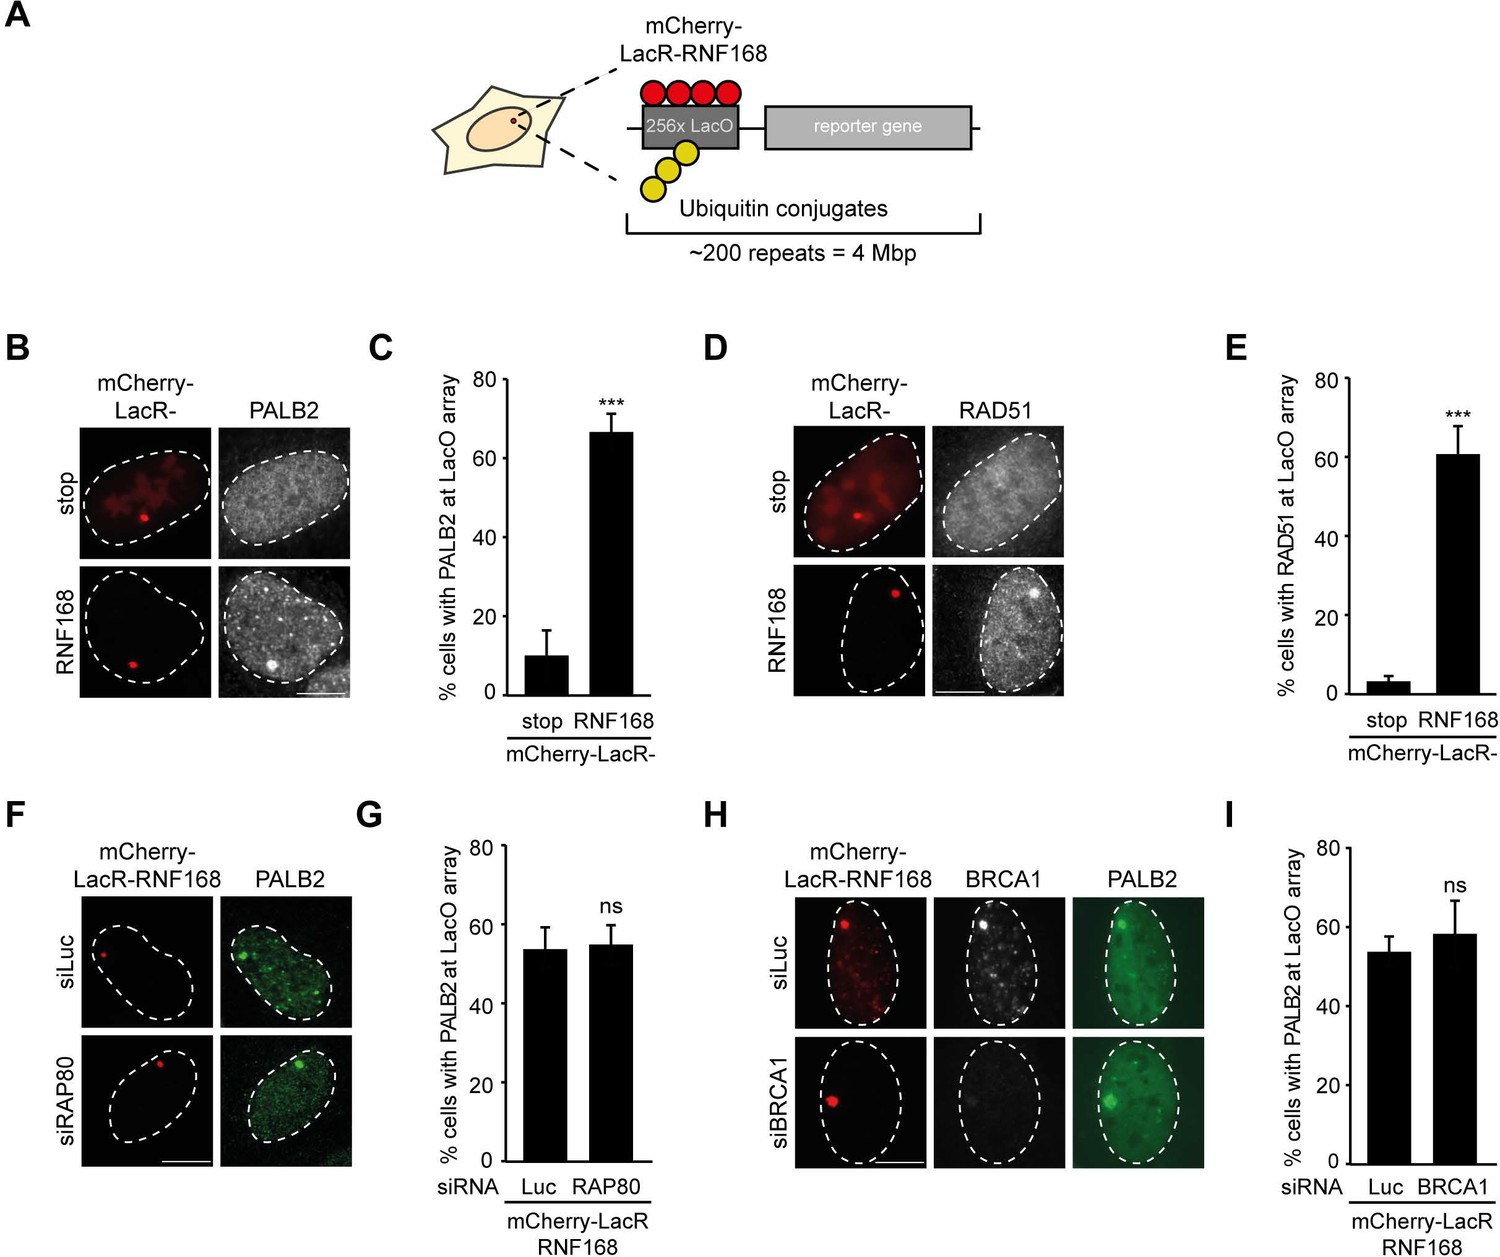
RNF168-dependent recruitment of PALB2 to chromatin.
(A) Schematic of the tethering system. (B) PALB2 (white) accumulation upon tethering of the indicated mCherry-LacR fusion proteins (red) in cells containing a LacO array. (C) Quantification of B. (D) As in B, but stained for RAD51 (white). (E) Quantification of D. Indicated significance in C and E is compared to mCherry-LacR-stop. (F) As in B, but stained for PALB2 (green) in control (siLuc) or RAP80-depleted cells. (G) Quantification of F. (H) As in F, but stained for BRCA1 (white) in YFP-PALB2-expressing control (siLuc) or BRCA1-depleted cells. (I) Quantification of H. Indicated significance in G and I is compared to siLuc. Quantified data represent the mean ± S.E.M. (n = 3). Scale bar = 5 µm.
Figure 1—figure supplement 1
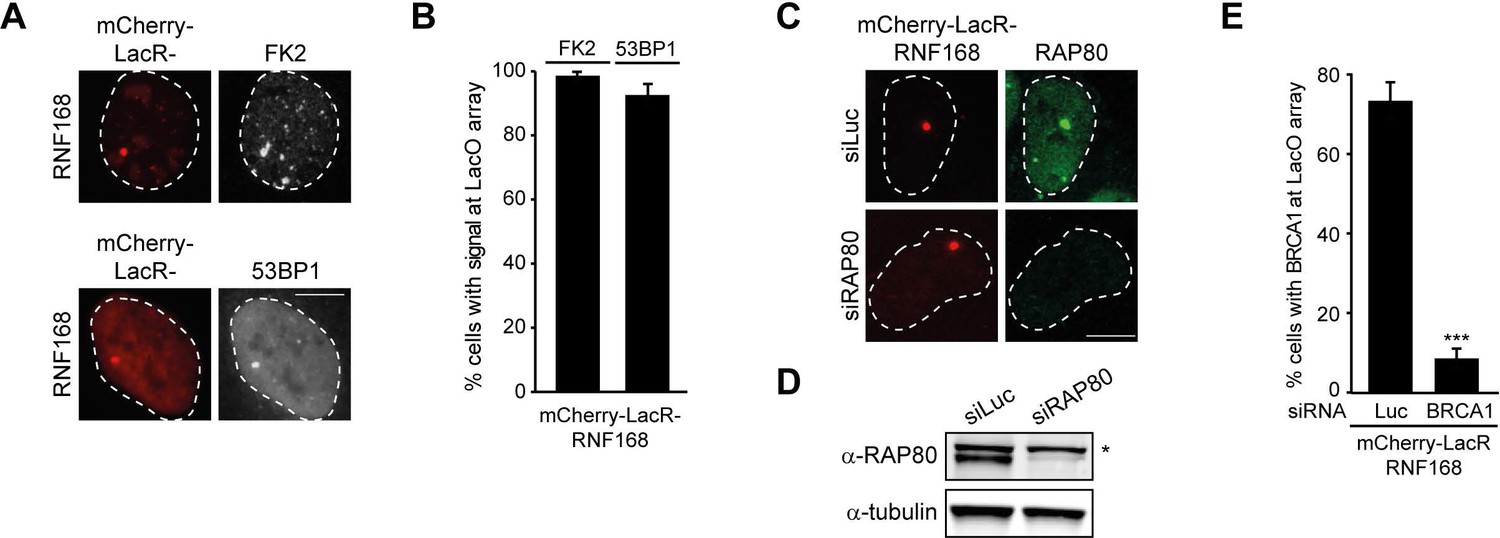
RNF168-dependent recruitment of 53BP1 to chromatin.
(A) Conjugated ubiquitin (FK2; white) and 53BP1 (white) accumulation upon tethering of the indicated mCherry-LacR fusion proteins (red) in cells containing a LacO array. (B) Quantification of A. (C) As in Figure 1F, but stained for RAP80 in control (siLuc) or RAP80-depleted cells. (D) Western blot analysis of RAP80 expression in U2OS cells treated with the indicated siRNA. (E) Quantification of BRCA1 staining in control (siLuc) or BRCA1-depleted cells shown in Figure 1H. Indicated significance in E is compared to siLuc. Quantified data represent the mean ± S.E.M. (n = 3). Scale bar = 5 µm.
Figure 2 with 1 supplement
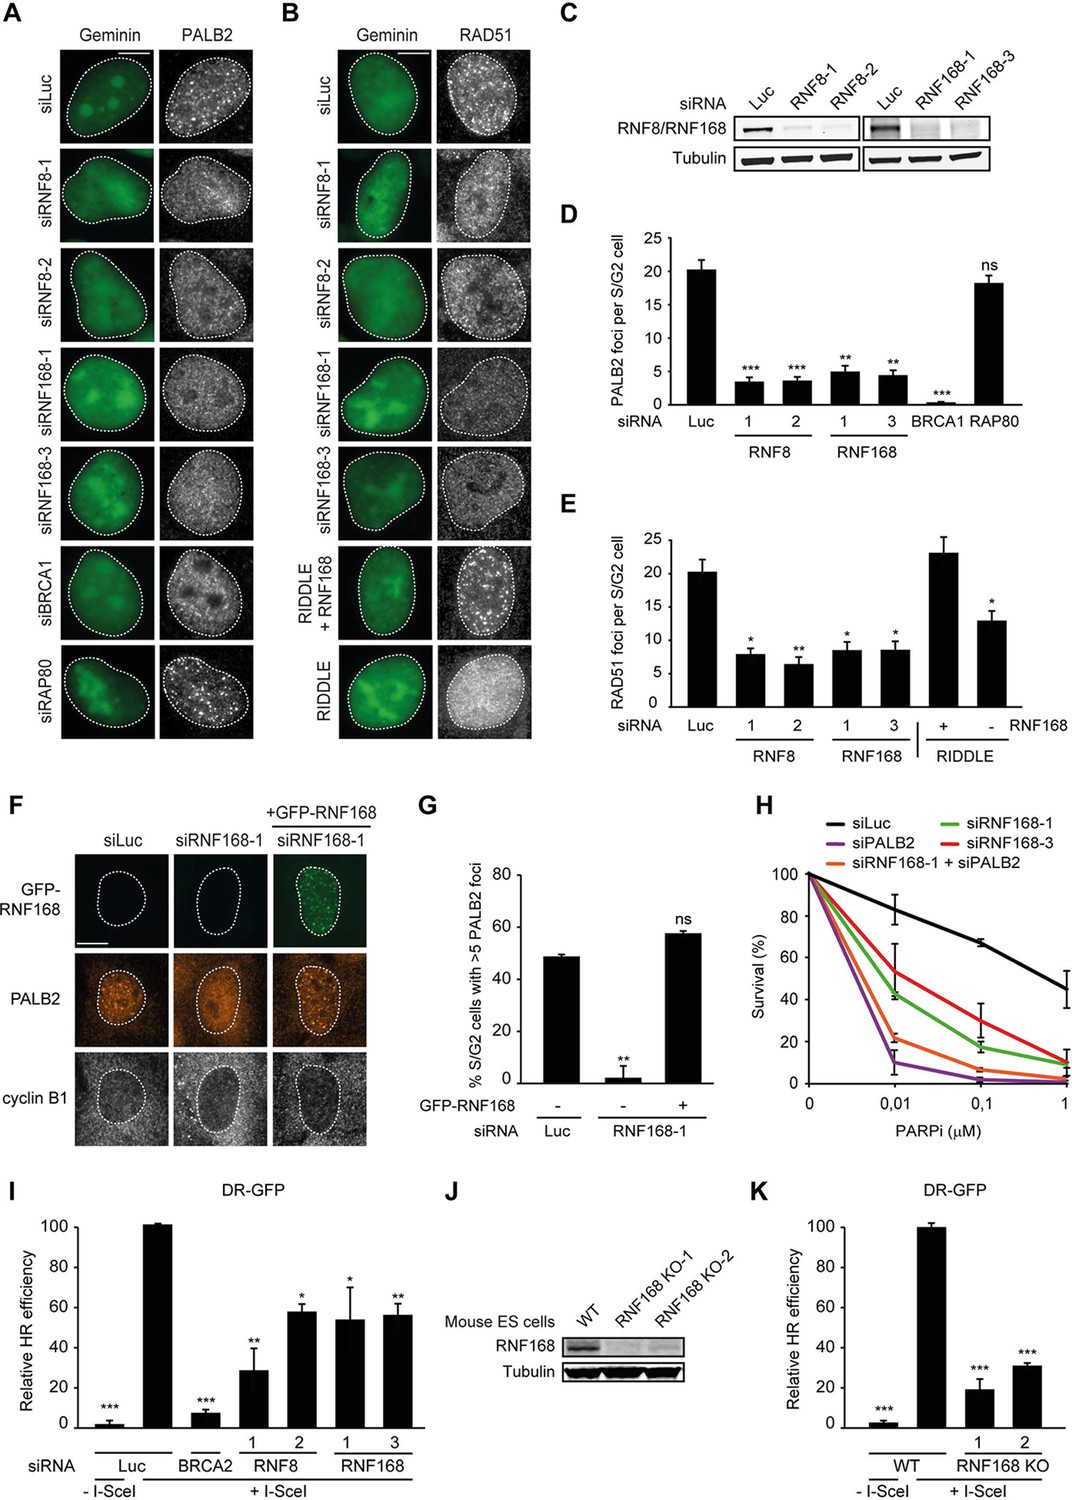
RNF168 promotes PALB2 and RAD51 recruitment and HR.
(A) Effect of the indicated siRNAs on PALB2 (white) IRIF formation at 6 hr after 10 Gy in mAG-geminin-expressing (green) S/G2 U2OS cells. (B) RAD51 (white) IRIF formation at 6 hr after 10 Gy in mAG-geminin-expressing (green) S/G2 U2OS cells transfected with the indicated siRNAs and in RNF168-deficient RIDDLE S/G2 cells complemented with either an empty vector or wild-type RNF168 expression vector. (C) Western blot analysis of RNF8 and RNF168 expression in U2OS cells treated with the indicated siRNAs. (D) Quantification of A. (E) Quantification of B. Indicated significance in D and E is compared to siLuc. (F) PALB2 IRIF formation (orange) in cyclin B1-positive S/G2 U2OS cells (white) transfected with the indicated siRNAs and siRNA-resistant GFP-tagged RNF168 cDNA (green). (G) Quantification of F. Indicated significance is compared to siLuc. (H) Effect of the indicated siRNAs on the survival of U2OS cells following treatment with PARP inhibitor (PARPi) KU-0058948. (I) Effect of the indicated siRNAs on HR efficiency measured using the DR-GFP reporter in human HEK293T cells. Indicated significance is compared to siLuc + I-SceI. (J) Western blot analysis of RNF168 expression in RNF168 mouse ES knock-out clones. (K) Effect of RNF168 knock-out on HR in two individual mouse ES clones with an integrated DR-GFP reporter. Indicated significance is compared to WT + I-SceI. Quantified data are represented as mean ± S.E.M. (n = 3), except in D where n = 2. Scale bar = 5 µm.
Figure 2—figure supplement 1
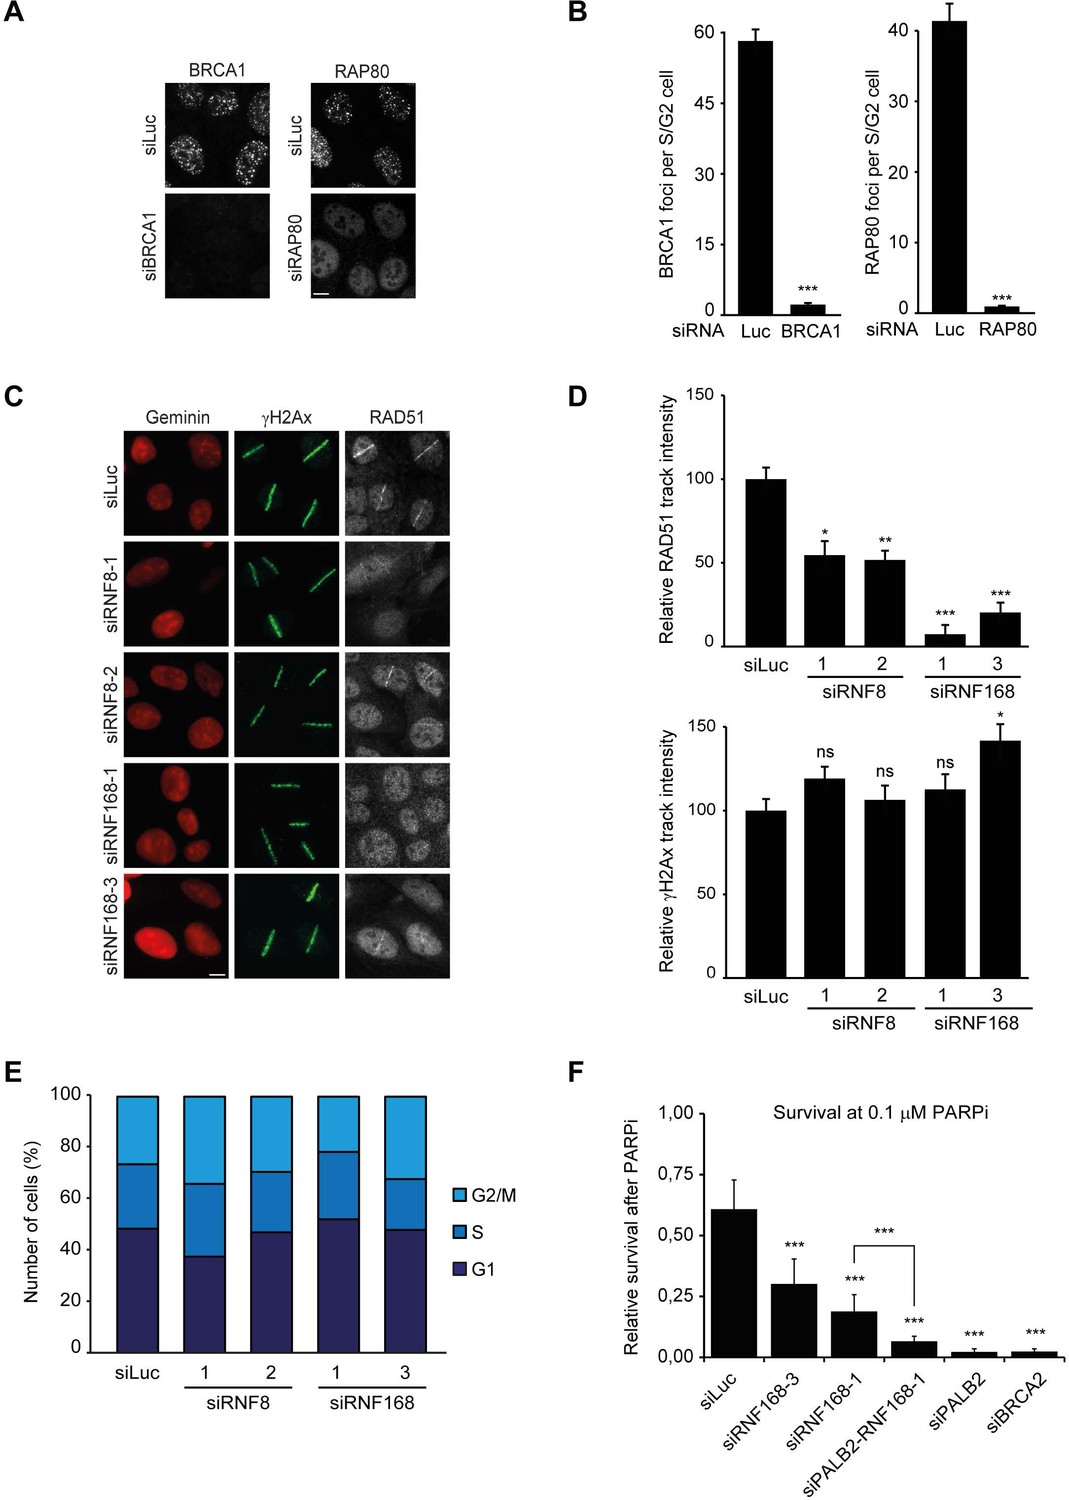
RNF168 promotes RAD51 recruitment and is epistatic with PALB2 in HR.
(A) BRCA1 or RAP80 accumulation in control (siLuc) cells or in cells depleted for either BRCA1 or RAP80 to validate the knock-down of these genes in Figure 2D. (B) Quantification of A. (C) RAD51 recruitment (white) in γH2AX-positive laser tracks (green) in mCherry-geminin-positive S/G2 cells (red). (D) Quantification of C. (E) Cell cycle profile of HEK293T cells containing DR-GFP transfected with the indicated siRNAs as shown in Figure 2I. (F) Effect of the indicated siRNAs on the survival of U2OS cells following treatment with 0.1 µM PARP inhibitor (PARPi) KU-0058948. Indicated significance in B, D, and F is compared to siLuc. The significance between siRNF168–1 and siPALB2/siRNF168–1 is also indicated in F. Quantified data represent the mean ± S.E.M. (n = 3). Scale bar = 5 µm.
Figure 3 with 1 supplement

RNF168 does not affect recruitment of BRCA1 to HR sites in S/G2 cells.
(A) BRCA1 (green) and 53BP1 (white) IRIF formation in mCherry-geminin-expressing (red) S/G2 U2OS cells transfected with siLuc. (B) As in A, except that cells were transfected with siRNF168. (C) Quantification of A. (D) Quantification of B. Indicated significance in C and D is compared to non-irradiated cells transfected with the same siRNA. (E) IRIF formation of the indicated proteins. (F) Quantified IRIF size (in µm2) of various signaling (black) and HR (red) proteins. (G) Quantified IRIF size (in µm2) of BRCA1 in U2OS cells transfected with siLuc or siRNF168. Indicated significance is compared to siLuc. Quantified data are represented as mean ± S.E.M. (n = 3). Scale bar = 5 µm.
Figure 3—figure supplement 1
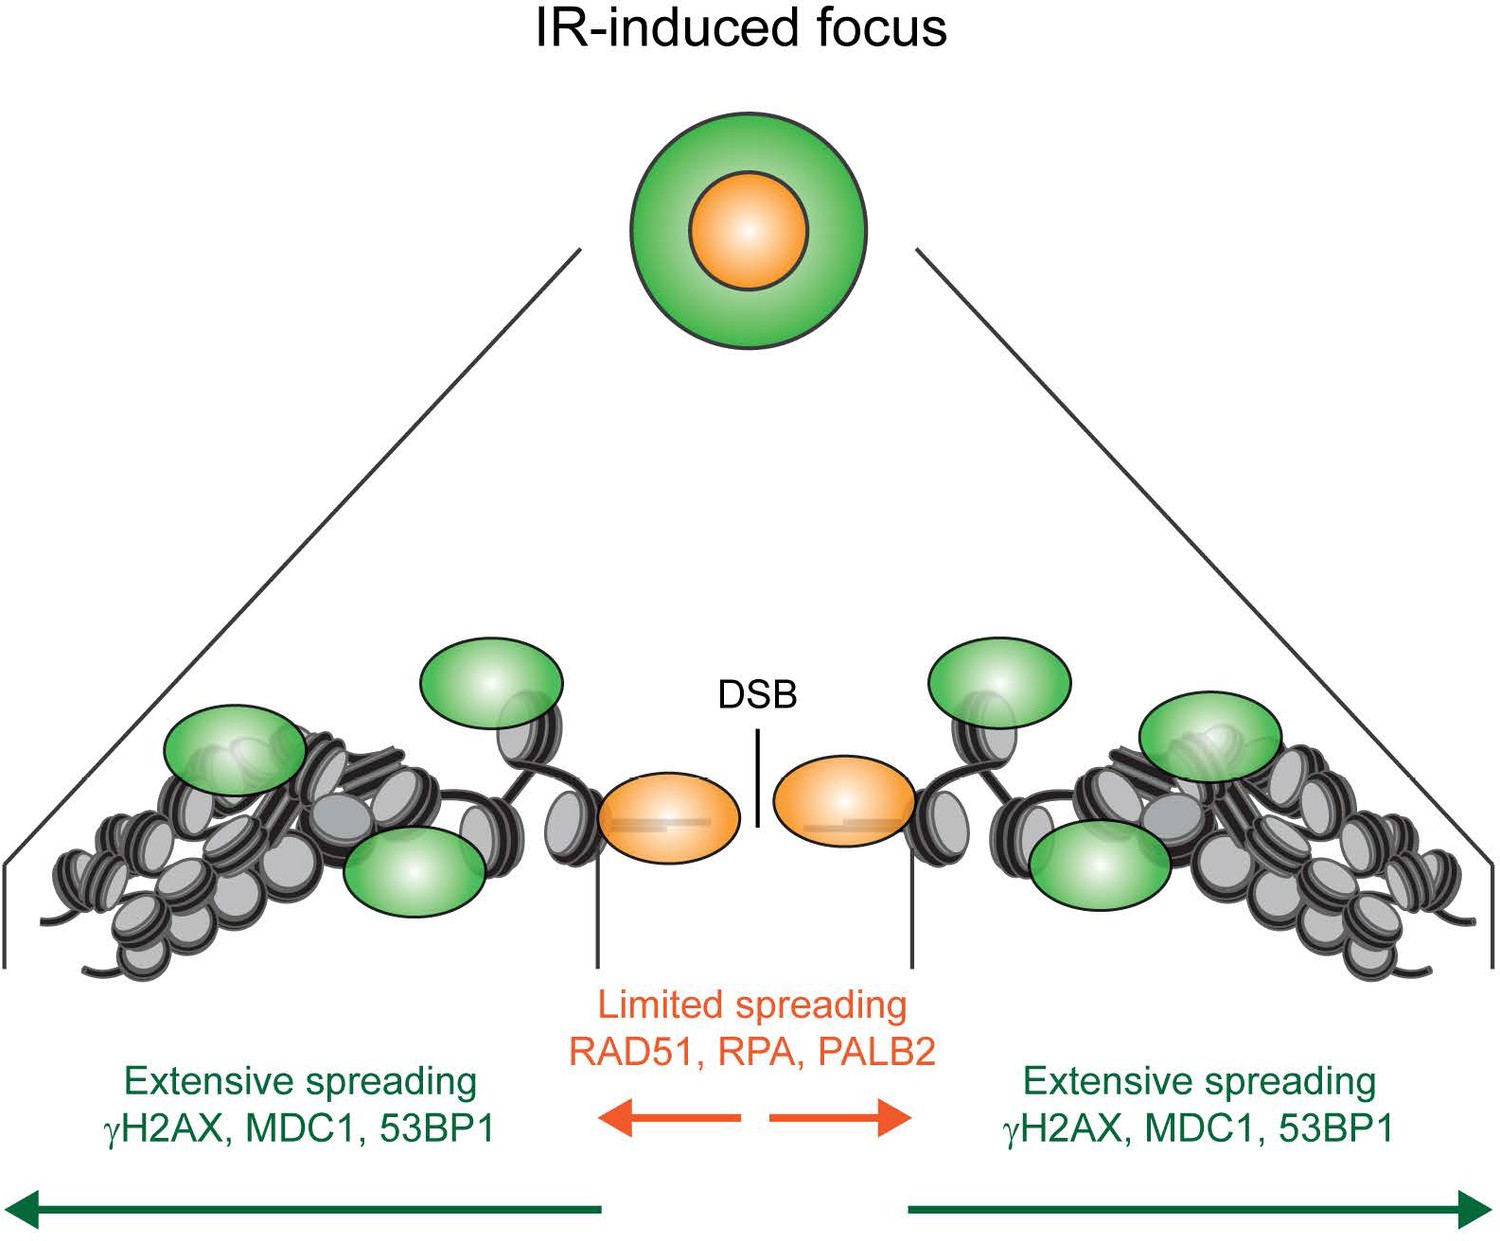
Model for the spreading of proteins from DSBs.
Schematic representation of the spreading of HR (orange) and signaling (green) proteins from a DSB, resulting in different foci sizes after IR as measured in Figure 3.
Figure 4 with 1 supplement
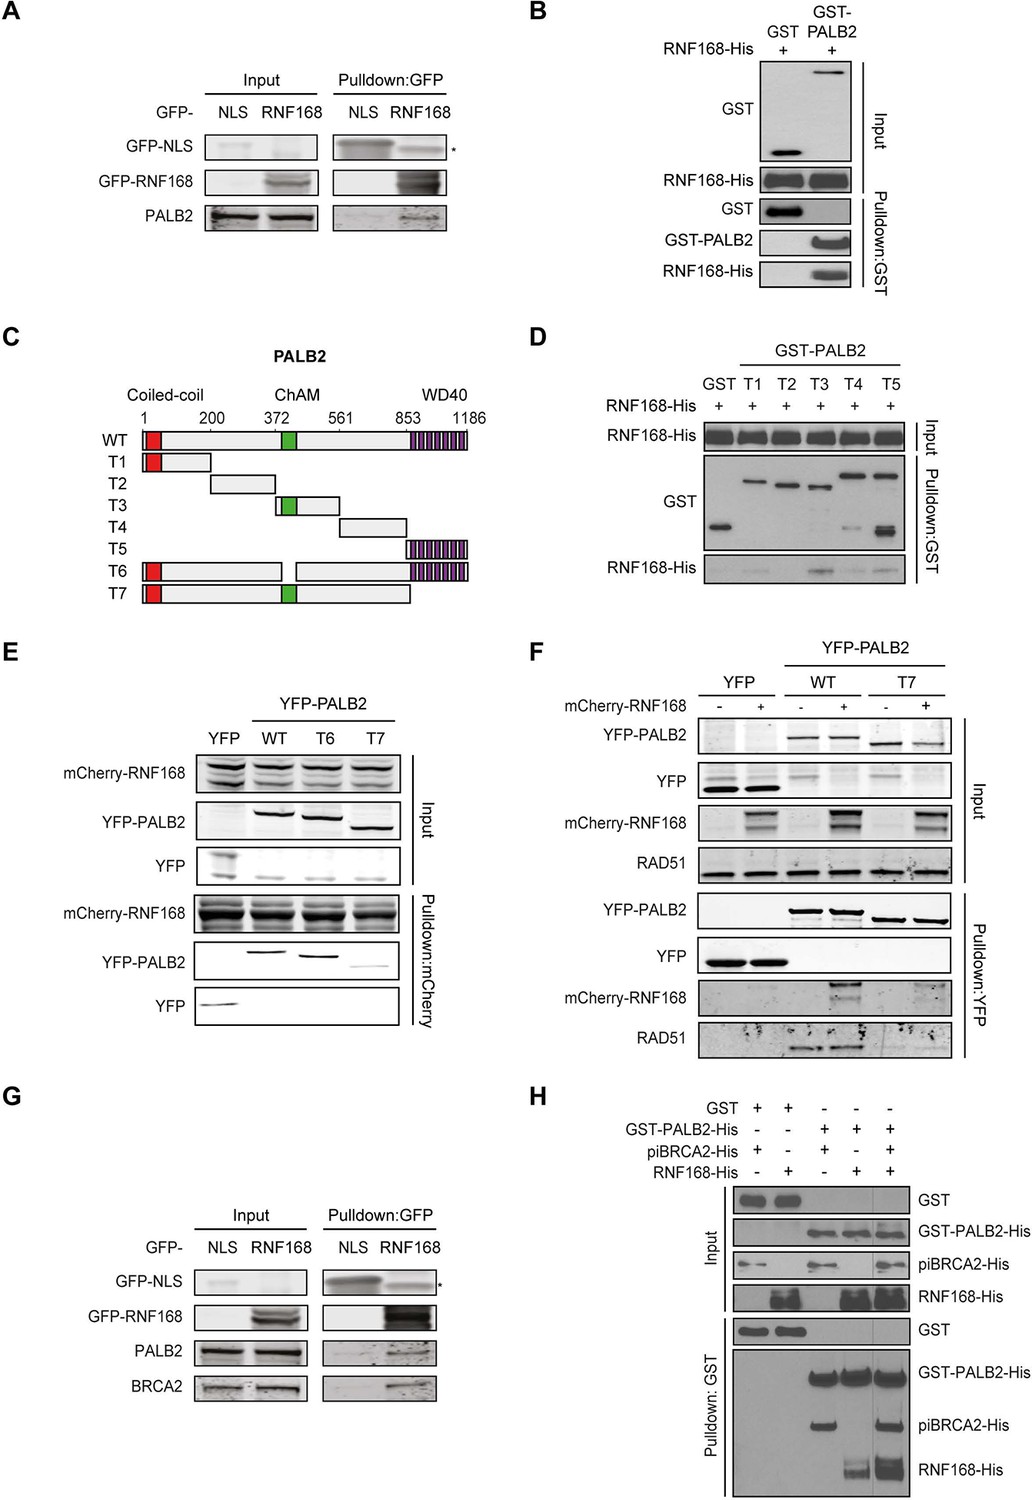
PALB2 directly interacts with RNF168 via its WD40 domain.
(A) Pulldowns of the indicated GFP fusion proteins in U2OS cells. Blots were probed for PALB2 and GFP. (B) In vitro GST pulldown of GST-PALB2 or GST alone in the presence of His-RNF168. Blots were probed for GST and His. (C) Schematic representation of full-length PALB2 (WT), five non-overlapping fragments (T1–T5) spanning PALB2, and two deletion mutants lacking the ChAM (T6) or WD40 domain (T7). (D) As in B, but using the indicated GST-tagged PALB2 fragments. (E) mCherry-RNF168 pulldowns from U2OS cells expressing the indicated YFP- tagged fusion proteins. Blots were probed for mCherry and YFP. (F) Pulldowns of the indicated YFP fusion proteins in U2OS cells either with or without expression of mCherry-RNF168. Blots were probed for GFP, mCherry and RAD51. (G) Pulldowns of the indicated GFP fusion proteins in U2OS cells. Blots were probed for PALB2, BRCA2 and GFP. (H) In vitro GST pulldown of GST-PALB2 or GST alone in the presence of His-RNF168 and/or His-piBRCA2. Blots were probed for GST and His.
Figure 4—figure supplement 1
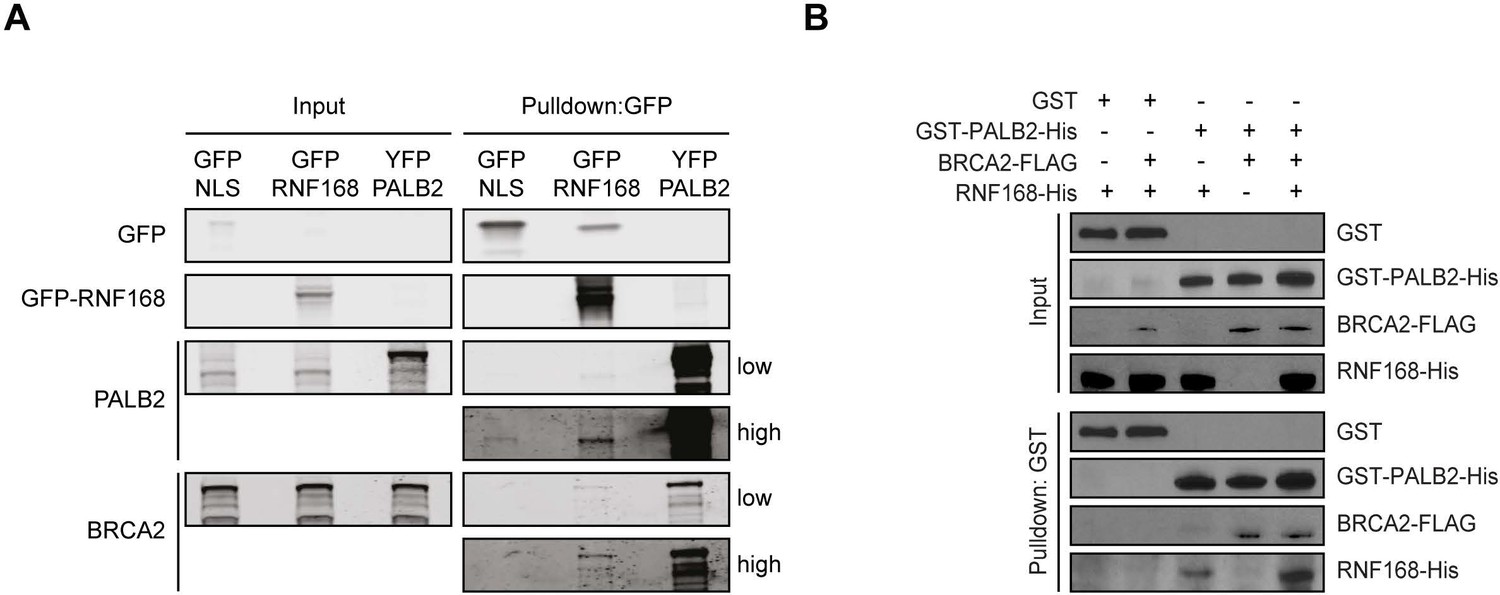
RNF168 and BRCA2 interact with PALB2 in a non-mutually exclusive manner.
(A) Pulldowns of the indicated GFP and YFP fusion proteins in U2OS cells. Blots were probed for PALB2, BRCA2 and GFP. (B) In vitro GST pulldown of GST-PALB2 or GST alone in the presence of RNF168-His and/or BRCA2-FLAG. Blots were probed for GST, His and FLAG.
Figure 5

RNF168-dependent recruitment of PALB2 requires its WD40 domain.
(A) Schematic representation of full-length PALB2 (WT) and the WD40 deletion mutant (T7). (B) Schematic of the tethering system. (C) Recruitment of the indicated YFP-PALB2 variants (green) upon tethering of mCherry-LacR-RNF168 (red) to a genomic LacO array in U2OS 2-6-3 cells. (D) Quantification of C. (E) Recruitment of the indicated YFP fusion proteins (green) to mCherry-NBS1-marked DNA damage sites (red) after multiphoton micro-irradiation in U2OS cells. (F) Quantification of E. (G) Schematic of the system used to locally induce DSBs by tethering LacR-tagged FokI endonuclease to a LacO array. (H) Recruitment of the indicated YFP fusion proteins (green) to BRCA1-marked (white) DSBs induced by FokI-mCherry-LacR at a LacO array (red) in U2OS 2-6-5 cells. (I) Quantification of H. (J) IRIF formation of the indicated YFP fusion proteins (green) in complemented PALB2-deficient cells (EUFA1341). S/G2 cells are marked by cyclin A (white) and BRCA1 (red) is used as a DNA damage marker. (K) Quantification of J. Indicated significance in D, F, I and K is compared to WT. Quantified data are represented as mean ± S.E.M. (n = 3), except in D and F where n = 2. Scale bar = 5 µm.
Figure 6 with 1 supplement
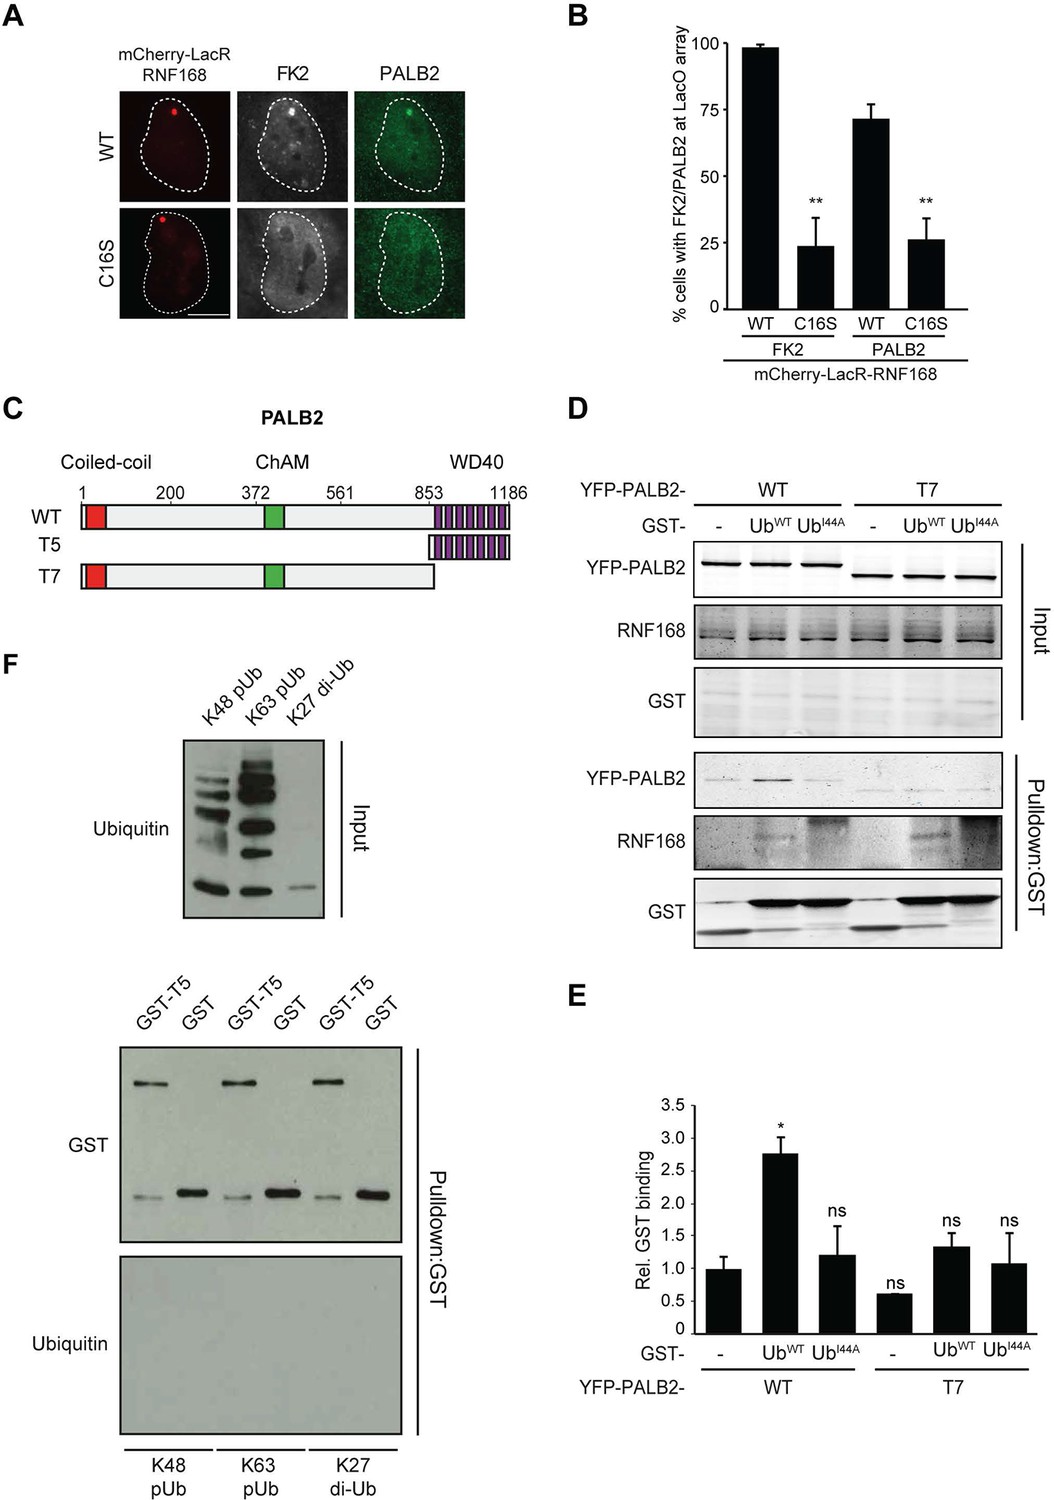
RNF168-mediated PALB2 recruitment is ubiquitylation dependent.
(A) Recruitment of ubiquitin conjugates (FK2; white) and endogenous PALB2 (green) upon tethering of the indicated mCherry-LacR-RNF168 variants (red) to a genomic LacO array in U2OS 2-6-3 cells. (B) Quantification of A. Indicated significance is compared to WT for each staining. (C) Schematic representation of full-length PALB2 (WT), a fragment spanning the WD40 (T5) and the WD40 deletion mutant (T7). (D) Pulldowns of GST alone or GST-ubiquitin (WT or I44A) from U2OS cell extracts containing the indicated YFP-PALB2 fusion proteins. Blots were probed for PALB2, RNF168 and GST. (E) Quantification of D in which the PALB2/GST ratios of each pulldown were normalized to YFP-PALB2WT/GST alone. Indicated significance is compared to YFP-PALB2WT/GST. Quantified data are represented as mean ± S.E.M. (n = 3). (F) Pulldown of GST only or GST-T5 in the presence of polyubiquitin (pUb) chains of K48 or K63 linkage, or di-ubiquitin (di-Ub) chains of K27 linkage. Blots were probed with GST and ubiquitin.
Figure 6—figure supplement 1
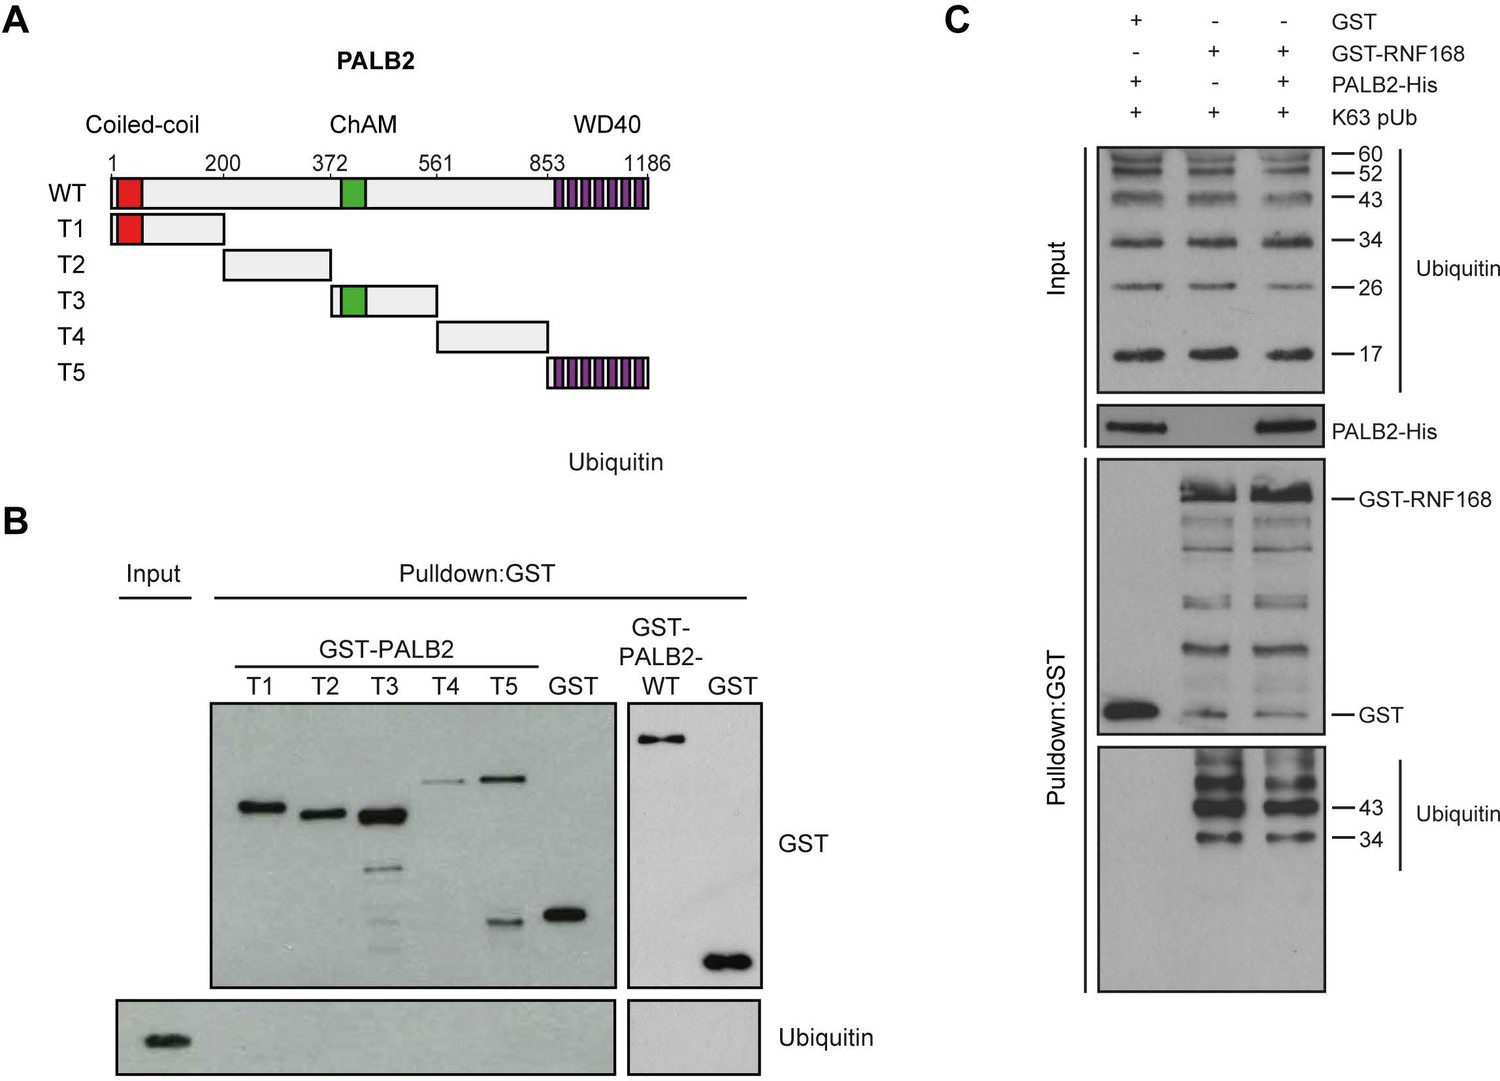
PALB2 neither associates with ubiquitin, nor stimulates the association of RNF168 with ubiquitin in vitro.
(A) Schematic representation of full-length PALB2 (WT) and five non-overlapping fragments (T1–T5) spanning PALB2. (B) Pulldowns of GST alone or the indicated GST fusion proteins in the presence of recombinant ubiquitin. Blots were probed for GST and ubiquitin. (C) GST pulldowns to assess the binding of GST alone or. GST-RNF168 to K63 polyubiquitin chains in the presence or absence of His-PALB2. Blots were probed for GST, ubiquitin and His. Related to Figure 6F.
Figure 7 with 3 supplements
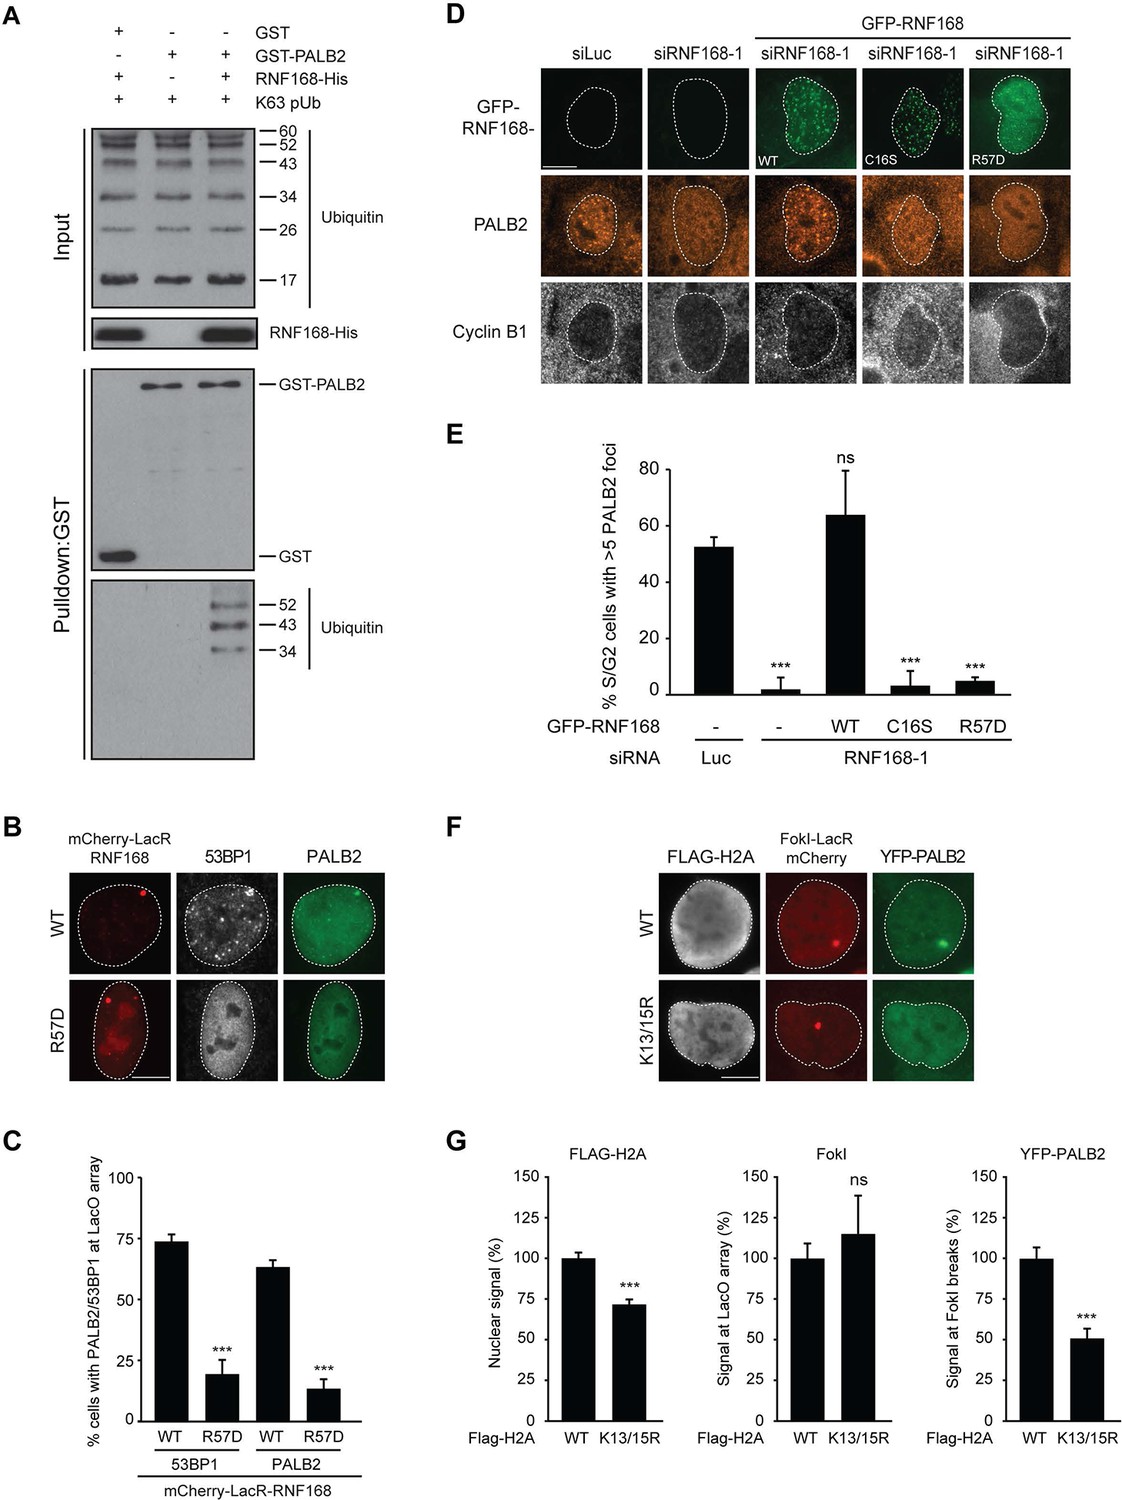
PALB2 associates with K63-polyubiquitin chains via RNF168.
(A) GST pulldowns to assess the binding of GST-PALB2 or GST-alone to K63 polyubiquitin (pUb) chains in the presence or absence of His-RNF168. Blots were probed for GST, ubiquitin and His. (B) Recruitment of 53BP1 (white) and YFP-PALB2 (green) upon tethering of the indicated mCherry-LacR-RNF168 variants (red) to a genomic LacO array in U2OS 2-6-3 cells. Indicated significance is compared to WT for each staining. (C) Quantification of B. (D) PALB2 IRIF formation (orange) in cyclin B1-positive U2OS cells (white) transfected with the indicated siRNAs and siRNA-resistant GFP-tagged RNF168 cDNAs (green). (E) Quantification of D. Indicated significance is compared to siLuc. (F) Recruitment of YFP-PALB2 (green) to DSBs induced by FokI-mCherry-LacR at a LacO array (red) in U2OS 2–6-5 cells expressing the indicated FLAG-H2A constructs (white). (G) Quantification of F. Indicated significance is compared to WT for each staining. Quantified data are represented as mean ± S.E.M. (n = 3), except in E where n = 4. Scale bar = 5 µm.
Figure 7—figure supplement 1
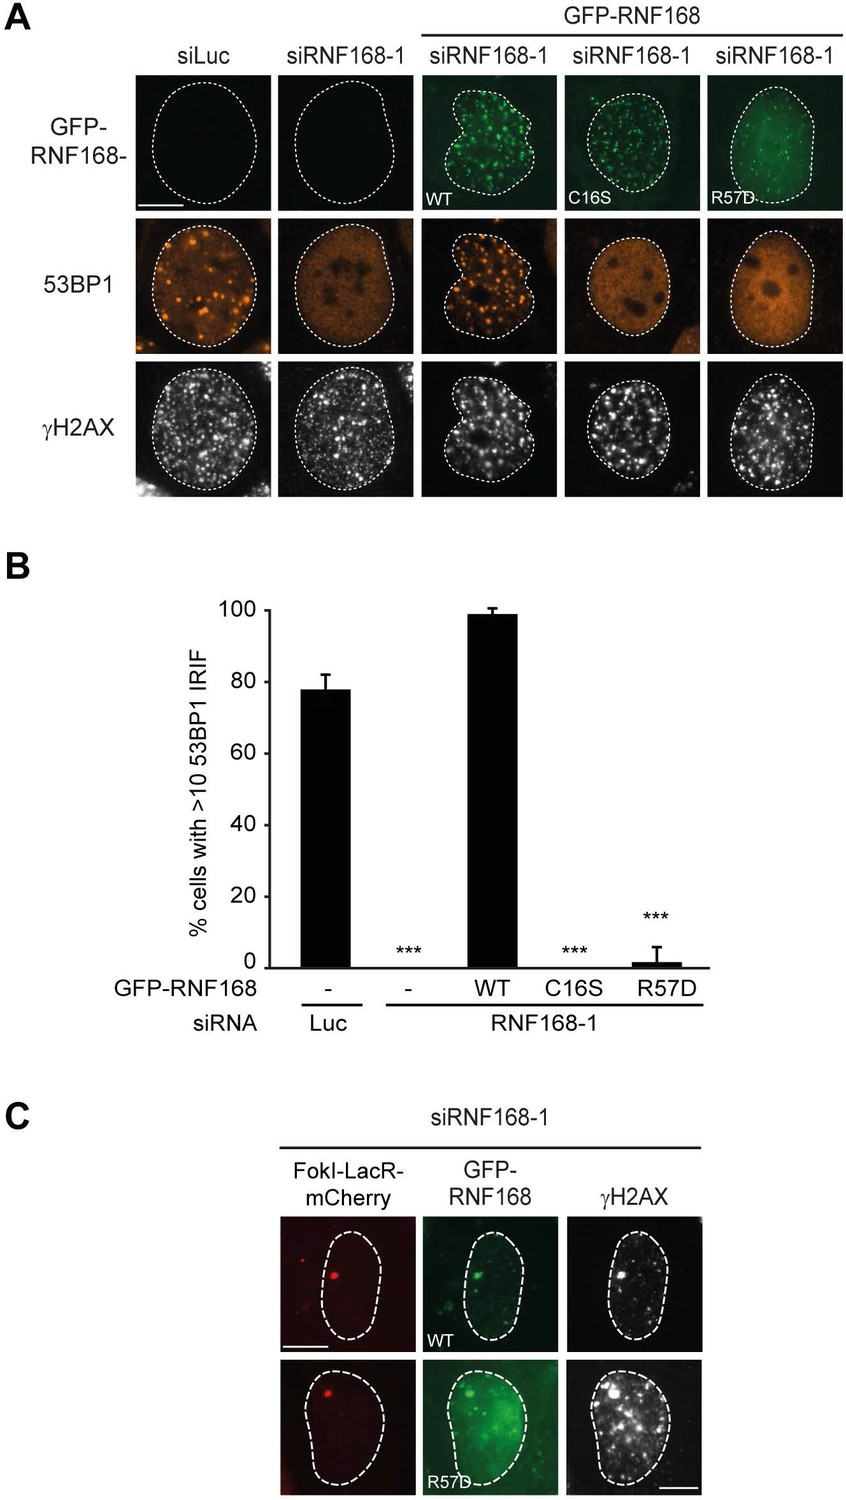
RNF168 RING mutants do not support IR-induced 53BP1 focus formation.
(A) 53BP1 IRIF formation (orange) at 1 hr after 2 Gy in γH2AX-positive cells (white) transfected with the indicated siRNAs and siRNA-resistant GFP-tagged RN168 cDNAs (green) to validate the mutants used in Figure 7D,E. (B) Quantification of A. Indicated significance is compared to siLuc. Quantified data are represented as mean ± S.E.M. (n = 3). Scale bar = 5 µm. (C) Recruitment of the indicated siRNA-resistant GFP-tagged RNF168 cDNAs (green) in RNF168-depleted cells to γH2AX-positive DSBs (white) induced by FokI-mCherry-LacR at a LacO array (red) to validate the R57D mutant used in Figure 7D,E.
Figure 7—figure supplement 2
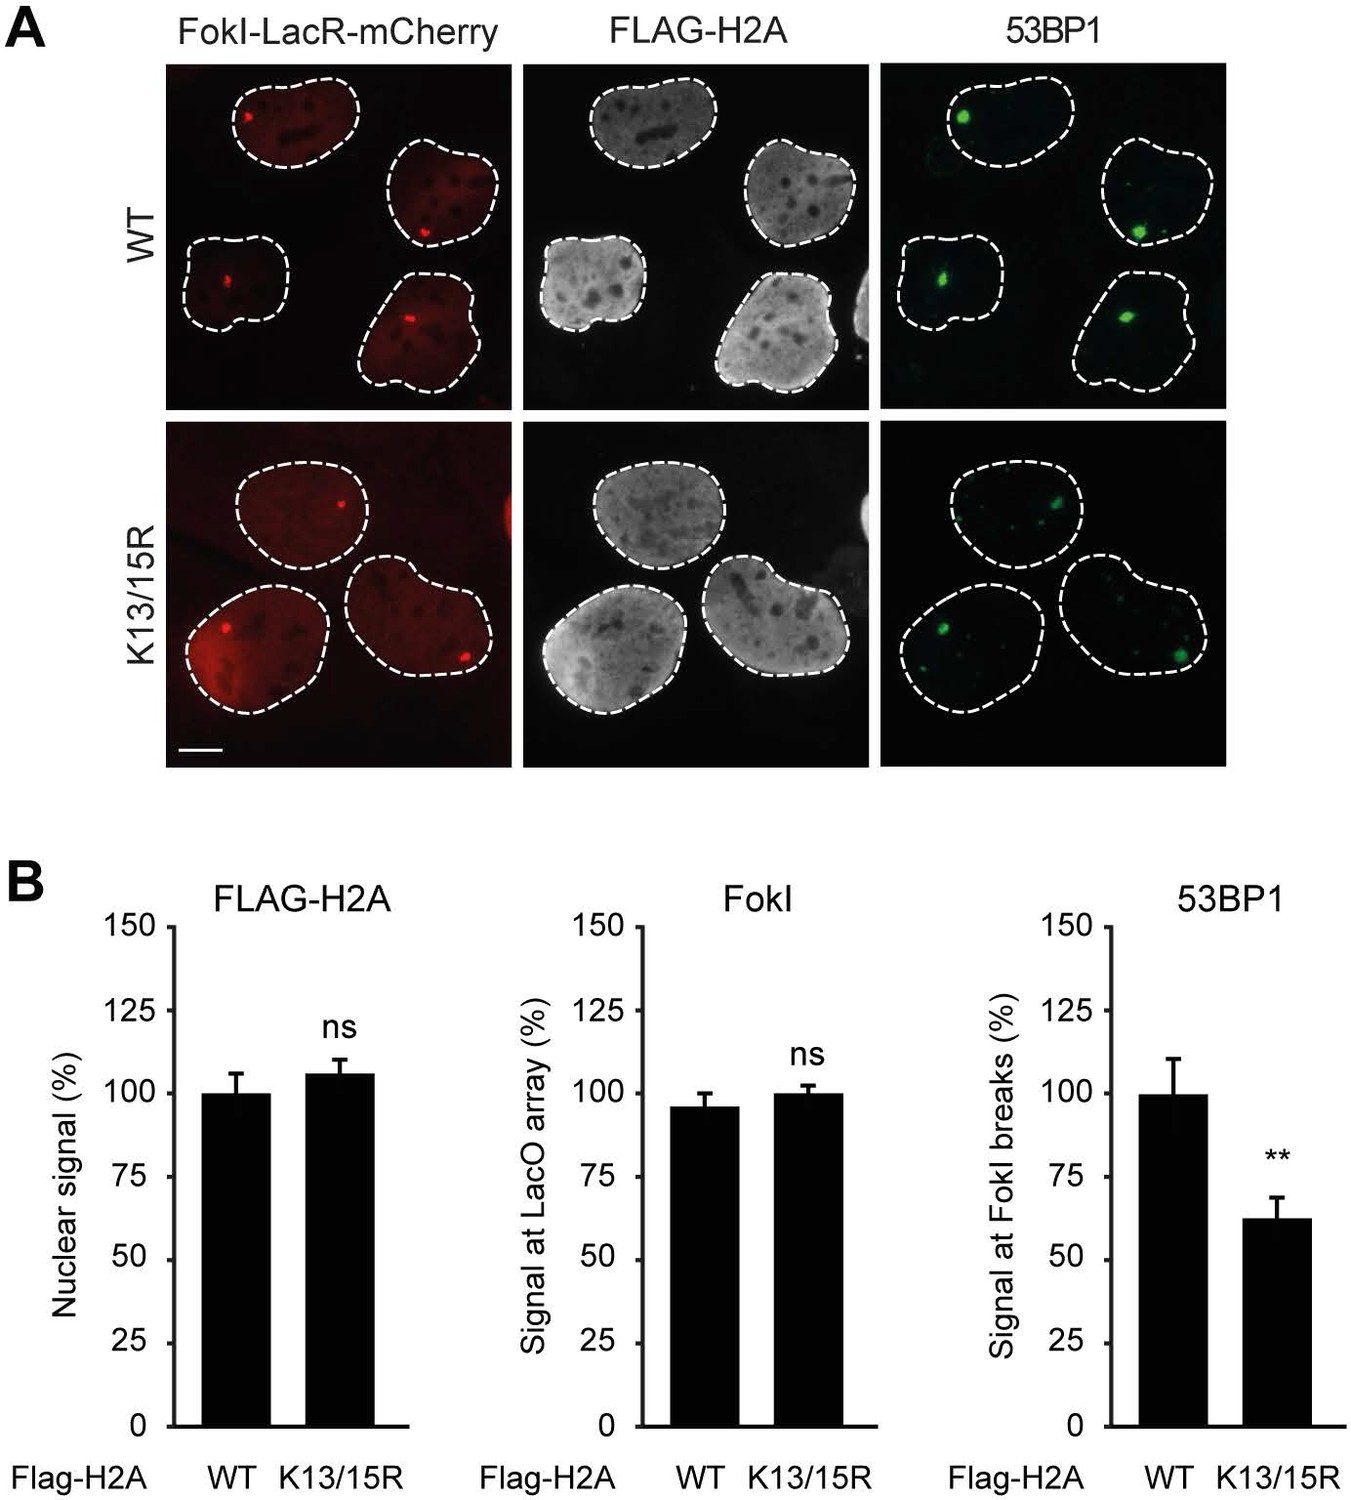
Expression of H2A lacking K13 and K15 decreases 53BP1 recruitment to FokI-induced DSBs.
(A) Recruitment of 53BP1 (green) to DSBs induced by FokI-mCherry-LacR at a LacO array (red) in U2OS 2-6-5 cells expressing the indicated FLAG-H2A constructs (white) to validate the experimental system used in Figure 7F,G. (B) Quantification of A. Indicated significance is compared to WT for each staining. Quantified data represent the mean ± S.E.M. (n = 3). Scale bar = 5 µm.
Figure 7—figure supplement 3
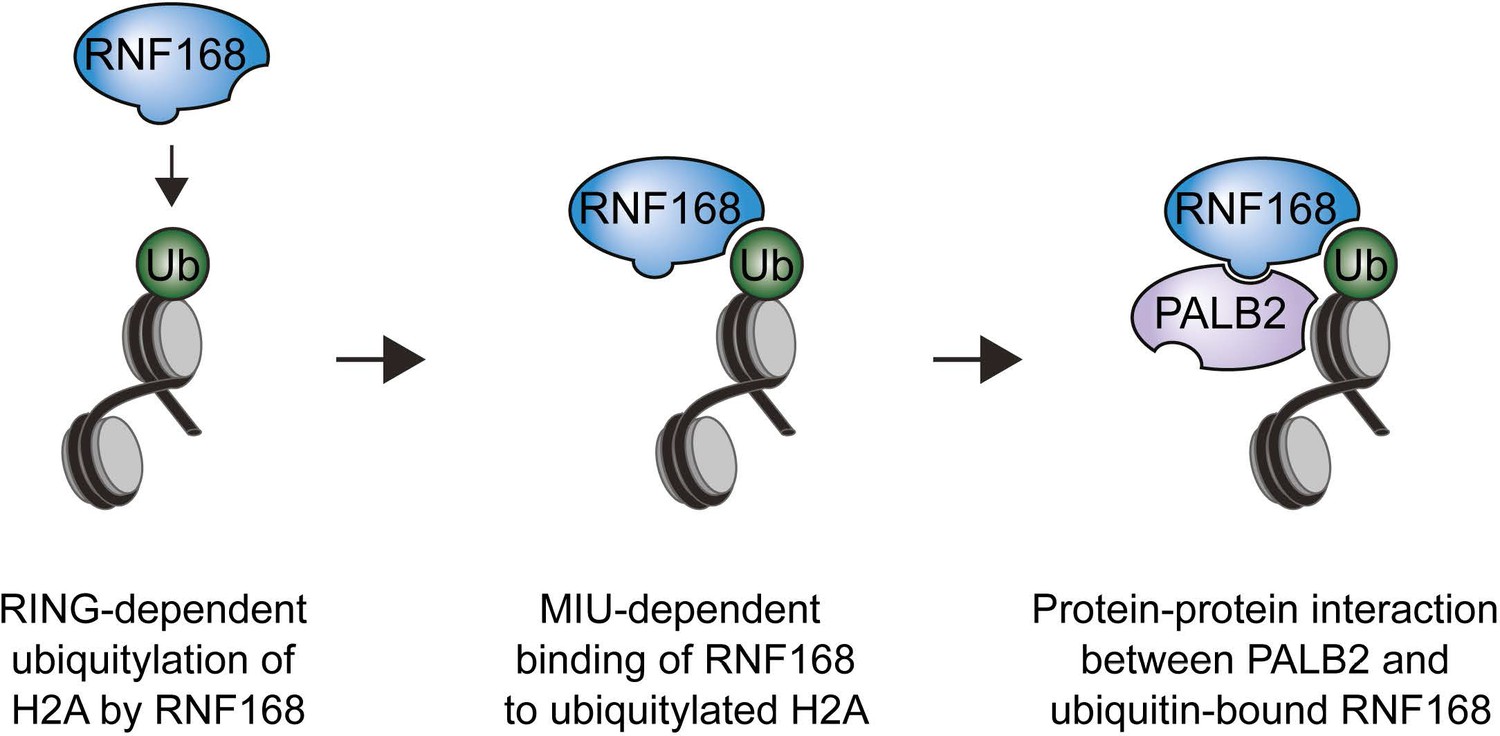
Model for RNF168’s role in PALB2 recruitment.
Schematic representation of the RING-dependent ubiquitylation of H2A by RNF168, which is followed by the MIU-dependent binding of RNF168 to ubiquitylated H2A. The direct protein-protein interaction between PALB2 and ubiquitin-bound RNF168 recruits the former to DSBs.
Figure 8 with 3 supplements

Recruitment of PALB2 requires its interaction with RNF168’s PID.
(A) Schematic representation of full-length RNF168 (WT) and five deletion mutants (T1–T5). (B, C) Pulldowns of the indicated GFP fusion proteins in U2OS cells. Blots were probed for PALB2 and GFP. (D) Quantification of B and C. Indicated significance is compared to WT. (E) PALB2 IRIF formation (white) in mCherry-geminin-positive U2OS cells (red) transfected with the indicated siRNAs and siRNA-resistant GFP-tagged RNF168 cDNAs (green). (F) Quantification of E. Indicated significance is compared to siLuc. (G) Schematic overview of the PARPi survival experiment using independent HeLa Flp-In/TRex clones with inducible expression of GFP-tagged RNF168 proteins. (H) Expression levels of endogenous RNF168 and ectopic GFP-RNF168WT or GFP-RNF168Δ525-571 (T5) at day 4 of the experiment outlined in G. Tubulin serves as a loading control. The star indicates a non-specific band. (I) Effect of ectopic expression of the indicated GFP-tagged proteins on the survival of stable HeLa cells after transfection with the indicated siRNAs and treatment with 1 µM PARP inhibitor (PARPi) KU-0058948 according to the experimental set-up outlined in G. Two independent HeLa clones expressing RNF168WT (clone 2 and 3) or RNF168Δ525-571(T5) (clone 6 and 12) were used. Hela GFP-NLS clone 22 was included as a control. Quantified data are represented as mean ± S.E.M. (n = 2), except in F where n = 5. Scale bar = 5 µm. (J) Model for the trimodular recruitment of PALB2 to HR sites.
Figure 8—figure supplement 1
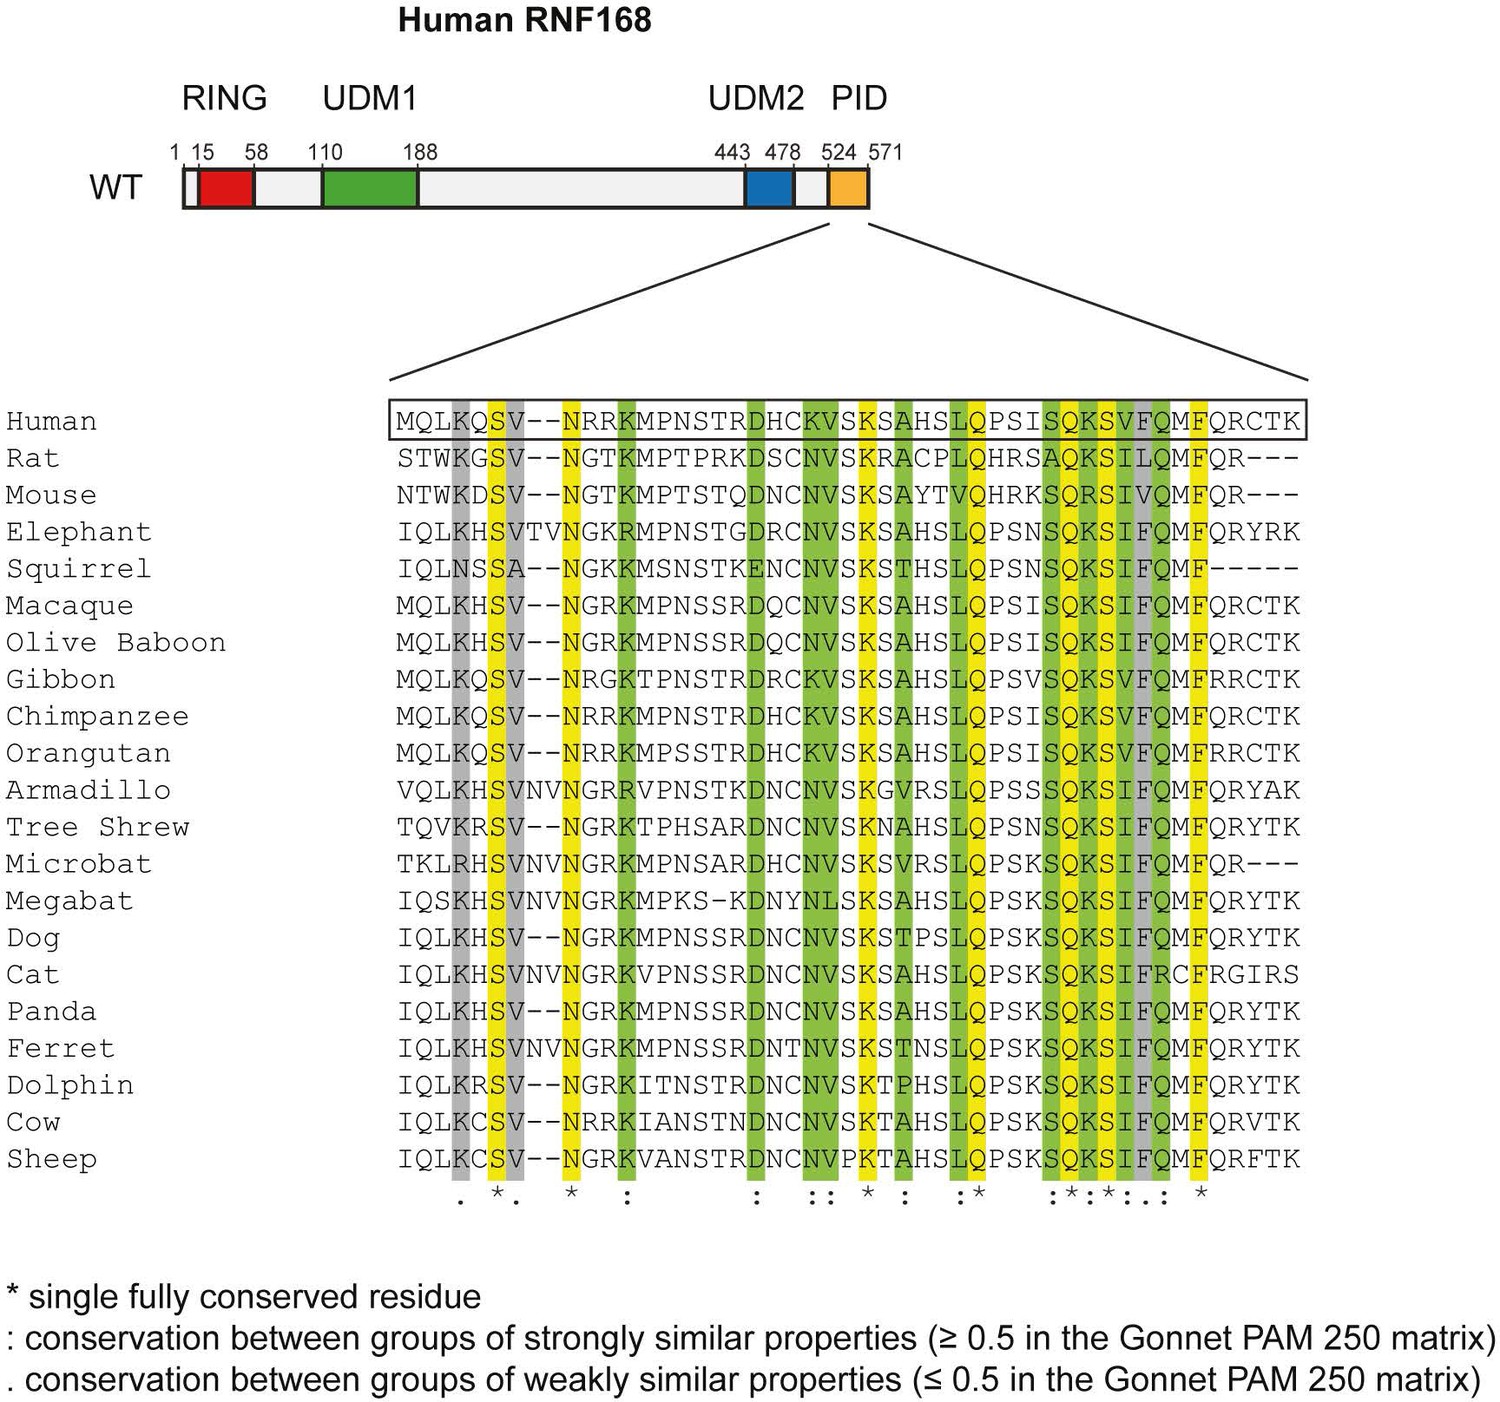
Conservation of the RNF168 PID in mammals.
Alignment of the PID (amino acids 524–571) from human RNF168 with the C-terminus of RNF168 orthologues from other placental mammals generated using Clustal Omega software (http://www.ebi.ac.uk/Tools/msa/clustalo/). An * (asterisk; shown in yellow) indicates positions which have a single, fully conserved residue. A: (colon; shown in green) indicates conservation between groups of strongly similar properties roughly equivalent to scoring ≥0.5 in the Gonnet PAM 250 matrix: A. (period; shown in grey) indicates conservation between groups of weakly similar properties roughly equivalent to scoring ≤0.5 and >0 in the Gonnet PAM 250 matrix.
Figure 8—figure supplement 2
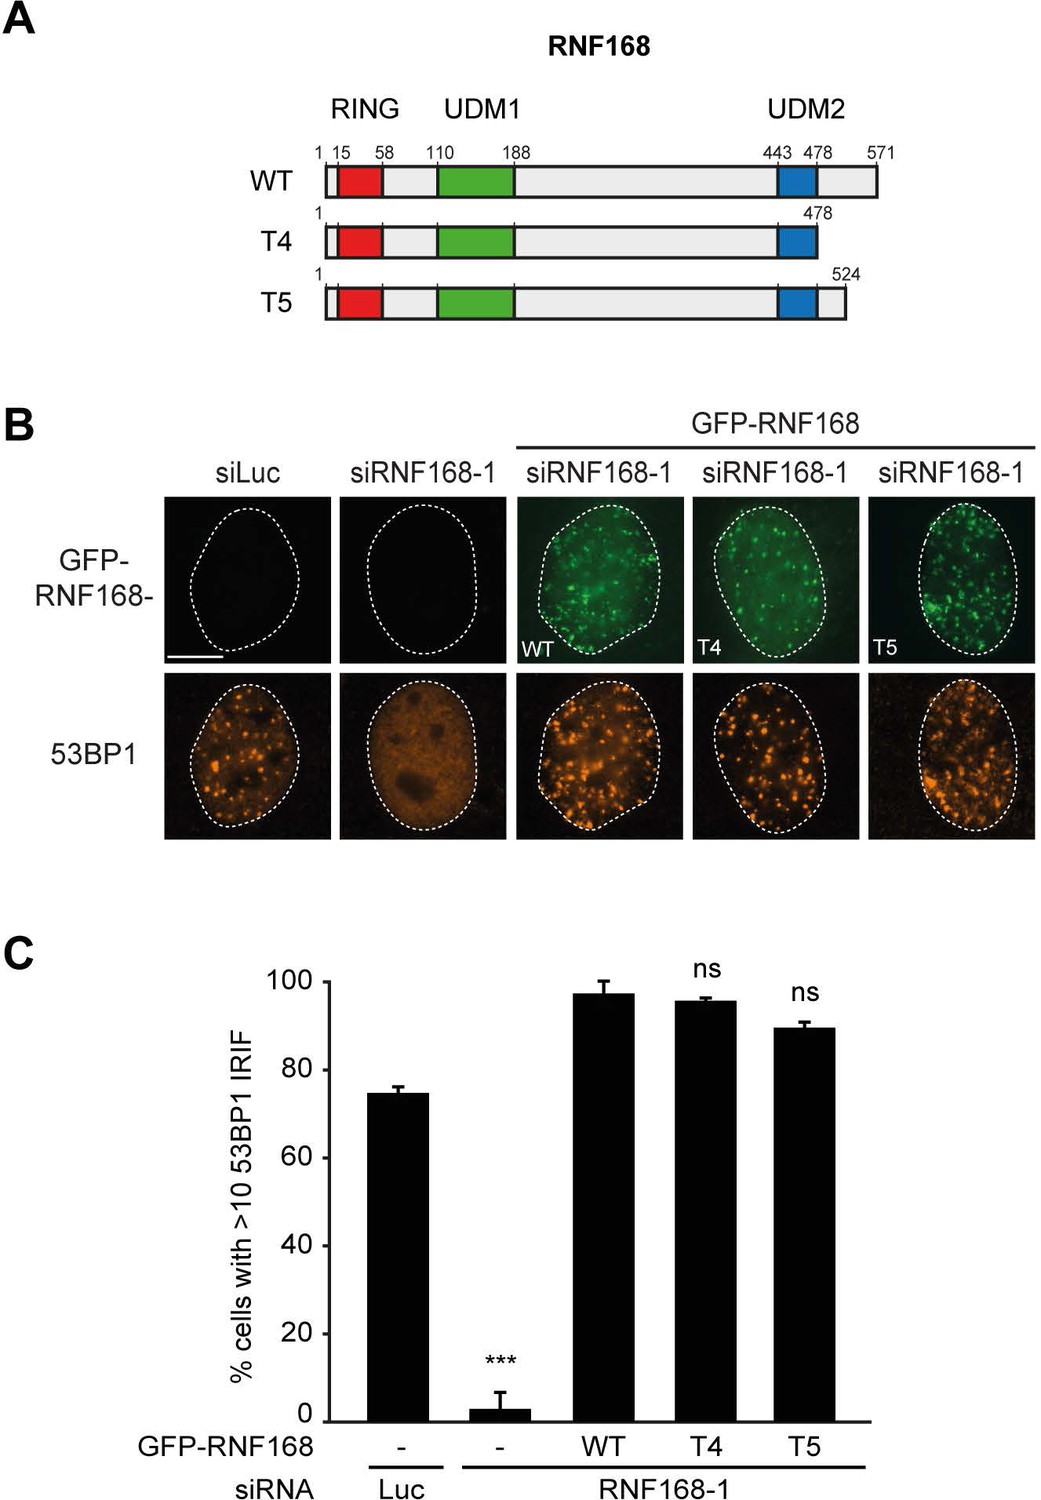
RNF168 PID mutants fully support IR-induced 53BP1 focus formation.
(A) Schematic representation of full-length RNF168 (RNF168WT) and the two C-terminal deletion mutants RNF168Δ479-571 (T4) and RNF168Δ525-571 (T5). (B) 53BP1 IRIF formation (orange) at 1 hr after 2 Gy in cells transfected with the indicated siRNAs and siRNA-resistant GFP-tagged RNF168 cDNAs (green) to validate the mutants used in Figure 8E. (C) Quantification of B. Indicated significance is compared to siLuc. Quantified data are represented as mean ±. S.E.M. (n = 3). Scale bar = 5 µm.
Figure 8—figure supplement 3
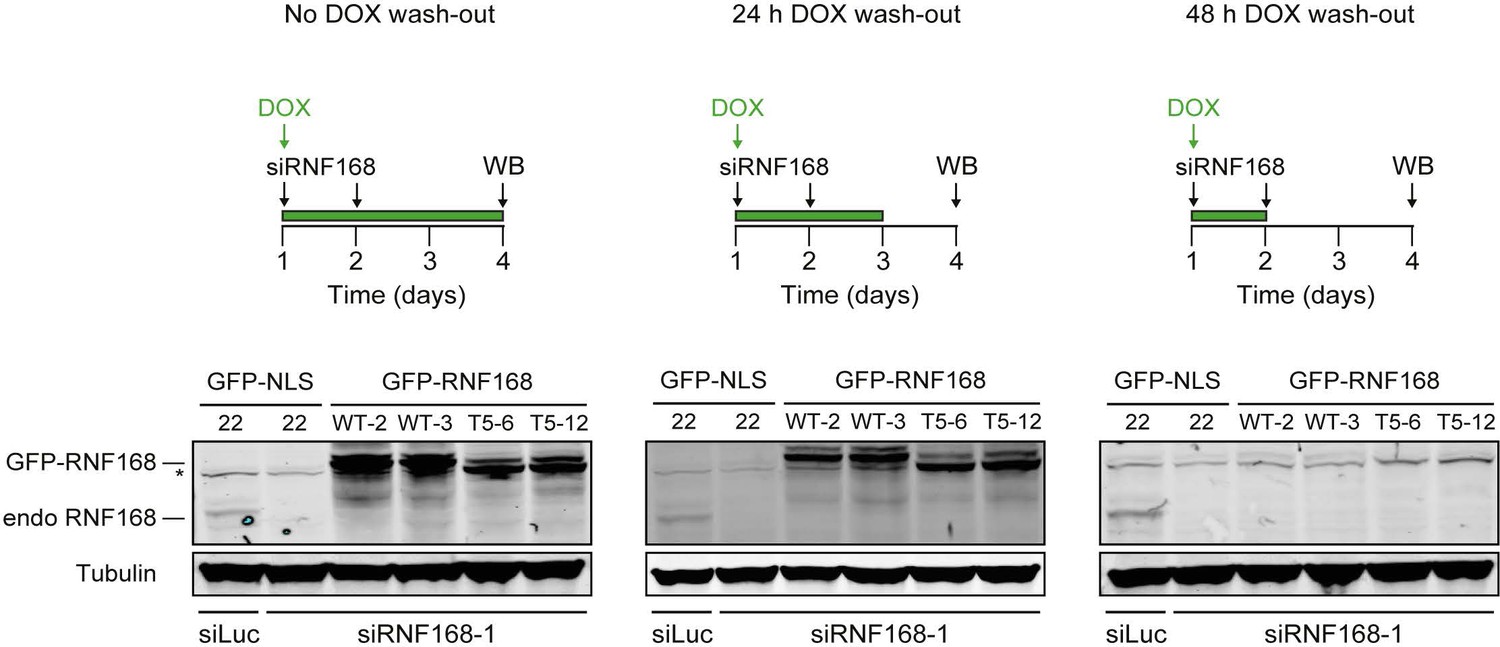
Stable inducible expression of GFP-tagged proteins in HeLa cells.
Expression levels of endogenous RNF168 and ectopic GFP-RNF168WT or GFP-RNF168Δ525-571 (T5) in stable HeLa Flp-In/T-REx cells as determined by Western blot (WB) analysis. To determine the optimal conditions for the PARPi survival experiments shown in Figure 8G–I, samples were collected at day 4 of the experimental set-up shown in the upper panels. Tubulin serves as a loading control. The star indicates a non- specific band. Given that ectopic GFP-RNF168WT and GFP-RNF168Δ525-571 (T5) expression became undetectable 48 hr after DOX wash-out, we removed DOX 12–24 hr prior to the PARPi treatments as shown in Figure 8G–I.
Additional files
-
Supplementary file 1
siRNAs and antibodies used in this study.
(A) List of siRNAs and (B) List of antibodies.
- https://doi.org/10.7554/eLife.20922.021
Download links
A two-part list of links to download the article, or parts of the article, in various formats.
Downloads (link to download the article as PDF)
Open citations (links to open the citations from this article in various online reference manager services)
Cite this article (links to download the citations from this article in formats compatible with various reference manager tools)
A PALB2-interacting domain in RNF168 couples homologous recombination to DNA break-induced chromatin ubiquitylation
eLife 6:e20922.
https://doi.org/10.7554/eLife.20922


