The angiopoietin-like protein ANGPTL4 catalyzes unfolding of the hydrolase domain in lipoprotein lipase and the endothelial membrane protein GPIHBP1 counteracts this unfolding
- Rigshospitalet, Denmark
- University of Copenhagen, Denmark
- University of Southern Denmark, Denmark
- University of California, Los Angeles, United States
- Umeå University, Sweden
- Cornell University, United States
Figures
Figure 1 with 4 supplements

Kinetics of spontaneous and ANGPTL4-mediated unfolding of LPL´s serine hydrolase domain.
Unfolding of the hydrolase domain in LPL is revealed by the bimodality in the isotope envelopes for the peptide 131–165, which contains two residues from LPL´s catalytic triad (Ser134 and Asp158). Time-resolved isotope signatures of this diagnostic peptide are shown for 10 µM LPL incubated alone (panel A) or in the presence of 1 µM ANGPTL41–159 (panel B). The butterfly plot in panel C compares the spontaneous and ANGPTL4-catalyzed unfolding of LPL at conditions where 10–15% (orange curve) or 15–20% (black curve) bimodality for peptide 131–165 is observed. The deuterium uptakes were calculated from the average mass of the bimodal isotope envelopes. The shaded gray area corresponds to the largest standard deviation in the data sets recorded for each peptide (triplicates). Transparent red and cyan colors on the left assign these peptides to LPL´s N-terminal hydrolase domain (NTD) or its C-terminal lipid-binding domain (CTD), respectively. The identities of the 92 peptic LPL peptides are found elsewhere (Mysling et al., 2016). Panel D shows the time-dependent unfolding of 10 µM LPL either alone (▲) or in the presence of ANGPTL41–159 (□) at 2, 1, 0.5, and 0.25 µM, as indicated by green, red, blue, and yellow coloring, respectively. This value is calculated as the ratio between the bimodal isotope envelopes of the folded and unfolded proteins. Panel E shows a homology model of LPL with the proposed head-to-tail homodimer formation indicated by the semitransparent LPL subunit (Kobayashi et al., 2002; Wang et al., 2013b). The red color highlights the regions in LPL showing bimodality of isotope envelopes (i.e., unfolding) by HDX-MS.
Figure 1—figure supplement 1
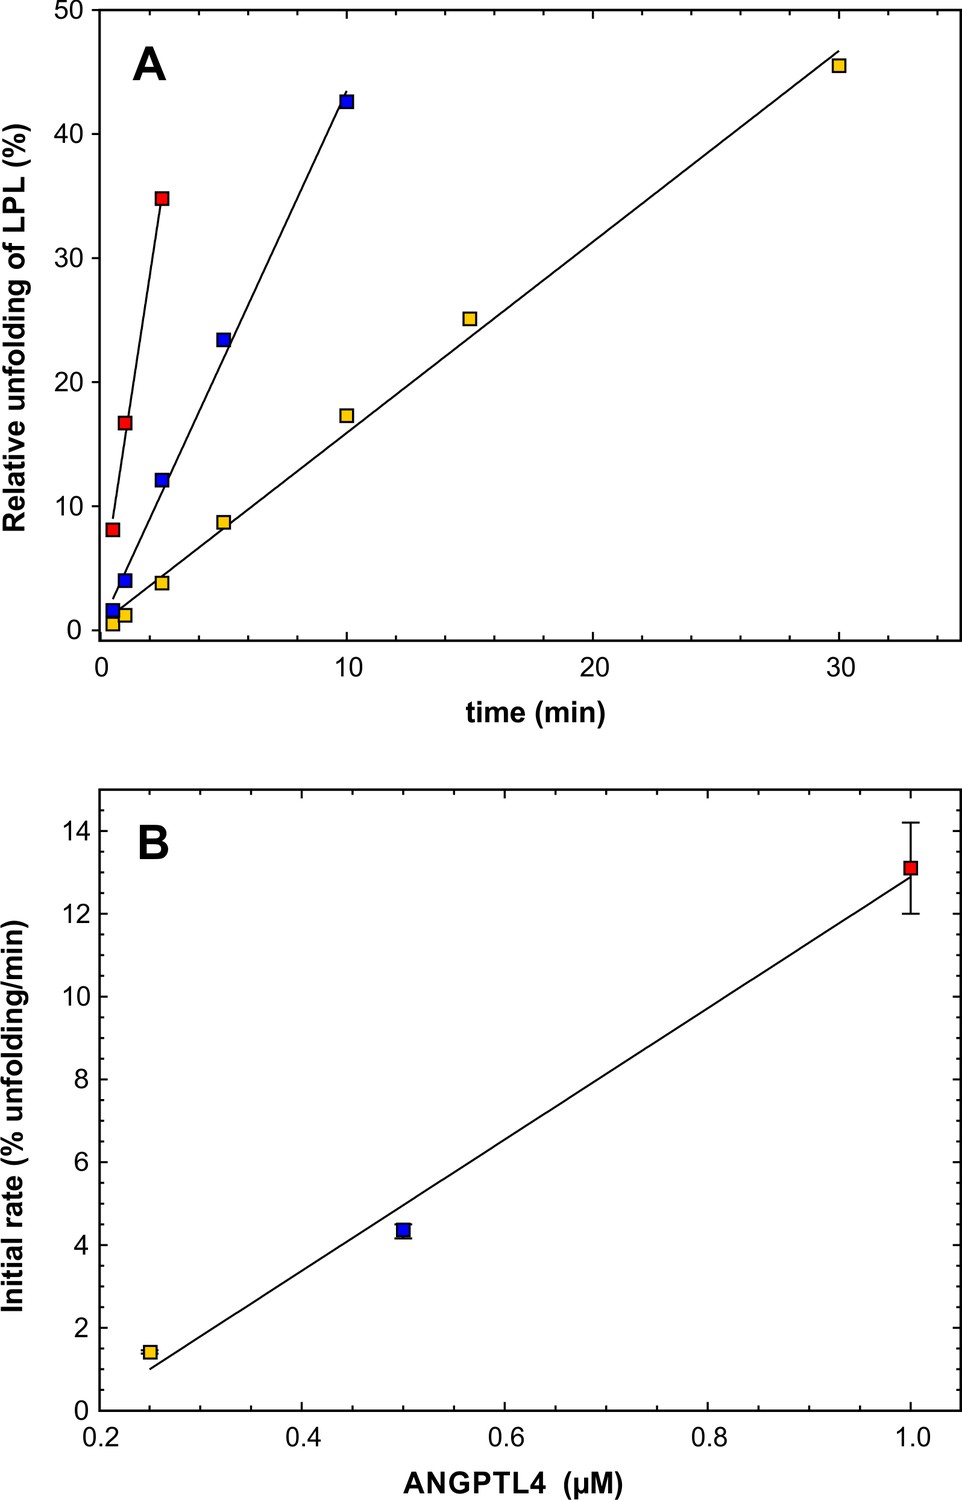
Estimating the catalytic efficacy of ANGPTL41–159 on LPL unfolding.
Panel A shows the unfolding of LPL caused by ANGPTL41–159 (after subtracting the spontaneous unfolding observed with parallel LPL incubations). Data points from incubations with substantial substrate depletion were omitted from the analysis. The kinetics for three different concentrations of ANGPTL41–159 are shown: 1 µM (red squares), 0.5 µM (blue squares), and 0.25 µM (yellow squares). LPL was maintained constant at 10 µM. Panel B shows the unfolding rates (slopes derived from panel A) as a function of ANGPTL41–159 concentration using identical symbols. Linear regression defines the slope as 1.6 ± 0.2 LPL molecules per ANGPTL per min, which is the catalytic unfolding efficacy of ANGPTL41–159 under these conditions.
Figure 1—figure supplement 2
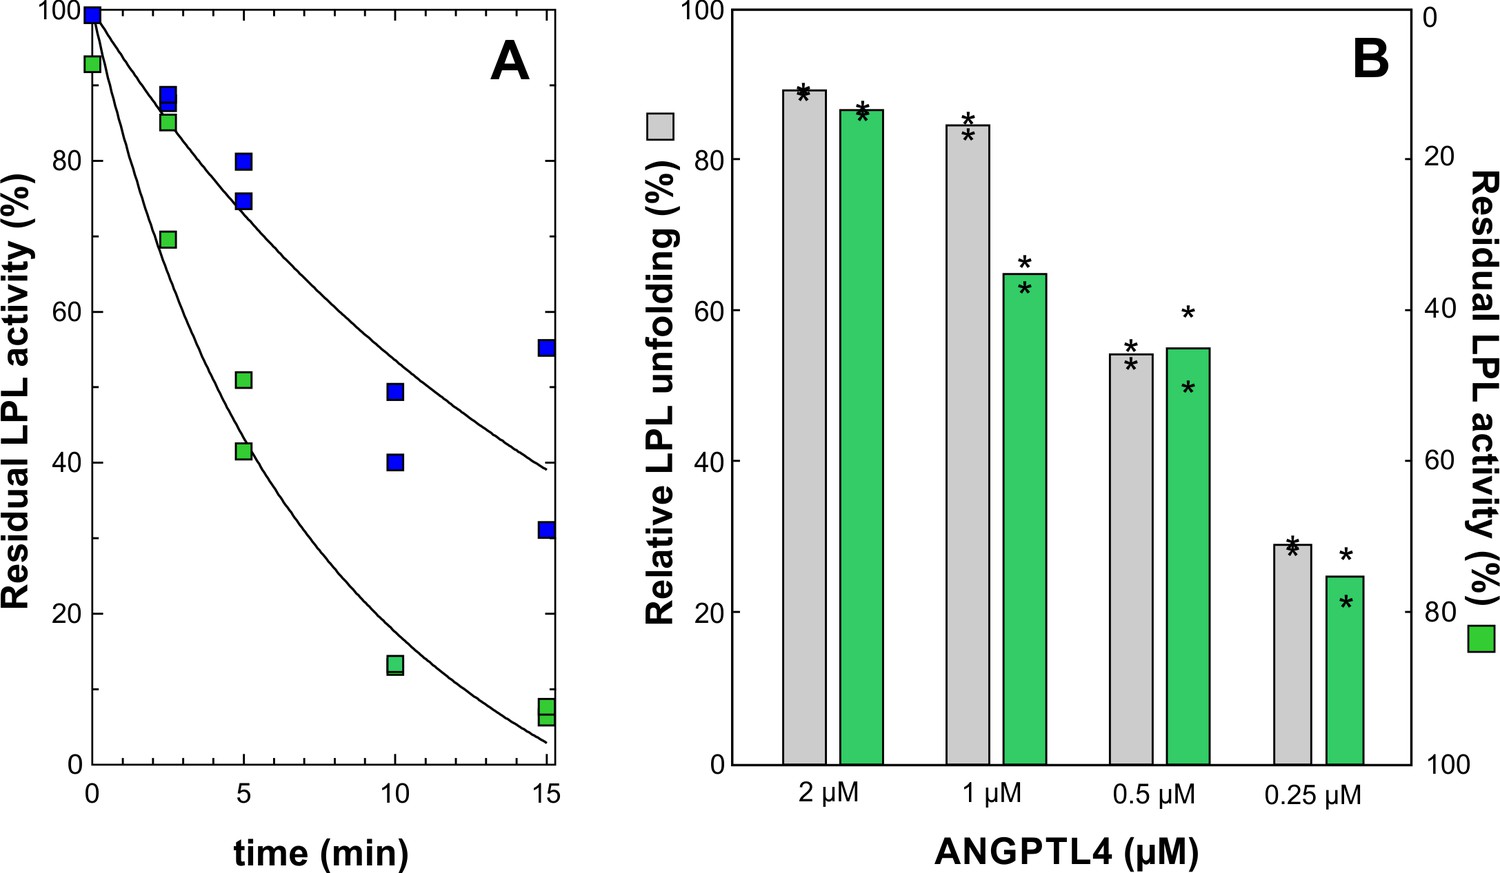
Dose- and time-dependent inhibition of LPL catalytic activity by ANGPTL41–159.
Panel A shows the time-dependent inhibition of the lipolytic activity of 10 µM LPL incubated at 25°C with 2 µM or 0.5 µM ANGPTL4 for 0 to 15 min at 25°C (green and blue squares, respectively). Further inactivation was quenched by dilution into ice cold Tris buffer containing 5 mM DOC and 0.1 mM SDS. The residual LPL activity was measured with Intralipid containing [3H]triolein as substrate, and the activity is calculated relative to LPL activity without added ANGPTL4. Panel B compares protein unfolding measured with HDX-MS and enzymatic activity of 10 µM LPL incubated for 10 min with 2, 1, 0.5, and 0.25 µM ANGPTL4 for 10 min at 25°C (asterisks represent the individual measuring points).
Figure 1—figure supplement 3

Oligomerization status of purified ANGPTL41–159.
Panel A shows a Coomassie blue-stained acrylamide gel after SDS-PAGE of purified ANGPTL41–159, before and after reduction and alkylation. This gel was deliberately overloaded to aid in visualizing disulfide-linked oligomers. Optical scanning of lanes from a parallel SDS-PAGE analysis of two-fold serial dilutions reveals that the covalent ANGPTL4 dimer represents 10% of the total protein: M; monomer; D; dimer, and T; trimer. Panel B shows the isotope envelope for peptide 45–77 determined with mass spectrometry for a peptic digest of ANGPTL41–159. Panel C shows the corresponding mass analyses of ANGPTL41–159 reduced with 0.4 M TCEP in 1 M urea for 2 min on ice. The identity of the 45–77 fragment in panels B and C were confirmed by MS/MS fragmentation. A comparison of the unfolding of 10 µM LPL catalyzed by 1 µM ANGPTL41–159 with an intact intramolecular disulfide bond and 1 µM ANGPTL41–159 with reduced and alkylated thiols at Cys51 and Cys55 is shown in panel D. Alkylation of TECP reduced thiols was accomplished as described in Experimental Procedures.
Figure 1—figure supplement 4
ANGPTL4-mediated inhibition of LPL at 4°C —impact of deoxycholate (DOC).
LPL (15 nM) was incubated on ice with ANGPTL4 in molar ratios of 1:0 (black circles); 2:1 (red circles); 1:1 (green squares); 1:3 (blue squares) and 1:10 (yellow triangles). All procedures were carried out in quadruplicates with DGGR as substrate as reported previously (Lafferty et al., 2013). Panel A shows that in the presence of 1 mM DOC we observed that inhibition appeared instantaneous with the lower ANGPTL4 concentrations (red and green), and this was likely caused the reduced DOC concentration during the subsequent measurement of LPL activity with the DGGR substrate, while the concentrations of ANGPTL4 were still high enough to cause inactivation of LPL. At higher ANGPTL4 concentrations (blue and yellow) we did observe a time-dependent progression in the loss of LPL activity, indicating that the protection of LPL by DOC during the pre-incubation step at 4°C was partly overcome by the high levels of ANGPTL4. Panel B shows inactivation of LPL under identical conditions as in panel A, except that DOC was omitted. In this setting, we observed a pronounced, time-dependent inactivation of LPL at all concentrations of ANGPTL4. The time-dependent loss of LPL activity in the presence of ANGPTL4 is compatible with a mode of action that results in an irreversible inactivation.
Figure 2

GPIHBP1 binding counteracts ANGPTL4-catalyzed unfolding of LPL.
Panel A shows the degree of unfolding of 10 µM LPL incubated for 10 min at 25°C with 2 µM ANGPTL41–159 alone or in the presence of 30 µM GPIHBP11–131, 30 µM GPIHBP134–131, 30 µM GPIHBP11–33, or a mixture of 30 µM GPIHBP134–131 and 30 µM GPIHBP11–33 (gray bars). The loss in lipolytic LPL activity on samples treated identically is shown by green bars. These activity data were normalized relative to the initial LPL activity assuming a spontaneous decay of 15% during the experiment. Panel B shows the degree of spontaneous unfolding of 10 µM LPL before and after a 45 min incubation at 25°C either alone or in the presence of 10 µM GPIHBP1 in the same combinations used in panel A. The relative unfolding of LPL is calculated from the bimodal distribution of the isotope envelopes for peptide 131–165. Panel C shows a molecular model for GPIHBP1 depicting the intrinsically disordered acidic domain (GPIHBP11–33) and the ordered LU domain (GPIHBP134–131). The acidic residues in the N-terminal domain are highlighted by sticks as is the Arg33, which is exposed and prone to proteolysis (Mysling et al., 2016). The attachment site for the membrane anchor is indicated (GPI).
Figure 3

GPIHBP1 cannot reverse loss of LPL activity after spontaneous or ANGPTL4-catalyzed inactivation.
Panel A shows time-dependent loss of LPL catalytic activity after incubating LPL at 21°C alone or in the presence of GPIHBP1. The progressive loss in catalytic activity of LPL (15 nM) during the incubation is shown by red triangles; the protection provided by a pre-incubation with GPIHBP11–131 (300 nM) is shown by black squares. Adding GPIHBP11–131 (300 nM) to LPL that was incubated alone for 20 min (green arrow) prevented any further loss of LPL (green squares). Panel B shows inactivation of LPL catalytic activity by 7.5 nM ANGPTL41–159 (red diamonds). The inhibition of LPL activity by ANGPTL4 was markedly reduced by the presence of 300 nM GPIHBP11–131 (blue circles); however, a small amount of ANGPTL4-mediated inhibition probably still persisted during the incubation with GPIHBP1, given that LPL catalytic activity was greater when LPL was incubated with GPIHBP1 in the absence of ANGPTL41–159 (black squares). When 300 nM GPIHBP11–131 was added to LPL 10 min after the initiation of ANGPTL4-mediated LPL inactivation (green arrow), there was no further loss of LPL activity (green circles). However, the loss of LPL activity that had occurred during the first 10 min of incubation was not reversed (i.e. there was no resurrection of ANGPTL4-inactivated LPL). LPL activity measurements were performed in triplicated; data shown ± SD.
Figure 4
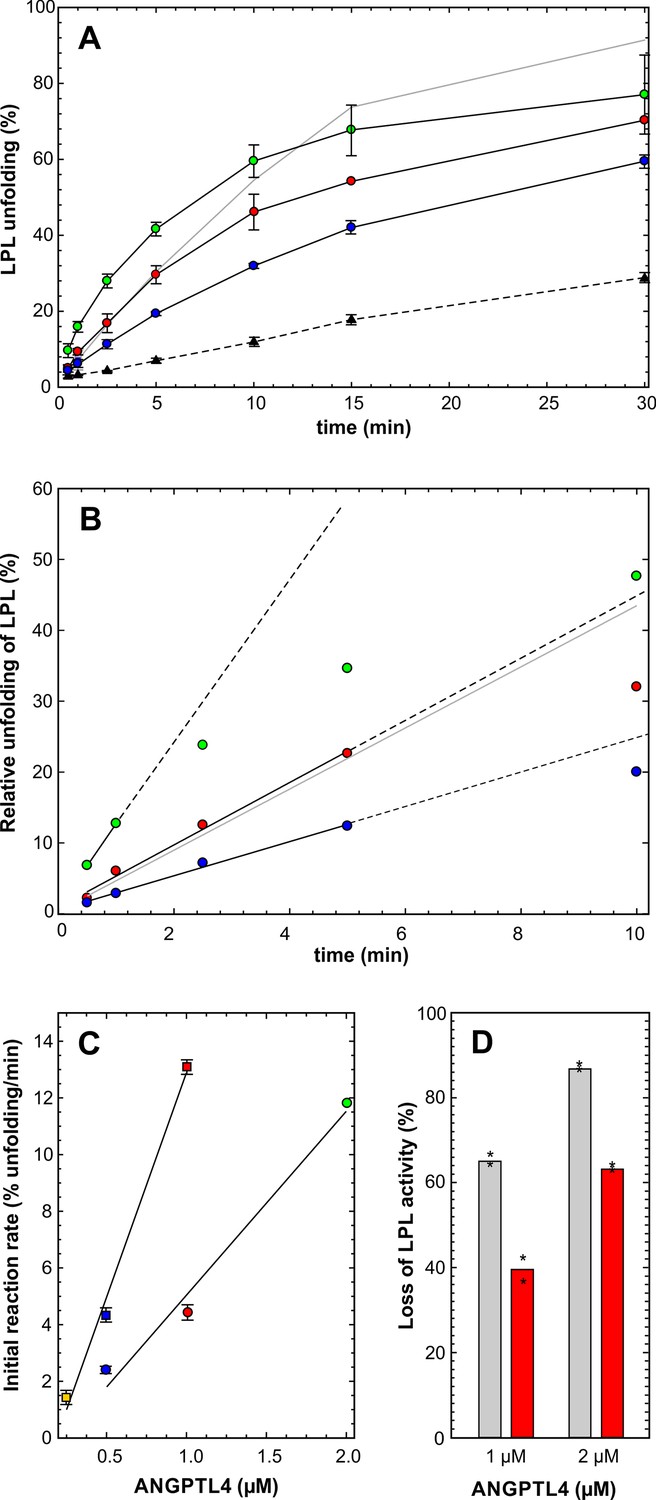
Impact of ANGPTL4E15K on LPL unfolding.
Panel A shows the time-dependent unfolding of 10 µM LPL in the presence of 2, 1, and 0.5 µM ANGPTL41–159/E15K, highlighted by black solid lines and the green, red and blue circles, respectively. For comparison the unfolding mediated by 0.5 µM ANGPTL41–159/wt is shown by the gray solid line. The hatched line represents spontaneous LPL unfolding. The corresponding data are shown in panel B after subtraction of spontaneous unfolding. The solid black lines show the data used to estimate the unfolding rates and their hatched extension illustrates nonlinearity at longer incubation times. The unfolding rates of ANGPTL41–159/E15K (circles) and ANGPTL41–159/wt (squares) are represented by the slopes of the lines in panel C. The difference in the inhibitory efficacies between ANGPTL41–159/wt (gray bars) and ANGPTL41–159/E15K (red bars) on LPL-mediated hydrolysis of [3H]triolein is shown in panel D (asterisks represent the individual measuring points).
Figure 5 with 1 supplement
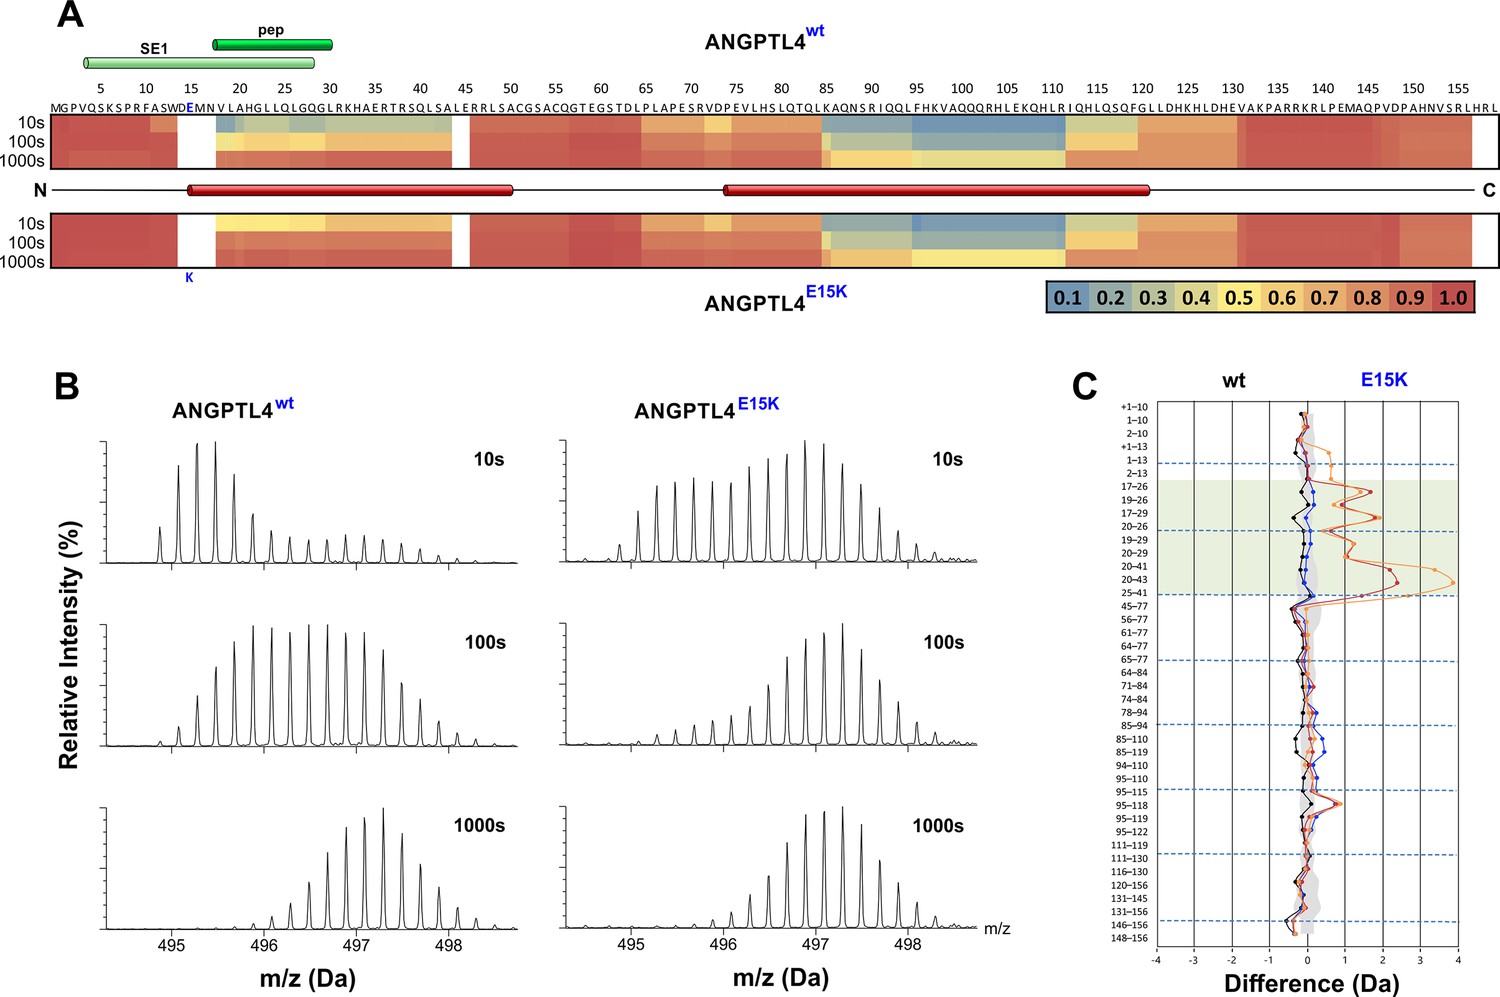
Protein dynamics of wild-type ANGPTL4 and ANGPTL4 containing the E15K polymorphism.
Purified ANGPTL41–159 preparations (wt and E15K) were diluted to 10 µM with D2O-phosphate buffer at pH 7.1, and hydrogen–deuterium exchange was monitored for 10, 100, and 1000 s at 25°C. Panel A provides a heat map of the deuterium uptake values (relative to a fully exchanged control) for peptic peptides from wt and E15K ANGPTL41–159 as assessed by HDX-MS. The relative deuterium uptake values for these peptides are plotted on the primary protein sequence [ranging from blue (no deuterium uptake) to red (full deuterium uptake)]. The position of the specific epitope 1 (SE1) defined by the neutralizing mAb 14D12 is shown by the light green cylinder (Desai et al., 2007; Lee et al., 2009), and the sequence representing an active synthetic peptide is shown by the dark green cylinder (Yau et al., 2009). The secondary structure of ANGPTL4 wt was predicted by PSIPRED (Jones, 1999) and the positions of the two α-helices are shown by red cylinders. The position of E15K polymorphism is shown by the blue letter. Panel B shows the isotope envelopes recorded for peptide 20–41 of ANGPTL4 wt and E15K; it shows progressive deuterium uptake as a function of labeling time. Panel C visualizes the differences in the dynamics of wt and E15K ANGPTL41–159 with a butterfly plot, showing differential deuterium uptake for the two proteins recorded after 10 s (orange), 100 s (red), and 1000 s (blue). The differential uptake for the full-deuterium exchange controls is shown for comparison (black). Peptides including residues 18–30 are highlighted by the transparent green box. The shaded gray area corresponds to the largest standard deviation in the data sets recorded for each peptide (triplicates). In panel A, note that the primary sequence starts with a methionine for the bacterial expression, but this is not included in the peptide numbering. In panel C, the presence of the methionine in a peptic peptide is denoted as +1.
Figure 5—figure supplement 1
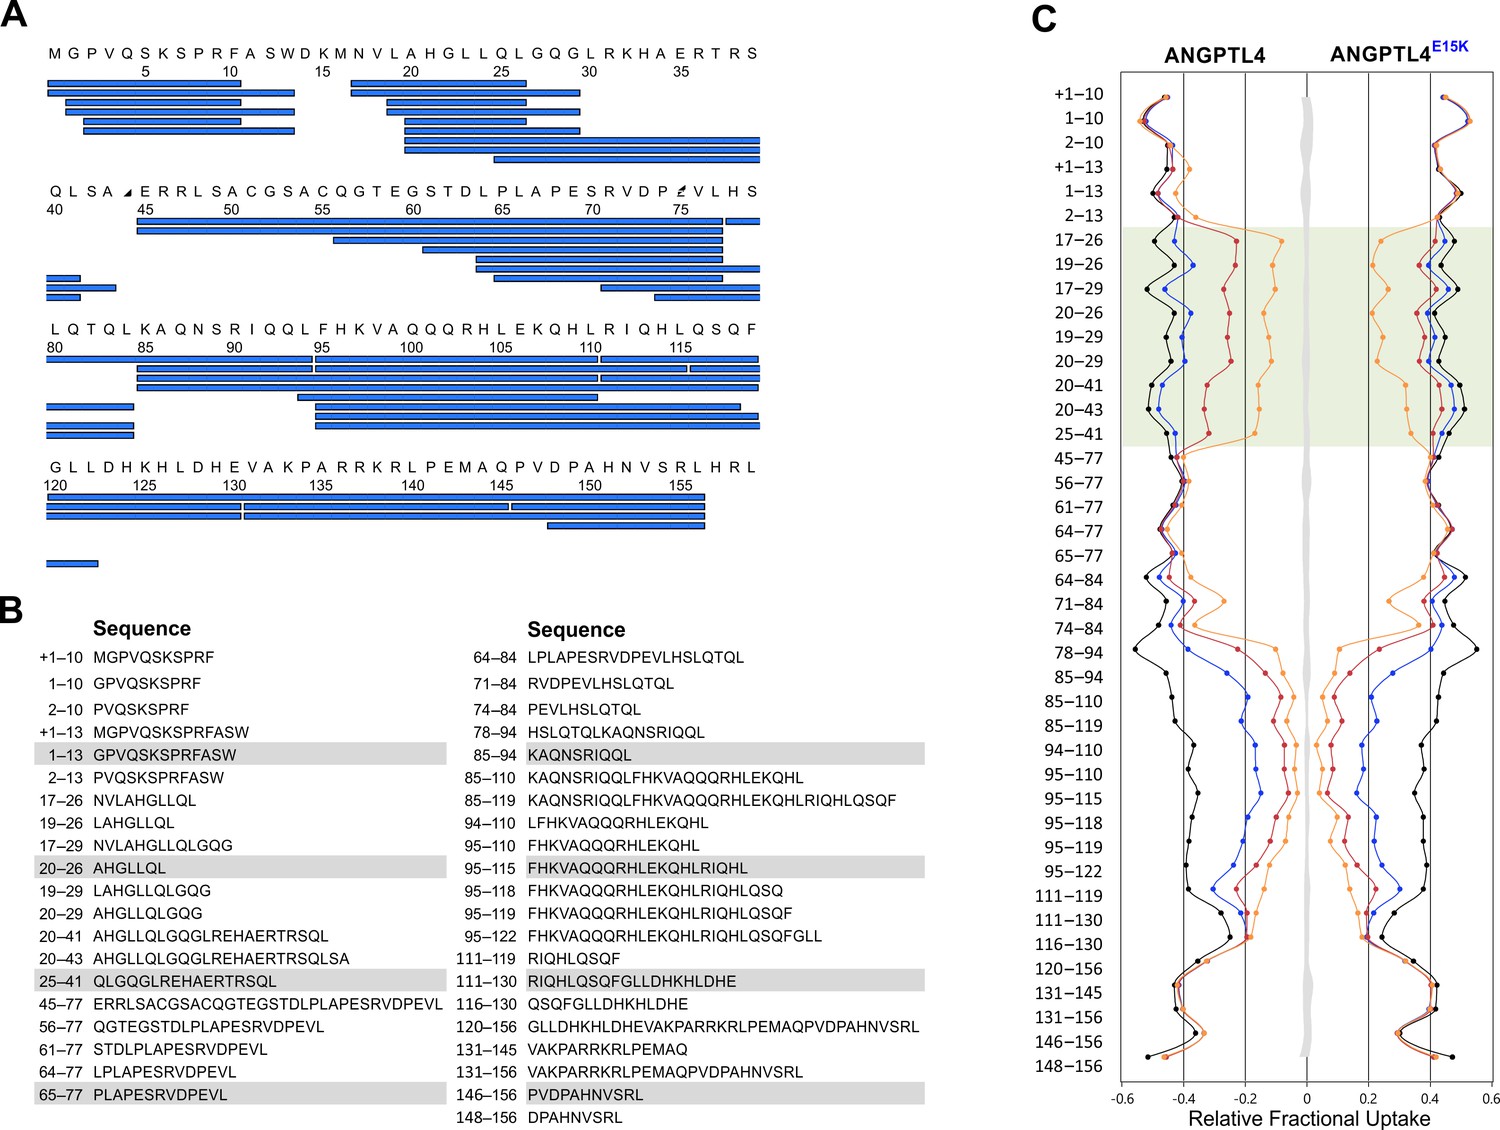
Peptide list for pepsin-treated ANGPTL41–159.
Panel A provides an overview of the peptic peptides recovered after HDX and pepsin cleavage of ANGPTL41–159. Only peptides recovered from both wt and E15K are shown. Panel B shows the identity of the 41 peptides analyzed by HDX-MS, which corresponds to 95.6% sequence coverage. The butterfly plot in panel C depicts the deuterium uptake for all peptides recovered for ANGPTL41–159 wt and E15K after 10 s (orange), 100 s (red), 1000 s (blue), and 48 hr (black). The transparent green coloring shows peptic peptides covering the sequence 18–30 in ANGPTL4 whereas the shaded gray area corresponds to the largest standard deviation in the data sets recorded for each peptide (triplicates). The presence of an N-terminal methionine in ANGPTL4 (due to the bacterial expression) is shown in the peptide list in panel A but is not included in the peptide numbering. In panels B and C, the presence of this methionine in a given peptic peptide is marked by +1.
Figure 6

ANGPTL3-catalyzed unfolding of LPL.
Panel A shows a sequence alignment of the first 55 residues of fully processed human ANGPTL3, ANGPTL4, and ANGPTL8. Identical sequences are highlighted by blue letters. The filled red box highlights the two-residue acidic motif at the start of the N-terminal α-helix, followed by a conserved α-helical region (open box). The two cysteine residues unique to ANGPTL4 are shown in yellow boxes. Panel B shows the time-dependent unfolding of 10 µM LPL by 1 µM ANGPTL3 (green circles) as defined by the appearance of bimodality in the isotope envelopes for peptide 131–165. For comparison the unfolding of LPL by 1 µM ANGPTL41–159 is shown as solid (wild-type) and hatched (E15K) gray lines. Spontaneous unfolding is shown by black triangles. Panel C shows the residual lipolytic activity of 10 µM LPL incubated for 10 min alone or in the presence of 1 µM ANGPTL3, 1 µM ANGPTL3 and 30 µM GPIHBP1, or 1 µM ANGPTL41–159.
Download links
A two-part list of links to download the article, or parts of the article, in various formats.
Downloads (link to download the article as PDF)
Open citations (links to open the citations from this article in various online reference manager services)
Cite this article (links to download the citations from this article in formats compatible with various reference manager tools)
The angiopoietin-like protein ANGPTL4 catalyzes unfolding of the hydrolase domain in lipoprotein lipase and the endothelial membrane protein GPIHBP1 counteracts this unfolding
eLife 5:e20958.
https://doi.org/10.7554/eLife.20958


