Ablation of SNX6 leads to defects in synaptic function of CA1 pyramidal neurons and spatial memory
- Chinese Academy of Sciences, China
- University of Chinese Academy of Sciences, China
- Jinling Hospital, School of Medicine, Nanjing University, China
- Nanjing University, China
Figures
Figure 1 with 1 supplement

Generation and characterization of Snx6 CNS-specific knockout mice.
(A) Domain structure of SNX6. (B) Schematic diagram of the Snx6 gene locus, the targeting vector, and the mutant alleles after homologous recombination. FRTtF/FRTtR and loxtF/loxtR: primer pairs used for genotyping. The XhoI and HpaI probes used for Southern blotting analysis are shown. Neo: the neomycin resistance cassette. (C) Southern blotting analysis of wild-type (WT) and two independent clones of targeted ES cells (9 hr and 5D). (D) Immunoblots of tissue lysates from mouse littermates, probed with antibodies to SNX6. (E) Comparison of brain weight of Snx6fl/fl (15) and Nestin-Cre; Snx6fl/fl mice (12). Data represent mean ± SEM for each group. (F) Nissl staining of sagittal sections of whole brain from Snx6fl/fl and Nestin-Cre; Snx6fl/fl mice. Also shown are magnification of the cerebellum (middle panel) and the hippocampus/cortex area (right panel). Scale bar: 1 mm.
Figure 1—figure supplement 1
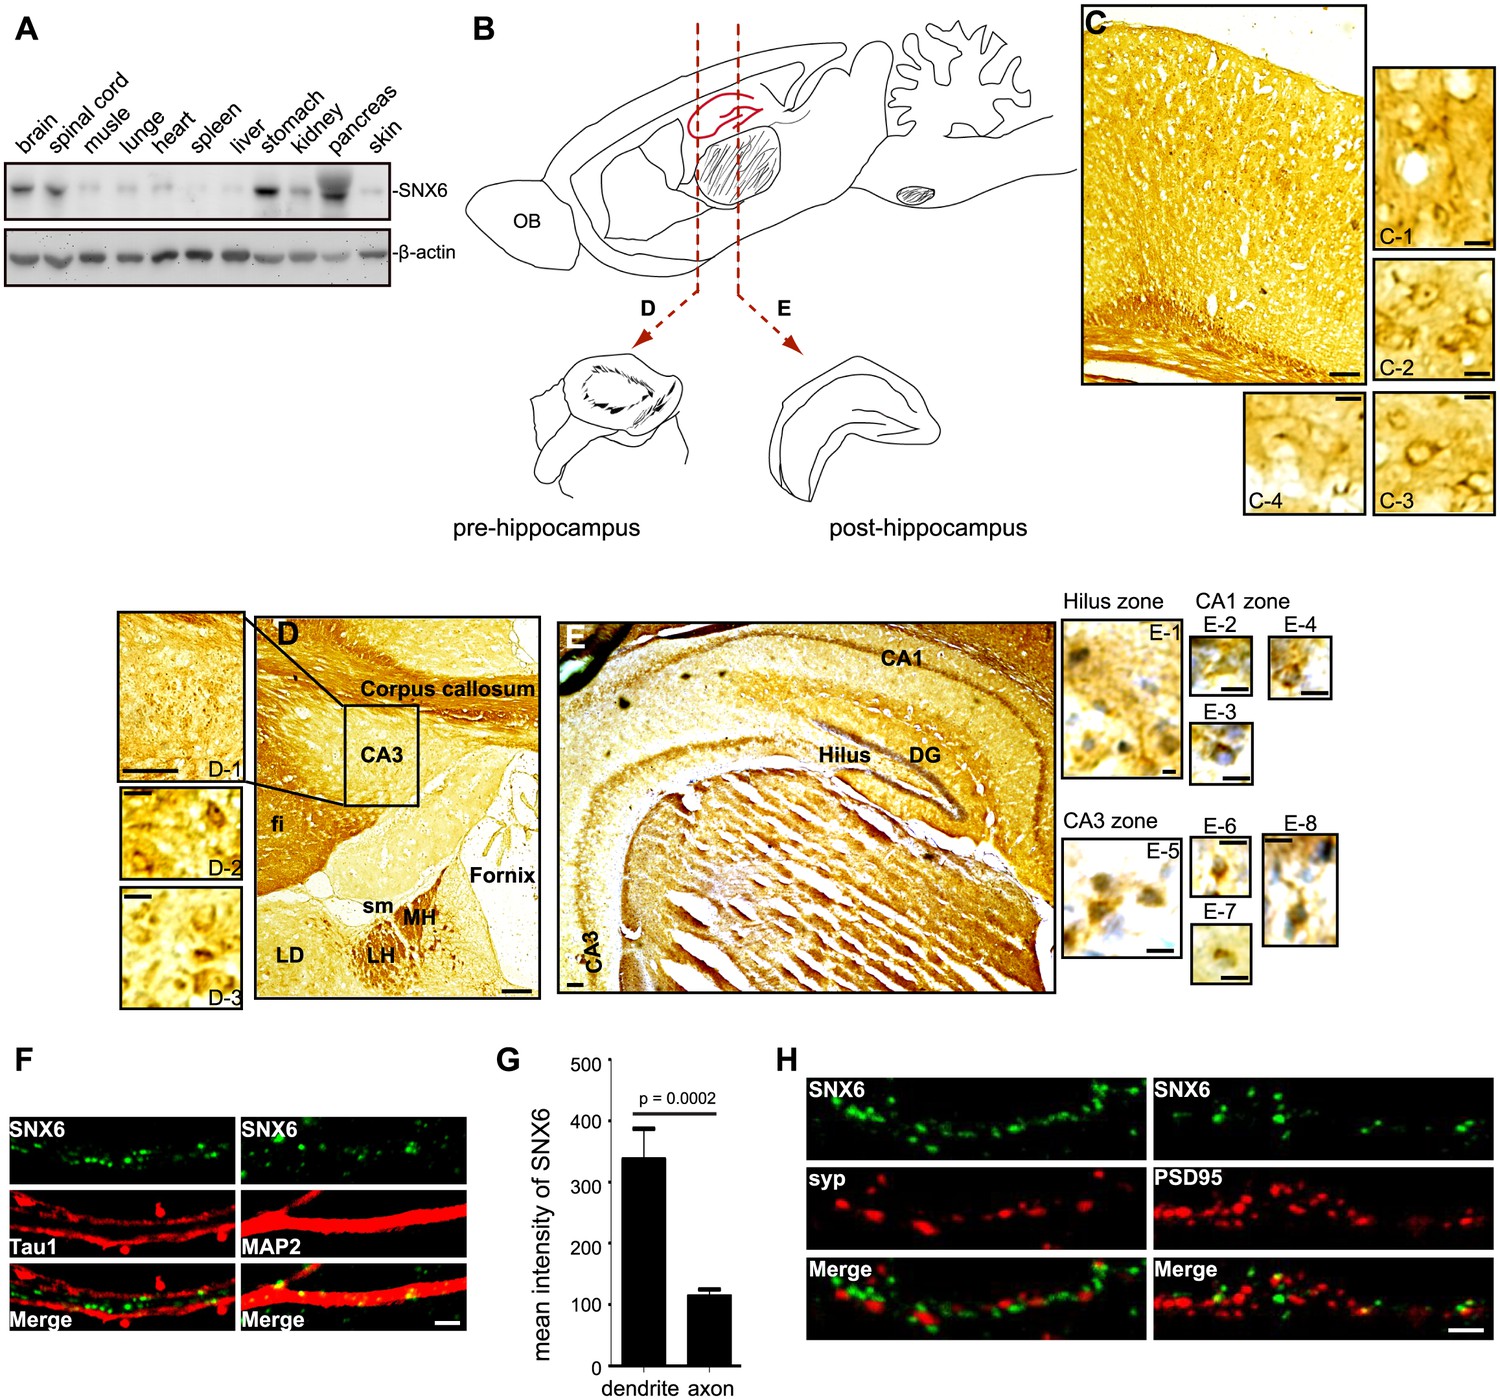
Expression and subcellular distribution of SNX6 in the CNS.
(A) Western blotting of wild-type mouse tissue lysates. (B) A schematic showing the relative positions of coronal sections in (D) and (E) in sagittal view. (C–E) Immunohistochemical analysis of SNX6 expression in mouse brain. Coronal sections of wild-type mouse were fixed and stained with antibodies to SNX6 and counterstained with hematoxylin. (F) Mouse hippocampal neurons were cultured in vitro for 18 days, fixed and immunostained with antibodies to SNX6 and Tau1 or MAP2. Shown are representative confocal microscopy images. (G) Background-subtracted mean intensity of SNX6 fluorescence in primary axon and dendrites. Measurement of fluorescence intensity is expressed in arbitrary units per square area in both axons and dendrites. All images (1024 × 1024 pixels, 16 bit) were obtained in the same settings (mean ± SEM, n = 15). (H) Mouse hippocampal neurons were cultured in vitro for 18 days, fixed and immunostained with antibodies to SNX6 and synaptophysin (SYP) or PSD95. Shown are representative confocal microscopy images. OB, olfactory bulb. Fi, fimbria. LD, lateral dorsal nucleum of thalamus. Sm, stria medullaris. MH, medial habenula. LH, lateral habenula. Bars: 100 μm in (C), (D), (E) and (D-1), 20 μm in (C-1 – 4 ), (D-2 – 3) and (E-1 – 8 ), 2 μm in (F) and (H).
Figure 2
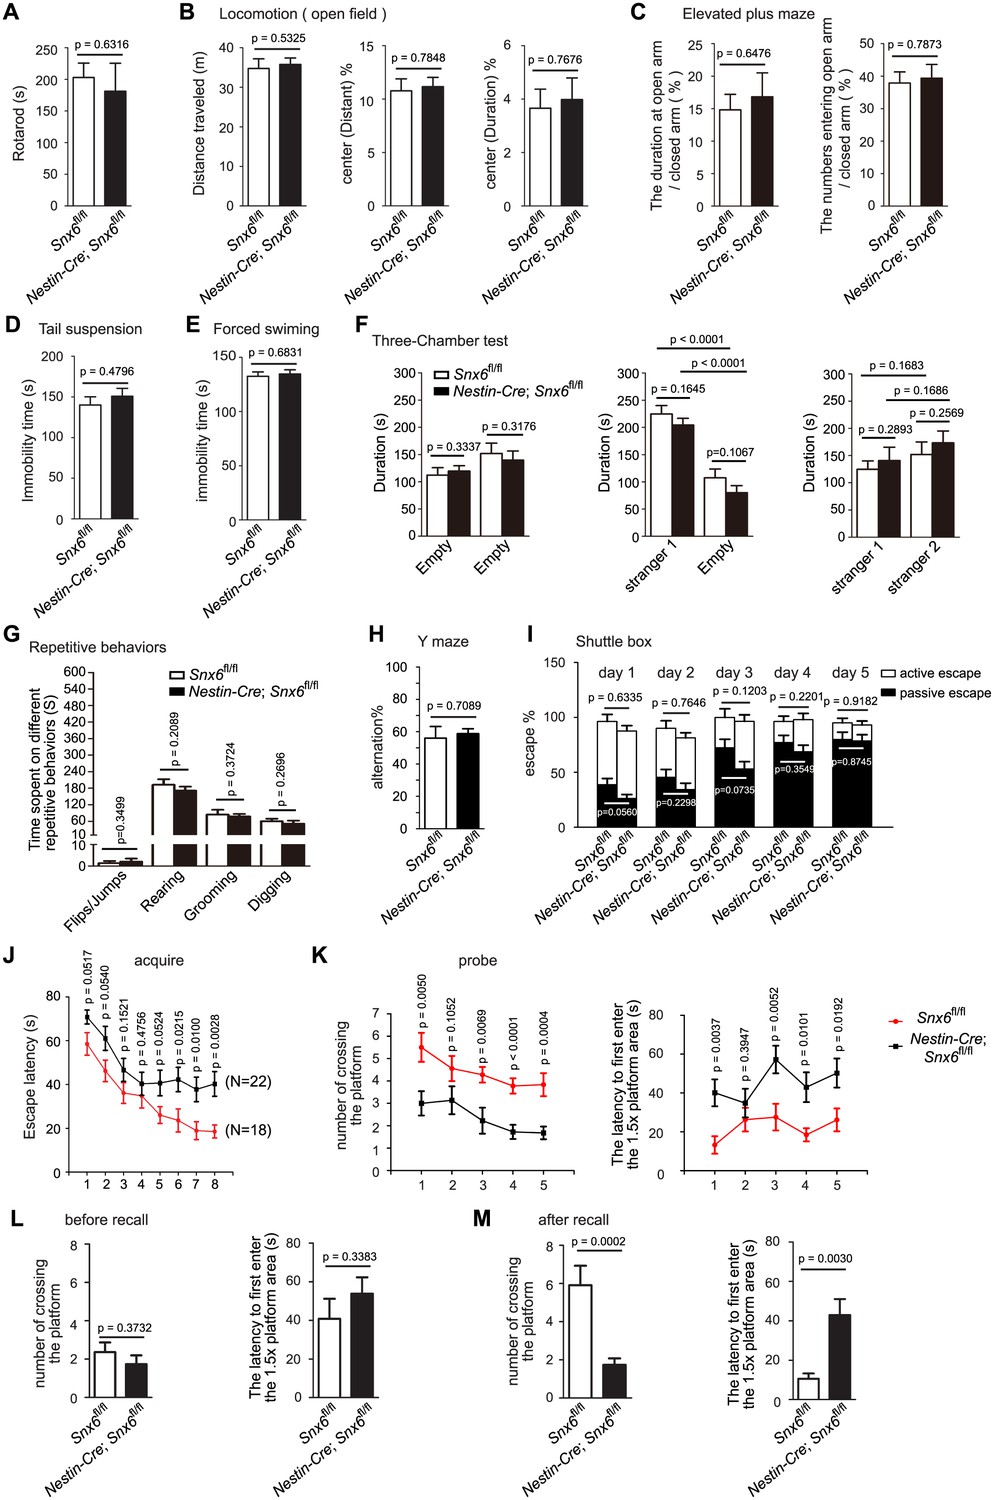
Impaired spatial learning and memory in Nestin-Cre; Snx6fl/fl mice.
(A–I) No effects of SNX6 ablation on the performance in assays of rotarod (A) (13 Snx6fl/fl and 16 Nestin-Cre; Snx6fl/fl mice), open field (B) (23 Snx6fl/fl and 23 Nestin-Cre; Snx6fl/fl mice), elevated plus maze (C) (14 Snx6fl/fl and 13 Nestin-Cre; Snx6fl/fl mice), tail suspension (D) (14 Snx6fl/fl and 24 Nestin-Cre; Snx6fl/fl mice), forced swimming (E) (15 Snx6fl/fl and 25 Nestin-Cre; Snx6fl/fl mice), Three-Chamber test (F) (10 Snx6fl/fl and 9 Nestin-Cre; Snx6fl/fl mice), repetitive behaviors (G) (12 Snx6fl/fl and 10 Nestin-Cre; Snx6fl/fl mice), Y maze (H) (11 Snx6fl/fl and 15 Nestin-Cre; Snx6fl/fl mice) and shuttle box (I) (20 Snx6fl/fl and 13 Nestin-Cre; Snx6fl/fl mice). The data represent mean ± SEM for each group. (J–K) Increased escape latency at acquisition learning (J) (data represent mean ± SEM of four trials per day), decreased number of crossing and increased latency to first enter the 1.5x area at probe test (K) (the data represent mean ± SEM for each group) in Nestin-Cre; Snx6fl/fl mice in the Morris water maze. Subject numbers were 18 Snx6fl/fl and 22 Nestin-Cre; Snx6fl/fl mice. (L) After a 20-day rest, both Snx6fl/fl and Nestin-Cre; Snx6fl/fl mice exhibited memory extinguishment. (M) Decreased number of crossing and increased latency to first enter the 1.5x area at probe test in Nestin-Cre; Snx6fl/fl mice after one recall training. The data represent mean ± SEM. N = 3 independent experiments.
Figure 3
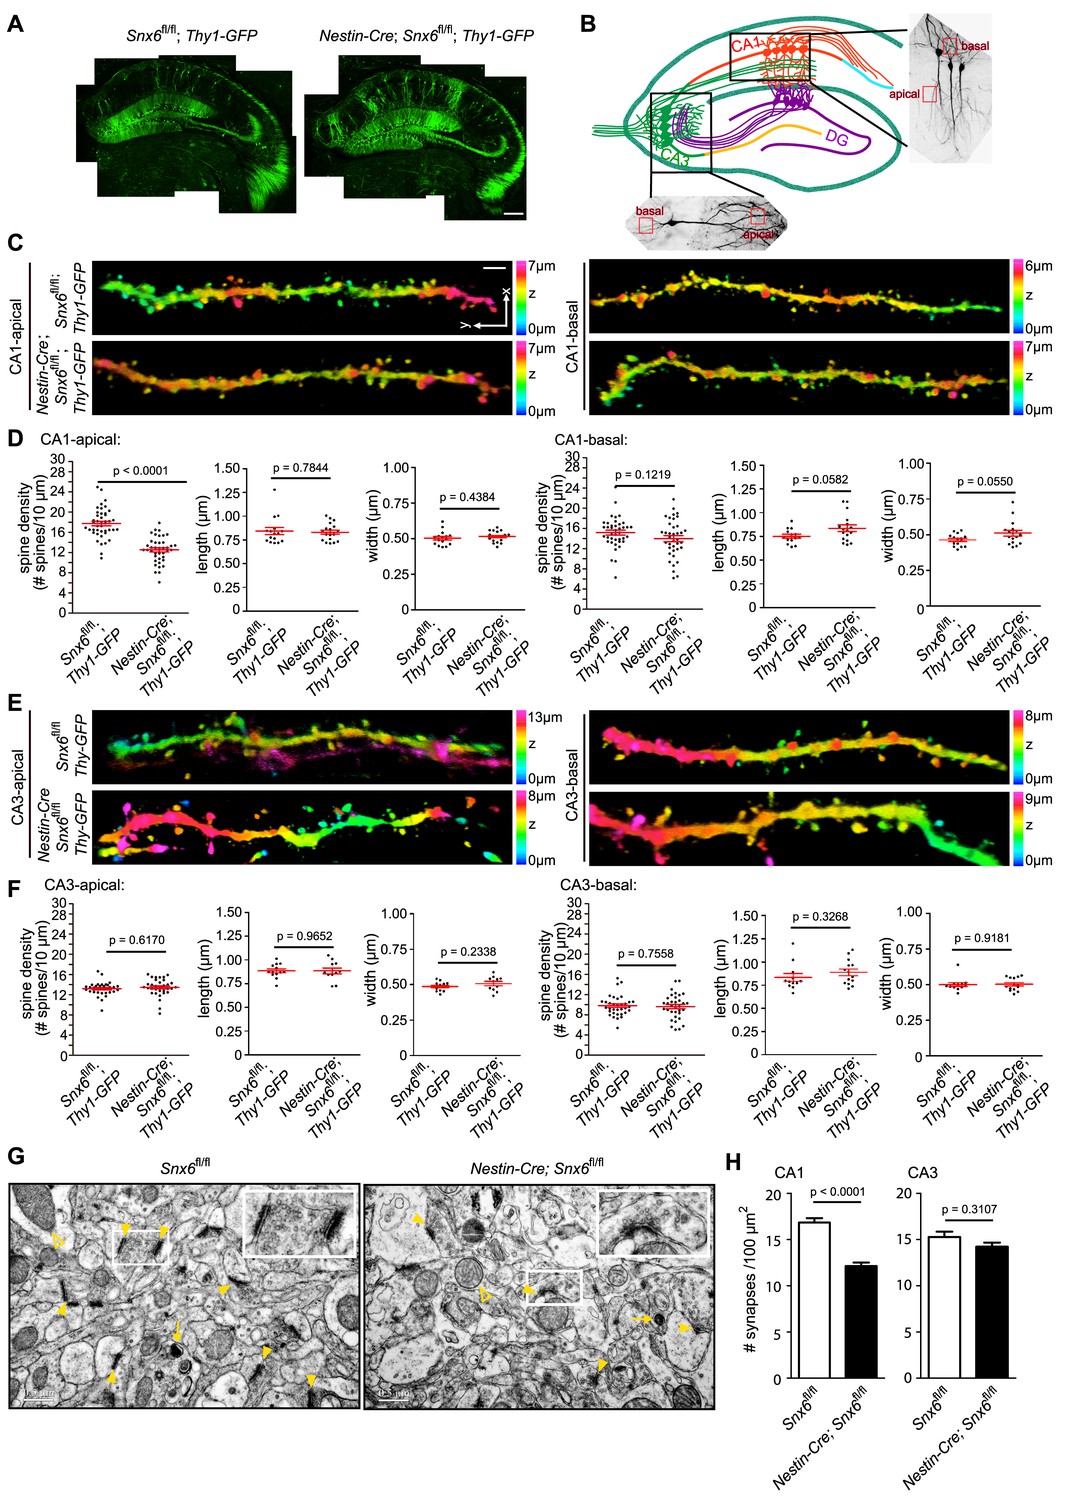
Decreases in spine density of hippocampal CA1 apical dendrites and number of excitatory synapses in the CA1 region in Nestin-Cre; Snx6fl/fl Mice.
(A) Confocal images of coronal sections of hippocampi from Snx6fl/fl; Thy1-GFP and Nestin-Cre; Snx6fl/fl; Thy1-GFP. (B) Schematic of the location of the dendritic segments selected for morphological analysis. (C) Representative 3D-reconstructed confocal images of dendrites of CA1 pyramidal cells. The z-dimension position is color-coded according to the color scale bar. (D) Quantification of spine density (n = 5 pairs of mice, apical/basal: 43/40 cells, 95/82 dendritic segments and 4979/3721 spines for Snx6fl/fl; Thy1-GFP; 40/38 cells, 96/78 dendritic segments and 3662/3341 spines for Nestin-Cre; Snx6fl/fl; Thy1-GFP) and morphology (n = 2 pairs, apical/basal: 16/14 cells, 1053/764 spines for Snx6fl/fl; Thy1-GFP; 18/17 cells, 1099/894 spines for Nestin-Cre; Snx6fl/fl; Thy1-GFP) of CA1 dendrites. (E) Representative 3D-reconstructed confocal images of CA3 dendrites. (F) Quantification of spine density (n = 5 pairs, apical/basal: 34/34 cells, 80/75 dendritic segments and 3155/2261 spines for Snx6fl/fl; Thy1-GFP; 34/34 cells, 77/73 dendritic segments and 3053/2216 spines for Nestin-Cre; Snx6fl/fl; Thy1-GFP) and morphology (n = 2 pairs, apical/basal: 13/12 cells, 822/595 spines for Snx6fl/fl; Thy1-GFP; 11/14 cells, 739/568 spines for Nestin-Cre; Snx6fl/fl; Thy1-GFP) of CA3 dendrites. (G) Representative TEM images of hippocampal CA1 regions of adult animals. Yellow solid arrowheads indicate asymmetric (excitatory) synapses. Insets are representative higher magnification images of synapses in the boxed areas. Yellow empty arrowheads indicate mitochondria. Yellow arrows indicate lysosomes. (H) Quantification of synapse density (n = 3 pairs, CA1: 1553 synapses for Snx6fl/fl and 1038 synapses for Nestin-Cre; Snx6fl/fl. CA3: 1102 synapses for Snx6fl/fl and 1069 synapses for Nestin-Cre; Snx6fl/fl ). Data represent mean ± SEM. Bars: 200 μm in (A), 2 μm in (C) and 500 nm in (G).
Figure 4 with 1 supplement
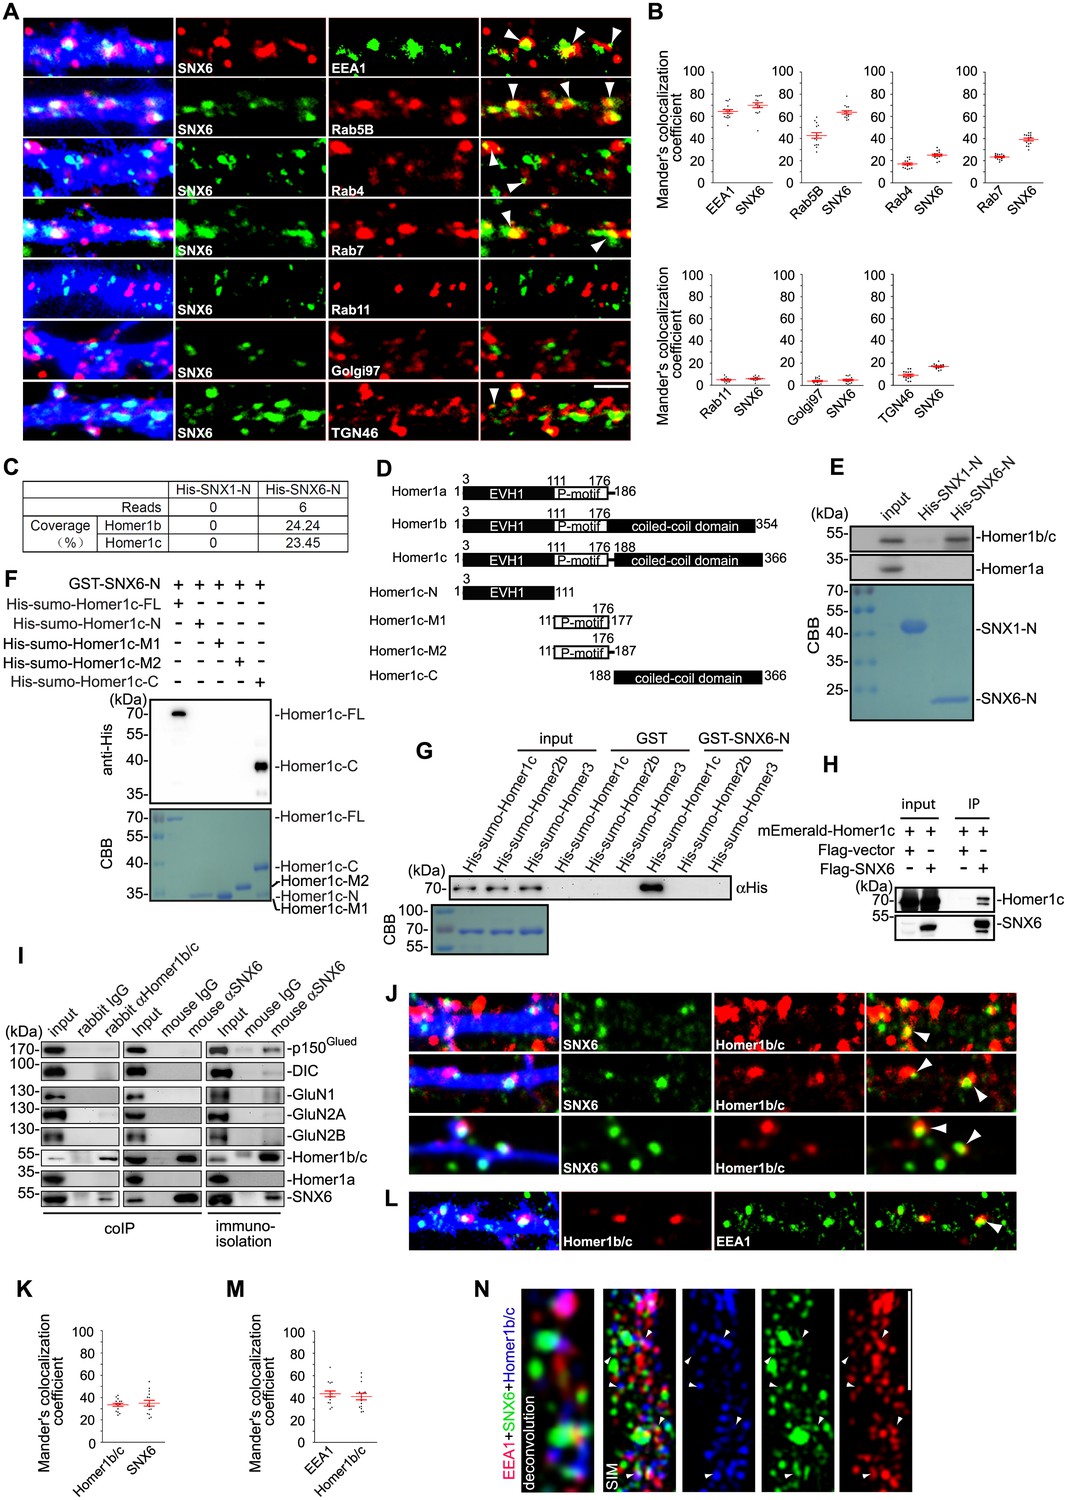
SNX6 interacts with Homer1b/c and colocalizes with Homer1b/c on endosomes.
(A) Hippocampal neurons were transfected with pLL3.7.1 on DIV14 to express DsRed as volume marker, fixed on DIV17 and immunostained with antibodies to SNX6 and vesicular markers. DsRed is pseudocolored for presentation. White arrowheads indicate overlapped signals. (B) Quantification of colocalization in (A) from 45 dendritic segments of 15 neurons (mean ± SEM, N = 3. Total length of dendrites: 1568 μm for EEA1; 1447 μm for Rab5; 1637 μm for Rab4; 1489 μm for Rab7; 1319 μm for Rab11; 1207 μm for Golgi97 and 1462 μm for TGN46). (C) Mouse brain lysates were incubated with His-SNX1-N or His-SNX6-N immobilized on Ni-NTA agarose. Bound proteins were subjected to SDS-PAGE and mass spectrometry analysis. The table shows the number of Homer1b/c unique peptides identified by mass spec analysis and their sequence coverage. (D) Schematic representation of the domain structure of Homer1 isoforms and Homer1c fragments used in this study. (E) Upper panels: immunoblotting of bound proteins in (C). Lower panel: coomassie brilliant blue (CBB) stained SDS-PAGE gel shows purified recombinant proteins. (F) Mapping of SNX6-Homer1b/c interaction sites by in vitro binding assay. (G) In vitro binding assay of SNX6 and Homer family members. (H) Lysates from HEK293 cells overexpressing Flag-SNX6 and mEmerald-Homer1c were subjected to co-IP with Flag M2 beads, followed by immunoblotting with antibodies to Flag and Homer1b/c. (I) Total lysates and membrane fractions from mouse brain lysates were subjected to IP and immunoisolation with antibodies to Homer1b/c or SNX6, and antibodies to SNX6 coupled to Dynabeads Protein G, respectively. Shown are immunoblots probed with antibodies to SNX6, p150Glued, DIC, GluN1, GluN2A, GluN2B, Homer1b/c and Homer1a. (J) DIV18 neurons were immunostained with antibodies to Homer1b/c and SNX6. (K) Quantification of colocalization in (J) from 45 dendritic segments of 15 neurons (mean ± SEM, N = 3 independent experiments. Total length 1677 μm). (L) DIV18 neurons were immunostained with antibodies to Homer1b/c and EEA1. (M) Quantification of colocalization in (L) from 45 dendritic segments of 15 neurons (mean ± SEM, N = 3. Total length 1459 μm). (N) DIV18 neurons were immunostained with antibodies to EEA1, Homer1b/c, and SNX6. Superresolution images were captured by structured illumination microscopy (SIM). White arrowheads indicate overlaps of signals from different channels. Bars: 2 μm.
Figure 4—figure supplement 1
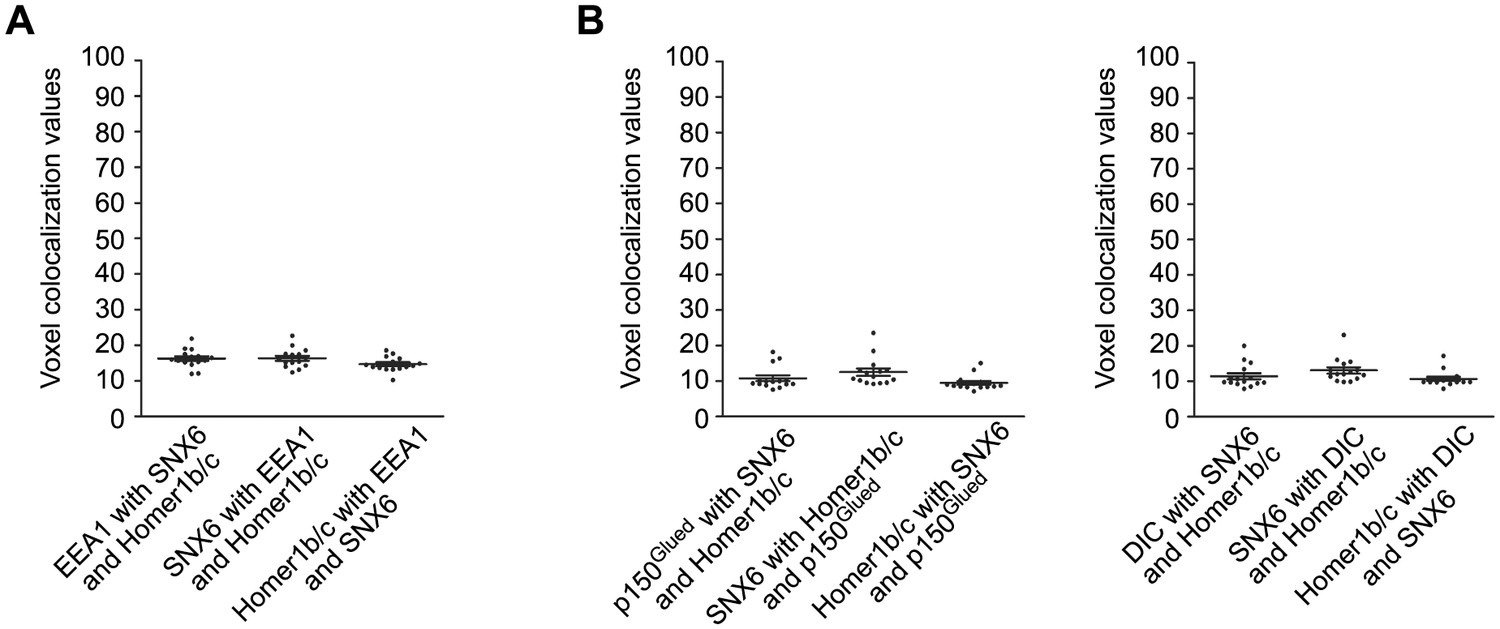
Colocalization analysis of superresolution images of triple-stained neurons captured by 3D-SIM (15 neurons for each immunostaining experiment).
Unlike colocalization analysis of 2D confocal images of double-stained neurons in other figures, we adopted the methodology developed by Fletcher et al. to measure voxel-based colocalization between three fluorophores in the 3D images (Fletcher et al., 2010). (A) Quantification result of colocalization among EEA1, SNX6 and Homer1b/c in Figure 4N. (B) Quantification result of colocalization among p150Glued/DIC, SNX6 and Homer1b/c in Figure 6D. Overlaps of signals from three channels are shown as voxel colocalization values (%). The statistical significance of colocalization values was evaluated by estimation of those occur by chance in randomized images generated by Monte Carlo Simulation as described in (Fletcher et al., 2010) and the results are shown in Table 1.
Figure 5 with 2 supplements
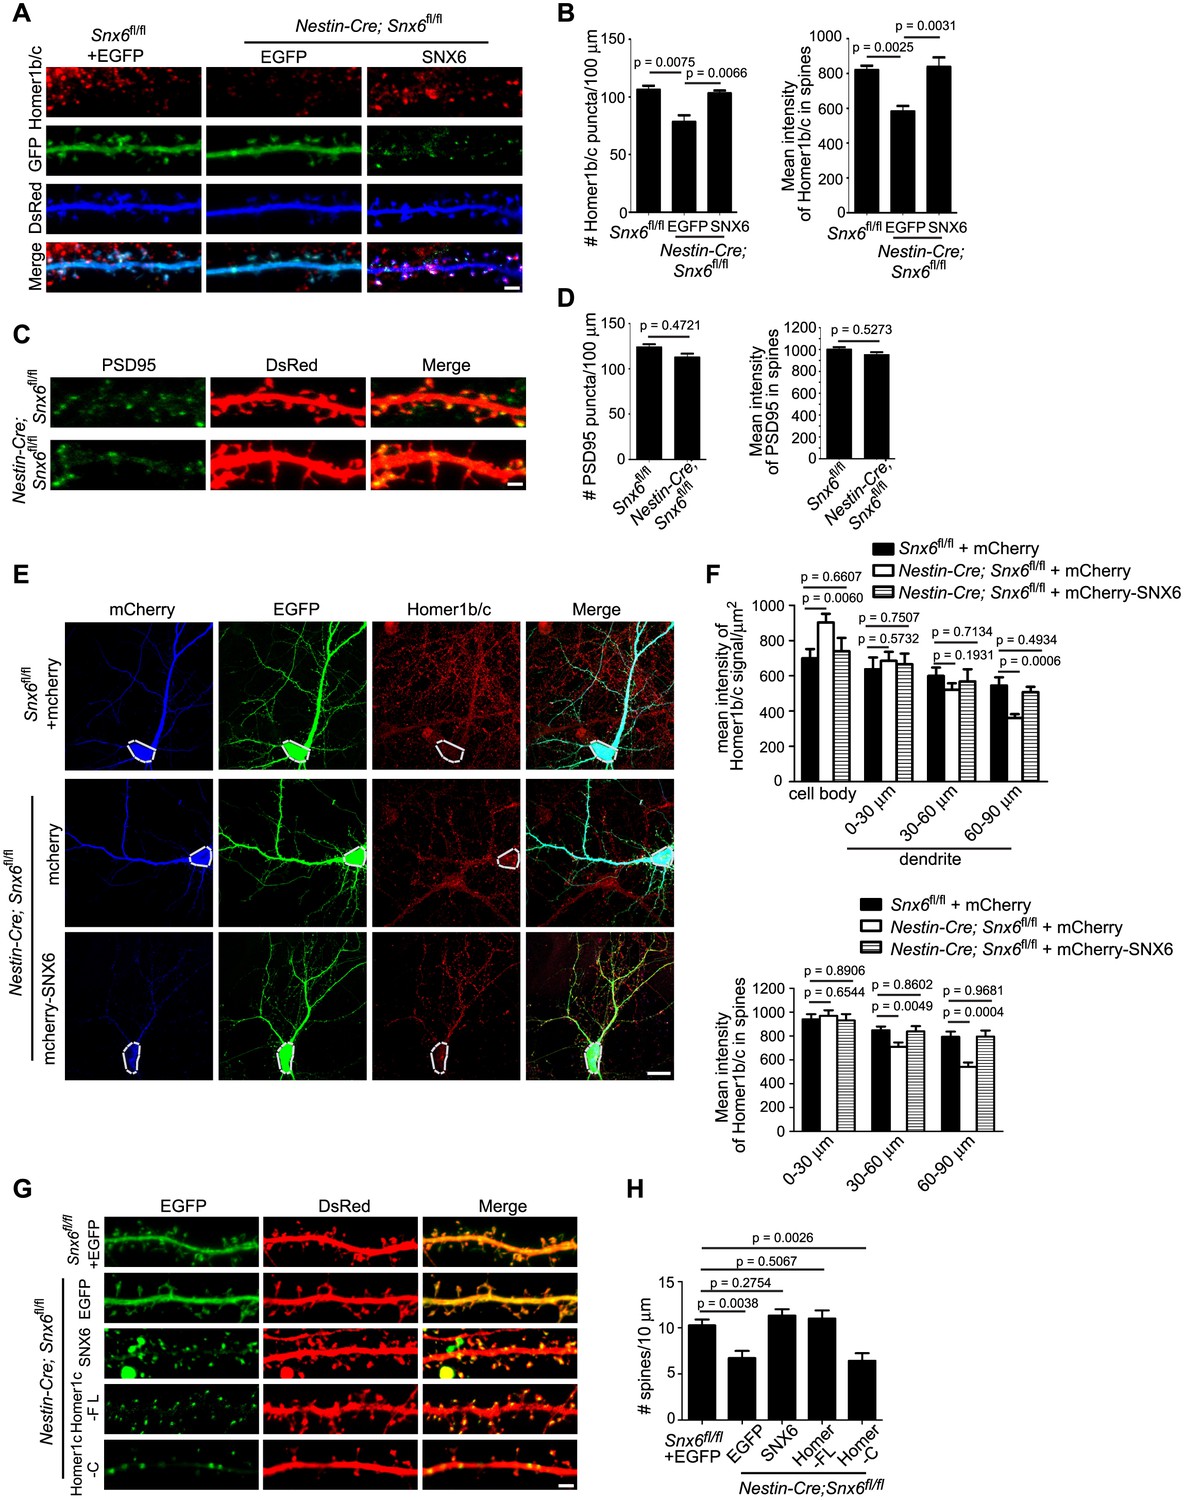
Partial loss of Homer1b/c from distal dendrites of Snx6-/- neurons.
(A) Neurons were co-transfected with pLL3.7.1 and EGFP or EGFP-SNX6 construct on DIV13, fixed on DIV18 and immunostained with antibodies to Homer1b/c. Shown are representative confocal images of dendritic segments. (B) Quantification of puncta number per 100 μm dendrite length and mean intensity in spines for Homer1b/c (mean ± SEM, n = 30, N = 3). (C) Neurons were transfected with pLL3.7.1 on DIV13, fixed on DIV18 and immunostained with antibodies to PSD95. (D) Quantification of PSD95 distribution in dendrites (mean ± SEM, n = 30, N = 3). (E) DIV14 neurons were co-transfected with constructs overexpressing EGFP and mCherry or mCherry-SNX6, fixed on DIV16 and immunostained with antibodies to Homer1b/c. shown are representative confocal images of transfected neurons. Dashed lines outline the cell bodies. (F) Quantification of Homer1b/c distribution in the cell body and dendrites, and its mean intensity in spines in (E) (mean ± SEM, n = 30, N = 3). (G) DIV13 neurons were co-transfected with constructs expressing DsRed and EGFP, EGFP-SNX6, mEmerald-Homer1c-FL or EGFP-Homer1c-C and fixed on DIV18. (H) Quantification of spine density in (G) (mean ± SEM, n = 30, N = 3). Bars: 20 μm in (E), 2 μm in other panels.
Figure 5—figure supplement 1
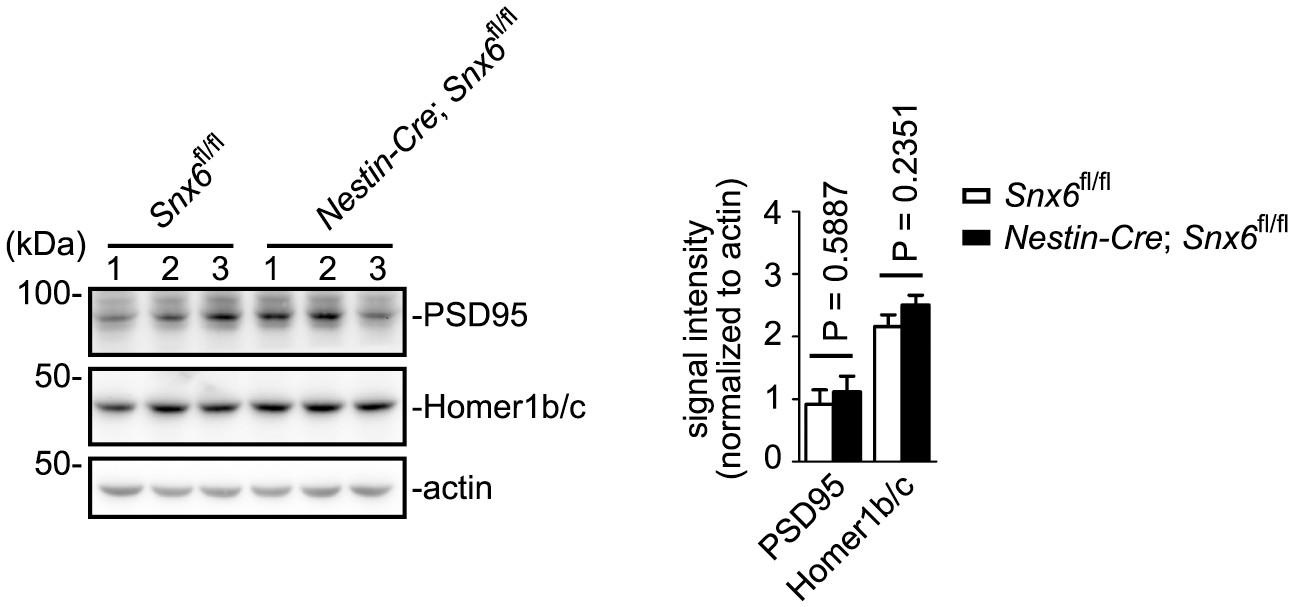
Immunoblotting analysis of Homer1b/c and PSD95 in hippocampi from Snx6fl/fl and Nestin-Cre; Snx6fl/fl mice.
β-actin serves as loading control. Shown are samples from three pairs of littermates. Data represent mean ± SEM.
Figure 5—figure supplement 2
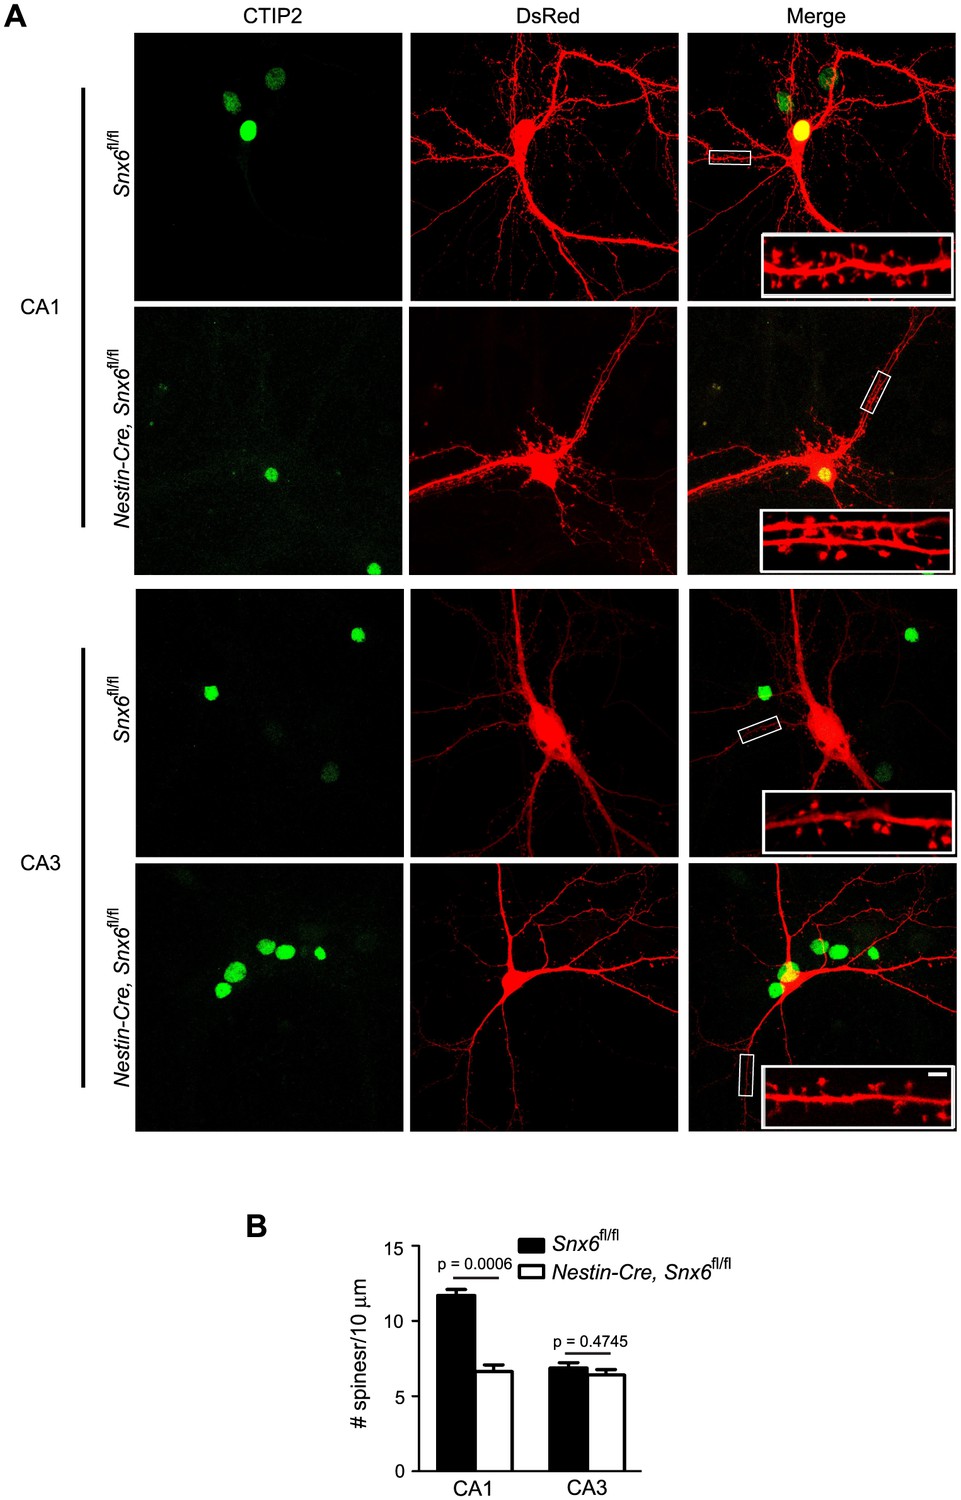
Ablation of SNX6 causes decrease in spine density of CA1 but not CA3 neurons.
(A) Hippocampal neurons in dissociated culture were transfected with pLL3.7.1 on DIV14, fixed on DIV18 and immunostained with antibodies to CTIP2, a transcription factor specifically expressed in DG and CA1, but not CA3 neurons. Compared with DG neurons, CA1/CA3 neurons have larger cell bodies and more primary dendrites. Shown are representative confocal images of CA1 and CA3 neurons. (B) Quantification of spine density in (A) (mean ± SEM, n = 30 cells, N = 3). Bar: 2 μm.
Figure 6 with 2 supplements

SNX6 is required for motility of Homer1b/c vesicles in dendritic shaft and their association with dynein−dynactin.
(A–C) Dynamic behavior of mCherry-SNX6 and mEmerald-Homer1c in distal dendrite. The last frame of motile SNX6-, Homer1c-positive puncta (arrowhead) in dendrite (A) with the respective kymograph of boxed area (B) is shown. A retrospective staining of MAP2 after live imaging (C) illuminates dendrite identity. (D) Superresolution images of DIV18 neurons immunostained with antibodies to SNX6, Homer1b/c, and p150Glued or DIC. Shown are representative images of dendrites outlined with dashed lines. White arrowheads indicate overlapped signals. (E) DIV14 neurons were transfected with construct expressing EGFP, treated with DMSO or Ciliobrevin D on DIV16 for 2 hr and immunostained with antibodies to Homer1b/c. (F) Quantification of puncta number per 100 μm dendrite length and mean intensity in spines for Homer1b/c in (E) (mean ± SEM, n = 30, N = 3). (G) Same as (E), shown are representative confocal images of EGFP-expressing neurons. Dashed lines outline the cell bodies. (H) Quantification of Homer1b/c distribution in the cell body and dendrites in (G) (mean ± SEM, n = 30, N = 3). (I) DIV14 neurons were transfected with construct overexpressing EGFP or p150Glued-N-EGFP, fixed on DIV16 and immunostained with antibodies to Homer1b/c. Dashed lines outline the cell bodies. (J) Quantification of Homer1b/c distribution in the cell body and dendrites in (I) (mean ± SEM, n = 30, N = 3). (K) Membrane fractions from mouse brain lysates were subjected to immunoisolation with antibodies to p150Glued or DIC coupled to Dynabeads Protein G, respectively. Shown are immunoblots probed with antibodies to SNX6, p150Glued, DIC, and Homer1b/c. (L) Hippocampal neurons cultured from Snx6fl/fl and Nestin-Cre; Snx6fl/fl mice were transfected with pLL3.7.1 on DIV14, fixed on DIV17 and immunostained with antibodies to Homer1b/c and p150Glued, DIC or EEA1. Shown are representative confocal images of dendritic segments. (M) Quantification of colocalization in (L) from 45 dendritic segments of 15 neurons (mean ± SEM, N = 2. Total length of dendrites: Snx6fl/fl/Nestin-Cre; Snx6fl/fl: 1247 μm/1058 μm for p150Glued; 1264 μm/1301 μm for DIC; 1244 μm/1291 μm for EEA1). Bars, 2 μm in (A), (D), (E) and (L), 20 μm in (G) and (I).
Figure 6—figure supplement 1
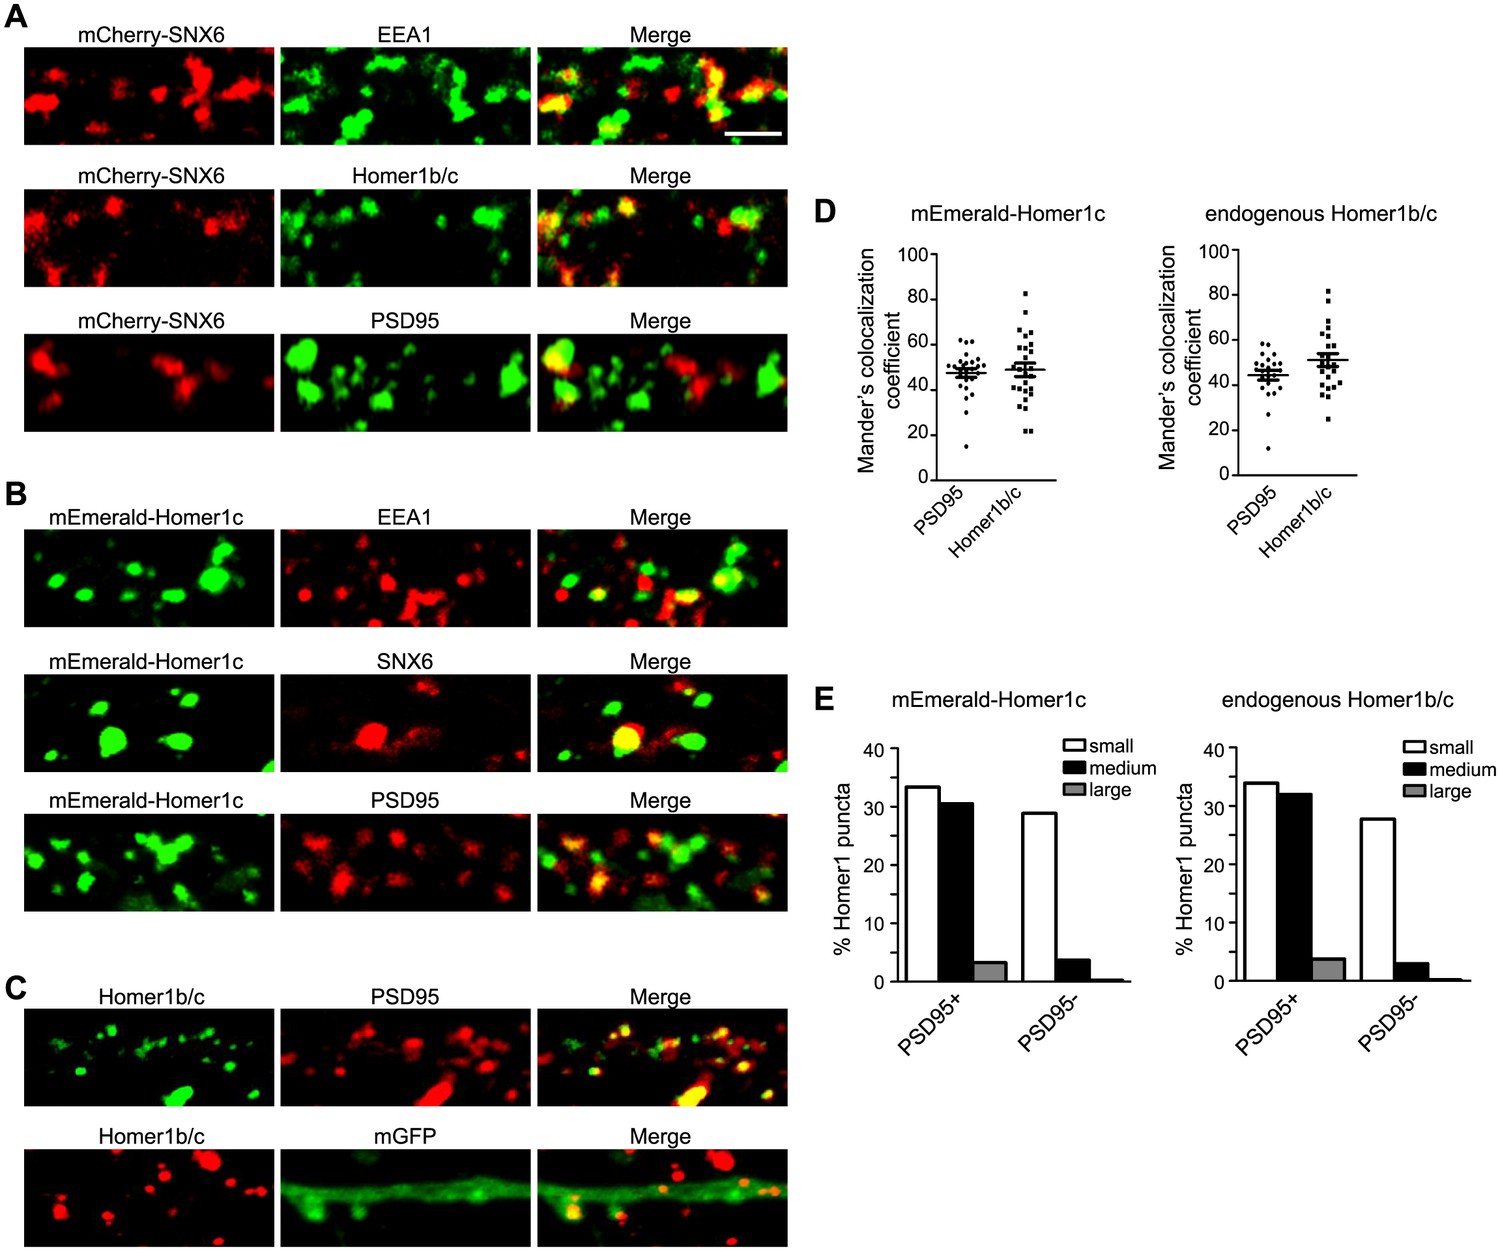
Overexpressed mCherry-SNX6 and mEmerald-Homer1c recapitulate the distribution of endogenous proteins in hippocampal neurons.
(A) Hippocampal neurons in dissociated culture were transfected with construct expressing SNX6 on DIV14, digitonin extracted and fixed on DIV16 and immunostained with antibodies to EEA1, Homer1b/c, or PSD95. Shown are the representative confocal images. (B) Hippocampal neurons in dissociated culture were transfected with construct expressing mEmerald-Homer1c on DIV14, digitonin extracted and fixed on DIV16 and immunostained with antibodies to EEA1, SNX6, or PSD95. (C) Hippocampal neurons in dissociated culture were fixed and stained with antibodies to Homer1b/c and PSD95 on DIV16, or transfected with construct expressing membrane-bound GFP (mGFP) on DIV14, digitonin extracted and fixed on DIV16 and immunostained with antibodies to Homer1b/c. (D) Quantification of colocalization between Homer1 and PSD95 in (B) and (C) (mEmerald-Homer1c, 26 dendritic segments of 13 neurons; endogenous Homer1b/c, 22 dendritic segments of 11 neurons). (E) Quantification of size distribution of PSD95-positive (+) or negative (−) Homer1 puncta in dendrites from (B) and (C). Sizes of puncta: small (0.04–0.3 μm2), medium (0.3–0.8 μm2) and large (0.8–2.0 μm2). Numbers of puncta quantified: mEmerald-Homer1c, 672 from 13 neurons; endogenous Homer1b/c, 502 from 11 neurons. Bar: 2 μm.
Figure 6—figure supplement 2
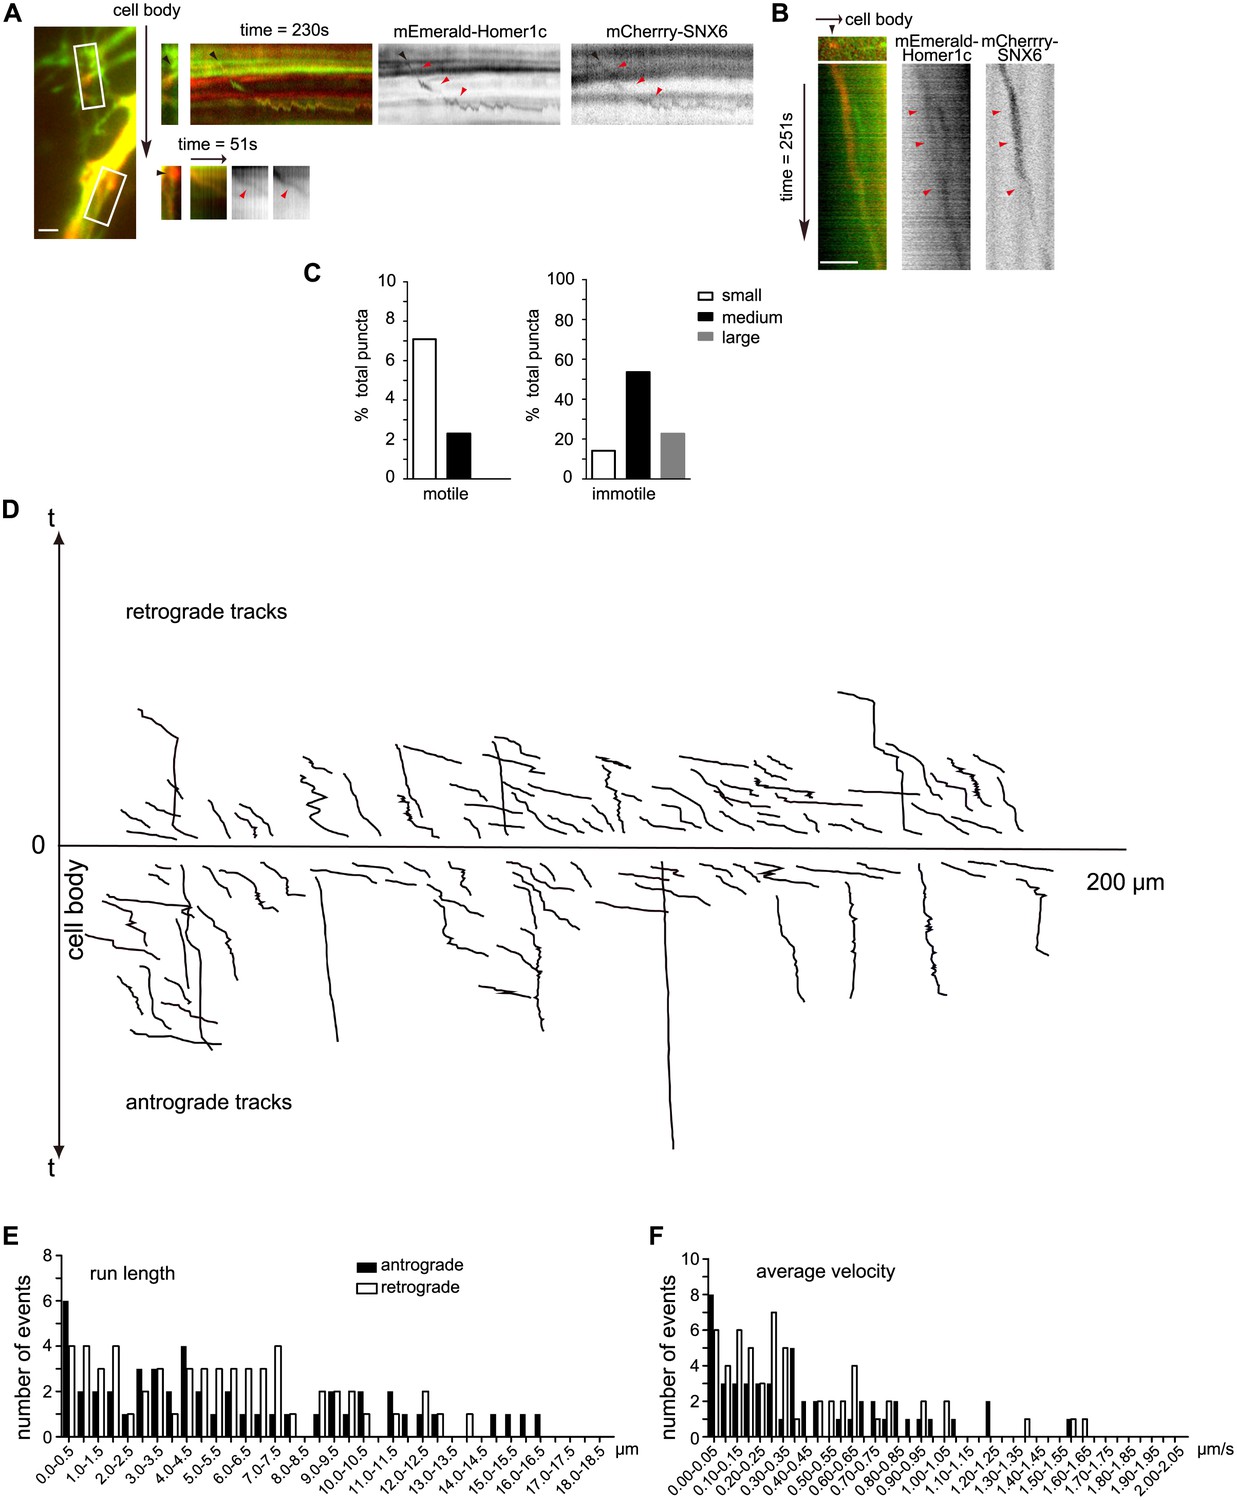
SNX6-, Homer1c-positive puncta move bidirectionally in the dendritic shaft.
(A) SNX6-, Homer1c-positive puncta in proximal dendrite move away from the cell body. Shown are the first frames of motile SNX6-, Homer1c-positive puncta in boxed areas (Left panel, black arrow indicates the relative orientation of the cell body) in proximal dendrite and the respective kymographs (right panels, black arrowheads indicate the initial position and red arrowheads indicate the trajectory of vesicles). (B) SNX6-, Homer1c-positive puncta in distal dendrite moves towards the cell body. Shown are the first frame of a motile SNX6-, Homer-positive structure (top left panel) in distal dendrite and the kymograph (all other panels). Bars: 2 μm. (C) Quantification of the size distribution of motile and immotile SNX6-, Homer1c-positive puncta in dendrites (1128 puncta from 31 neurons). Shown are the percentage of small (0.14‒0.3 μm2), medium (0.3‒0.8 μm2) and large puncta (0.8‒2.8 μm2) in the motile and immotile populations, respectively. (D) The positions of all motile SNX6 and Homer1c-positive puncta as a function of time (the trajectory of each vesicle) were aligned at their starting positions away from the cell body (106 vesicles from 31 neurons). (E and F) Histograms of frequency distribution for run lengths (E) and average velocities (F) of anterograde and retrograde motile SNX6-, Homer1b/c-positive puncta.
Figure 7
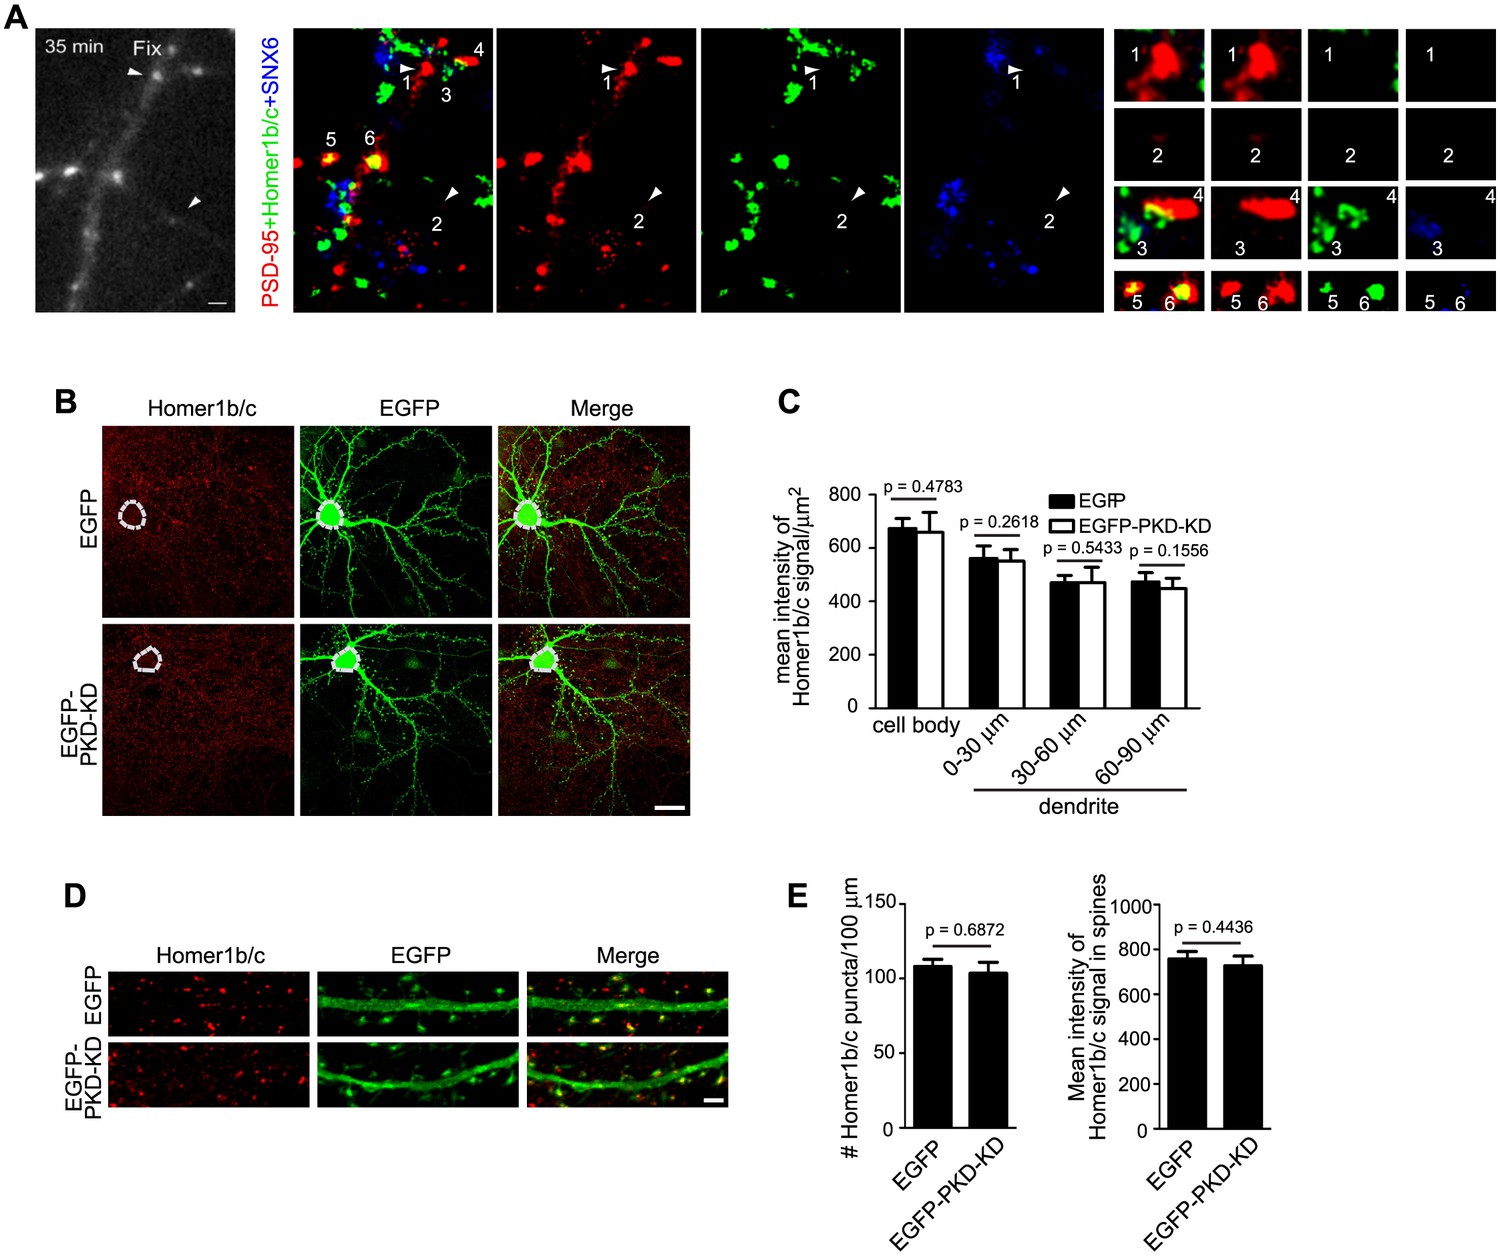
The dendritic trafficking pathway of Homer1b/c is distinct from the PSD95 and secretory trafficking pathways.
(A) TIR-FM of hippocampal neurons transfected with PSD95-RFP expressing construct. Left panel: still image of the last frame of time lapse imaging. Arrowheads mark the final positions of two motile puncta. Center panels: confocal images of retrospective staining of endogenous SNX6 and Homer1b/c after live imaging. Right panels: enlargement of arrowhead-indicated, numbered puncta in the center panels. 1 and 2: motile PSD95 puncta lacking both SNX6 and Homer1b/c; 3: vesicle containing endogenous SNX6 and Homer1b/c, but not PSD95; 4: an immobile PSD95 punctum that contacts with SNX6 signal. 5: an immobile PSD95 punctum that colocalizes with Homer1b/c. 6: an immobile PSD95 punctum that colocalizes with both Homer1b/c and SNX6. (B) DIV14 hippocampal neurons were transfected with construct overexpressing PKD-KD and immunostained with antibodies to Homer1b/c on DIV16. Shown are representative confocal images. (C) Quantification of the mean intensity of Homer1b/c signals in the cell body and dendrites in (B) (mean ± SEM, n = 30, N = 3). (D) The effect of PKD-KD overexpression on the distribution of Homer1b/c in dendrites and spines. (E) Quantification of Homer1b/c distribution in (D) (mean ± SEM, n = 30, N = 3). Bars: 1 μm in (A), 20 μm in (B), 2 μm in (D).
Figure 8

Homer1b/c enters spines by SNX6-independent protein diffusion.
(A) Representative images from a time-lapse video (Video 13) of a wild-type neuron co-expressing EGFP and mCherry-Homer1c. White solid lines indicate outline of the dendritic shaft and spines. White arrowheads indicate positions of a Homer1c-labeled structure moving in the shaft. Bar: 2 μm. (B) Spine:shaft ratios of Homer1b/c fluorescence intensity over distance from the cell body. DIV14 neurons from Snx6fl/fl and Nestin-Cre; Snx6fl/fl mice were transfected with construct overexpressing EGFP as volume marker, fixed on DIV16 and immunostained with antibodies to Homer1b/c. Shown are the ratios of the mean intensity of Homer1b/c in spines to that in the corresponding shaft (mean ± SEM, 50 spines from 15 neurons/group, N = 2 independent experiments). (C) FRAP analysis of mEmerald-Homer1c in dendritic spines. Hippocampal neurons were co-transfected with constructs expressing mEmerald-Homer1c and DsRed on DIV13. FRAP analysis was performed on DIV16. Shown are examples of the fluorescence intensity of mEmerald-Homer1c before, immediately after, 10 s and 600 s after photobleaching of the spines indicated with white circles. Bar: 1 μm. (D) Averaged fluorescence recovery curves after photobleaching for mEmerald-Homer1c in spines of Snx6+/+ (31 spines, 10 cells) and Snx6-/- (32 spines, 10 cells) neurons. Data represent mean ± SEM.
Figure 9 with 4 supplements
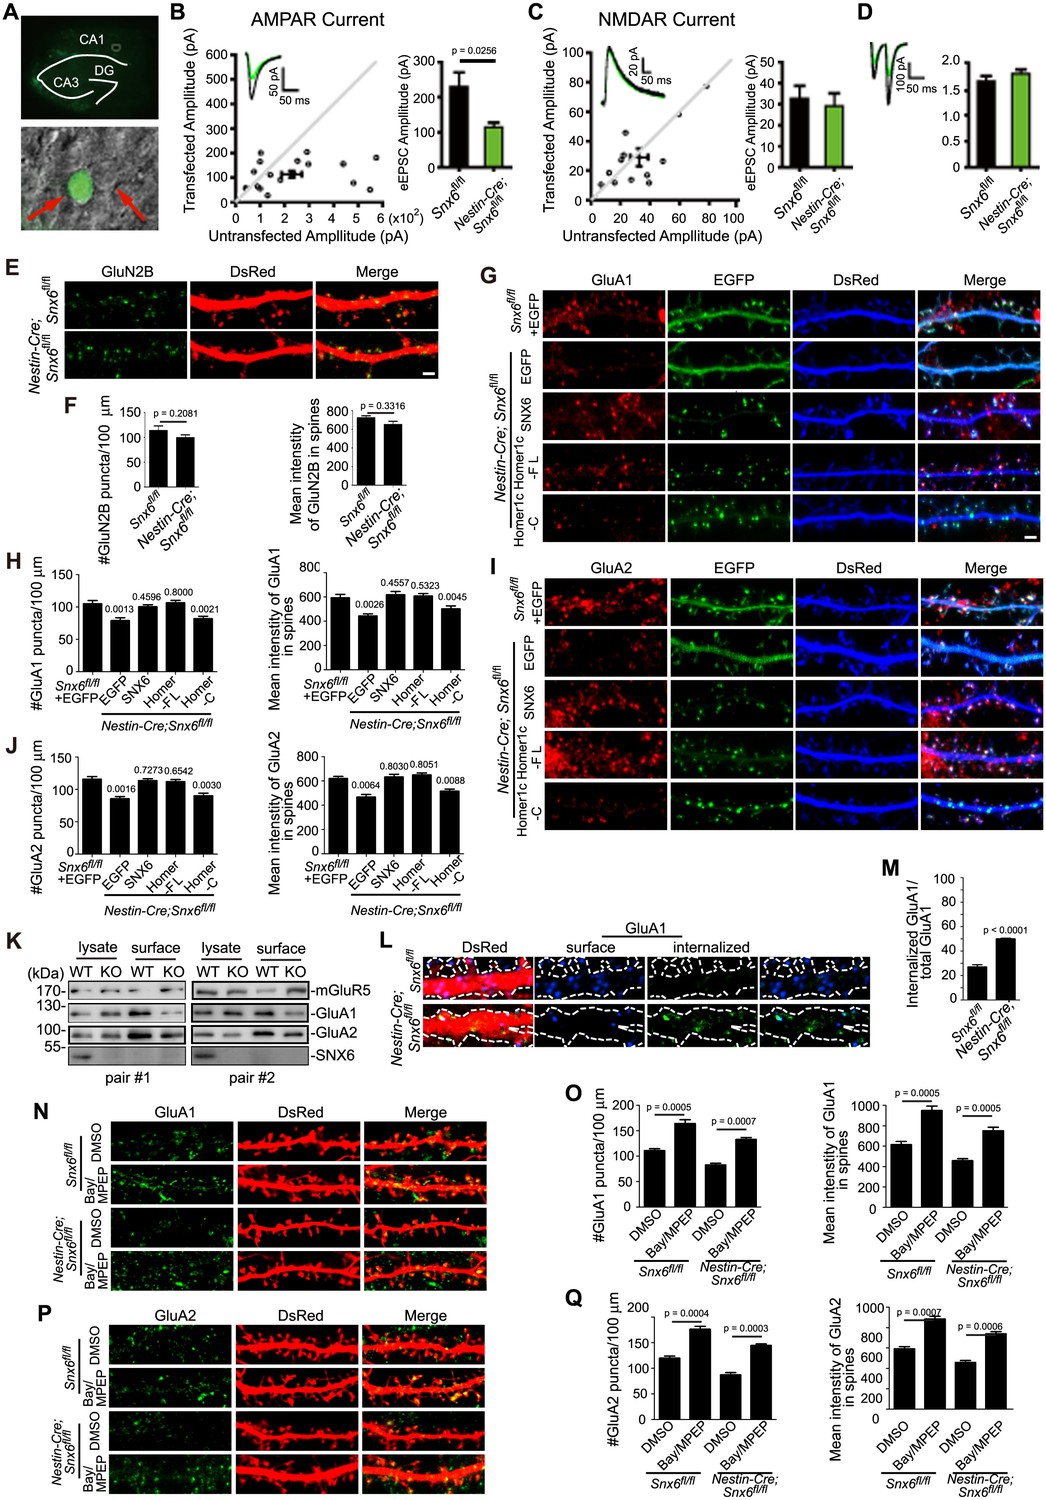
Impaired synaptic transmission and decreased surface AMPAR levels of Snx6-/- neurons.
(A) Hippocampal slice culture from Snx6fl/fl mouse was partially infected with AAV-EGFP-2A-Cre. Lower panel shows a CA1 neuron infected with AAV-EGFP-2A-Cre and an adjacent control neuron (indicated with red arrows) that were chosen to be recorded simultaneously. (B) Dual recording analysis of AMPAR-mediated synaptic responses (n = 18 pairs). Scatterplots show amplitudes of AMPAR eEPSCs (absolute values) for single pairs of neurons (open circles) and mean ± SEM (filled circle) across all neuron pairs collected. The current amplitudes of infected neurons were plotted on the ordinate and the current amplitudes of the control neurons were plotted on the abscissa. Inset shows sample current traces from an infected (green) and a control (black) neurons. Bar graph shows mean ± SEM of AMPAR amplitudes represented in the scatterplots. (C) NMDAR-mediated eEPSCs (n = 12 pairs). (D) Paired-pulse recording of AMPAR eEPSCs (n = 11 pairs). Two identical stimulus pulses were delivered in an interval of 50 ms and AMPAR eEPSCs were recorded at −70 mV. Left are sample traces of eEPSCs from a pair of infected (green) and control neurons. The paired-pulse ratio (PPR) was the enhancement of the second eEPSC relative to the first eEPSC. Bar graph shows mean ± SEM of PPRs. (E) Hippocampal neurons transfected with pLL3.7.1 were fixed on DIV18 and immunostained with antibodies to surface GluN2B. (F) Quantification of puncta number per 100 μm dendrite length and fluorescence mean intensity in spines for surface GluN2B (mean ± SEM, n = 30, N = 3). (G) DIV13 neurons were co-transfected with constructs expressing DsRed and EGFP, EGFP-SNX6, mEmerald-Homer1c-FL or EGFP-Homer1c-C, fixed on DIV18 and immunostained with antibodies to surface GluA1. (H) Quantification of signal intensity and spine distribution of surface GluA1 (mean ± SEM, n = 32, N = 3). (I) Same as (G), except that neurons were immunostained with antibodies to surface GluA2. (J) Quantification of surface GluA2 (mean ± SEM, n = 33, N = 3). (K) Hippocampal neurons from Snx6fl/fl (WT) and Nestin-Cre; Snx6fl/fl (KO) littermates were cultured till DIV16. Surface levels of mGluR5, GluA1 and GluA2 were then measured by cleavable surface biotinylation followed by immunoblotting with antibodies to mGluR5, GluA1 and GluA2. SNX6 serves as a negative control for surface proteins. Shown are immunoblots from two pairs of Snx6fl/fl and Nestin-Cre; Snx6fl/fl littermates. (L) Antibody uptake assay was performed on neurons transfected with pLL3.7.1. Shown are representative images of dendrites immunostained for internalized and surface AMPAR signals. (M) Quantification of AMPAR endocytosis rate (mean ± SEM, 45 dendritic segments, n = 15, N = 3). (N) DIV14 neurons were treated with inverse agonists for mGluRs for 48 hr, fixed and immunostained with antibodies to surface GluA1. (O) Quantification of surface GluA1 (mean ± SEM, n = 30, N = 3). (P) Same as (N), except that neurons were immunostained with antibodies to surface GluA2. (Q) Quantification of surface GluA2 (mean ± SEM, n = 30, N = 3). Bar: 2 μm.
Figure 9—figure supplement 1
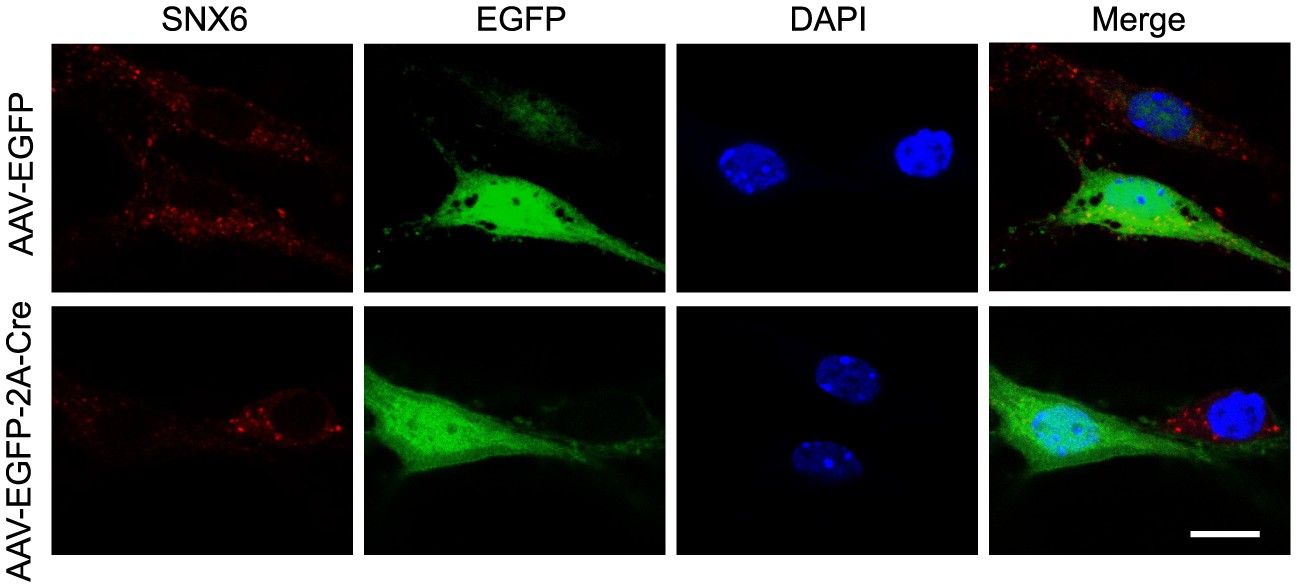
Cre-mediated knockout of SNX6 in cultured neurons.
Hippocampal neurons in dissociated culture from Snx6fl/fl mice were infected with AAVs expressing pAOV-CaMKIIα-EGFP-2A-3Flag or pAOV-CaMKIIα-EGFP-2A-Cre on DIV12, fixed on DIV18 and immunostained with antibodies to SNX6. Shown are representative confocal images. Bar: 10 μm.
Figure 9—figure supplement 2
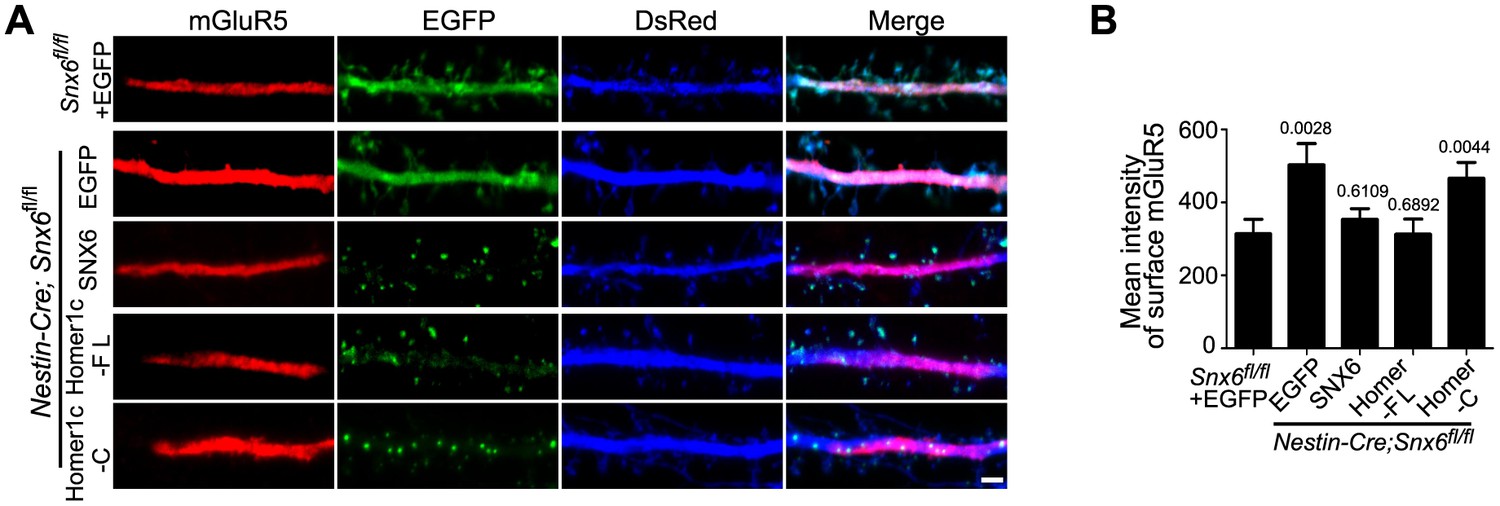
Ablation of SNX6 causes an increase in surface expression of mGluR5 in hippocampal neurons, which is rescued by SNX6 or Homer1c.
(A) DIV13 neurons were transfected with constructs expressing DsRed and EGFP, EGFP-SNX6, mEmerald-Homer1c-FL or EGFP-Homer1c-C, fixed on DIV18 and immunostained with antibodies to surface-expressed mGluR5. (B) Quantification of surface mGluR5 fluorescence intensity per μm2 (mean ± SEM, n = 30, N = 3, the exact p values are indicated in the bar graph). Bar: 2 μm.
Figure 9—figure supplement 3
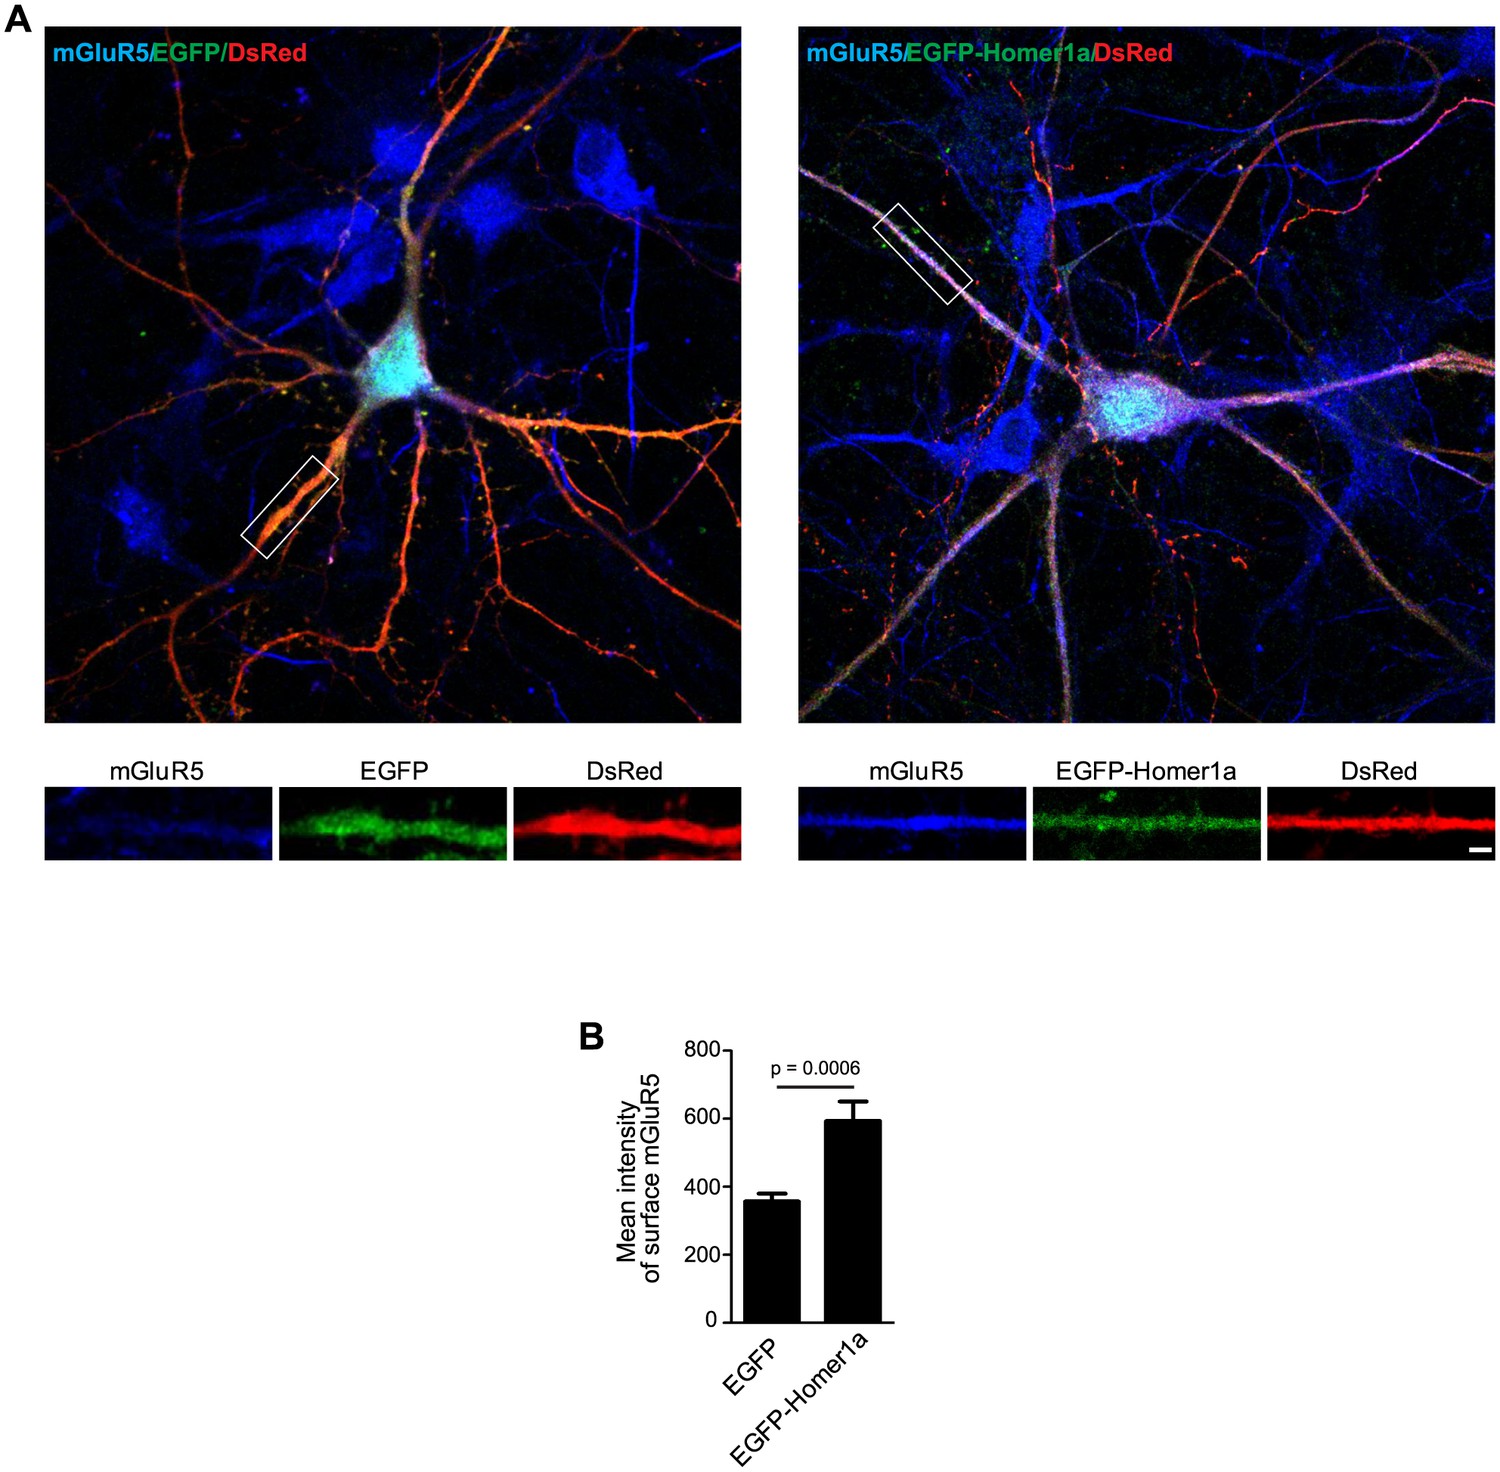
Homer1a overexpression increases surface mGluR5 expression.
This experiment serves as a control for Figure 9—figure supplement 2 and is in agreement with previous reports (Ango et al., 2002). (A) Hippocampal neurons were co-transfected with pLL3.7.1 and EGFP-Homer1a or EGFP construct on DIV13, and fixed on DIV18. Surface mGluR5 expressions were immunostained with antibodies to mGluR5. (B) Quantification of surface mGluR5 signal in (A) (mean ± SEM, n = 30 cells, N = 3). Bar: 2 μm.
Figure 9—figure supplement 4
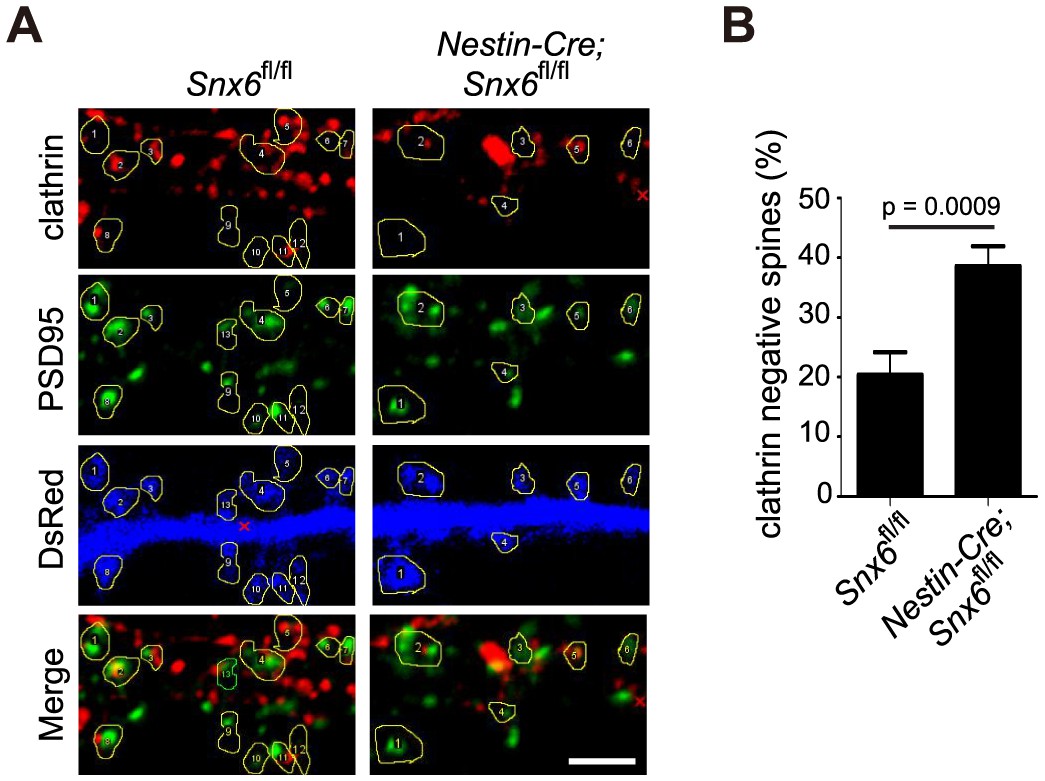
Ablation of SNX6 causes a decrease in the number of clathrin positive synapses.
(A) Hippocampal neurons in dissociated culture from Snx6fl/fl and Nestin-Cre; Snx6fl/fl littermates were immunostained with antibodies to clathrin heavy chain and PSD95. Dendritic spines are outlined for quantification. (B) Quantification of the number of synapses without clathrin signal (mean ± SEM, n = 30 cells, N = 3). Bar: 2 μm.
Figure 10 with 2 supplements
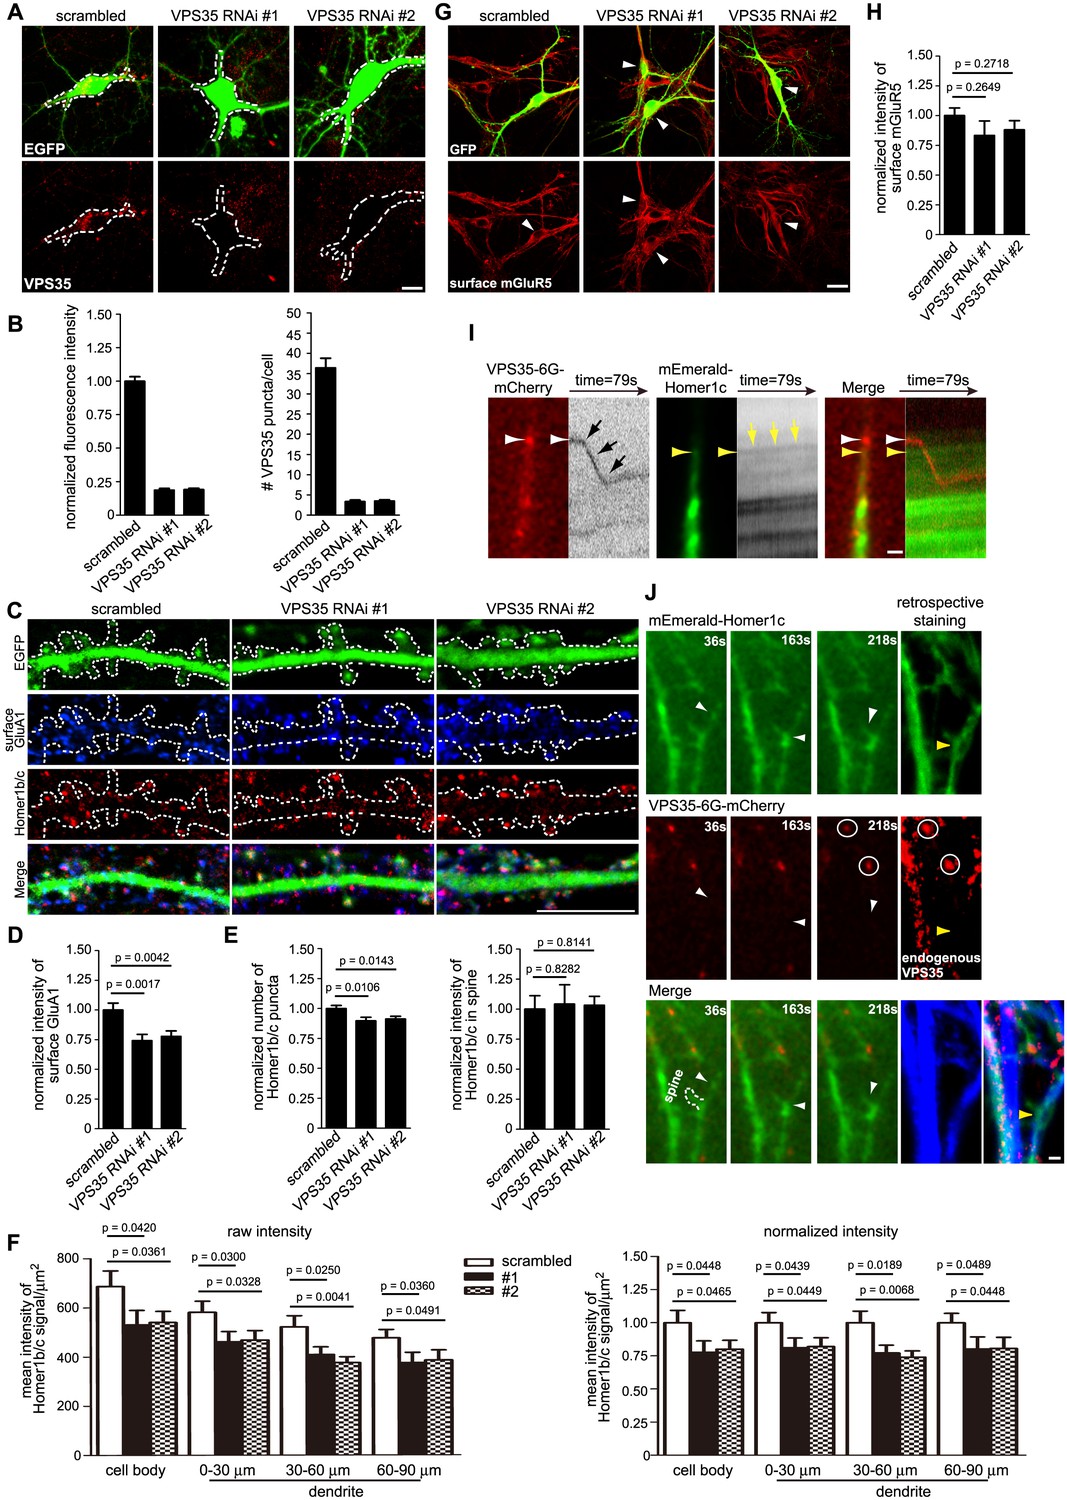
The retromer core complex is not required for SNX6-regulated dendritic distribution of Homer1b/c.
(A) Hippocampal neurons were transfected with lentiviral vector expressing siRNA along with GFP at DIV12, fixed on DIV18 and immunostained with antibodies to VPS35. (B) Quantification of VPS35 signal intensity and puncta number in neurons in (A) (mean ± SEM, n = 10, N = 3). (C) Neurons transfected with siRNA constructs were immunostained with antibodies to surface GluA1 and Homer1b/c. (D–E) Quantification of surface GluA1 (D) (mean ± SEM, scrambled: 33 neurons; VPS35 RNAi #1: 30 neurons; VPS35 RNAi #2: 30 neurons, N = 3.) or Homer1b/c distribution in spines (E) (mean ± SEM, scrambled: 35 neurons; VPS35 RNAi #1: 32 neurons; VPS35 RNAi #2: 30 neurons. N = 3 ). (F) Quantification of Homer1b/c distribution in the cell body and dendrites of hippocampal neurons expressing scrambled or VPS35-targeting siRNA (mean ± SEM, n = 15, N = 3). The results show a decrease in signal intensity of Homer1b/c throughout the cell when VPS35 was depleted. (G) Same as (C), except that neurons were immunostained with antibodies to surface mGluR5. (H) Quantification of surface mGluR5 in (G) (mean ± SEM, scrambled: 35 neurons; VPS35 RNAi #1: 44 neurons; VPS35 RNAi #2: 52 neurons. N = 3 ). (I–J) TIR-FM of hippocampal neurons transfected with Homer1c and VPS35-expressing constructs. Shown in (I) is a VPS35-positive vesicle (white arrow) moving away from the cell body and bypassing a static Homer1c-positive structure (yellow arrow) with their respective kymographs to the right. Shown in (J) are still images of representative time points: a Homer1c-positive structure reached the base of spine and part of which entered the spine after a brief lag. White arrowheads indicate the mobile Homer1c structure. A retrospective staining of MAP2 and VPS35 after live imaging (right panels) illuminates the dendrite identity and the absence of endogenous VPS35 at the base of the spine. Yellow arrowhead indicates the position of the Homer1c-positive structure right before fixation. White circles indicate VPS35 puncta appearing in both retrospective staining and live imaging. Bars: 5 μm in (A) and (C), 20 μm in (G) and 1 μm in (I) and (J).
Figure 10—figure supplement 1
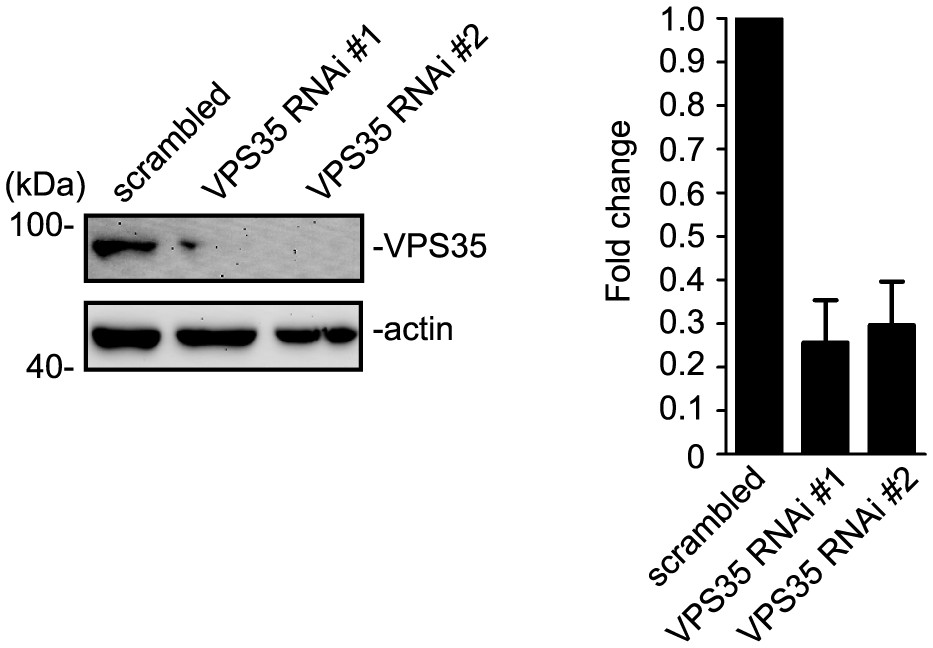
VPS35 is efficiently knocked down in HEK293 cells.
HEK 293 cells were transfected with lentiviral vector expressing siRNA along with EGFP followed by immunoblotting with antibodies to VPS35 and β-actin after 72 hr. The relative amount of VPS35 was determined with NIH ImageJ (N = 3 experiments).
Figure 10—figure supplement 2
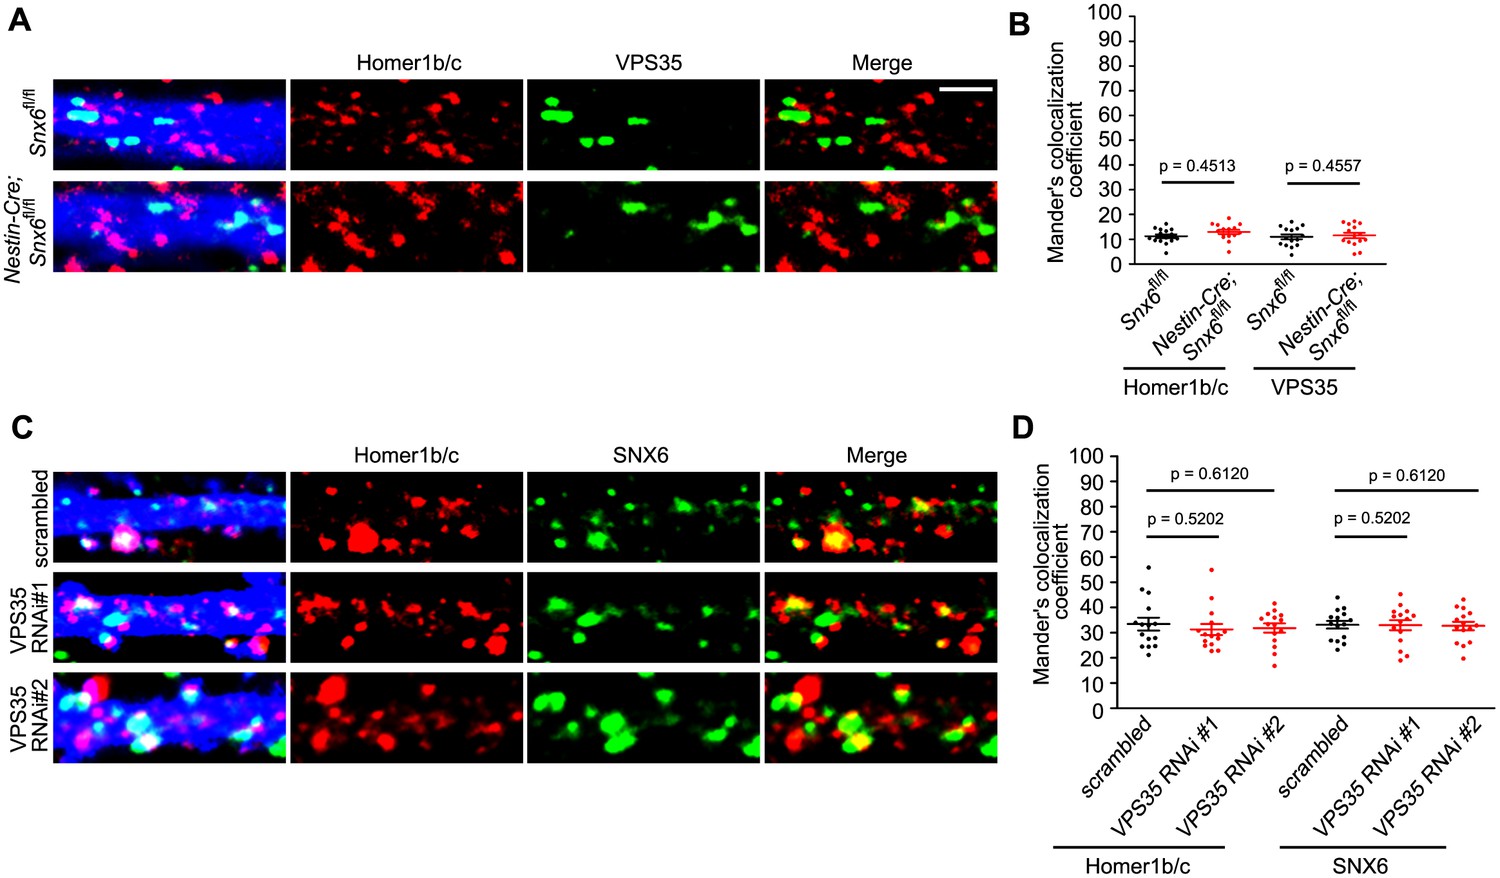
Colocalization of Homer1b/c with VPS35 does not require SNX6 and vice versa.
(A) Hippocampal neurons in dissociated culture from Snx6fl/fl and Nestin-Cre; Snx6fl/fl littermates were transfected with pLL3.7.1 on DIV14, immunostained with antibodies to Homer1b/c and VPS35 on DIV17. Shown are representative confocal images. (B) Quantification of colocalization in (A) from 45 dendritic segments of 15 neurons (mean ± SEM). (C) Hippocampal neurons were transfected with lentiviral vector expressing siRNA along with EGFP on DIV12, fixed on DIV18 and immunostained with antibodies to Homer1b/c and SNX6. Shown are representative confocal images. (D) Quantification of colocalization in (C) from 30–45 dendritic segments of 15 neurons (mean ± SEM). Bar: 2 μm.
Author response image 1

Quantitative analysis of VPS35 knockdown efficiency.
(A) HEK 293 cells were transfected with lentiviral vector expressing siRNA along with EGFP followed by immunoblotting with antibodies to VPS35 and β-actin after 72 h. Right panel shows quantification of immunoblots. Relative amount of VPS35 was determined with NIH ImageJ (N = 3 experiments). (B) Hippocampal neurons were transfected with lentiviral vector expressing siRNA along with GFP at DIV12, fixed on DIV18 and immunostained with antibodies to VPS35. Right panels are quantification of VPS35 signals in the outlined area of neurons (mean ± SEM, n = 10 neurons from three independent experiments). Scale bar, 5 μm.
Author response image 2
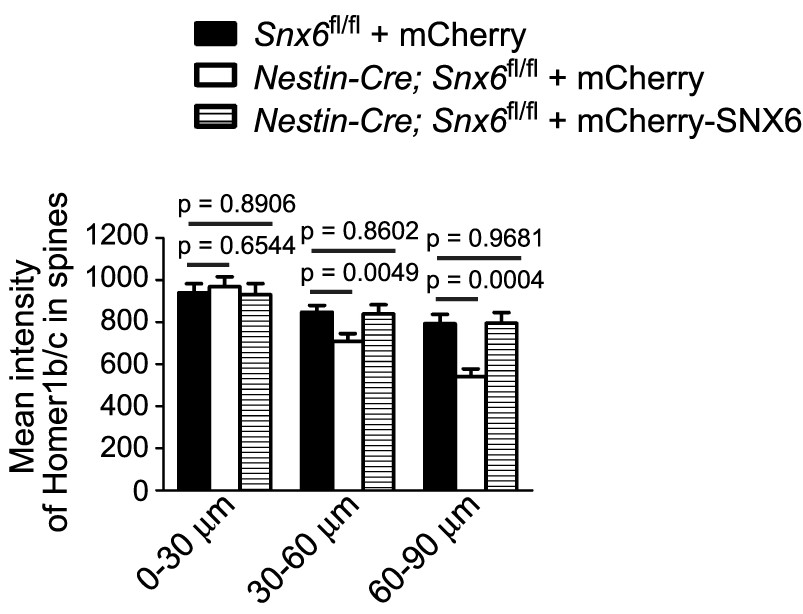
DIV14 neurons were cotransfected with constructs overexpressing EGFP and mCherry or mCherry-SNX6, fixed on DIV16 and immunostained with antibodies to Homer1b/c.
Shown is quantification of Homer1b/c signal intensity in dendritic spines over distance from the cell body (mean ± SEM, n = 30, N = 3).
Videos
Video 1
3D-SIM movie of an enlarged region of interest from a hippocampal neuron dendrite shows the association of EEA1 (red), SNX6 (green) and Homer1b/c (blue).
https://doi.org/10.7554/eLife.20991.010
Video 2
Time-lapse live imaging showing movement of Homer1c-labeled and SNX6-labeled puncta in proximal dendrites.
Hippocampal neurons co-transfected with Emerald-Homer1c and mCherry-SNX6 expressing constructs were imaged live by TIR-FM. The trajectories of two mobile Homer1c-, SNX6-positive puncta are indicated by white arrowheads. Images were acquired at 2 frames/s. Video plays at 50 frames/s. Bar: 2 μm.
Video 3
Time-lapse live imaging showing movement of Homer1c-labeled and SNX6-labeled puncta in distal dendrites.
Hippocampal neurons co-transfected with Emerald-Homer1c and mCherry-SNX6 expressing constructs were imaged live by TIR-FM. The trajectories of two mobile Homer1c-, SNX6-positive puncta are indicated by white and yellow arrowheads respectively. Images were acquired at 2 frames/s. Video plays at 50 frames/s. Bar: 2 μm.
Video 4
Time-lapse live imaging showing movement of Homer1b-labeled and SNX6-labeled structures in a distal dendrite.
Hippocampal neurons co-transfected with mEmerald-Homer1b and mCherry-SNX6 expressing constructs were imaged live by TIR-FM. The trajectory of a mobile Homer1b-, SNX6-positive structure is indicated by white arrowheads. Images were acquired at 2 frames/s. Video plays at 50 frames/s. Bar: 2 μm.
Video 5
Time-lapse live imaging showing movement of GluN1-labeled vesicles in dendrite.
Hippocampal neurons co-transfected with mCherry-SNX6 and GluN1-EGFP expressing construct were imaged live by TIR-FM. The trajectory of the mobile GluN1-positive, SNX6-negative vesicle is indicated by white arrowheads. Images were acquired at 2 frames/s. Video plays at 50 frames/s. Bar: 1 μm.
Video 6
Time-lapse live imaging showing movement of EEA1- and SNX6-labeled vesicles in dendrite.
Hippocampal neurons co-transfected with EEA1-YFP and mCherry-SNX6 expressing constructs were imaged live by TIR-FM. The trajectories of two mobile EEA1-, SNX6-positive vesicles are indicated by white arrowheads. Images were acquired at 2 frames/s. Video plays at 50 frames/s. Bar: 1 μm.
Video 7
Time-lapse live imaging showing movement of EEA1- and Homer1c-labeled vesicles in dendrite.
Hippocampal neurons co-transfected with EEA1-YFP and mCherry-Homer1c expressing constructs were imaged live by TIR-FM. Yellow arrowheads indicate the trajectory of an EEA1-, Homer1c-positive vesicle detaching and moving away from a large structure, suggesting fission and formation of transport carriers from early endosomes. White arrowheads indicate the trajectory of another vesicle moving in the dendritic shaft. Images were acquired at 2 frames/s. Video plays at 50 frames/s. Bar: 1 μm.
Video 8
Time-lapse live imaging showing movement of Rab7- and Homer1c-labeled structures in the dendrite of a wild-type neuron.
Snx6+/+ hippocampal neurons co-transfected with Rab7-RFP and mEmerald-Homer1c expressing constructs were imaged live by TIR-FM. Images were acquired at 2 frames/s. Video plays at 50 frames/s. Bar: 1 μm.
Video 9
Time-lapse live imaging showing movement of Rab7- and Homer1c-labeled structures in the dendrite of a Snx6 KO neuron.
Snx6-/- hippocampal neurons co-transfected with Rab7-RFP and mEmerald-Homer1c expressing constructs were imaged live by TIR-FM. Images were acquired at 2 frames/s. Video plays at 50 frames/s. Bar: 1 μm.
Video 10
3D-SIM movie of an enlarged region of interest from a hippocampal neuron dendrite shows association of p150Glued (red), SNX6 (green) and Homer1b/c (blue).
https://doi.org/10.7554/eLife.20991.025
Video 11
3D-SIM movie of an enlarged region of interest from a hippocampal neuron dendrite shows the association of DIC (red), SNX6 (green) and Homer1b/c (blue).
https://doi.org/10.7554/eLife.20991.026
Video 12
Time-lapse live imaging showing movement of PSD95-RFP-labeled puncta in dendrites.
Hippocampal neurons transfected with PSD95-RFP expressing construct were imaged live by TIR-FM. White arrowheads indicate two mobile puncta followed by fixation. Images were acquired at 2 frames/s. Video plays at 50 frames/s. Bar: 1 μm.
Video 13
A motile Homer1c-labeled structure in dendritic shaft did not enter spines.
Snx6+/+ hippocampal neurons co-transfected with EGFP and mCherry-Homer1c expressing constructs were imaged live by TIR-FM. Images were acquired at 2 frames/s. Video plays at 10 frames/s. White solid lines indicate outline of the shaft and spines. White arrowheads indicate the trajectory of a Homer1c-labeled structure moving in the dendritic shaft. Bar: 1 μm.
Video 14
A motile Homer1c-labeled structure in dendritic shaft entered a spine.
Snx6+/+ hippocampal neurons co-transfected with EGFP and mCherry-Homer1c expressing constructs were imaged live by TIR-FM. Images were acquired at 2 frames/s. Video plays at 10 frames/s. White solid lines indicate outline of the shaft and spines. White arrowheads indicate the trajectory of a Homer1c-labeled structure entering a spine. Bar: 1 μm.
Video 15
Time-lapse live imaging showing movement of a VPS35 vesicle in dendrite.
Hippocampal neurons co-transfected with mEmerald-Homer1c and VPS35-6G-mCherry expressing constructs were imaged live by TIR-FM. White arrowheads indicate the trajectory of a VPS35-positive vesicle moving away from the cell body and bypassing a static Homer1c-positive structure (indicated with yellow arrowhead). Images were acquired at 2 frames/s. Video plays at 50 frames/s. Bar: 1 μm.
Video 16
Time-lapse live imaging showing movement of Homer1c and VPS35 puncta in dendrites.
Hippocampal neurons co-transfected with mEmerald-Homer1c and VPS35-6G-mCherry expressing construct were imaged live by TIR-FM. White arrowheads indicate the initial and pausal sites of a Homer1c-positive, VPS35-negative structure. Yellow arrowhead indicates the spine position. Images were acquired at 2 frames/s. Video plays at 50 frames/s. Bar: 1 μm.
Tables
Table 1
Quantitative analysis of colocalization of signals in superresolution images and statistical significance of colocalization (related to Figures 4N and 6D, and Figure 4—figure supplement 1).
| voxel colocolization values (%) / | |||||||||||||||
|---|---|---|---|---|---|---|---|---|---|---|---|---|---|---|---|
| EEA1-SNX6-Homer1b/c | |||||||||||||||
| EEA1 with SNX6 and Homer1b/c | 15.68/ | 12.05/ | 17.48/ | 15.18/ | 16.92/ | 16.48/ | 15.33/ | 18.86/ | 15.76/ | 11.96/ | 21.87/ | 15.98/ | 14.58/ | 16.76/ | 19.04/ |
| SNX6 with EEA1 and Homer1b/c | 18.56/ | 13.12/ | 17.28/ | 13.96/ | 17.44/ | 12.36/ | 15.92/ | 22.64/ | 15.08/ | 14.32/ | 16.34/ | 19.92/ | 15.12/ | 15.44/ | 17.56/ |
| Homer1b/c with EEA1 and SNX6 | 14.24/ | 13.16/ | 13.64/ | 10.22/ | 16.28/ | 16.84/ | 13.24/ | 13.92/ | 14.84/ | 14.52/ | 18.56/ | 15.36/ | 13.92/ | 13.44/ | 17.63/ |
| p150Glued-SNX6-Homer1b/c | |||||||||||||||
| p150Glued with SNX6 and Homer1b/c | 15.63/ | 8.13/ | 10.06/ | 10.06/ | 10.06/ | 10.06/ | 10.06/ | 10.06/ | 10.06/ | 7.62/ | 16.38/ | 9.35/ | 8.85/ | 9.97/ | 9.21/ |
| SNX6 with Homer1b/c and p150Glued | 14.57/ | 12.89/ | 10.41/ | 13.02/ | 10.18/ | 12.67/ | 18.49/ | 12.33/ | 9.51/ | 9.54/ | 23.55/ | 11.24/ | 9.39/ | 9.18/ | 10.7/ |
| Homer1b/c with SNX6 and p150Glued | 10.32/ | 8.27/ | 8.33/ | 7.15/ | 9.66/ | 9.8/ | 13.16/ | 8.49/ | 8.73/ | 8.69/ | 15.07/ | 9.17/ | 8.24/ | 8.43/ | 9.03/ |
| DIC-SNX6-Homer1b/c | |||||||||||||||
| DIC with SNX6 and Homer1b/c | 9.21/ | 9.65/ | 20.05/ | 7.9/ | 13.41/ | 15.25/ | 9.91/ | 10.88/ | 9.41/ | 8.53/ | 10.61/ | 9.64/ | 9.78/ | 10.98/ | 16.12/ |
| SNX6 with DIC and Homer1b/c | 12.00/ | 13.19/ | 14.91/ | 12.02/ | 13.07/ | 15.49/ | 11.32/ | 9.81/ | 10.1/ | 16.07/ | 10.79/ | 12.48/ | 11.77/ | 9.86/ | 23.11/ |
| Homer1b/c with DIC and SNX6 | 11.43/ | 9.81/ | 13.78/ | 9.82/ | 10.71/ | 10.86/ | 9.77/ | 9.82/ | 9.22/ | 10.36/ | 9.75/ | 7.87/ | 9.73/ | 10.21/ | 17.17/ |
Download links
A two-part list of links to download the article, or parts of the article, in various formats.
Downloads (link to download the article as PDF)
Open citations (links to open the citations from this article in various online reference manager services)
Cite this article (links to download the citations from this article in formats compatible with various reference manager tools)
Ablation of SNX6 leads to defects in synaptic function of CA1 pyramidal neurons and spatial memory
eLife 6:e20991.
https://doi.org/10.7554/eLife.20991


