Proliferation-independent regulation of organ size by Fgf/Notch signaling
- Stowers Institute for Medical Research, United States
- Skirball Institute of Biomolecular Medicine, New York University Langone Medical Center, United States
Figures
Figure 1 with 1 supplement
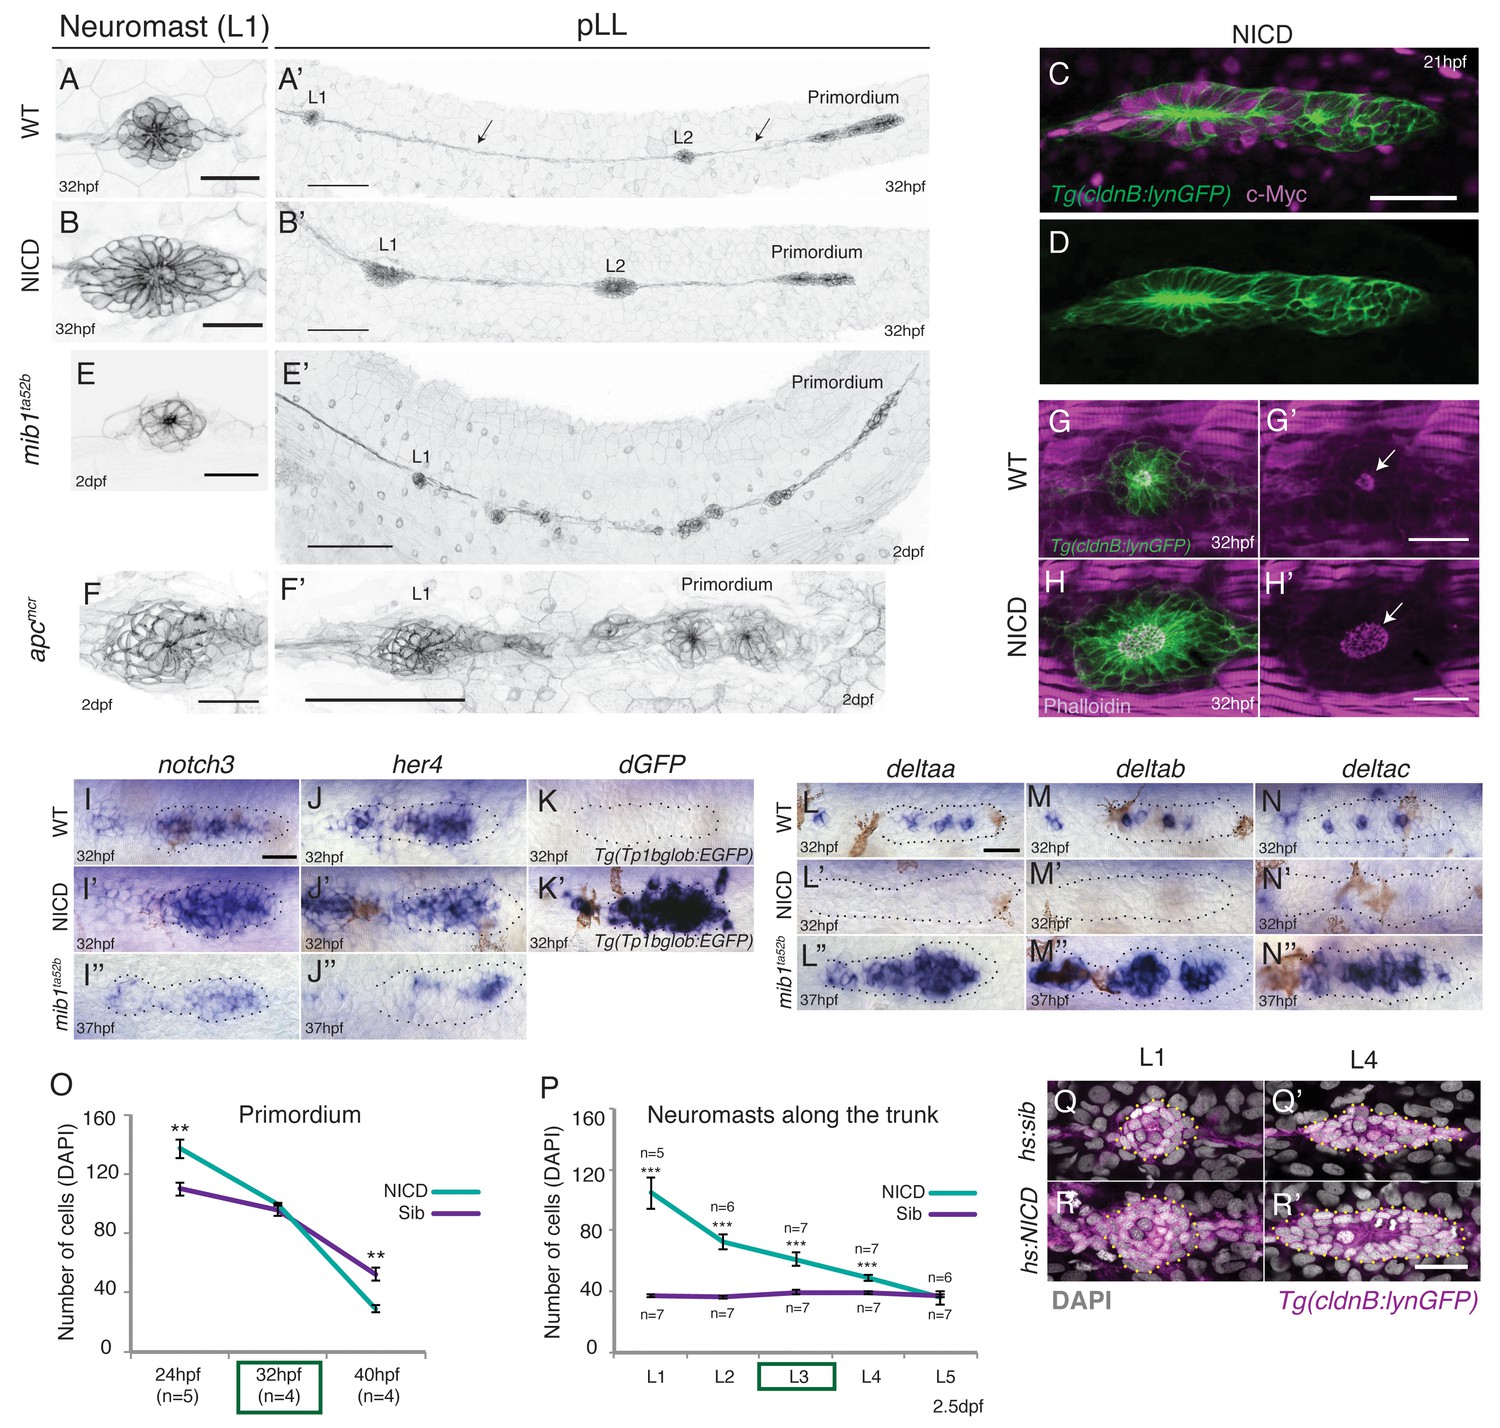
Induction of Notch signaling induces larger lateral line organs.
(A and B and E and F) First deposited trunk neuromasts (L1) in Tg(cldnB:lynGFP). (B) NICD and (F) apcmcr neuromasts are larger than (A) WT and (E) mib1ta52b neuromasts. Scale bar is 25 μm. (A’ and B’ and E’ and F’) Posterior lateral line in Tg(cldnB:lynGFP). (A’) WT, (B’) NICD, (E’) mib1ta52b and (F’) apcmcr. Scale bar is 100 μm. (C and D) NICD transgenic embryos are labeled by a Myc-tag. The c-Myc antibody in magenta. Scale bar is 50 μm. (G–H’) L1 neuromasts stained with Phalloidin at 32 hpf. In NICD neuromasts (H and H’) the apical F-actin meshwork (arrow) is larger compared to wildtype (WT) (G and G’), suggesting that NICD neuromasts are composed of more apically constricted cells. Scale bar is 25 μm. (I–N’’) Expression of Notch pathway genes in the primordium. (I’) notch3, (J’) her4 and dgfp in the Notch reporter Tg(Tp1bglob:EGFP) (K’) are upregulated in NICD primordia compared to WT (I and J and K) and mib1ta52b (I’’ and J’’) primordia. The Notch reporter only seems to be activated by high levels of Notch signaling, as it is not active in wildtype primordia (K), even though the Notch target her4 is expressed (J). Scale bar is 25 μm. (L–N’’) Expression of delta ligands in the primordium. (L’) deltaa, (M’) deltab and deltac (N’) are largely downregulated in NICD compared to WT (L and M and N) and mib1ta52b (L’’ and M’’ and N’’) primordia. Scale bar is 25 μm. (O) NICD and sibling primordia sizes decrease overtime. NICD primordia start out (24 hpf) with significantly more cells compared to sibling primordia, but after the second deposition cycle at ~32 hpf NICD and sibling primordia have a similar amount of cells. By 40 hpf NICD primordia are composed of significantly less cells. Error bars represent standard error (p<0.01=** Student’s t test). (P) NICD neuromasts (L1-4) along the trunk of the embryo at 2.5 dpf consist of significantly more cells compared to siblings. NICD primordia deposit big neuromasts, even at 32 hpf when NICD and sibling primordia possess the same cell number (time point (32 hpf) is marked in the (O) green box, also see L3 deposition in the Video 3). Error bars indicate standard error (p<0.001=*** Student’s t test). (Q–R’) Notch activation in hs:NICD embryos after the primordium and ganglion have separated still significantly increases neuromast sizes (R’) compared to a (Q’) sibling (see Figure 1—figure supplement 1E for quantification). These results indicate that the number of cells in neuromasts is independent of primordium size. Notch overexpression was induced by a 39°C heat-shock for 45 min starting at 25 hpf (L1 was still a part of the primordium). Embryos were fixed after L4, L5 deposition (~40 hpf). Scale bar is 25 μm.
Figure 1—figure supplement 1

NICD primordia do not migrate to the tail tip and deposit fewer neuromasts.
(A and A’) posterior lateral line in 2.5 dpf Tg(cldnB:lynGFP) larvae. Scale bar is 100 μm. (A’ and B) NICD primordia deposit fewer neuromasts. Error bars represent standard error (p<0.001=*** Student’s t test). (C) 80% of NICD primordia stall and fail to reach the tail tip. (D) Notch signaling regulates posterior lateral line primordium fate versus ganglion fate (also in [Mizoguchi et al., 2011]). The NICD posterior lateral line (pLL) primordium has significantly more cells compared to wildtype at the expense of ganglion cells. In contrast, in mib1ta52b mutants more cells are specified towards the ganglion fate and less cells contribute to the primordium. Error bars represent one-way ANOVA with Tukey pairwise comparison test (p<0.05=*, p<0.001=***). (E) Induction of Notch after the primordium and ganglion have separated leads to a significant increase in the number of cells in neuromasts (L1–4) compared to a heat-shocked sibling. Notch overexpression was induced by a 39°C heat-shock for 45 min starting at 25 hpf (L1 was still a part of the primordium). Embryos were fixed after L4, L5 deposition (~40 hpf). Error bars indicate standard error between the hs:sibling and hs:NICD neuromast cell counts from one independent experiment (p<0.001=*** Student’s t test).
Figure 2 with 1 supplement
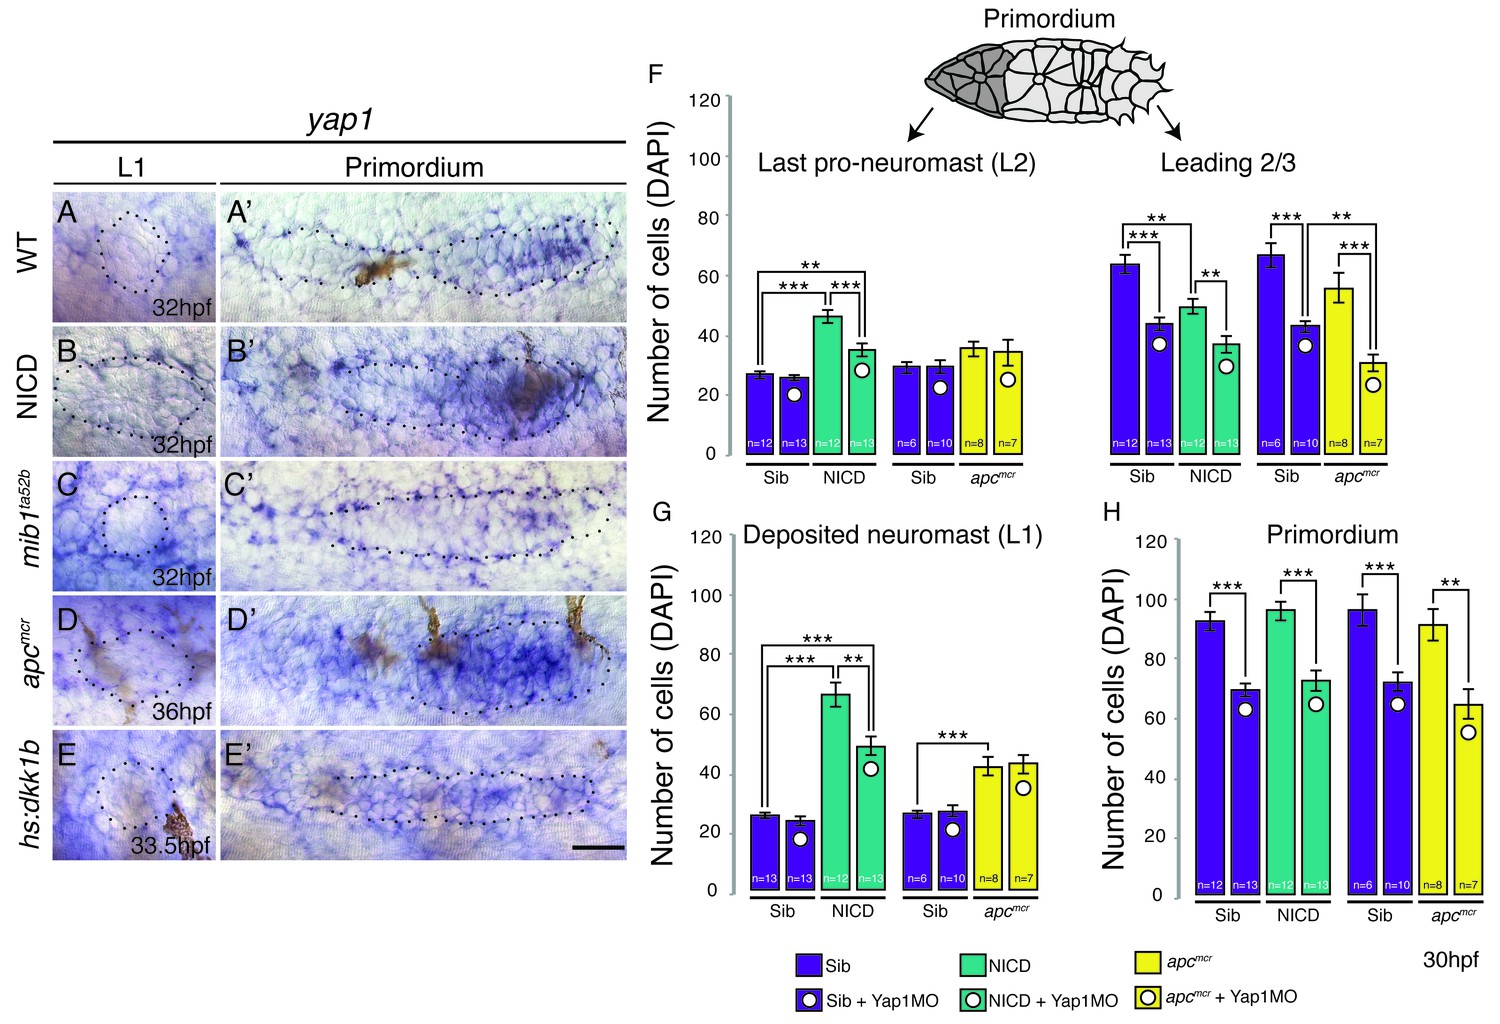
The Hippo pathway member yap1 regulates primordium size but not neuromast size.
(A–E) yap1 is not expressed in WT neuromasts (A) or neuromasts in which Notch (B and C) or Wnt signaling (D and E) are manipulated. (A’–E’) yap1 is upregulated in the primordium after (B’) Notch and (D’) Wnt overexpression compared to (A’) wildtype siblings and Wnt downregulation (E’). (C’) Notch loss in mib1ta52b mutants leads to downregulation of yap1. (F) Loss of yap1 by morpholino injections significantly reduces the number of cells in the leading 2/3 of WT, NICD and apcmcr primordia, as well as the overall primordium size (H). (G) Notch and Wnt signaling significantly increases the number of cells in deposited L1 neuromasts, which is not rescued to a wildtype level by yap1 morpholino injections. Even though the size of NICD L1 and L2 pro-neuromasts is significantly reduced in yap1 morphants, they are still significantly larger than the corresponding WT neuromasts (F and G). Error bars represent standard error from one independent experiment (p<0.05=*, p<0.01=**, p<0.001=*** Student’s t test). Scale bar is 25 μm.
Figure 2—figure supplement 1
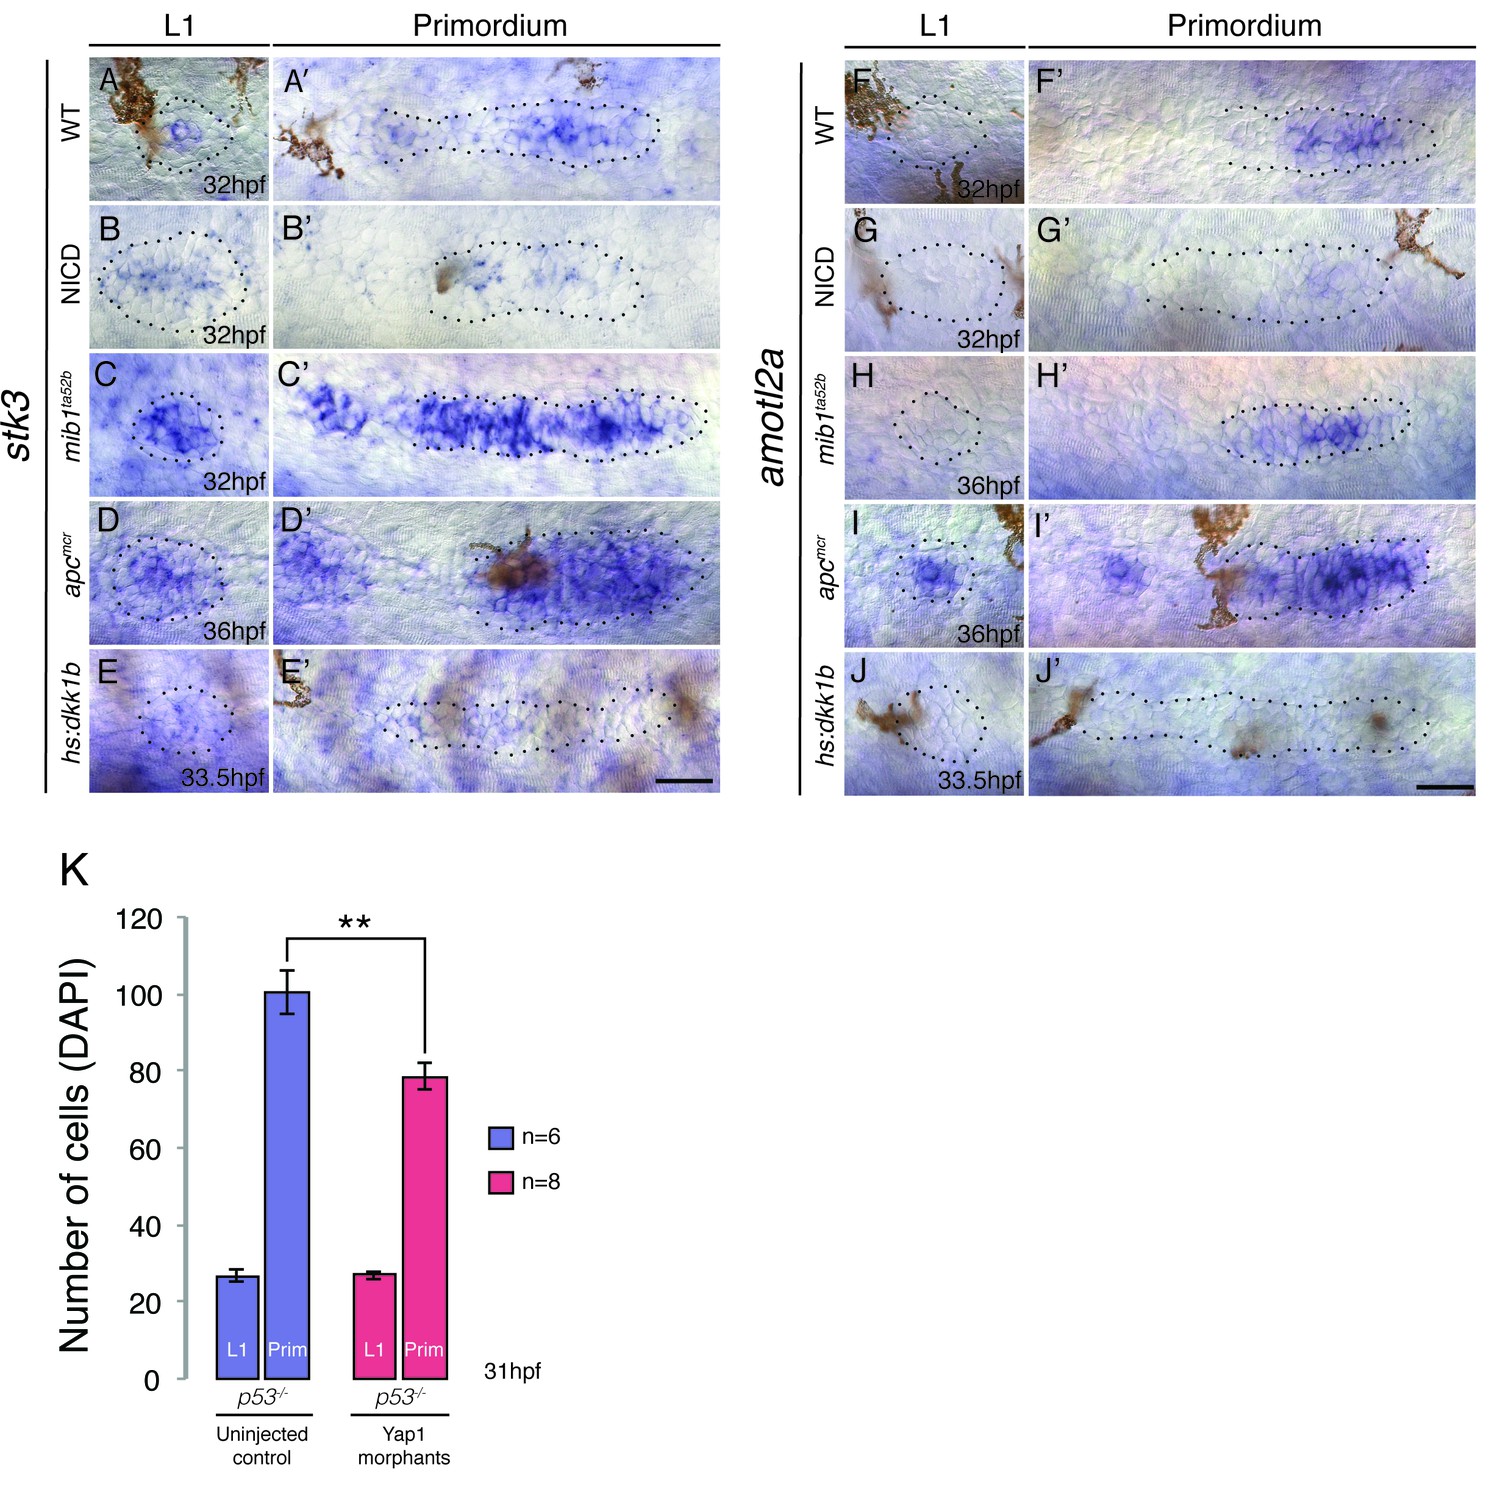
Hippo signaling components in the lateral line.
(A–A’) In the wildtype lateral line the canonical Hippo pathway inhibitor stk3 (the ortholog of hippo kinase in Drosophila) is expressed in central cells of the primordium, as well as in central cells of deposited neuromasts. (B–B’) stk3 is downregulated in NICD and hs:dkk1b (E–E’) primordia and neuromasts. (C–C’) stk3 is strongly upregulated in mib1ta52b and apcmcr (D and D’) neuromasts and primordia. This suggests that the activation status of canonical Hippo pathway is different in NICD and apc mutants. (F) amotl2a, which inhibits Wnt-induced proliferation is not expressed in the deposited neuromast, but in the central region of the wildtype primordium (F’). (G and G’) amotl2a expression is downregulated in NICD primordia and in hs:dkk1b primordia where Wnt signaling is disrupted (J and J’). (H and H’) amotl2a expression is not affected in the mib1ta52b primordium, whereas it is induced after Wnt upregulation (I and I’), even though proliferation is reduced hs:dkk1b embryos and upregulated in apc mutants. Scale bars are 25 μm. (K) yap1 morpholino injections do not affect primordium size via the activation of p53. Injection of yap1 morpholino into p53 homozygous embryos still leads to a significant reduction in primordium cell number. Error bar represents standard error from four independent experiments (p<0.01=** Student’s t test).
Figure 3
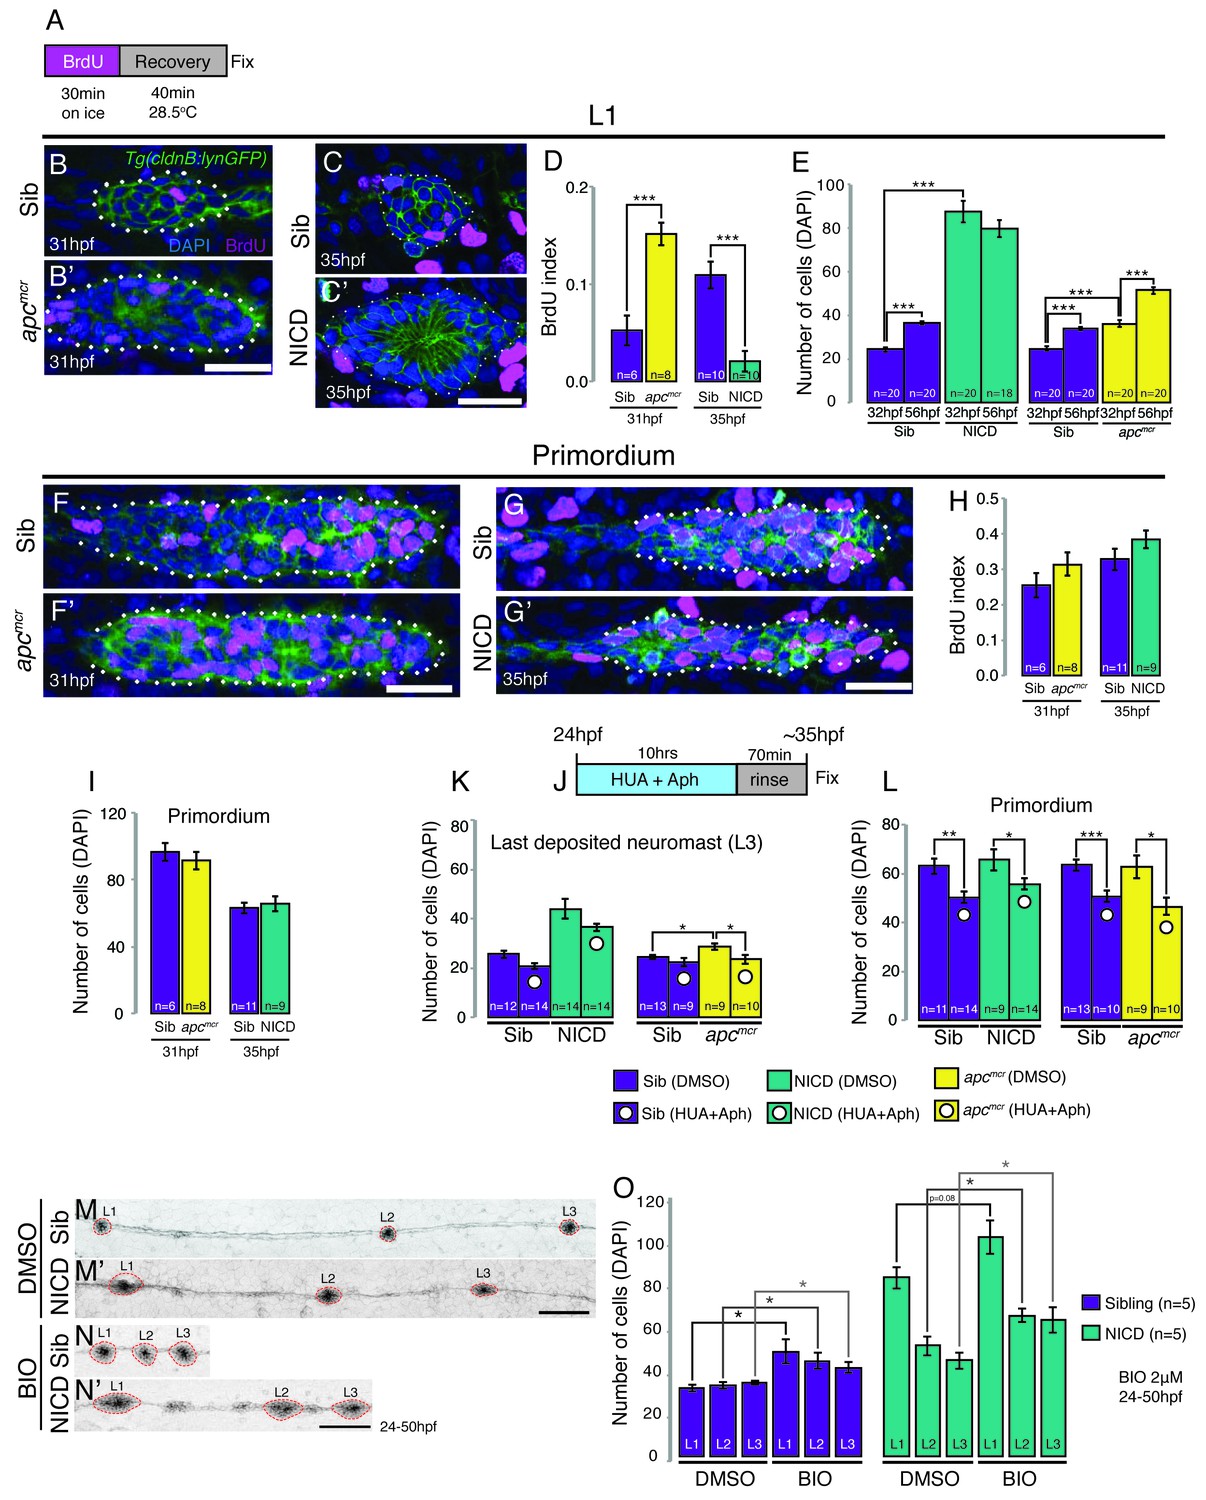
Proliferation is not responsible for large neuromasts in NICD embryos.
(A) BrdU treatment strategy. (B–C’) Representative images of BrdU-positive nuclei in L1 apcmcr (B’) and NICD neuromasts (C’). (B and B’ and D) The BrdU index is increased in apcmcr L1 neuromasts and significantly reduced in NICD L1 neuromasts (C and C’ and D). (E) Nevertheless, the number of cells is significantly higher in the apcmcr and NICD L1 neuromasts. While the apcmcr neuromast grows overtime, the NICD neuromast size does not significantly change from 32 hpf to 56 hpf. (F–G’) Representative images of BrdU positive nuclei in apcmcr (F’) and (G’) NICD primordia. (F–H) There is no significant difference in the BrdU index (H) or the number of cells (I) between sibling and apcmcr or sibling and NICD primordia. (J) Hyroxyurea and aphidicolin treatment strategy. (K) Cell cycle inhibition with hydroxyurea and aphidicolin significantly reduces the number of DAPI- positive cells in the last deposited neuromasts in apcmcr embryos. There is no significant reduction in sibling or NICD neuromast sizes after cell cycle inhibition. (L) Cell cycle inhibition significantly reduces the number of cells in sibling, apcmcr and NICD primordia. Scale bars are 25 μm. Treatment of sibling and NICD embryos with the GSK3β inhibitor BIO causes significant enlargement of neuromasts (L1–3). Scale bar is 100 μm. Error bars represent standard error from one independent experiment (p<0.05=*, p<0.01=**, p<0.001=*** Student’s t test).
Figure 4 with 1 supplement
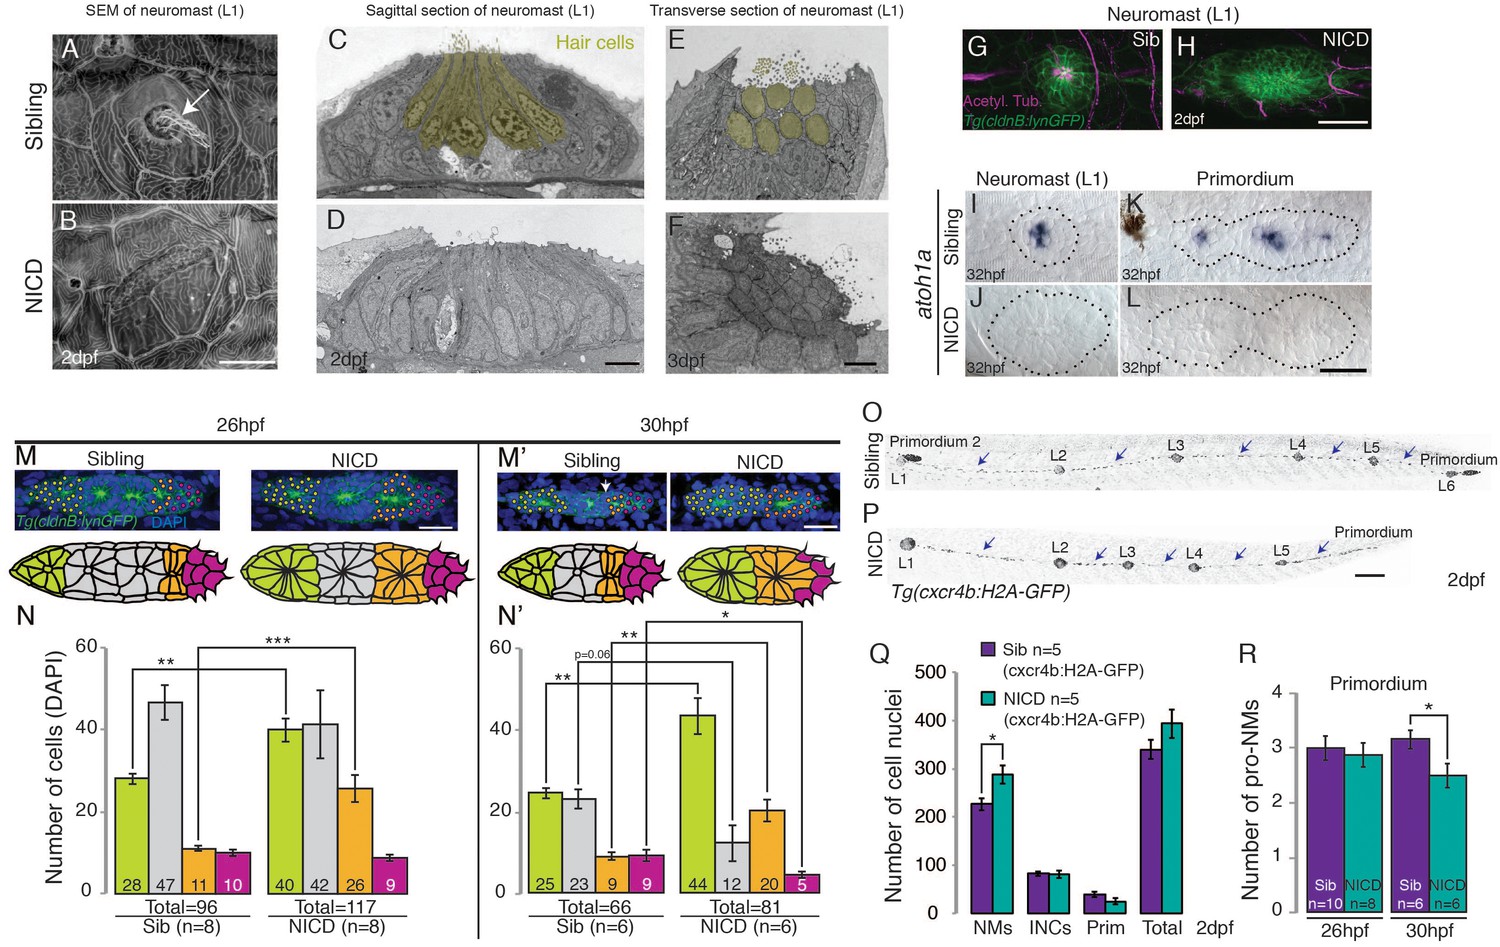
NICD neuromasts are not larger because of a switch in cell fate.
Scanning electron micrograph of a 2 dpf sibling (A) and NICD neuromast (B) shows that no hair cells (white arrow in WT) are present in the NICD neuromast. Scale bar is 10 μm. (C–F) Transmission electron sections through sibling (C,E) and NICD neuromasts (D,F). (C,E) Hair cells are false colored in yellow. (D,F) No hair cells are present in NICD neuromasts. (C–F) Scale bars are 5 μm. (G and H) Acetylated tubulin antibody stains hair cells in a sibling neuromast (G), but staining is absent in a NICD neuromast (H). (G and H) Scale bar is 25 μm. (I and L) The proneural gene atoh1a is not expressed in NICD neuromasts (J) and the primordium (L). (I–L) Scale bar is 25 μm. (M–N’) Cell number (DAPI counts) in the different parts of the primordium. Magenta indicates mesenchymal tip cells, orange indicates the first proneuromast and green indicates the about to be deposited proneuromast. The gray cells are calculated by subtracting mesenchymal, first pro-neuromast and last pro-neuromast cell numbers from the total number of cells in the primordium. (M and M’) Scale bar equals 25 μm. (O,P) Tg(cxcr4b:H2A-GFP) labels all lateral line nuclei. (Q) NICD neuromasts consist of significantly more cells compared to sibling neuromasts, but there is no difference between the number of interneuromast cells (INCs) or the primordium cells at 2 dpf. (O and P) Scale bar equals 100 μm. (R) Significantly fewer proneuromasts are formed in a NICD primordium at 30 hpf. Error bars represent standard error from one independent experiment (p<0.05=*, p<0.01=**, p<0.001=*** Student’s t test).
Figure 4—figure supplement 1
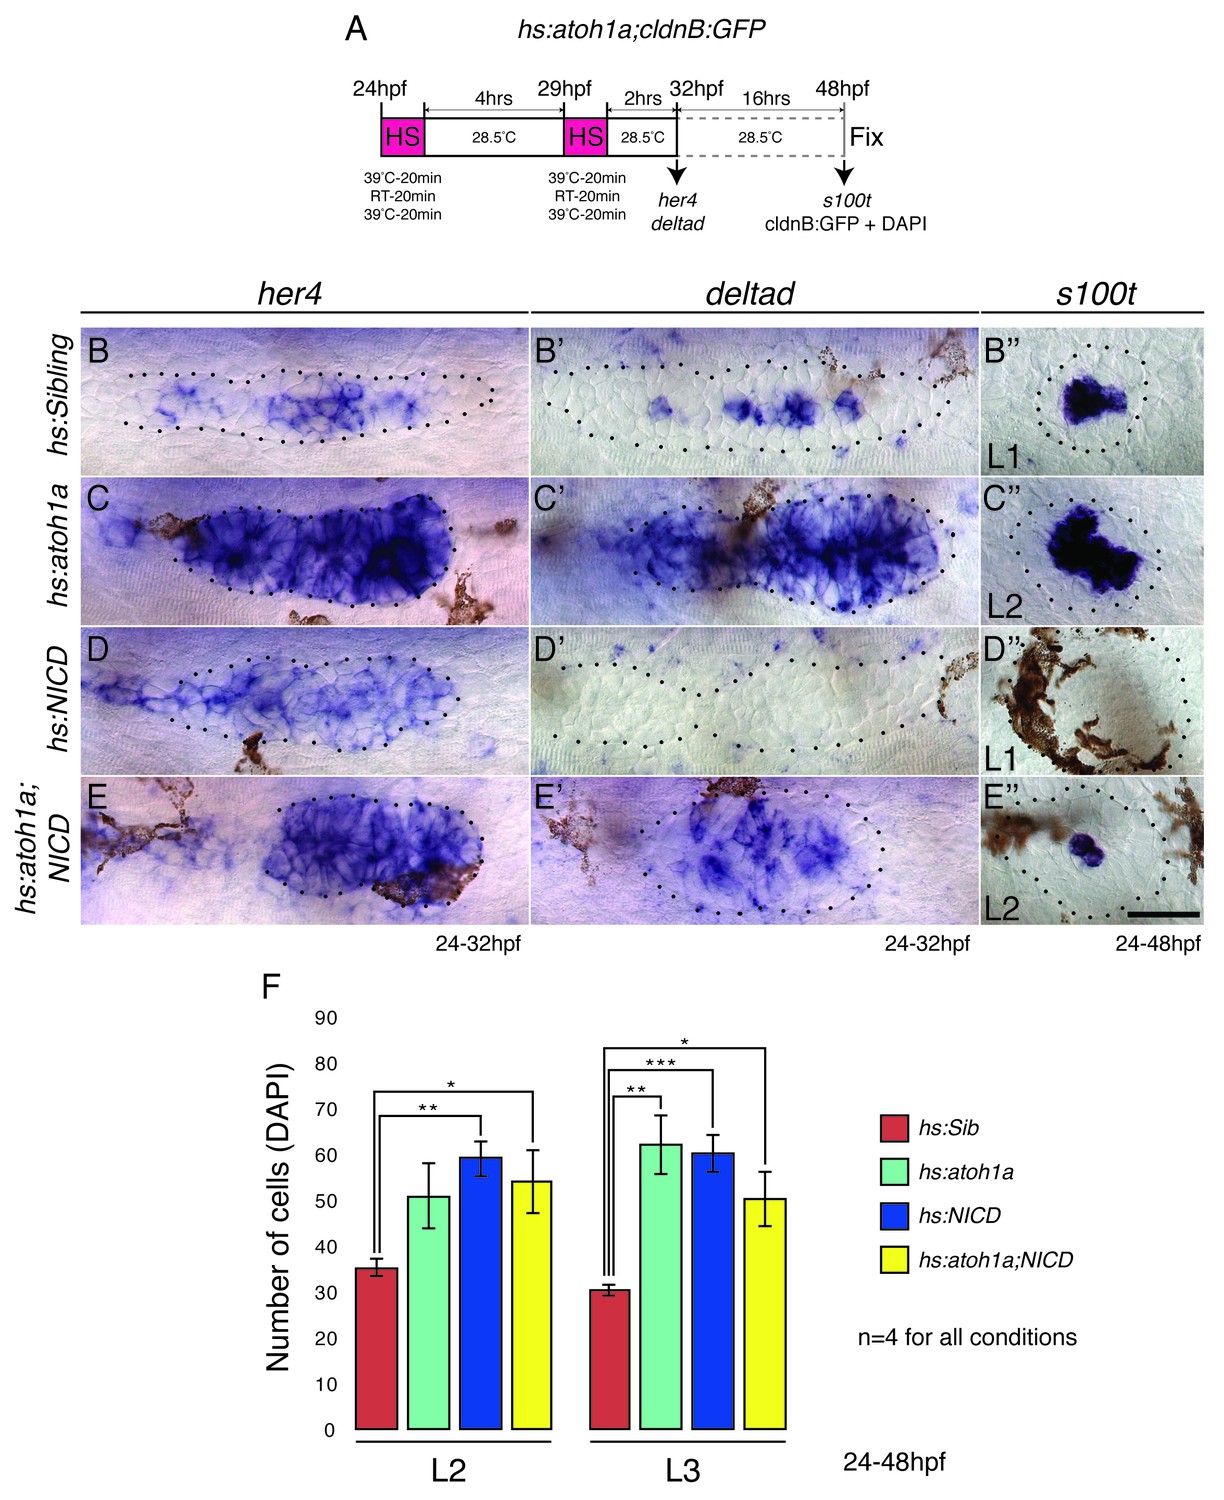
Overexpression of atoh1a induces neuromast size through activation of Notch signaling.
(A) Heat-shock strategy to activate atoh1a in the lateral line. (B, C, D, E) her4 expression in the primordium. RT-room temperature. (C) The expression of her4 is even more highly elevated in hs:atoh1a primordia than in NICD primordia (D). (B’–E’’) Expression of the atoh1a target deltad in the lateral line. (C’) deltad expression is upregulated and expanded in the hs:atoh1a primordia, completely absent in NICD primordia (D’) and re-established in some cells in the hs:atoh1a;NICD primordia (E’). (C’’) Activation of atoh1a upregulates s100t (hair cell marker) expression in 48 hpf WT neuromasts and induces s100t in several cells in NICD neuromasts (E’’). (B–E’’) Scale bar is 25 μm. (F) atoh1a overexpression induces L3 neuromast size by itself (light green). Error bars represent standard error from one independent experiment (p<0.05=*, p<0.01=**, p<0.001=*** Student’s t test).
Figure 5 with 1 supplement
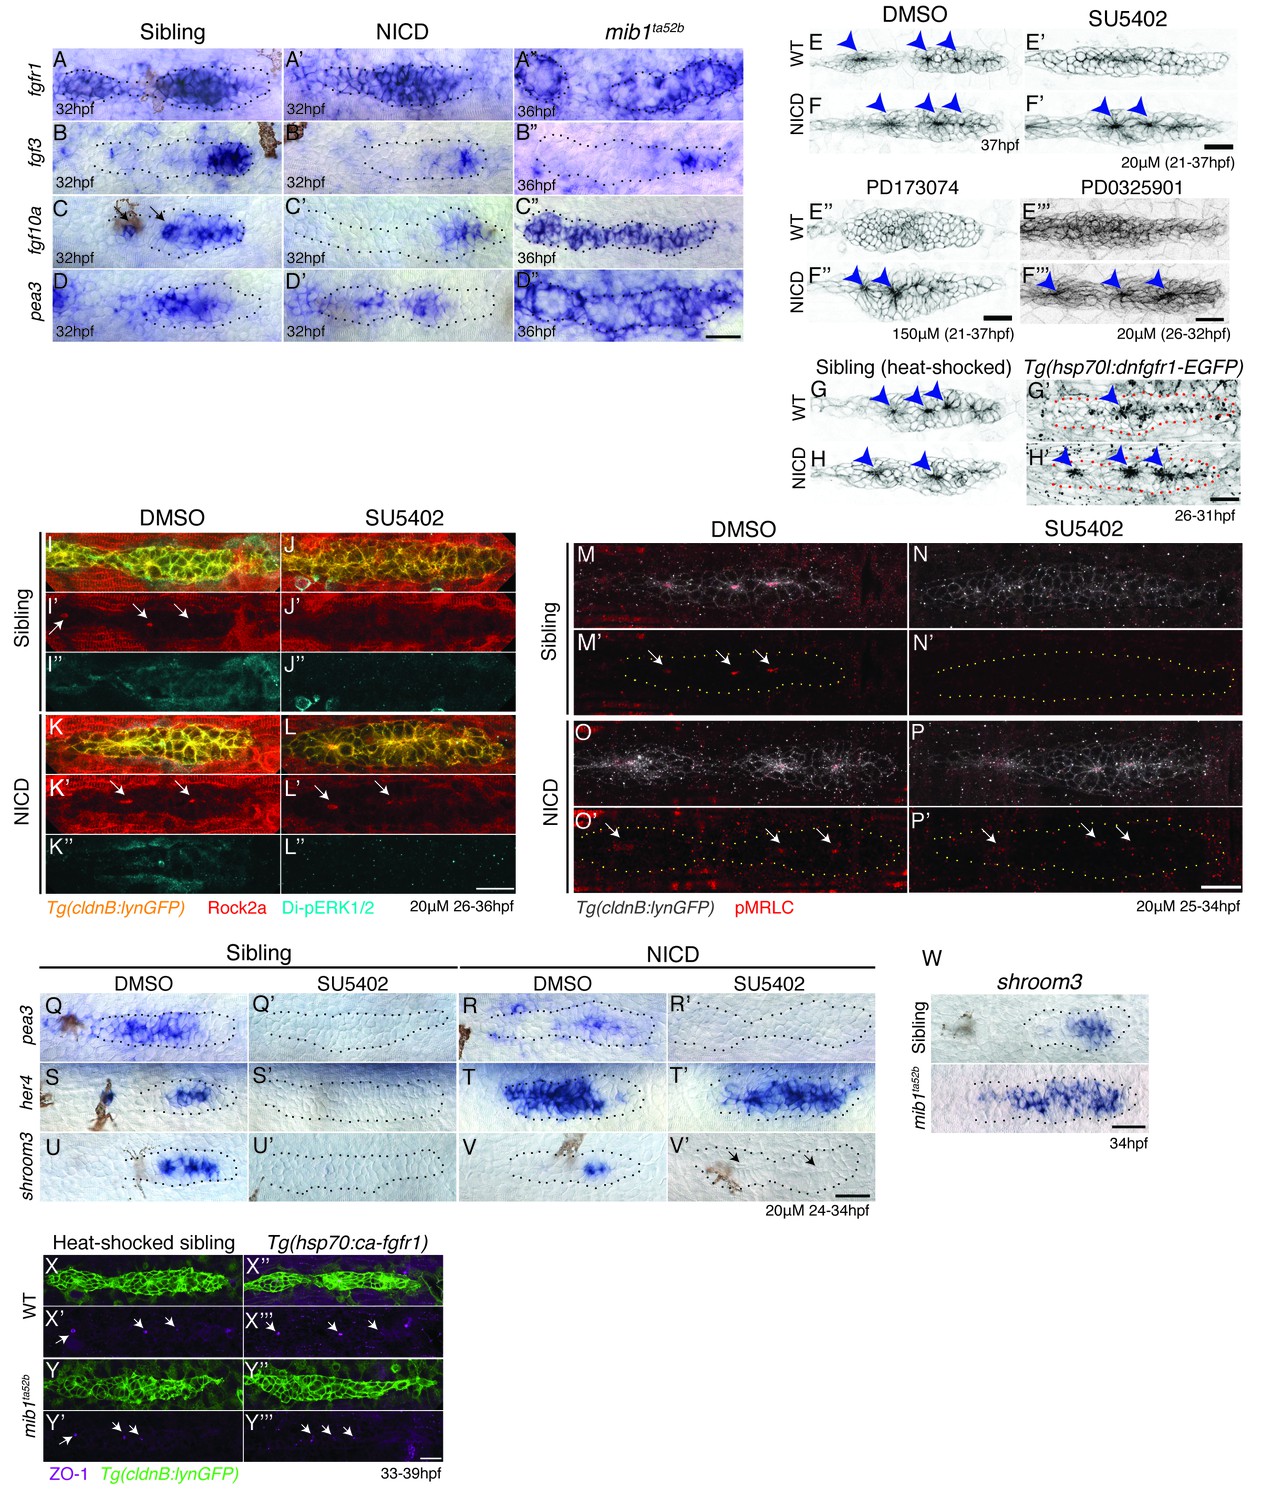
Notch induces proneuromast (rosette) formation independent of Fgf-MAPK-Shroom3 signaling.
(A–D’’) The expression of Fgf pathway members in the primordium is altered by Notch signaling. Fgf ligand (B’ and C’) and target gene expression (D’) is largely downregulated in NICD primordia compared to siblings (B–D). (B’’) fgf3 and (D’’) pea3 expression is downregulated in mib1ta52b primordia, but fgf10 expression (C’’) is largely expanded. fgfr1 expression remains normal in NICD (A’) but is downregulated in the center of the mib1ta52b primordia (A’’). (E–H’) Notch induces proneuromast formation independent of Fgf-MAPK signaling. NICD primordia form proneuromasts in the presence of Fgfr1 and MAPK inhibitors (F’ and F’’ and F’’’) as well as after the induction of dominant-negative Fgfr1 (H’), while sibling proneuromast formation fails after these manipulations (E’–E’’’ and G’). (G–H’) Embryos were heat-shocked 2 times at 39°C for 20 min with 20 min incubation at a room temperature in between, starting at 26 hpf and fixed 4 hr later. (I–L’’) Notch regulates apical Rock2a accumulation independent of Fgf signaling. Contrary to sibling primordia (J’), the Rock2a expression is maintained in the apices of the forming proneuromasts in NICD primordia treated with the Fgfr1 inhibitor SU5402 (L’). (J’’ and L’’) Fgf downregulation is confirmed by the loss of di-pERK1/2 expression in the primordium. (M–P’) Notch regulates Phosphorylated Myosin Regulatory Light Chain (pMRLC) expression independent of Fgf signaling. (N’) Sibling primordia lose the pMRLC expression after Fgfr1 inhibitor treatment, but pMRLC expression is maintained in the apices of treated (P’) NICD proneuromasts. (Q–V’) NICD primordia form proneuromasts (black arrows) in the absence of shroom3 expression (V’). Treatment with the Fgfr1 inhibitor SU5402 depletes pea3 (Q’ and R’), her4 (S’) and shroom3 (U’ and V’) expression in control and NICD primordia. (T’) her4 expression is maintained in NICD primordia after Fgfr1 inhibition. (W) shroom3 is upregulated in mib1ta52b primordia, although Fgf signaling is downregulated. (X–Y’’’) Constitutive activation of Fgf signaling by heat-shock induction of Fgfr1 does not rescue rosette formation in mib1ta52b primordia (Y’’’) suggesting that Fgf signaling is not sufficient for rosette formation in the absence of Notch signaling. (X–Y’’’) Embryos were heat-shocked at 39°C for 40 min, starting at 33 hpf and fixed 4 hr later. Scale bar in all panels is 25 μm.
Figure 5—figure supplement 1
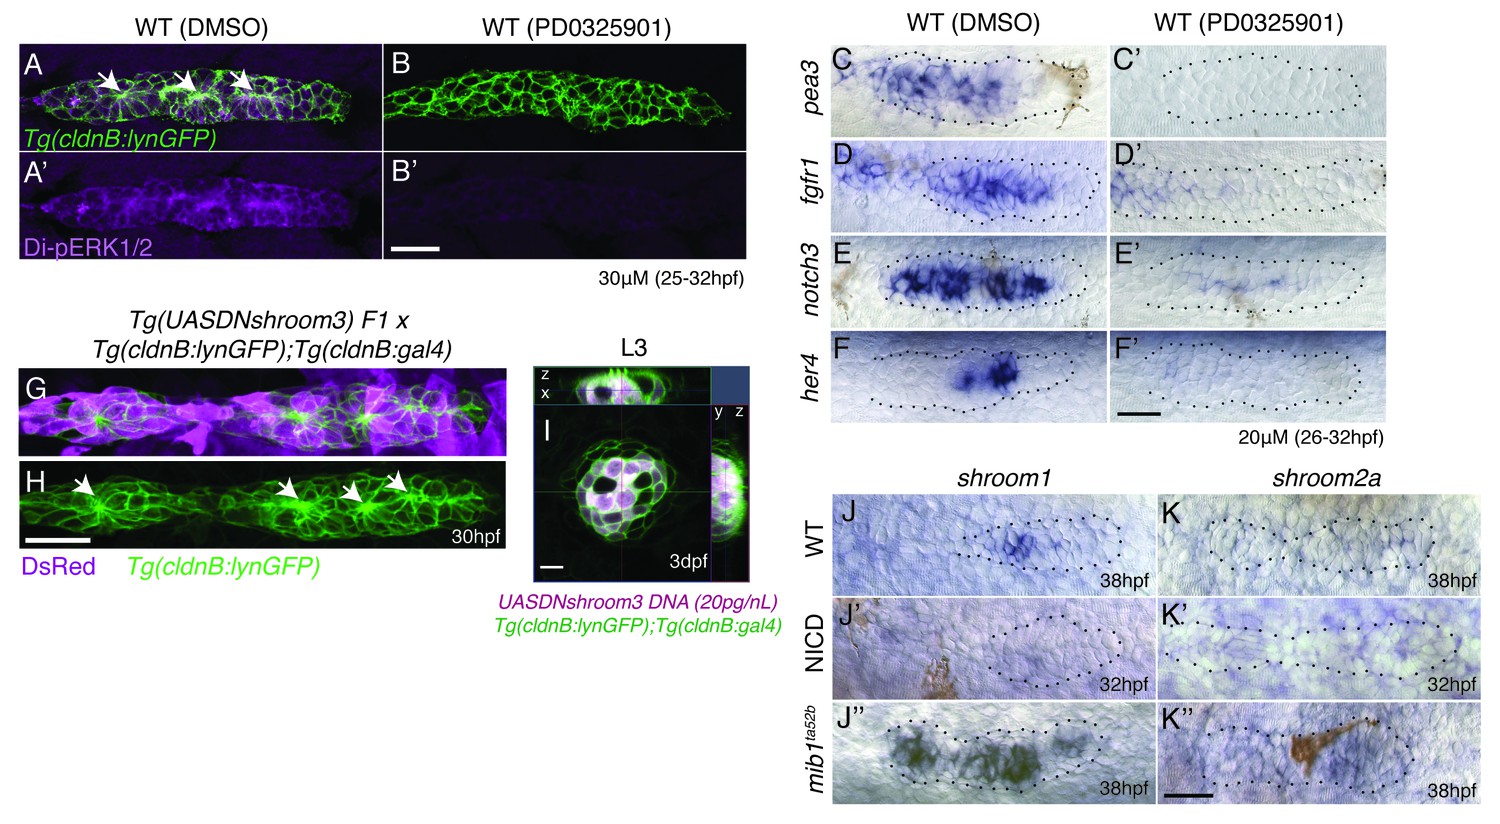
Notch signaling regulates proneuromast formation downstream of the MAPK pathway and shroom3 is dispensable for rosette formation.
(A–B’) MAPK is required to maintain di-pERK1/2 expression in the primordium. (B’) The MAPK inhibitor PD0325901 leads to a strong reduction of di-pERK1/2 expression. PD0325901 downregulates the Fgf targets pea3 (C–C’), fgfr1 (D–D’), notch3 (E–E’) and the Notch target her4 (F–F’). (G–I) Loss of shroom3 by induction of DNshroom3 using the cldnb promoter does not disrupt proneuromast formation (H) or maintenance of deposited neuromasts (I). (J) shroom1 is expressed in the trailing region of the wildtype primordium, is downregulated in NICD (J’) and highly upregulated in mib1ta52b primordia (J’’) showing that shroom1 is inhibited by Notch signaling. shroom2a expression is also inhibited by Notch signaling. shroom2a expression is barely detectable in wildtype (K) and NICD (K) primordia but upregulated in mib1ta52b primordia. We currently do not understand why shroom genes are upregulated in mib1 primordia, as at least shroom3 is regulated by Fgf. All scale bars are 25 μm.
Figure 6
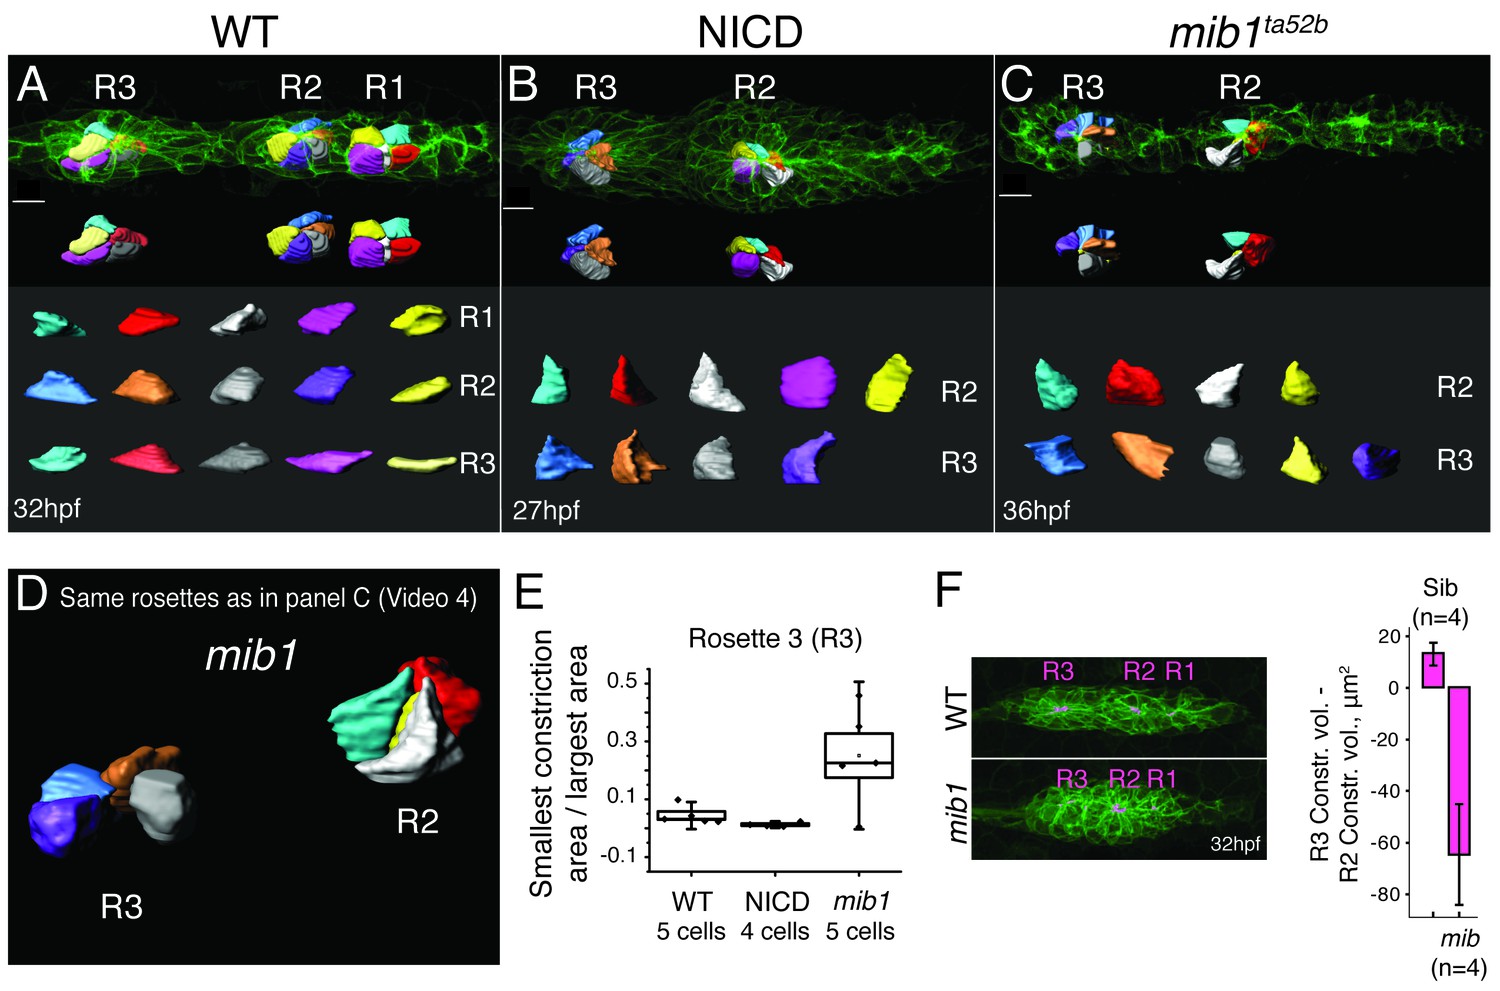
Loss of Notch signaling disrupts apical constrictions.
(A–E) Analysis of cell shapes using Imaris software. R1–R3 indicate proneuromast numbers. (A) In wildtype and (B) NICD primordia all analyzed proneuromast cells in all rosettes constrict apically. Cells in a mib1ta52b primordium (C) constrict in the more immature rosette (R2) but are lacking constricted apices in the last proneuromast (R3) at 36 hpf. The scale bars equal 10 μm. While the individual cells within one graph are scaled the same with respect to each other, no comparison can be made between different samples. This is due to the limitations of the Imaris scale bar function, rooted in the complexity of displaying 3D data. (D) Still image of an animation of the same primrodium as in (C) demonstrating the shape changes in R3. (E) Quantification of apical constrictions (area). Cells from the most mature proneuromasts (R3) were selected for analysis. Boxplot defines standard error and the ends of the whiskers show standard deviation between different cells. (F) The bar graph shows the apical constriction volume value when the R2 volumes are subtracted from R3 volumes. Constriction volumes gradually diminish in maturing proneuromasts in mib1ta52b primordia, therefore, the last proneuromast (R3) in mib mutants has a significantly smaller constriction volume in comparison to R2, whereas, in the siblings R3 is larger than R2, which results in a positive value.
Figure 7 with 2 supplements
Notch cell-autonomously induces cell clustering.
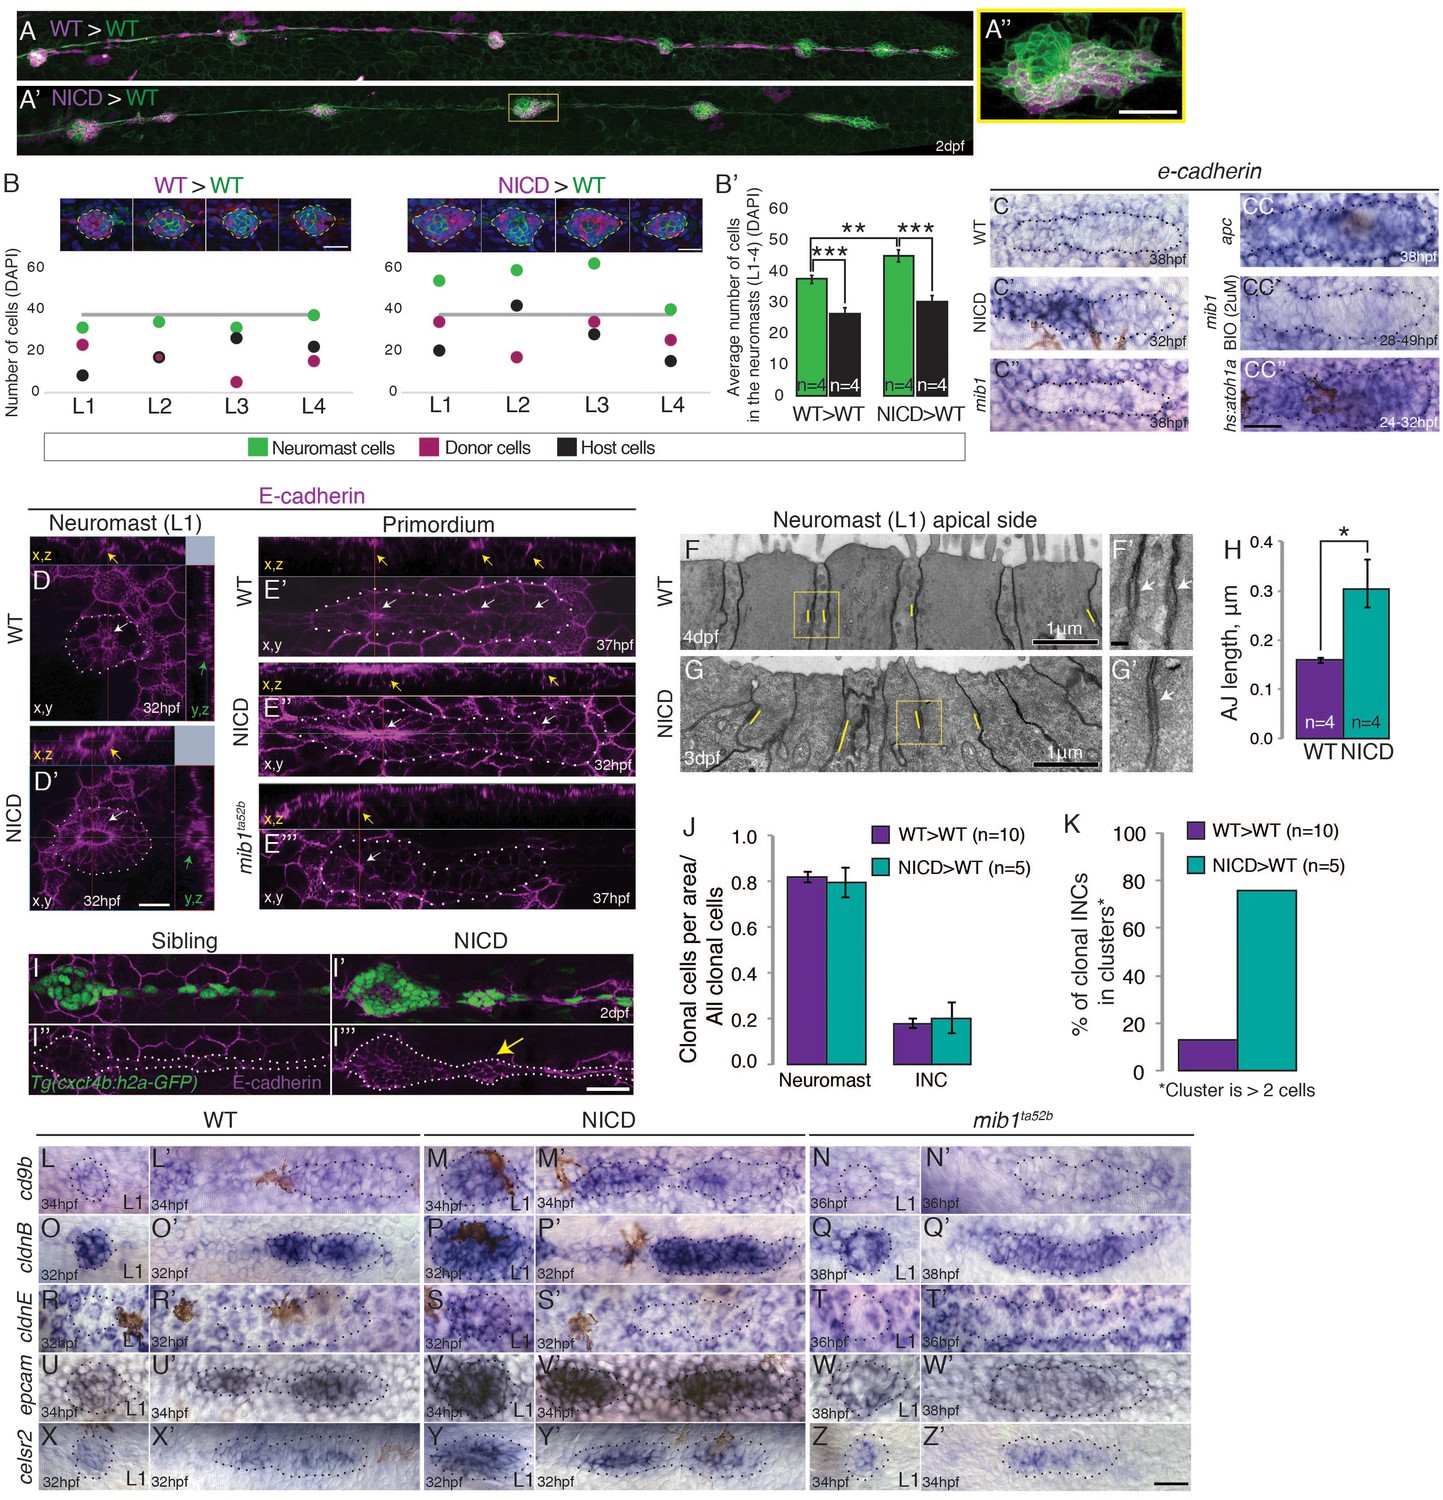
(A,B and B’) Wildtype cells transplanted into a wildtype embryo do not cause larger neuromasts. (A’–B’) Mosaic, NICD-positive cells that are transplanted into a wildtype embryo are clumping together and form bigger neuromasts. (A’’) Mosaic L3 neuromast from panel (A’) where NICD positive cells cluster together to form an enlarged neuromast. (B) Images at the top of the graph show 2 examples of L1-L4 neuromasts with clone cell numbers measured below. Left: WT cells transplanted into WT lateral line and right: NICD cells transplanted into WT lateral line. Colored dots below indicate three values measured for each neuromast: green- total number of cells in the neuromast, magenta- number of transplanted cells, black- number of host cells (a calculated value of magenta cells subtracted from the number of green cells). The grey line indicates the average neuromast size of all WT neuromasts containing WT clones. (B’) Quantification of cell transplantation experiments. The significant increase in the neuromast size (green bars; 38 versus 45 cells) in NICD>WT experiments compared to WT>WT situation is only due to addition of transplanted NICD cells, since the number of host cells (black bar) is not significantly changed between two types of cell transplantation strategies (26 versus 30 cells). (C–CC’’) e-cadherin expression in the primordium is upregulated by Notch (C’) and by Wnt signaling (CC) compared to a wildtype primordium (C). (C’’) e-cadherin is downregulated in mib1ta52b primordia and in mib1ta52b in which Wnt is activated with BIO (CC’) suggesting that Wnt requires Notch signaling to induce e-cadherin. (CC’’) e-cadherin is upregulated in hs:atoh1a primordia in which her4 (Notch target) is also expanded (see Figure 4—figure supplement 1C). (D–I’’’) Notch upregulates E-cadherin protein expression in neuromasts (D’), proneuromasts in the primordium (E’’) and in interneuromast (INCs) cells (yellow arrow) (I’’’) compared to a wildtype sibling (D, E’ and I,I’’). In mib1ta52b embryos e-cadherin is downregulated (E’’’). Strongest E-cadherin expression is marked by the yellow arrows in the x,z plane, white arrows in the x,y plane and green arrows in the y,z plane. (F–H) NICD causes a significant increase in apical adherens junction (AJ) lengths. (F’ and G’) Magnification of the areas in yellow boxes in F and G. AJs are marked by the white arrows. Error bar indicates standard error (p<0.05=* Student’s t test). (I–I’’’) E-cadherin expression in the NICD interneuromast cells, which tend to form clusters (arrow), quantified in (K). (J) Transplanted NICD cells contribute in similar proportions to neuromasts and interneuromast cells as transplanted wildtype cells. (K) Transplanted NICD cells form significantly more clusters, as defined by groups of cells that contain two or more cells. (L–Z’) Apical junction genes, such as adherens junction genes and tight junction components are upregulated by NICD. (L–N’) cd9b is upregulated in NICD neuromasts and the primordium (M and M’) compared to siblings (L and L’), and is downregulated in mib1ta52b embryos (N and N’). (O–Q’) cldnB is upregulated in NICD neuromasts and the primordium (P and P) compared to a sibling (O and O’) and slightly reduced in mib1ta52b embryos (Q and Q’). The cldnB signal is especially low in the center of mib1ta52b neuromasts (Q). (R–T’) cldnE is upregulated in NICD neuromasts (S) compared to a sibling (R). cldnE is unchanged in mib1ta52b neuromasts (T). (R’, S’ and T’) No change in cldnE expression is seen in wildtype, NICD and mib1ta52b primordia. (U–W’) epcam is overexpressed in NICD neuromasts and the primordium (V and V’) compared to siblings (U and U’) but epcam is downregulated in mib1ta52b embryos (W and W’). (X–Z’) celsr2 is overexpressed in NICD neuromasts and the primordium (Y and Y’) compared to siblings (X and X’) and mib1ta52b embryos (Z and Z’). All scale bars are 25 μm, unless stated otherwise. Error bars represent standard error (p<0.05=*, p<0.01=**, p<0.001=*** Student’s t test).
-
Figure 7—source data 1
List of 187 genes that are upregulated in the lateral line of NICD embryos.
logFC (log base two fold change of expression between NICD and wildtype sibling); logCPM (log base two fold change of counts per million between NICD and wildtype sibling); padj (p-values adjusted by using the Benjamini–Hochberg procedure to control for the false discovery rate).
- https://doi.org/10.7554/eLife.21049.017
-
Figure 7—source data 2
List of genes for cellular components from the GO term analysis in NICD primordium cells compared to a wildtype sibling.
- https://doi.org/10.7554/eLife.21049.018
Figure 7—figure supplement 1

E-cadherin defficiency does not disrupt proneuromast formation.
(A and B) Wnt signaling upregulates E-cadherin antibody expression in the posterior lateral line primordium. Scale bar is 50 μm. (C–F’) Notch regulates e-cadherin expression downstream of Fgf signaling. (C and C’) The Fgfr1 inhibitor SU5402 depletes the expression of the Notch target gene her4 in the primordium. (D and D’) NICD induces her4 in the absence of Fgf signaling. (E and E’) Fgf is required to induce e-cadherin in the primordium. (F and F’) (F) In NICD primordia, e-cadherin is upregulated, even in the absence of Fgf signaling (F’), therefore, e-cadherin is a Notch target downstream of Fgf signaling. (G–J) n-cadherin expression is unchanged in NICD and mib1ta52b primordia (I). n-cadherin is induced by Wnt signaling (J). (K–L) Injection of the translation blocking e-cadherin morpholino significantly reduces E-cadherin antibody expression in a 8 hpf embryo (L). (M–M’’) Still images taken at different time points of a timelapse recording of a wildtype primordium in green that contains transplanted e-cadherin morpholino injected cells. Transplantation of e-cadherin morpholino injected cells into a wildtype host does not disrupt proneuromast formation. (O) Transplanted NICD cells form clusters (marked with the white arrows), which is not observed when wildtype cells (N) are transplanted into a wildtype host (quantification in Figure 7K). All scale bars are 25 μm, unless stated otherwise.
Figure 7—figure supplement 2
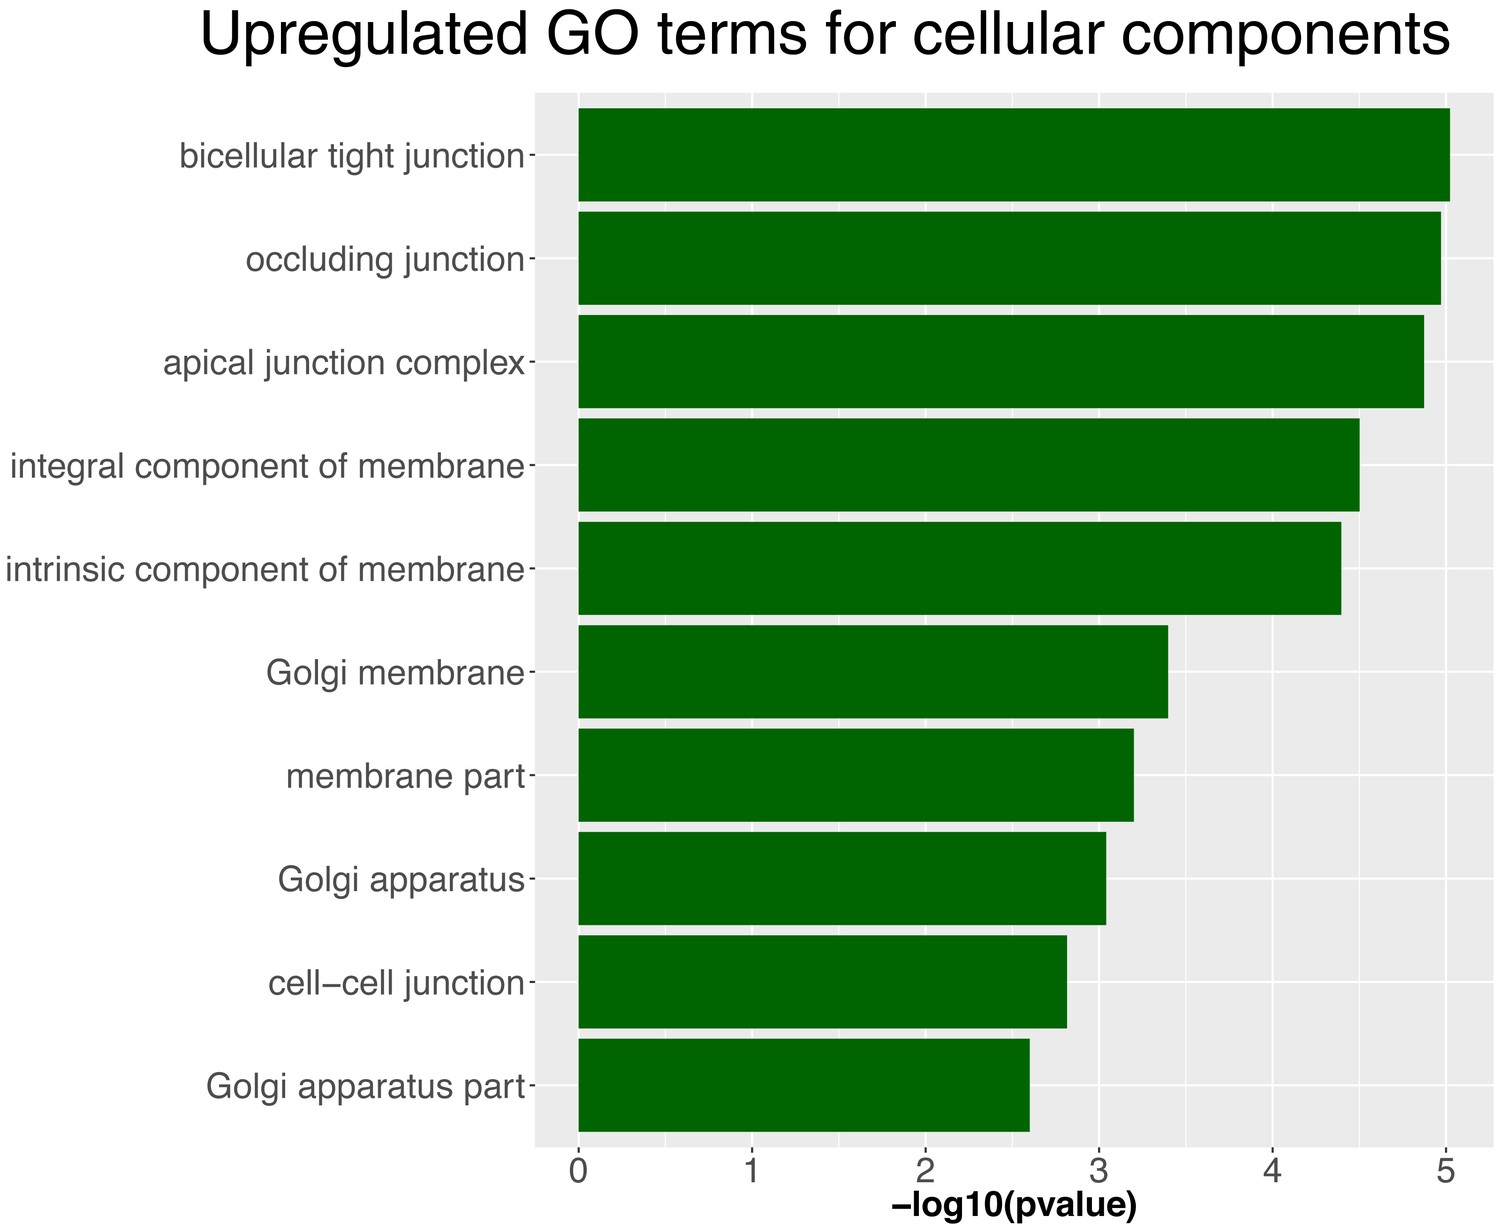
Upregulated GO terms for cellular components in NICD lateral line primordia.
https://doi.org/10.7554/eLife.21049.020
Figure 8 with 1 supplement
Wnt induces Notch signaling in the primordium via Fgf.
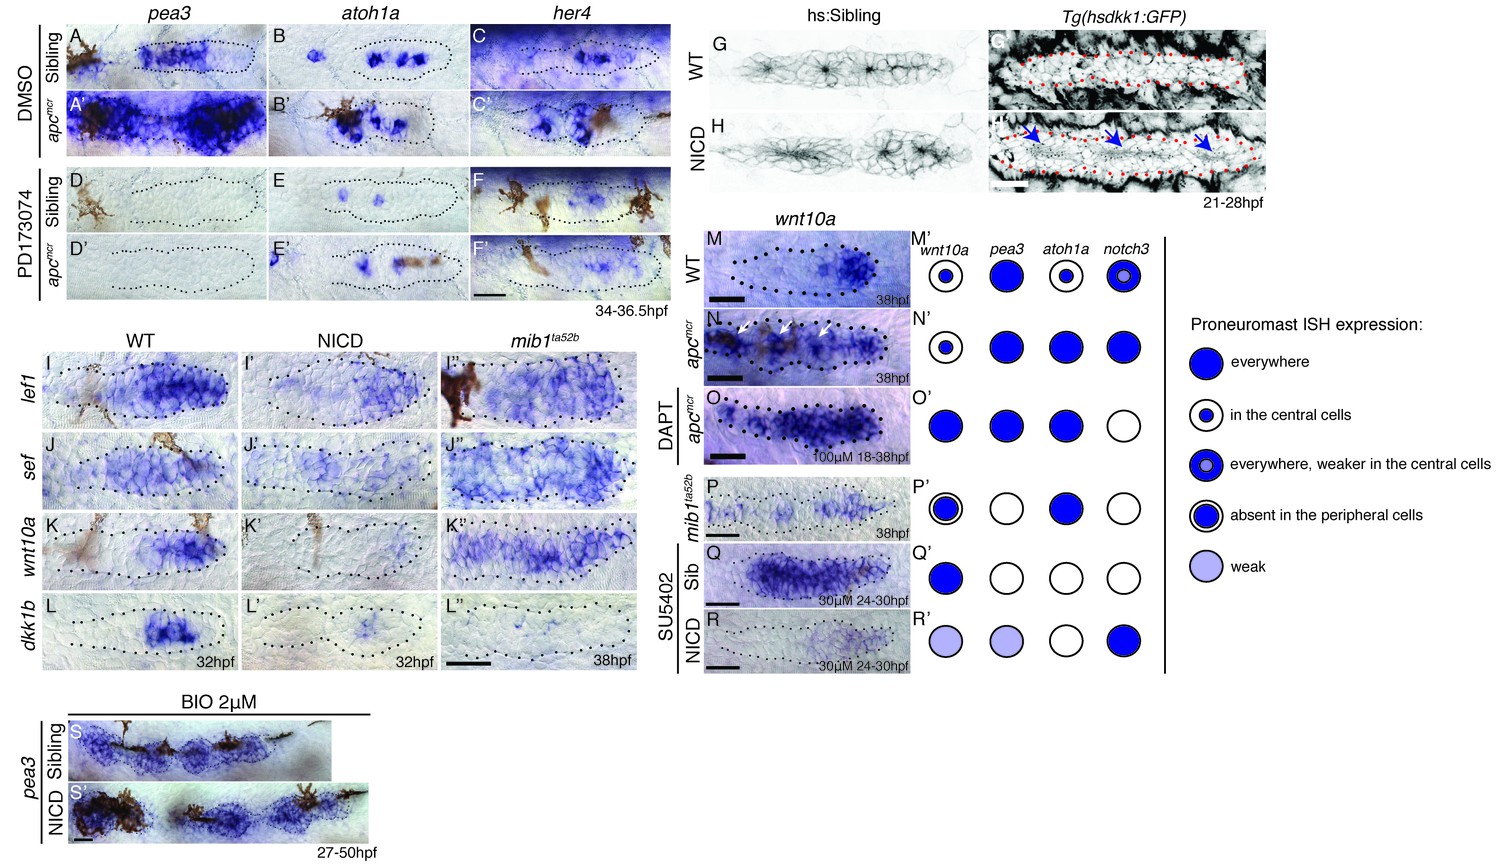
(A and A’) The expression of the Fgf target pea3 is strongly increased in apcmcr primordia at 36.5 hpf. (B and B’) In apcmcr primordia (B’) atoh1a expression is increased compared to a sibling (B), but it still is restricted to individual cells. (C and C’) her4 expression is slightly expanded in the primordium after Wnt upregulation by apcmcr (C’). (D–F’) The Fgf inhibitor PD173074 inhibits the expression of pea3 (D’) and prevents the upregulation of atoh1a (E’). The expression of atoh1a is lost in the first proneuromast, as atoh1a is Fgf dependent. The more trailing central cells express atoh1a because it becomes self-regulatory. The Fgf inhibitor downregulates her4 in sibling (F) and apcmcr mutant primordia (F’). (G–H’) Loss of Wnt signaling in the primordium by heat-shock induction of dkk1b does not disrupt proneuromast formation in NICD (H’) compared to heat-shocked sibling primordia (G’) suggesting that Notch acts downstream of Wnt and Fgf in proneuromast formation. (I–L’’) Notch inhibits Wnt signaling in the primordium. The expression of Wnt targets lef1 (I’), sef (J’), wnt10a (K’) and dkk1b (L’) expression is downregulated in NICD primordia. Conversely, in mib1ta52b primordia lef1 (I’’), sef (J’’) and wnt10a (K’’) are upregulated. (L’’) dkk1b is downregulated in mib1ta52b primordia, because Fgf signaling is secondarily lost (see text). (M–R’) wnt10a expression expands only in the absence of Notch signaling in the primordium. (M–N’) In apcmcr primordia wnt10a expands towards the trailing region but is restricted to more central cells (arrows) (N,N’). (O,O’) Downregulation of Notch with the γ-secretase inhibitor DAPT, causes a much more complete expansion of wnt10a in the trailing region of apcmcr primordia, demonstrating that Notch signaling inhibits wnt10a in the primordium. (Q–R’) wnt10a expression is expanded in the absence of Notch signaling when primordia are treated with Fgf inhibitor (Q,Q’) but is once again restricted to the leading region of the primordium if NICD is activated in the absence of Fgf (R,R’). (S) Treatment of sibling embryos with the GSK3β inhibitor and Wnt activator BIO causes the upregulation of pea3. (S’) BIO treatment of NICD embryos rescues the loss of pea3 in NICD primordia demonstrating that Wnt activates Fgf signaling upstream of Notch and that the loss of Fgf signaling in NICD is secondary to the loss of Wnt signaling. Wnt signaling is lost because Notch negatively feeds back to Wnt downstream of Fgf. All scale bars are 25 μm.
Figure 8—figure supplement 1
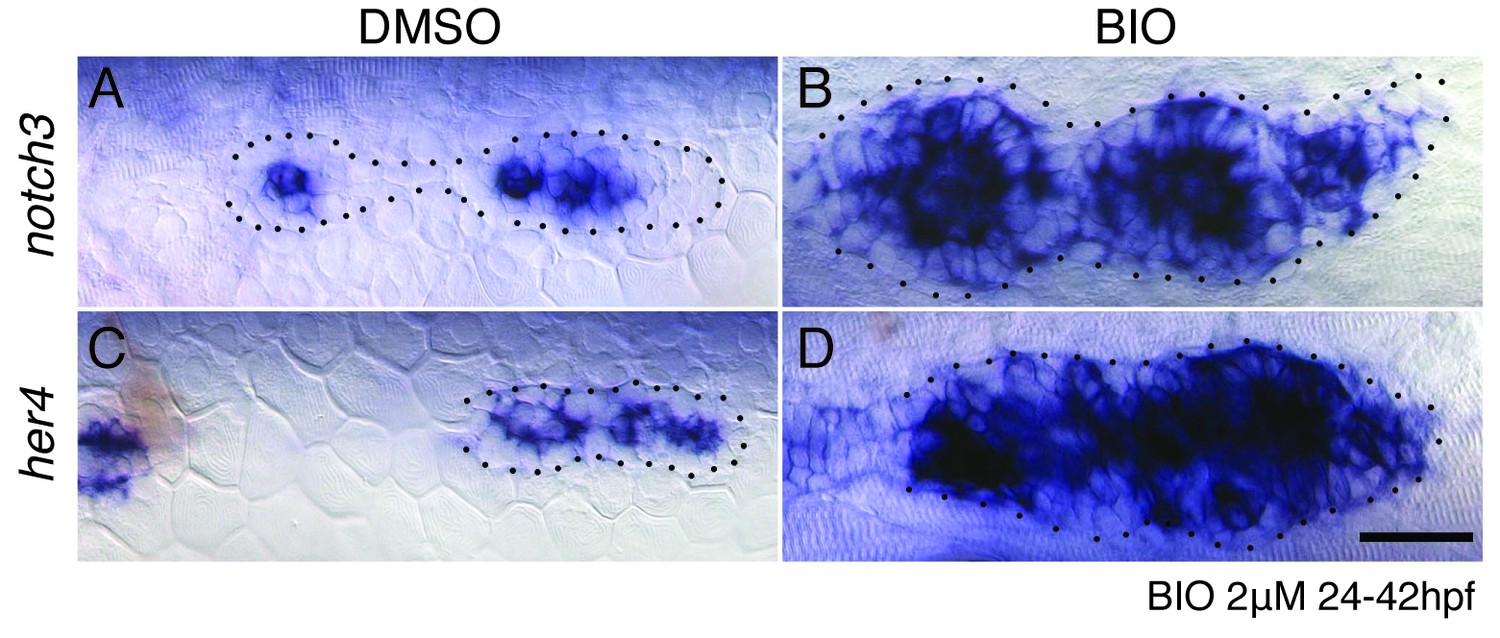
Wnt signaling induces Notch signaling.
(A–B) The upregulation of Wnt signaling by exposure to the GSK3β inhibitor BIO leads to strong upregulation of the Notch target notch3 and her4 (C–D). Scale bar is 25 μm.
Figure 9
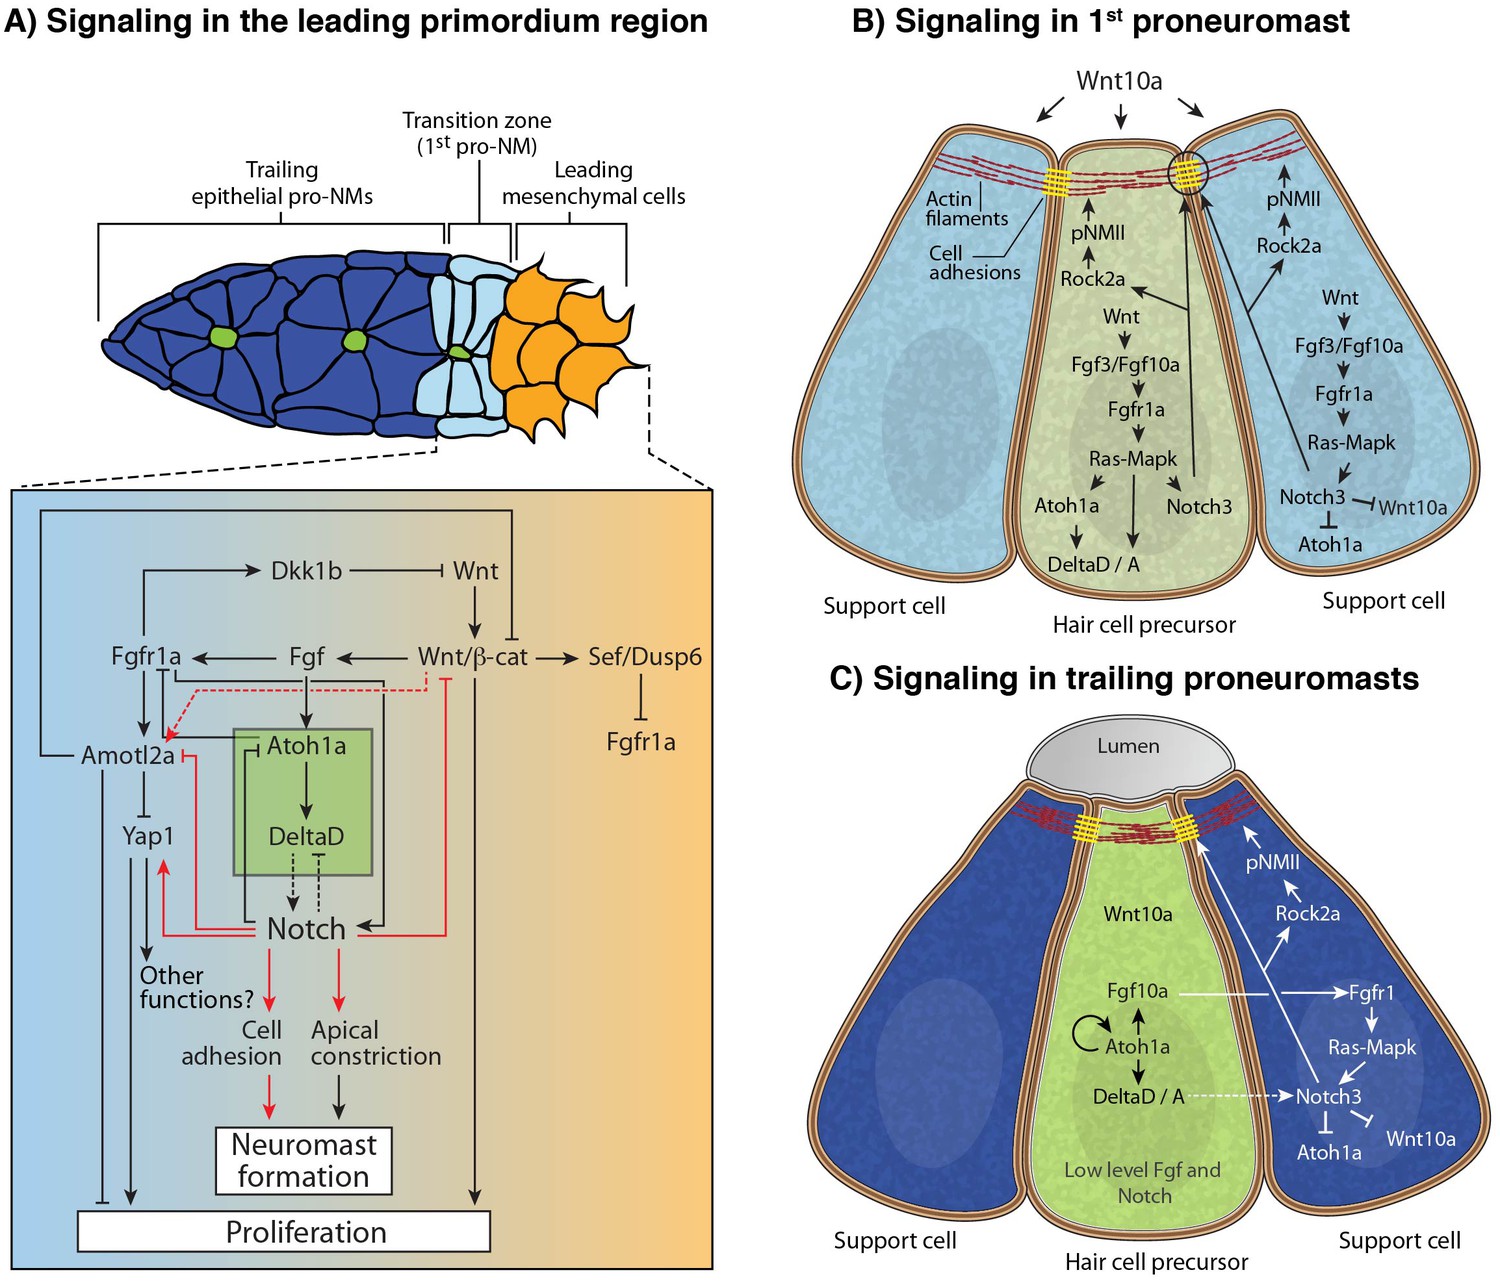
Model of the signaling interactions between Wnt, Fgf and Notch.
(A) Signaling in the leading primordium region. Arrows in red indicate interactions described in this study. Other interactions are described in (Agarwala et al., 2015; Chitnis et al., 2012; Matsuda and Chitnis, 2010). Notch acts downstream of Wnt and Fgf signaling to form proneuromasts in the posterior lateral line via the upregulation of cell adhesion or/and cell apical constriction. Notch signaling also inhibits amotl2a and promotes yap1 transcription, which induces some of the proliferation observed in the primordium. However, yap1 does not affect neuromast size. Notch also negatively feeds back to restrict Wnt signaling, thus being an essential component of the signaling interactions that coordinate migration with organ formation. (B) Signaling in the most nascent proneuromast. Fgf signaling (fgf3/10 and fgfr1) is induced by Wnt ligands in all proneuromast cells where it then induces atoh1a and Notch signaling (Chitnis et al., 2012) . As a result, Notch regulates apical constriction and cell adhesion in all proneuromast cells. (C) Signaling in the trailing proneuromasts. Fgf and Delta ligand expression now depends on Atoh1a and not Wnt anymore in central hair cell precursors (green). Fgf signaling is activated through Fgfr1 in the peripheral cells where it also induces Notch signaling (Matsuda and Chitnis, 2010). Notch signaling activates apical constriction and cell adhesion machinery in the support cells.
Videos
Video 1
3D rendering of a 2 dpf sibling and NICD L1 neuromast using FluoRender image visualization software (University of Utah).
Tg(cldnB:lynGFP) embryo was fixed in 4% PFA and stained with DAPI to visualize nuclei.
Video 2
Time-lapse movie of a mib1ta52b mutant in the Tg(cldnB:lynGFP) background showing the gradual disintegration of neuromasts and the primordium.
Embryo was imaged every 5 min starting at 28 hpf.
Video 3
Time-lapse movie showing the primordium depositing the L3 proneuromast in a sibling- Tg(cldnB:lynGFP) and a Tg(cldnB:lynGFP);NICD embryo.
The NICD primordium deposits a larger proneuromast compared to the wildtype sibling. Embryos were imaged every 5 min.
Video 4
Animation of the cells in the mib1ta52b mutant primordium at 36 hpf (see Figure 6C–D).
Cells constrict less in the trailing proneuromast (R3 in Figure 6C–E). Cell shapes are outlined and colored using Imaris (Bitplane) software.
Video 5
Time-lapse movie of a migrating Tg(cldnB:lynGFP) wildtype primordium into which magenta-colored NICD cells were transplanted.
The NICD-positive cells contribute to a larger neuromast. The embryo was imaged every 5 min starting at 25 hpf.
Video 6
Time-lapse movie of a migrating Tg(cldnB:lynGFP) wildtype primordium into which magenta-colored E-cadherin morphant cells were transplanted.
E-cadherin deficient cells integrate into the proneuromast normally and cause no aberrant rosette formation or maintenance phenotype. Embryo was imaged every 5 min starting at 25 hpf.
Download links
A two-part list of links to download the article, or parts of the article, in various formats.
Downloads (link to download the article as PDF)
Open citations (links to open the citations from this article in various online reference manager services)
Cite this article (links to download the citations from this article in formats compatible with various reference manager tools)
Proliferation-independent regulation of organ size by Fgf/Notch signaling
eLife 6:e21049.
https://doi.org/10.7554/eLife.21049


