Stimulus-dependent recruitment of lateral inhibition underlies retinal direction selectivity
- The University of Chicago, United States
Figures
Figure 1
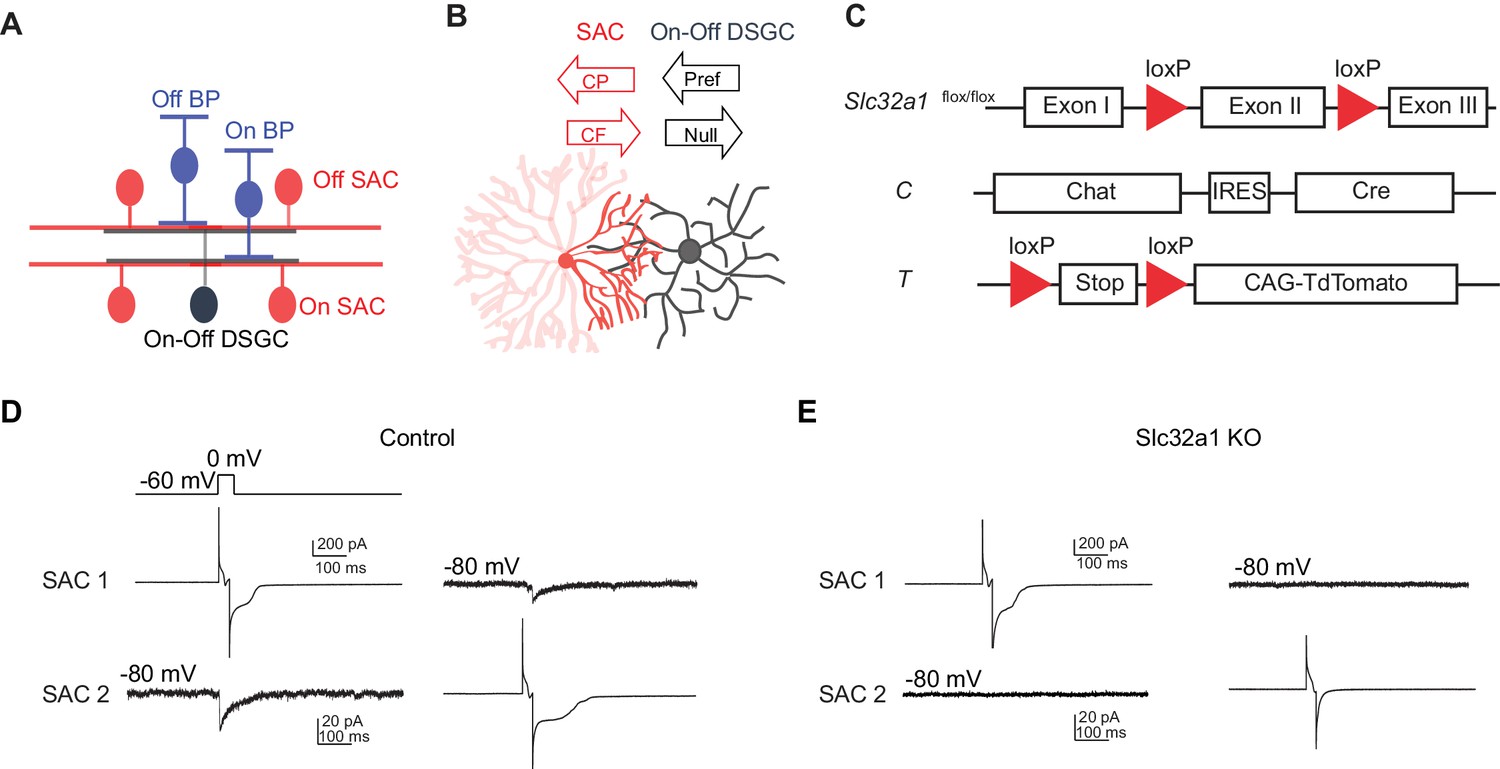
Genetic deletion of Slc32a1 from SACs eliminates reciprocal inhibition between SACs.
(A) Schematic shows laminar organization of cell types involved in the direction selective circuit in the IPL. (B) Schematic shows the orientation of SAC and DSGC dendrites connected by GABAergic synapses. Black arrows indicate referred and null directions of DSGC. GABAergic inputs onto DSGC come from SAC dendritic quadrant (dark red) that extends to the null direction of the DSGC. Red arrows indicate centrifugal (CF) and centripetal (CP) direction of motion for the SAC quadrant. Maximal activation and GABA release occurs in the CF direction, while minimal activation occurs in the CP direction. (C) Schematic diagram shows transgenes involved in Slc32a1 KO mice. (D) Voltage clamp traces from reciprocal On SAC-SAC pairs in control mouse (CT) show IPSCs evoked in one SAC at −80 mV by depolarizing the other in the presence of glutamatergic and nicotinic receptor antagonists (see Experimental procedures). (E) As in D but for Slc32a1 KO mouse (Slc32a1 flox/flox CT).
Figure 2 with 1 supplement
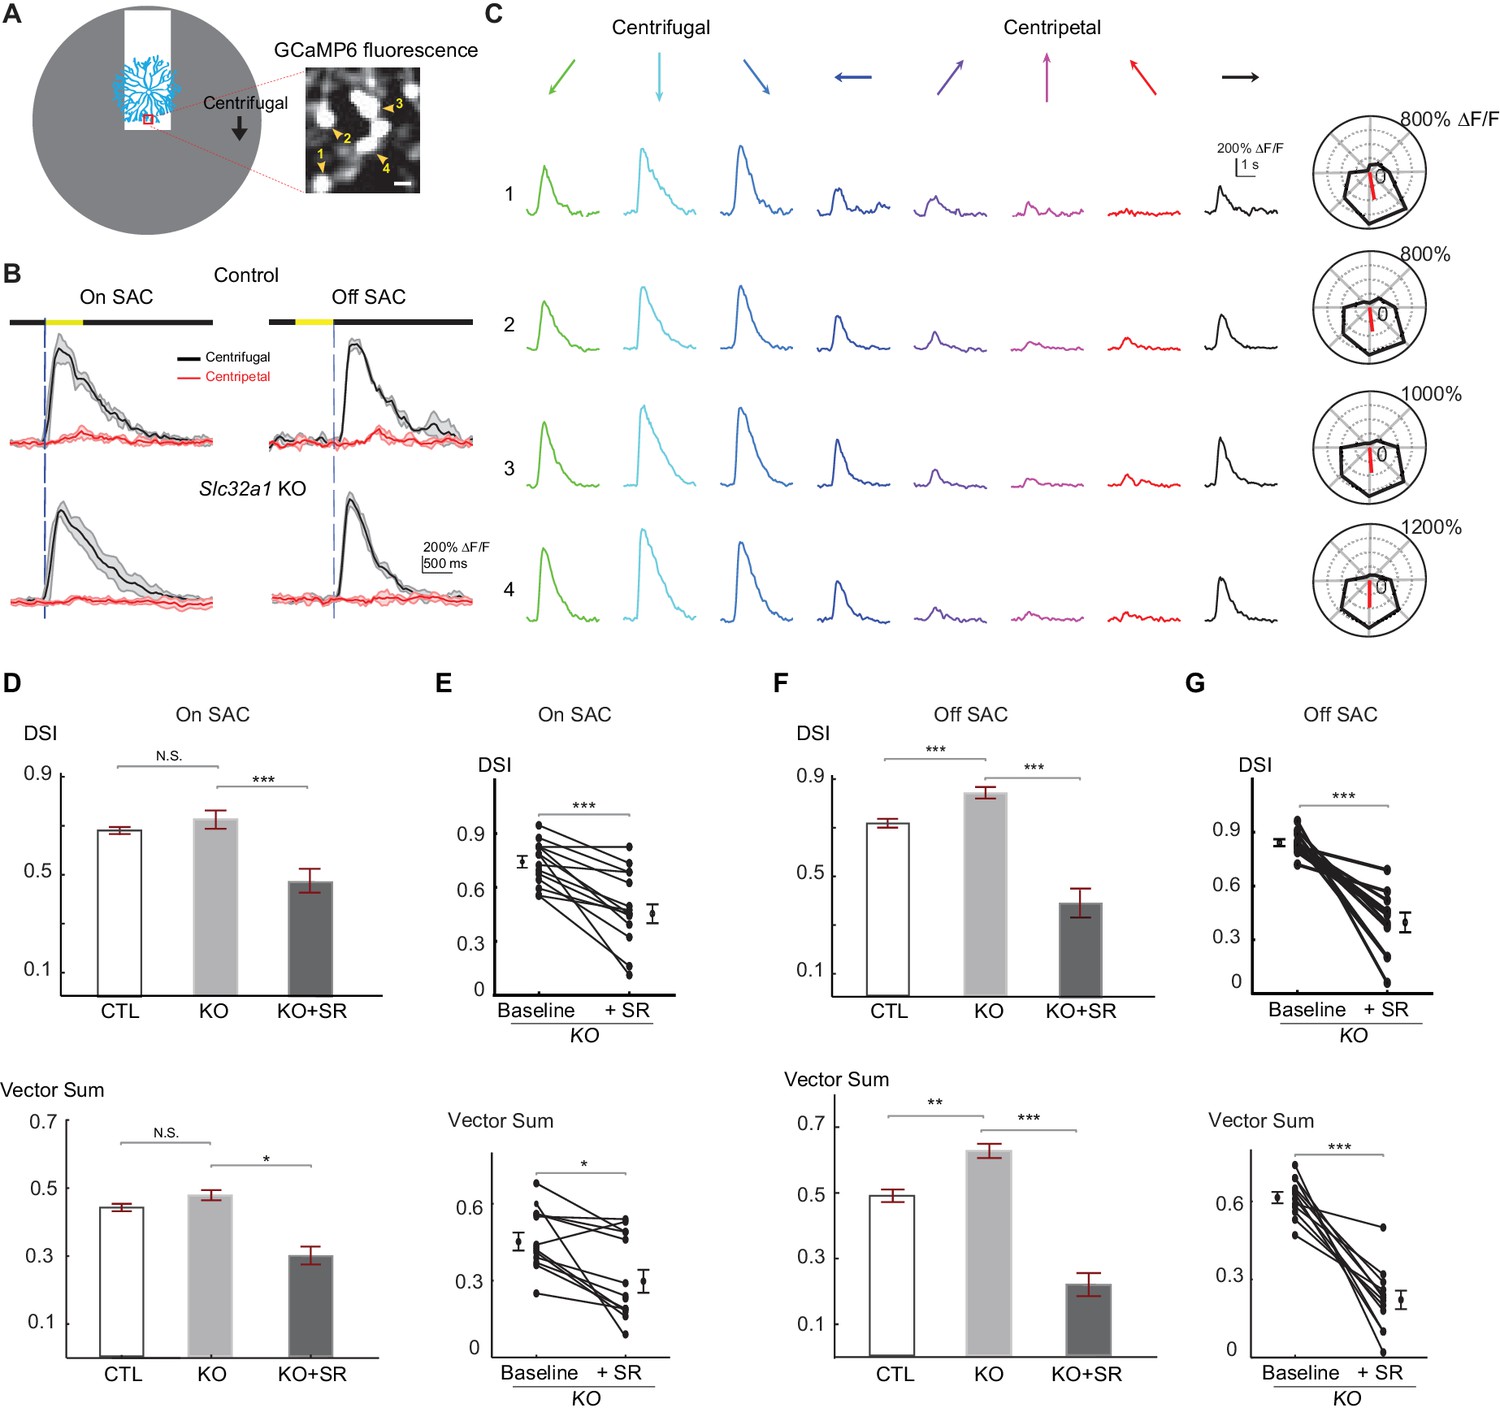
Centrifugal preference of SACs is not reduced in Slc32a1 KO mice.
(A) Left: Schematic of simple moving bar stimulus used during calcium imaging of SAC dendrites. Red square indicates the location of imaging window. Gray area indicates an area within which the moving bar (white) was presented. For the varicosities in the imaging window, downward motion of the bar corresponds to centrifugal (CF) motion, and upward motion corresponds to centripetal (CP) motion. Right: maximal intensity projection of GCaMP6m fluorescence in distal varicosities of an On-SAC from a control (C) mouse infected with AAV-floxed GCaMP6m. Four example varicosities are labeled 1–4. Scale bar: 1 μm. (B) Example GCaMP6m fluorescence traces from varicosities of the On and Off SACs in control (C) and Slc32a1 KO (Slc32a1 flox/flox C) mice during CF and CP motion. Dark lines represent mean values and shaded areas represent standard deviations. Yellow bar at the top indicates the time window when the bar moved across the imaging area. Blue vertical lines indicate when a leading edge reaches varicosities of On SAC and trailing edge reaches varicosities of Off SAC. (C) Example single sweeps of moving bar-evoked GCaMP6 fluorescence from varicosities 1–4 shown in (A). Polar plots of mean peak amplitude on right show centrifugal tuning of all four varicosities. (D) Summary bar graphs of DSI and vector sum values for On SACs in control (CTL) and Slc32a1 KO mice before and after adding SR95531. CTL: DSI 0.69 ± 0.01, vector sum 0.44 ± 0.01, n = 86 cells (1221 varicosities); Slc32a1 KO: DSI 0.73 ± 0.03, vector sum 0.48 ± 0.02, n = 20 cells (123 varicosities); Slc32a1 KO+SR: DSI 0.43 ± 0.05, vector sum 0.3 ± 0.05, n = 14 cells (86 varicosities). DSI CTL - Slc32a1 KO p=0.14; vector sum CTL- Slc32a1 KO p=0.66; ***p<0.0005; *p=0.008 (E) Pairwise comparison of DSI and vector sum values of individual On-SACs before and after adding SR95531 in Slc32a1 KO mice. Before adding SR95531: DSI 0.71 ± 0.04, vector sum 0.44 ± 0.04; After SR addition: DSI 0.43 ± 0.05, vector sum 0.3 ± 0.05. n = 14 cells (86 varicosities). ***p<0.0005; *p=0.015 (F). As in (D), summary bar graphs of DSI and vector sum values for Off-SACs. Control: DSI 0.72 ± 0.01, vector sum 0.48 ± 0.01, n = 35 cells (257 varicosities); Slc32a1 KO: DSI 0.83 ± 0.01, vector sum 0.59 ± 0.01; n = 33 cells (353 varicosities). Slc32a1 KO+SR: DSI 0.40 ± 0.05, vector sum 0.22 ± 0.04, n = 11 cells (178 varicosities). **p<0.005; ***p<0.0005. (G) As in (E), pairwise comparison of DSI and VS values of individual Off-SACs. Before adding SR95531: DSI 0.84 ± 0.02, vector sum 0.61 ± 0.02; After SR addition: DSI 0.4 ± 0.05, vector sum 0.22 ± 0.04. n = 11 cells (178 varicosities). ***p<0.0005. See also Figure 2—figure supplement 1 for cumulative probability distributions of peak fluorescence in On and Off SACs of control and Slc32a1 KO mice during CP and CF motion.
Figure 2—figure supplement 1

Centripetal response of Off SAC dendrites is selectively reduced in Slc32a1 KO mice.
(A) Cumulative probability distributions of peak fluorescence in dendritic varicosities of On SACs during CF (left) and CP (right) motion in control and Slc32a1 KO mice. Mean ± SEM: On-CP: Control 199 ± 15%, KO 247 ± 57%, p=0.02; On-CF: Control 1021 ± 67%, KO 1091 ± 142%, p=0.13. (B) As in A, cumulative probability distributions of peak fluorescence in dendritic varicosities of Off SACs. Mean ± SEM: Off-CP: Control 198 ± 33%, KO 94 ± 20%, *p=0.001; Off-CF: Control 1042 ± 137%, KO 868 ± 91%, p=0.35.
Figure 3
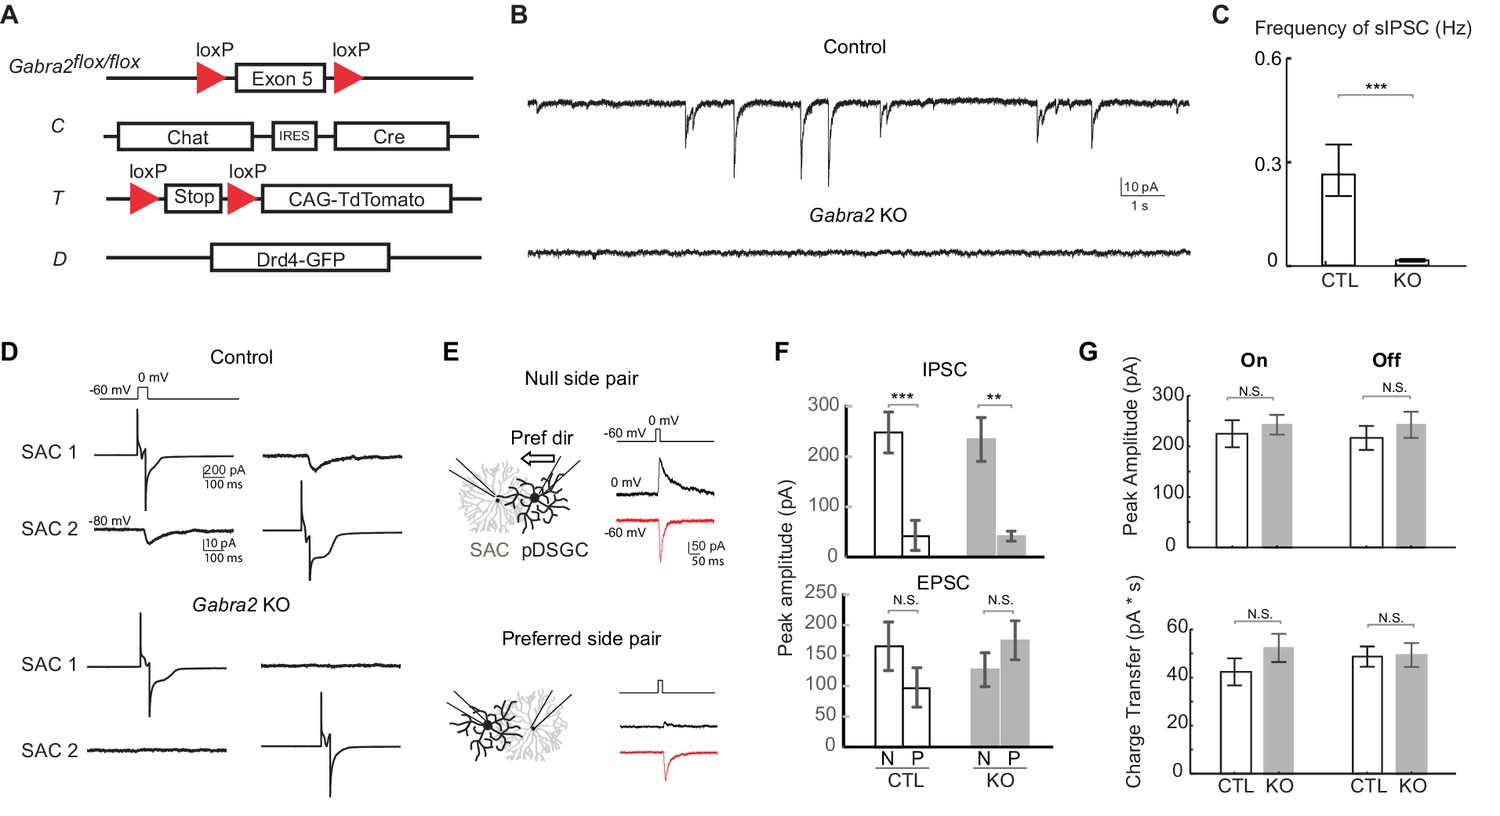
Genetic deletion of Gabra2 from SACs eliminates GABAergic inputs onto SACs without affecting the synapses between SACs and pDSGCs.
(A) Schematic diagram shows transgenes involved in Gabra2 conditional KO mice. The KO mice carry homozygous floxed Gabra2 allele to replace the endogenous Gabra2 gene for Cre-dependent excision (acronym: Gabra2flox/flox), and Chat-IRES-Cre (C). The floxed tdTomato (T) and a Drd4-GFP transgene to label pDSGCs (D) were also included when SACs or pDSGCs were targeted for electrophysiological recordings. (B) Example traces of spontaneous IPSCs (sIPSCs) in On SACs from control (CT) and Gabra2 KO (Gabra2flox/flox CT) mice. (C) Summary bar graph of sIPSC frequency in control and KO groups. Control: 0.28 ± 0.07 Hz, n = 18 cells, five mice; KO: 0.02 ± 0.04 Hz, n = 16 cells, four mice. ***p<0.0005. (D) Example evoked IPSC traces from reciprocal On SAC-SAC pairs in Control and Gabra2 KO mice. (E) Voltage clamp traces from null-side and preferred-side SAC-DSGC pairs in control (CTD) and KO (Gabra2flox/floxCTD) mice showing cholinergic EPSCs (red inward) and GABAergic IPSCs (black outward) evoked in pDSGCs by depolarizing SACs. Schematic on left shows soma locations of the null and preferred side pairs. Black arrows indicate the pDSGC’s preferred direction. (F) Summary bar graphs of IPSC and EPSC peak amplitudes in pDSGCs evoked by null (N) and preferred (P) side SACs in control and KO groups. IPSC: Control – N: 247.9 ± 40.8 pA, n = 14 cells, seven mice; Control – P: 43.0 ± 30.1 pA, n = 14 cells, seven mice; KO – N: 233.8 ± 43.7 pA, n = 7 cells, four mice; KO – P: 41.3 ± 10.0 pA, n = 8 cells, five mice, **p<0.005, ***p<0.0005; EPSC: Control – N: 165.2 ± 40.4 pA, n = 14 cells, seven mice; Control – P: 96.6 ± 32.2 pA, n = 14 cells, seven mice; KO – N: 127.4 ± 20.4 pA, n = 7 cells, four mice; KO – P: 175.0 ± 31.9 pA, n = 8 cells, five mice, one way ANOVA p=0.07. (G) Summary bar graphs of EPSC amplitudes and total charger transfer in pDSGCs evoked by onset and offset of a bright spot in control and KO mice. Peak amplitude: Control On, 224.6 ± 26.7 pA; KO On, 242.7 ± 19.5 pA, p=0.58; Control Off, 216.5 ± 23.8 pA; KO Off, 242.4 ± 25.9 pA, p=0.46. Charge Transfer: Control On, 42.3 ± 5.6 pA∙s; KO On, 52.2 ± 5.9 pA∙s, p=0.22; Control Off, 48.7 ± 4.2 pA∙s; KO Off, 49.4 ± 4.9 pA∙s, p=0.92. Control, n = 21 cells, nine mice; KO, n = 30 cells, 11 mice.
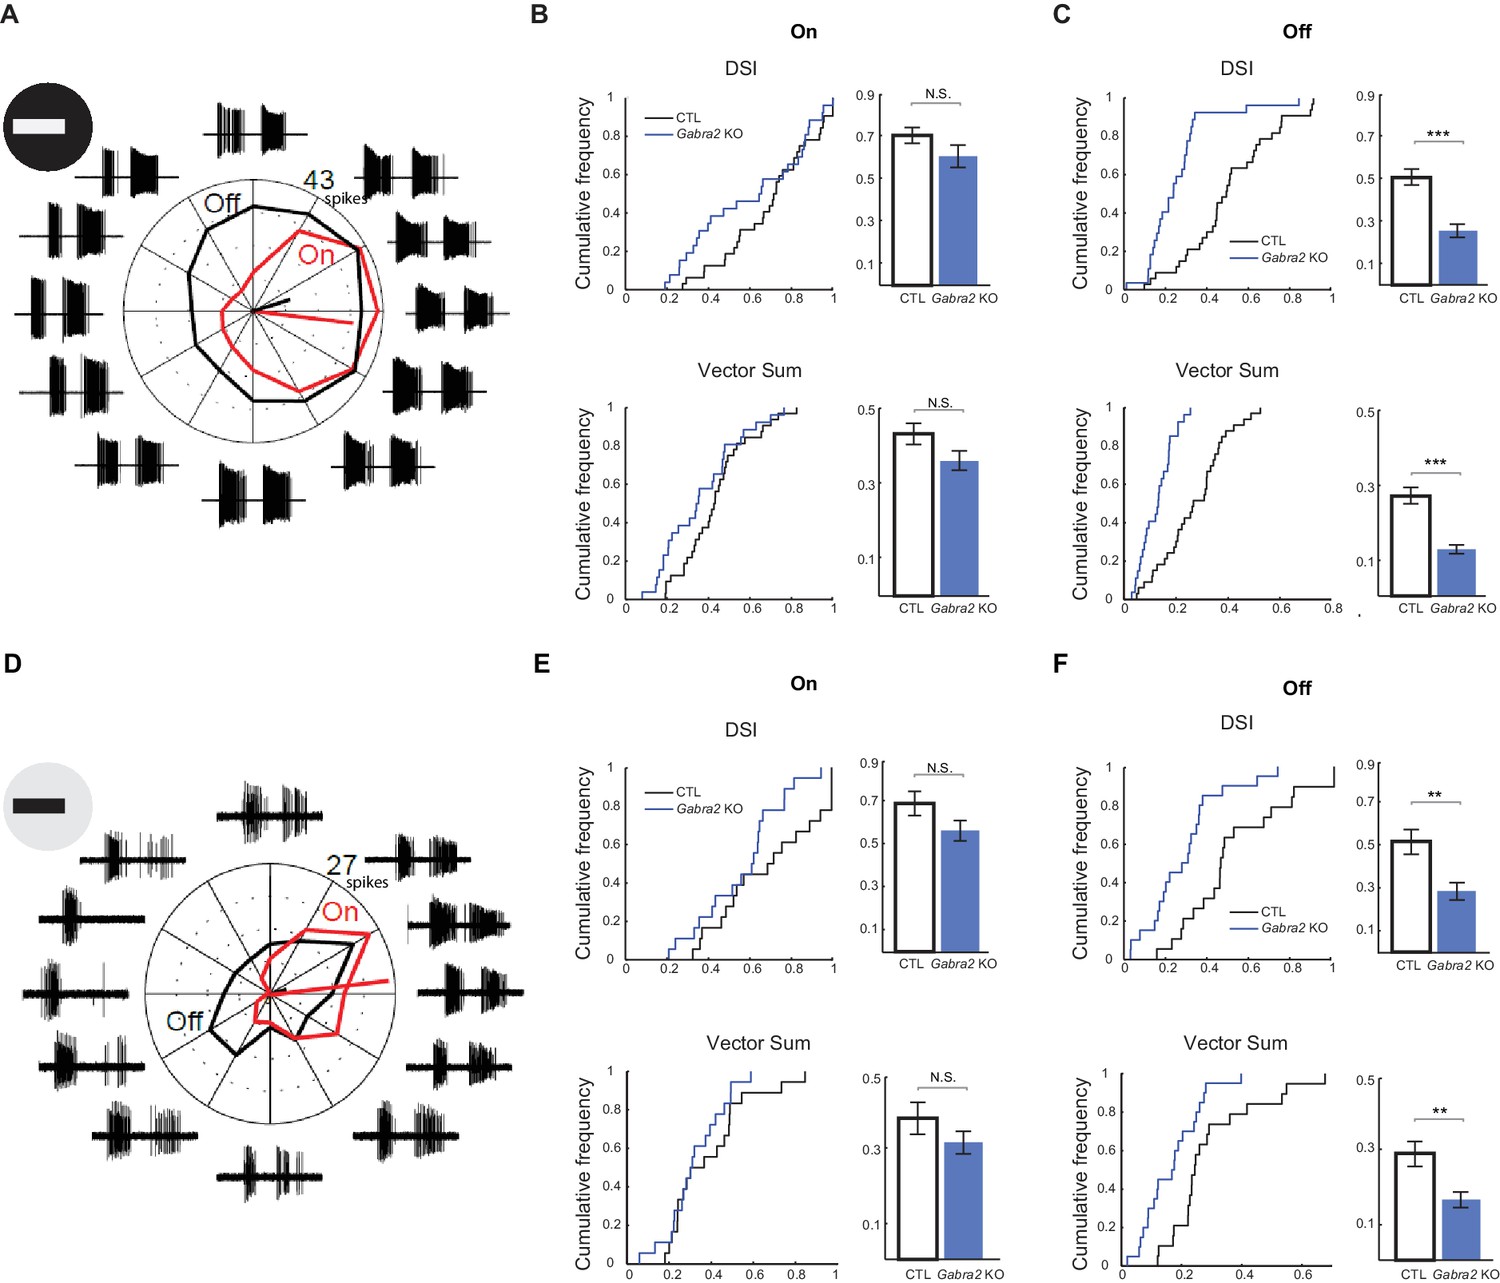
Figure 4 with 1 supplement
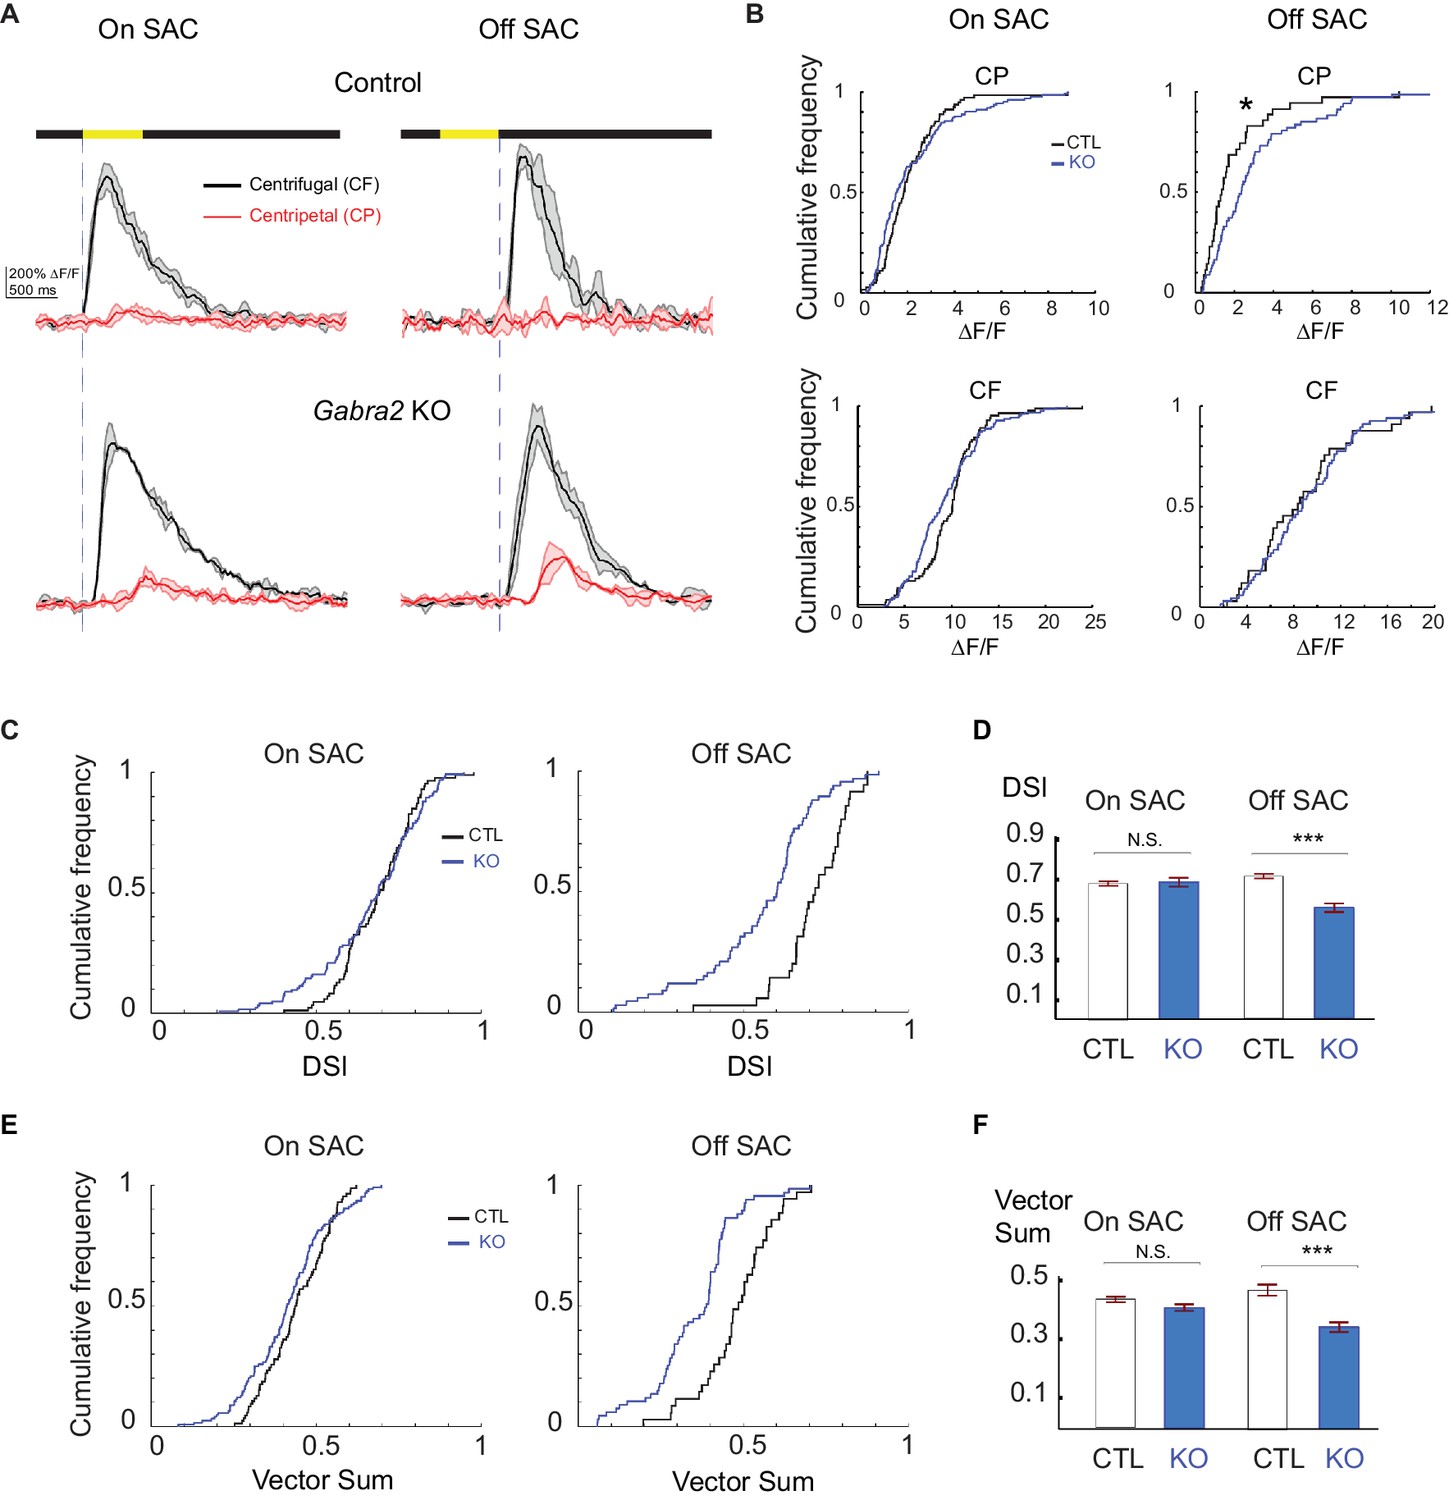
Centrifugal preference of Off, but not On, SACs is impaired in Gabra2 KO mice.
(A) Example GCaMP6m fluorescence traces from varicosities of On (left) and Off (right) SACs in control (C) and KO (Gabra2flox/flox C) mice during CF and CP motion. Dark lines represent mean values and shaded areas represent standard deviations. Yellow bar at the top indicates the time window when the bar moved across the imaging area. Blue vertical lines indicate when a leading edge reaches varicosities of On SAC and trailing edge reaches varicosities of Off SACs. (B) Cumulative probability distributions of peak fluorescence from dendritic varicosities in On (left) and Off (right) SACs of control and Gabra2 KO mice during CP and CF motion. (C) Cumulative probability distributions of DSI values from dendritic varicosities in On and Off SACs of control and KO mice. (D) Summary bar graph of DSI values from dendritic varicosities in On and Off SACs of control and KO mice: On SAC: Control 0.69 ± 0.01, KO 0.71 ± 0.02, p=0.22; Off SAC: Control 0.72 ± 0.01, KO 0.55 ± 0.02, ***p<0.0005. (E) Cumulative probability distributions of vector sum values from dendritic varicosities in On and Off SACs of control and KO mice. (F) Summary bar graph of vector sum values from dendritic varicosities in On and Off SACs of control and KO mice. On SAC: control 0.44 ± 0.01, KO 0.41 ± 0.01, p=0.26; Off SAC: control 0.48 ± 0.02, KO 0.35 ± 0.02, ***p<0.0005. Control On n = 86 cells (1221 varicosities); KO On n = 124 cells (1467 varicosities); Control Off n = 35 cells (257 varicosities); KO Off n = 67 cells (897 varicosities). See also Figure 4—figure supplement 1 for the effect of SR95531 on direction selectivity of On SACs in Gabra2 KO mice.
Figure 4—figure supplement 1
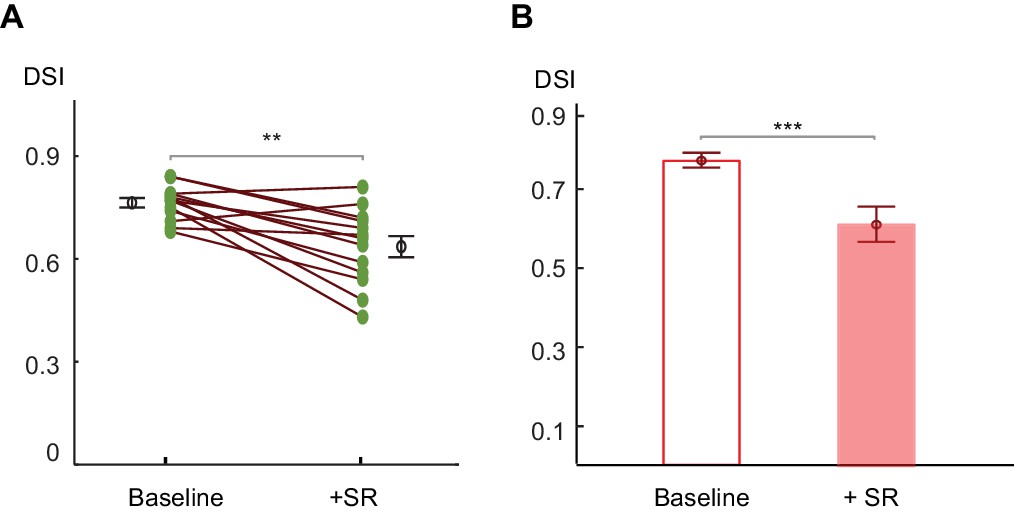
Centrifugal preference of On SACs is impaired in Gabra2 KO mice in the presence of SR95531.
(A) Pairwise comparison of DSI values of individual On SACs before and after adding SR95531 in Gabra2 KO mice. Paired t-test **p<0.005 (B) Summary bar graph of DSI values. Error bars represent standard error of the mean (SEM).Unpaired t-test ***p<0.0005. Baseline: 0.76 ± 0.01; + SR: 0.63 ± 0.03; n = 13 cells, three mice.
Figure 5

Off inhibitory inputs onto pDSGCs display impaired directional selectivity in Gabra2 KO mice.
(A) Example IPSC traces of pDSGCs evoked by leading edge (On) of a bright bar moving in the preferred and null directions in control (CTD) and Gabra2 KO (Gabra2flox/flox CTD) mice. (B) Summary bar graphs of DSI values for peak amplitude and charge transfer of the On component of IPSCs in control and KO groups. Peak Amplitude: Control 0.49 ± 0.03, KO 0.44 ± 0.03, p=0.19; Charge Transfer: Control 0.53 ± 0.04, KO 0.49 ± 0.03, p=0.16. Control n = 32 cells, 13 mice; KO n = 33 cells, 18 mice. (C) As in (A), example IPSC traces of pDSGCs evoked by trailing edge (Off) of a bright moving bar. (D) As in (B), summary bar graphs for the Off component of IPSCs in pDSGCs. Control 0.72 ± 0.03, KO 0.58 ± 0.03, *p=0.01; Charge Transfer: Control 0.73 ± 0.03, KO 0.51 ± 0.03, **p<0.005.
Figure 6
Off component of pDSGC spiking activity displays impaired directional tuning in Gabra2 KO mice.
(A – C) Spiking response of pDSGCs to a bright moving bar. Control n = 33 cells, 20 mice; Gabra2 KO n = 37 cells, 14 mice. (A) Example loose-patch recordings and polar plot for a pDSGC in a Gabra2 KO (Gabra2flox/flox CTD) mouse in response to a bright bar moving in 12 directions. Trace for each direction is the overlay of three trials. The leading edge-evoked On and trailing edge-evoked Off components of the spiking activity can be clearly separated. Mean spike counts for On (red) and Off (black) responses are shown on the polar plot. (B) Cumulative distributions (left) and summary bar graphs (right) of DSI and vector sum values for On responses of pDSGCs during the bright moving bar stimulus. DSI: Control 0.70 ± 0.03, KO 0.60 ± 0.04, p=0.14; vector sum: Control 0.43 ± 0.03; KO 0.36 ± 0.03, p=0.08. Control n = 59 cells, 20 mice; KO n = 46 cells, 14 mice. (C) As in (B), DSI and vector sum for Off responses of pDSGCs during the bright moving bar stimulus. DSI: Control 0.51 ± 0.04, KO 0.26 ± 0.03, ***p<0.0005; vector sum: Control 0.27 ± 0.02, KO 0.13 ± 0.01, ***p<0.0005. (D – F) Spiking response of pDSGCs to a dark moving bar. Control n = 19 cells, nine mice; KO n = 20 cells, nine mice. (D) As in (A), example loose-patch recordings and polar plot for a pDSGC in a Gabra2 KO (Gabra2flox/flox CTD) mouse in response to a dark bar moving in 12 directions. (E) As in (B), DSI and vector sum for On responses of pDSGCs during the dark moving bar stimulus. DSI: Control 0.69 ± 0.05, KO 0.57 ± 0.04, p=0.09; vector sum: Control 0.39 ± 0.04, KO 0.32 ± 0.03, p=0.23. Control n = 19 cells, nine mice; KO n = 20 cells, nine mice. (F) As in (C), DSI and vector sum for Off responses of pDSGCs during the dark moving bar stimulus. DSI: Control 0.52 ± 0.05, KO 0.28 ± 0.04, **p<0.005; VS: Control 0.29 ± 0.03, KO 0.16 ± 0.02, **p<0.005.
Figure 7

Direct inhibitory inputs onto On SACs are required for robust direction selectivity against noisy background.
(A) Visual stimulus (top) is a bright bar moving on a checkered background with different checker intensities, and loose-patch recordings (bottom) show pDSGC responses in control (CTD) and Gabra2 KO (Gabra2flox/flox CTD) mice in preferred and null directions. (B) Summary plot of DSI values of the On component of pDSGC spiking activity evoked by a bright bar moving against a flickering checkerboard background. Checker intensity is expressed as the percentage of the brightness of the moving bar. Bars below plot indicate the mean background intensity of the flickering checkerboard (top) and the equivalent contrast of the moving bar stimulus (bottom). Control, n = 12 cells, four mice; Gabra2 KO, n = 18 cells, four mice. (C) As in (B), summary plot of DSI of Off component of pDSGC spiking activity. (D) Summary bar graphs of DSI values from On and Off components of pDSGC spiking at different background illuminance and contrast levels during the simple moving bar stimulus against a homogeneous background. Bars below plots indicate the background intensity (x103 R*/rod/s) and contrast of the bar. On: Condition A: Control 0.63 ± 0.06, n = 17 cells from seven mice, KO 0.56 ± 0.07, n = 14 cells from six mice, p=0.31; Condition B: Control 0.60 ± 0.06, n = 8 cells from five mice, KO 0.58 ± 0.08, n = 10 cells from five mice, p=0.83; Condition C: Control 0.48 ± 0.05, n = 12 cells from five mice, KO 0.49 ± 0.05, n = 10 cells from five mice, p=0.95; Condition D: Control 0.61 ± 0.06, n = 14 cells from seven mice, KO 0.61 ± 0.04, n = 12 cells from five mice, p=0.73; Off: Condition A: Control 0.50 ± 0.06, KO 0.17 ± 0.04, p=0.004; Condition B: Control 0.47 ± 0.06, KO 0.24 ± 0.04, p=0.01; Condition C: Control 0.44 ± 0.05, KO 0.21 ± 0.05, p=0.004; Condition D: Control 0.42 ± 0.05, KO 0.22 ± 0.04, p=0.006. For (B-D), *p<0.05; **p<0.005; ***p<0.0005.
Videos
Video 1
Calcium imaging of On SAC varicosities expressing GCaMP6m in a control mouse in response to moving bar stimulation.
This video shows continuous real-time calcium imaging of an On SAC in the control group (C) in response to a bright bar moving in eight directions. Left: raw fluorescence video, scale bar: 5 μm. Upper right: mean fluorescence change of all varicosities in the video to the left. Lower right: schematic moving bar stimulus synchronized with the imaging video and the trace. Black filled circle indicates the area of the retina where the bar was presented. Green square in the middle indicates the location of the imaging window. Calcium responses are triggered by the leading edge of the moving bar.
Video 2
Calcium imaging of Off SAC varicosities expressing GCaMP6m in a control mouse in response to moving bar stimulation.
As in Video 1, this video shows continuous real-time calcium imaging of an Off SAC in the control group in response to the moving bar stimulus. Note that calcium responses are triggered by the trailing edge of the moving bar.
Video 3
Calcium imaging of Off SAC varicosities expressing GCaMP6m in a Gabra2 KO mouse in response to moving bar stimulation.
As in Video 1, this video shows continuous real-time calcium imaging of an Off SAC in the Gabra2 KO group (Gabra2flox/flox C) in response to the moving bar stimulus.
Video 4
Calcium imaging of On SAC varicosities expressing GCaMP6m in a Gabra2 KO mouse in response to moving bar stimulation.
As in Video 1, this video shows continuous real-time calcium imaging of an On SAC in the Gabra2 KO group in response to the moving bar stimulus.
Download links
A two-part list of links to download the article, or parts of the article, in various formats.
Downloads (link to download the article as PDF)
Open citations (links to open the citations from this article in various online reference manager services)
Cite this article (links to download the citations from this article in formats compatible with various reference manager tools)
Stimulus-dependent recruitment of lateral inhibition underlies retinal direction selectivity
eLife 5:e21053.
https://doi.org/10.7554/eLife.21053


