PCGF6-PRC1 suppresses premature differentiation of mouse embryonic stem cells by regulating germ cell-related genes
- RIKEN Center for Integrative Medical Sciences, Japan
- Core Research for Evolutional Science and Technology, Japan
- National University of Singapore, Singapore
- Kumamoto University, Japan
- Hiroshima University, Japan
- Faculty of Medical Sciences, Kyushu University, Japan
- Oxford University, United Kingdom
- Kazusa DNA Research Institute, Japan
- University of Oxford, United Kingdom
- Research Center for Genomic Medicine, Saitama Medical University, Japan
Figures
Figure 1 with 1 supplement
Biochemical properties of PCGF6-PRC1 and its target genes in ESCs.
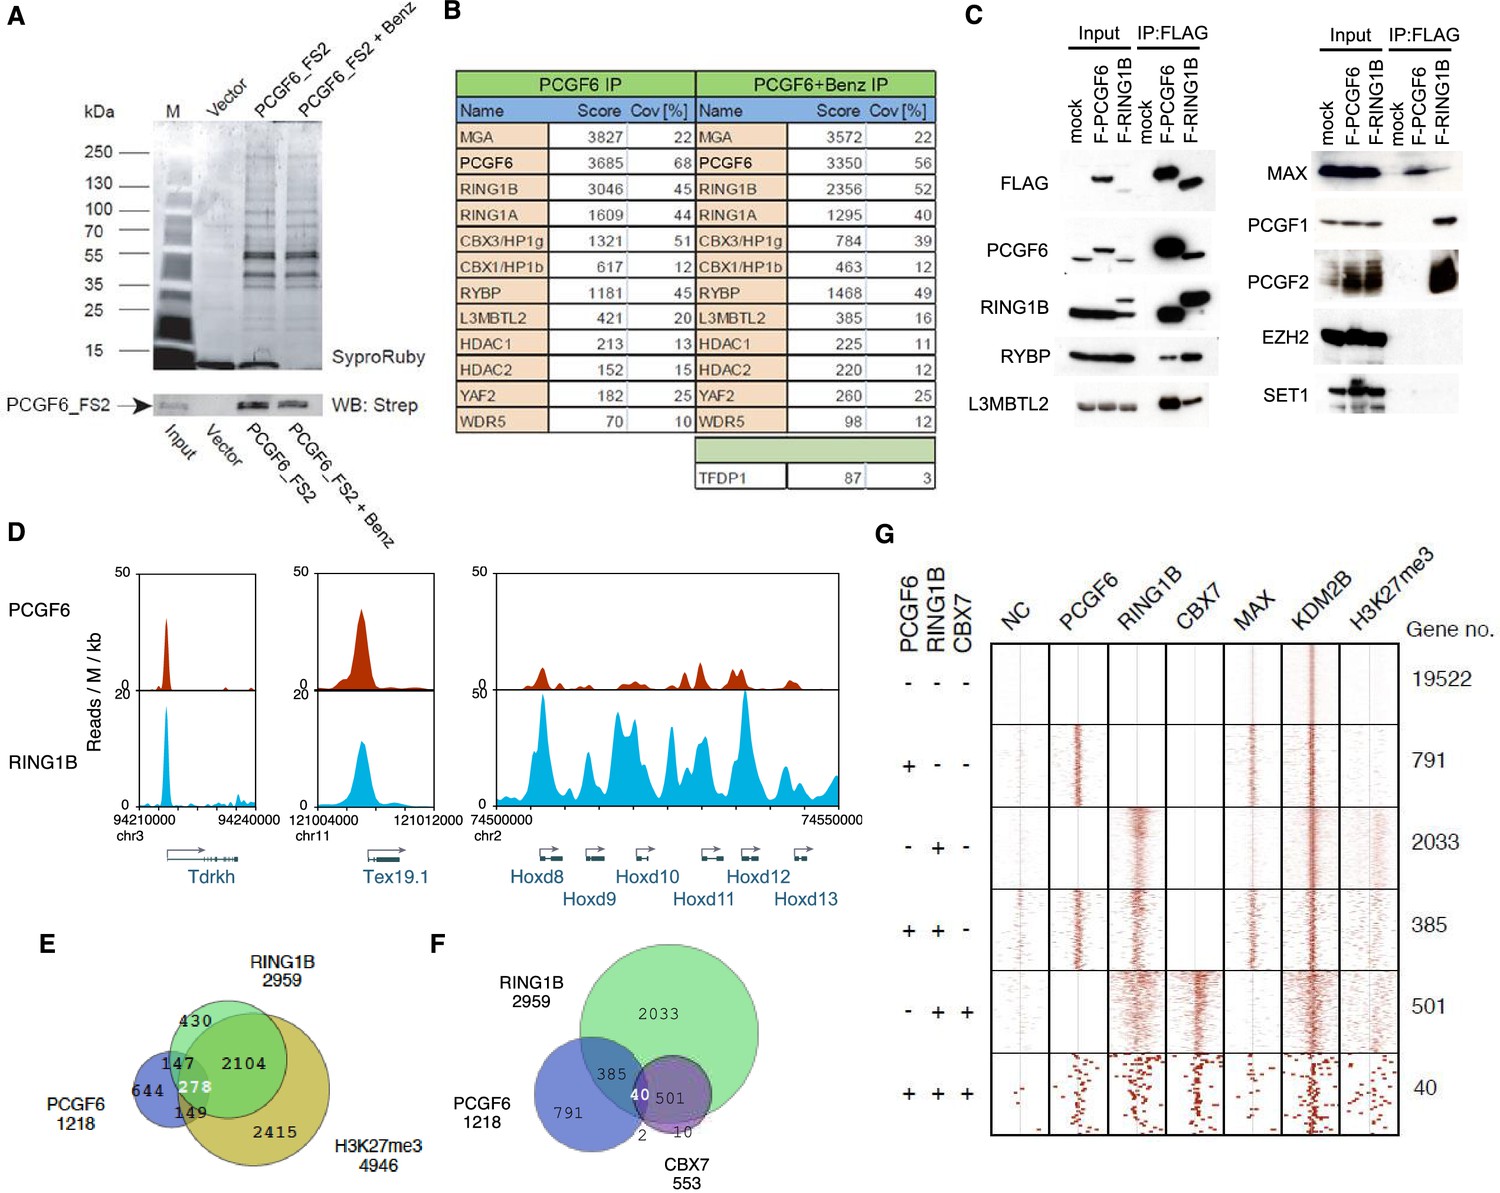
(A) Affinity purification of PCGF6-containing complexes in ESCs. To purify PCGF6 and associated proteins, a mouse ESC cell line stably expressing Flag-2xStrepII (FS2)-tagged PCGF6 was generated. Nuclear extract was isolated from this cell-line, PCGF6 was affinity purified, and the purified proteins were subjected to mass spectrometry. Purified PCGF6 fractions were resolved by gradient SDS-PAGE and visualized by SyproRuby staining. The purifications were performed in the absence and presence of benzonase (Benz) to exclude DNA-mediated interactions and a cell line containing only the empty vector was used as control for non-specific binding to the affinity matrix. The elutates were probed by western blot for streptavidin (Strep). (B) Identification of proteins that form stable complexes with PCGF6 in ESCs. Elutions from the PCGF6 affinity purification were directly analyzed by tryptic digestion followed by peptide identification by LC-MS/MS. The Mascot scores and peptide coverage are shown for the respective affinity purifications. (C) Confirmation of PCGF6-containing complexes by immunoprecipitation-immunoblot (IP-IB) analysis. Whole-cell extracts (WCE) from ESCs expressing FLAG-tagged PCGF6 or RINGB were subjected to IP using anti-FLAG antibody. The WCE and immunoprecipitates were separated on SDS-PAGE and analyzed by IB with the indicated antibodies. (D) Screenshot views for the distribution of PCGF6 (red) and RING1B (blue) at target genes in ESCs determined by ChIP-seq. The chromosomal positions are indicated on the x-axis. The transcription start sites (TSSs) are denoted by arrows. (E) Venn diagram representation for the overlap of PCGF6, RING1B and H3K27me3 target genes in ESCs identified by ChIP-seq. The number of genes bound by PCGF6, RING1B and H3K27me3 and included in each fraction are indicated. (F) Venn diagram representing the overlap of PCGF6, RING1B and CBX7 target genes. Published ChIP-seq data for CBX7 was obtained from NCBI GEO (accession number GSM1041373). (G) A heat map view for distribution of PCGF6, RING1B, CBX7, MAX, KDM2B and H3K27me3 in ±4 kb genomic regions around transcription start sites (TSS). Genes are classified based on their occupancy by PCGF6, RING1B and CBX7 in ESCs. The signal from a negative control (NC: FLAG-ChIP in mock transfected ESCs) was also shown.
-
Figure 1—source data 1
Raw data for LC-MS/MS analysis shown in Figure 1B.
- https://doi.org/10.7554/eLife.21064.003
Figure 1—figure supplement 1
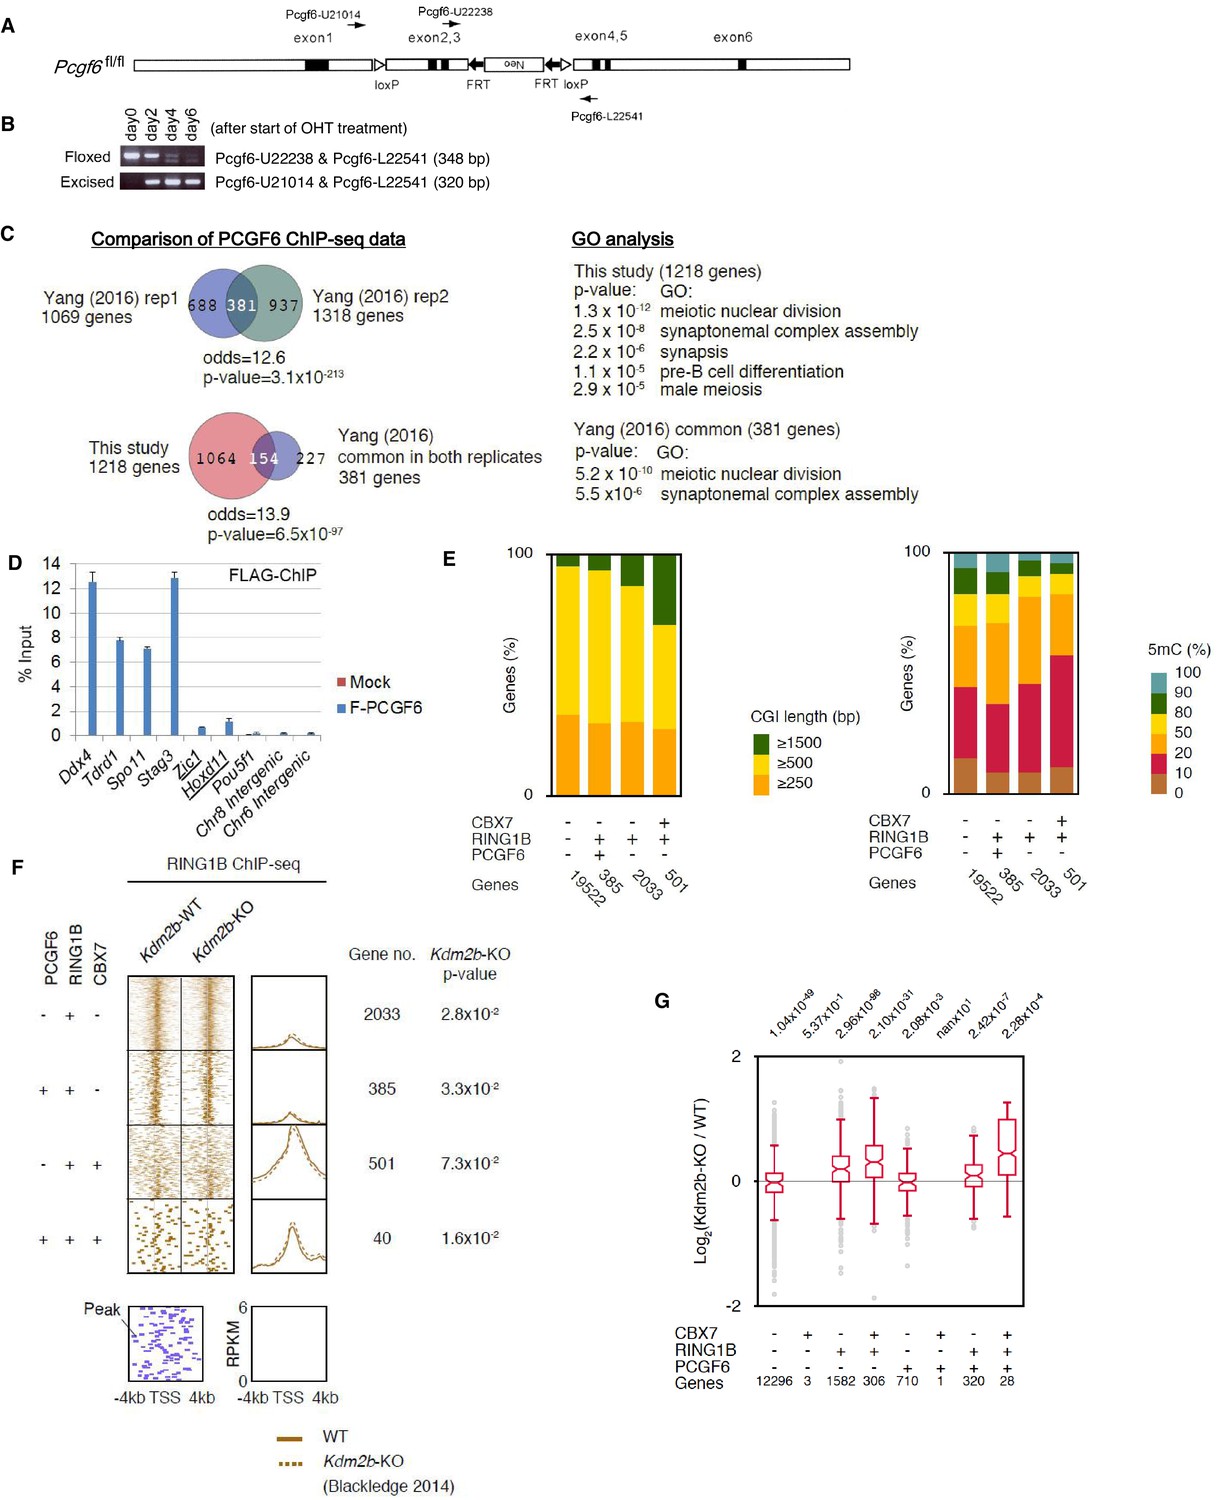
Generation of a Pcgf6 conditional allele and properties of CpG islands at PCGF6-PRC1 target genes.
(A) Schematic representation of the construct for conditional targeting of the Pcgf6 locus. The targeting construct contains an FRT (closed arrows)-flanked neomycin resistance gene (neo), and the second and the third exons (closed rectangles) of the mouse Pcgf6 gene are flanked by two loxP sites (open triangles). (B) Genomic PCR using the indicated primers demonstrating the kinetics of the excision of the loxP-flanked region in Pcgf6fl/fl; Rosa26::CreERT2tg/+ ESCs after OHT treatment. (C) Comparison of the PCGF6 ChIP-seq data in this study with those reported in a previous paper (Yang et al., 2016). (D) ChIP-qPCR data showing a strong binding of FLAG-tagged PCGF6 to representative PCGF6 targets (Ddx4, Tdrd1, Spo11 and Stag3) determined by ChIP-seq analysis shown in Figure 1 and a marginal binding to known canonical PRC1 targets (underlined). (E) Comparison of CpG island (CGI) length (left) and 5-methyl-cytosine (5mC) levels (right) of CBX7-, RING1B-, and/or PCGF6-bound genes. The number of genes included in each subset is shown at the bottom. (F) A heat map view of RING1B distribution in ±4 kb genomic regions around TSS in wild type (WT), and Kdm2b-KO ESCs. RING1B-bound genes are further subclassified by binding of PCGF6 and CBX7 (left). Average distribution and p-value for its change in Kdm2b-KO are also shown (right). (G) Gene expression changes in Kdm2b-KO ESCs. Box plot representation of gene expression changes induced by deletion of Kdm2b for genes bound by CBX7, PCGF6 and/or RING1B. The box plots represent the median (horizontal line), interquartile range (box), range (whiskers), and outliers (circles). The number of genes included in each subset is shown at the bottom. The p-values for the difference of expression changes between the indicated two groups were determined by the Student’s t-test and are indicated above each graph.
Figure 2 with 1 supplement
RING1B-dependent repression of target genes by PCGF6-PRC1.
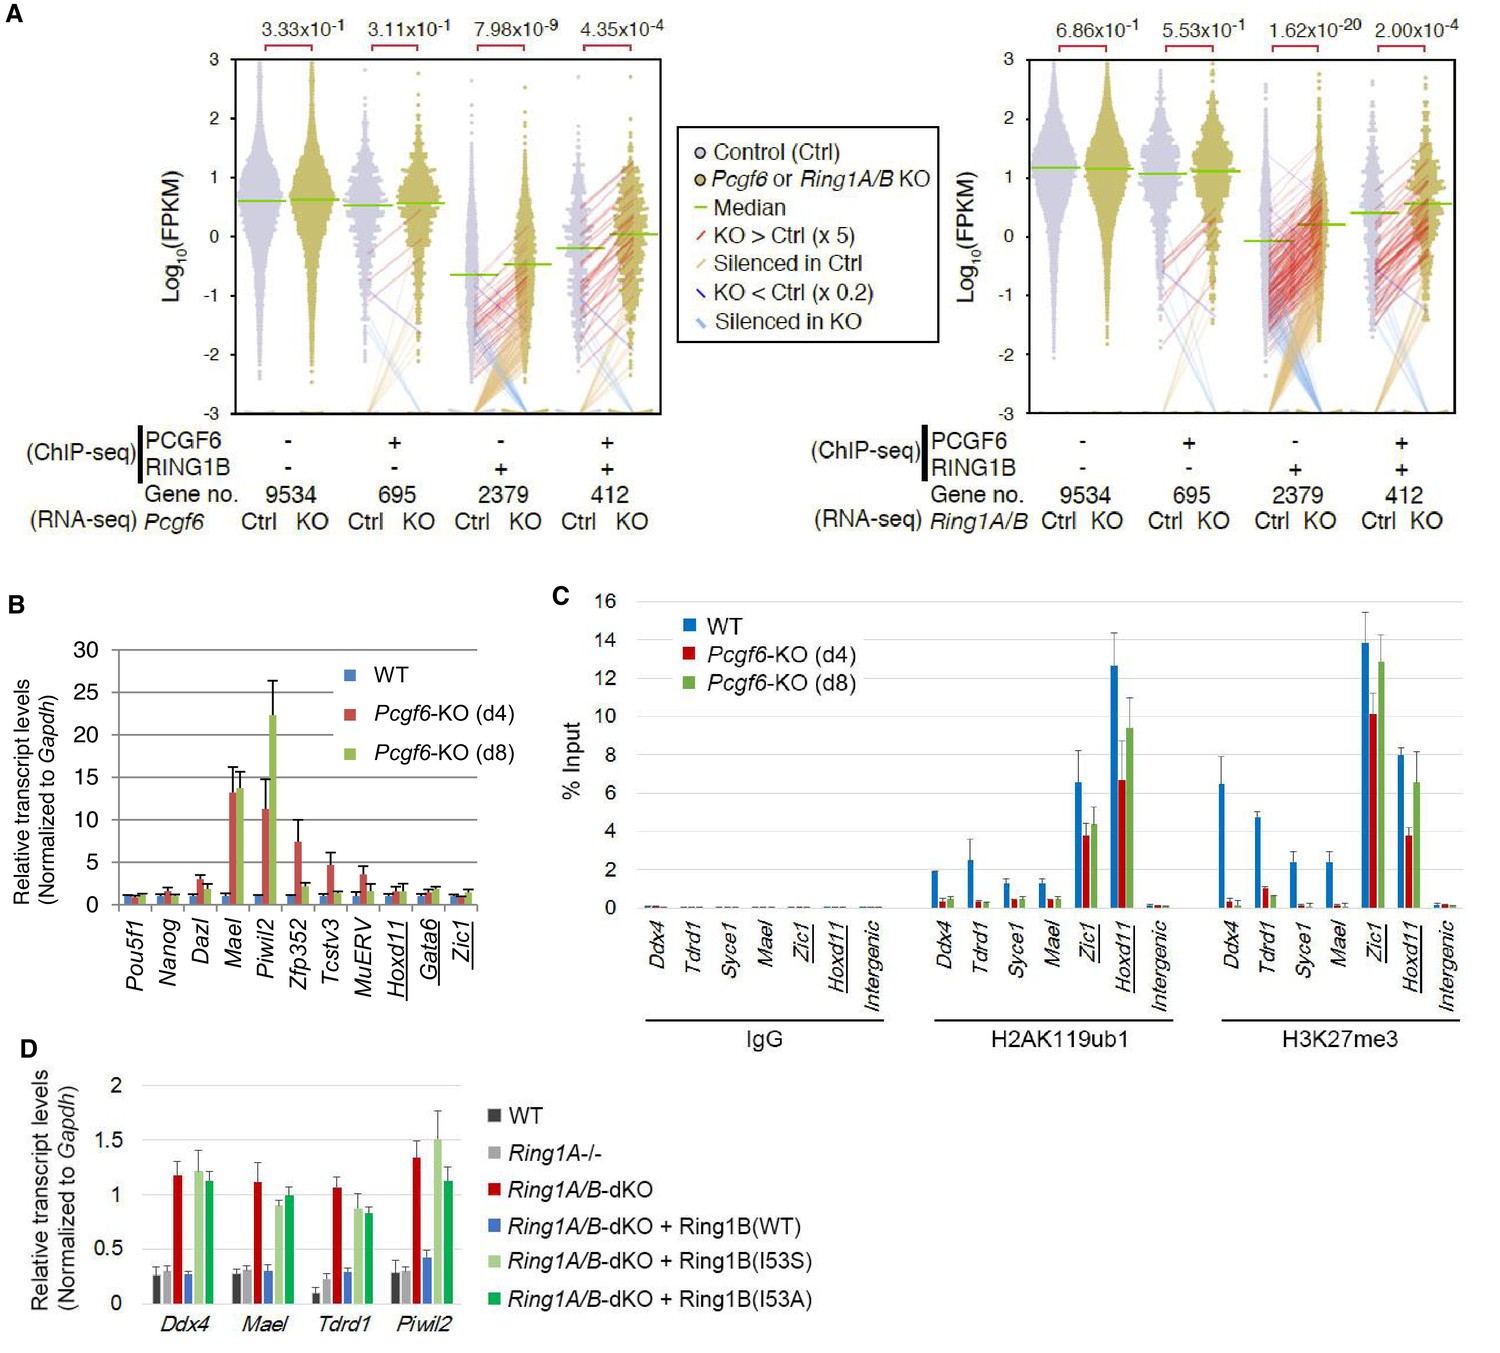
(A) Dot plot representation for gene expression changes in Pcgf6-KO (left) and Ring1A/B-dKO (right) ESCs. Expression levels of respective genes (FPKM: determined by RNA-seq) in each group (classified by ChIP-seq) in control (Ctrl) and respective knockouts (KO) are shown by grey and yellow dots, respectively. The median of FPKM in each group is indicated by a green horizontal line. Genes whose expression (FPKM) changed more than 5-fold were indicated by red (up-regulated in KO) or blue (down-regulated in KO) lines. Genes silenced in Ctrl but active in KO are indicated by orange lines, while genes vice versa are indicated by light blue lines. The number of genes included in each subset is shown at the bottom. p-values for the difference of expression changes between Ctrl and KO were calculated by the Student’s t-test and are indicated above each graph. (B) RT-qPCR-based validation for expression changes of selected genes in Pcgf6-KO ESCs. Expression levels of genes required for pluripotency, or bound by PCGF6-PRC1 or canonical PRC1 (underlined) in Pcgf6fl/fl;Rosa26::CreERT2tg/+ ESCs before (WT) or after OHT treatment (day 4 and 8). Expression levels were normalized to a Gapdh control and are depicted as fold change relative to OHT-untreated (WT) ESCs. Error bars represent standard deviation determined from at least three independent experiments. (C) Changes in local H2AK119ub1 and H3K27me3 deposition at selected PCGF6-PRC1 target genes in Pcgf6-KO ESCs. Local levels of H2AK119ub1 and H3K27me3 at promoter regions of genes bound by PCGF6-PRC1 or canonical PRC1 (underlined) in Pcgf6fl/fl;Rosa26::CreERT2tg/+ ESCs before (WT) or after (day 4 and 8) OHT treatment were determined by ChIP-qPCR analysis. The relative amount of ChIPed DNA is depicted as a percentage of input DNA. Error bars represent standard deviation determined from at least three independent experiments. (D) Requirement of RING1B catalytic activity for repression of genes bound by PCGF6-PRC1. Expression levels of the indicated genes in mock-transfected Ring1A−/−;Ring1Bfl/fl;Rosa26::CreERT2tg/+ ESCs before (Ring1A−/−) and 2 day after OHT treatment (Ring1A/B-dKO) and in those stably expressing wild type (WT) or catalytically-dead (I53S, I53A) Ring1B. Expression levels were normalized to a Gapdh control and are depicted as fold change relative to OHT-untreated mock-transfected parental ESCs (Ring1A−/−). Those in wild-type ESCs (WT) are also shown. Error bars represent standard deviation determined from at least three independent experiments.
Figure 2—figure supplement 1

Repression of target genes by PCGF6-PRC1.
(A) Venn diagram depicting the overlap of more than 2-fold up-regulated genes upon deletion of Pcgf6 (in Pcgf6fl/fl;Rosa26::CreERT2tg/+ ESCs; 4 days after OHT treatment) or Ring1B (in Ring1A−/−;Ring1Bfl/fl;Rosa26::CreERT2tg/+ ESCs; 4 days after OHT treatment). The number of genes de-repressed in Pcgf6-KO and Ring1A/B-dKO and included in each fraction is indicated. Odds ratio (OR) and p-value for the overlap between the indicated two groups were calculated by the Student’s t-test. (B) Graphic representation of expression levels for PCGF6-bound and/or RING1B-bound genes. The average, deviation and distribution of FPKM values for the respective subset of genes determined by RNA-seq analysis are shown. The box plots represent the median (horizontal line; values are indicated below the plots), interquartile range (box), range (whiskers), and outliers (circles). The number of genes included in each subset is shown at the bottom. The p-values for the difference of expression changes between the indicated two groups were calculated by the Student’s t-test and are indicated above each graph. Results for total genes, genes associated with and without CpG islands are shown. (C) Expression levels of the indicated genes in wild-type (WT) and Ring1A−/−;Ring1Bfl/fl;Rosa26::CreERT2tg/+ ESCs before (Ring1A−/−) or after OHT treatment [Ring1A/B-dKO (day4)]. Underlined genes are canonical PRC1 targets. Expression levels were normalized to a Gapdh control and are depicted as fold change relative to mock (OHT-untreated) ESCs. Error bars represent standard deviation determined from at least three independent experiments. p-values for the expression changes upon Ring1B deletion were calculated by the Student’s t-test. (D) Gene ontology (GO) analysis of genes more than 2-fold up-regulated both in Pcgf6-KO and Ring1A/B-dKO ESCs was performed using http://geneontology.org/ and is shown in the upper table. GO analysis of genes up-regulated more than 2-fold in Ring1A/B-dKO but not in Pcgf6-KO was performed as well and is shown in the lower table. The significance of the enrichment of each GO term is indicated by a p-value for each category of biological process. (E) Local levels of H3K27me3 at the indicated promoter regions in wild type (WT) and Eed-KO ESCs were determined by ChIP and site-specific real-time PCR. Underlined genes are canonical PRC1 targets. The relative amount of ChIPed DNA is depicted as a percentage of input DNA. Error bars represent standard deviation determined from at least three independent experiments. The p-values for the difference in H3K27me3 levels at the respective loci between wild type and Eed-KO ESCs were determined by the Student’s t-test. (F) EED is dispensable for repression of genes bound by PCGF6-PRC1. Comparative expression levels of selected genes bound by PCGF6-PRC1 or canonical PRC1 (underlined) in wild type (WT) and Eed-KO ESCs. Expression levels were normalized to a Gapdh control and are depicted as fold change relative to wild-type ESCs. Error bars represent standard deviation determined from at least three independent experiments.
Figure 3 with 1 supplement
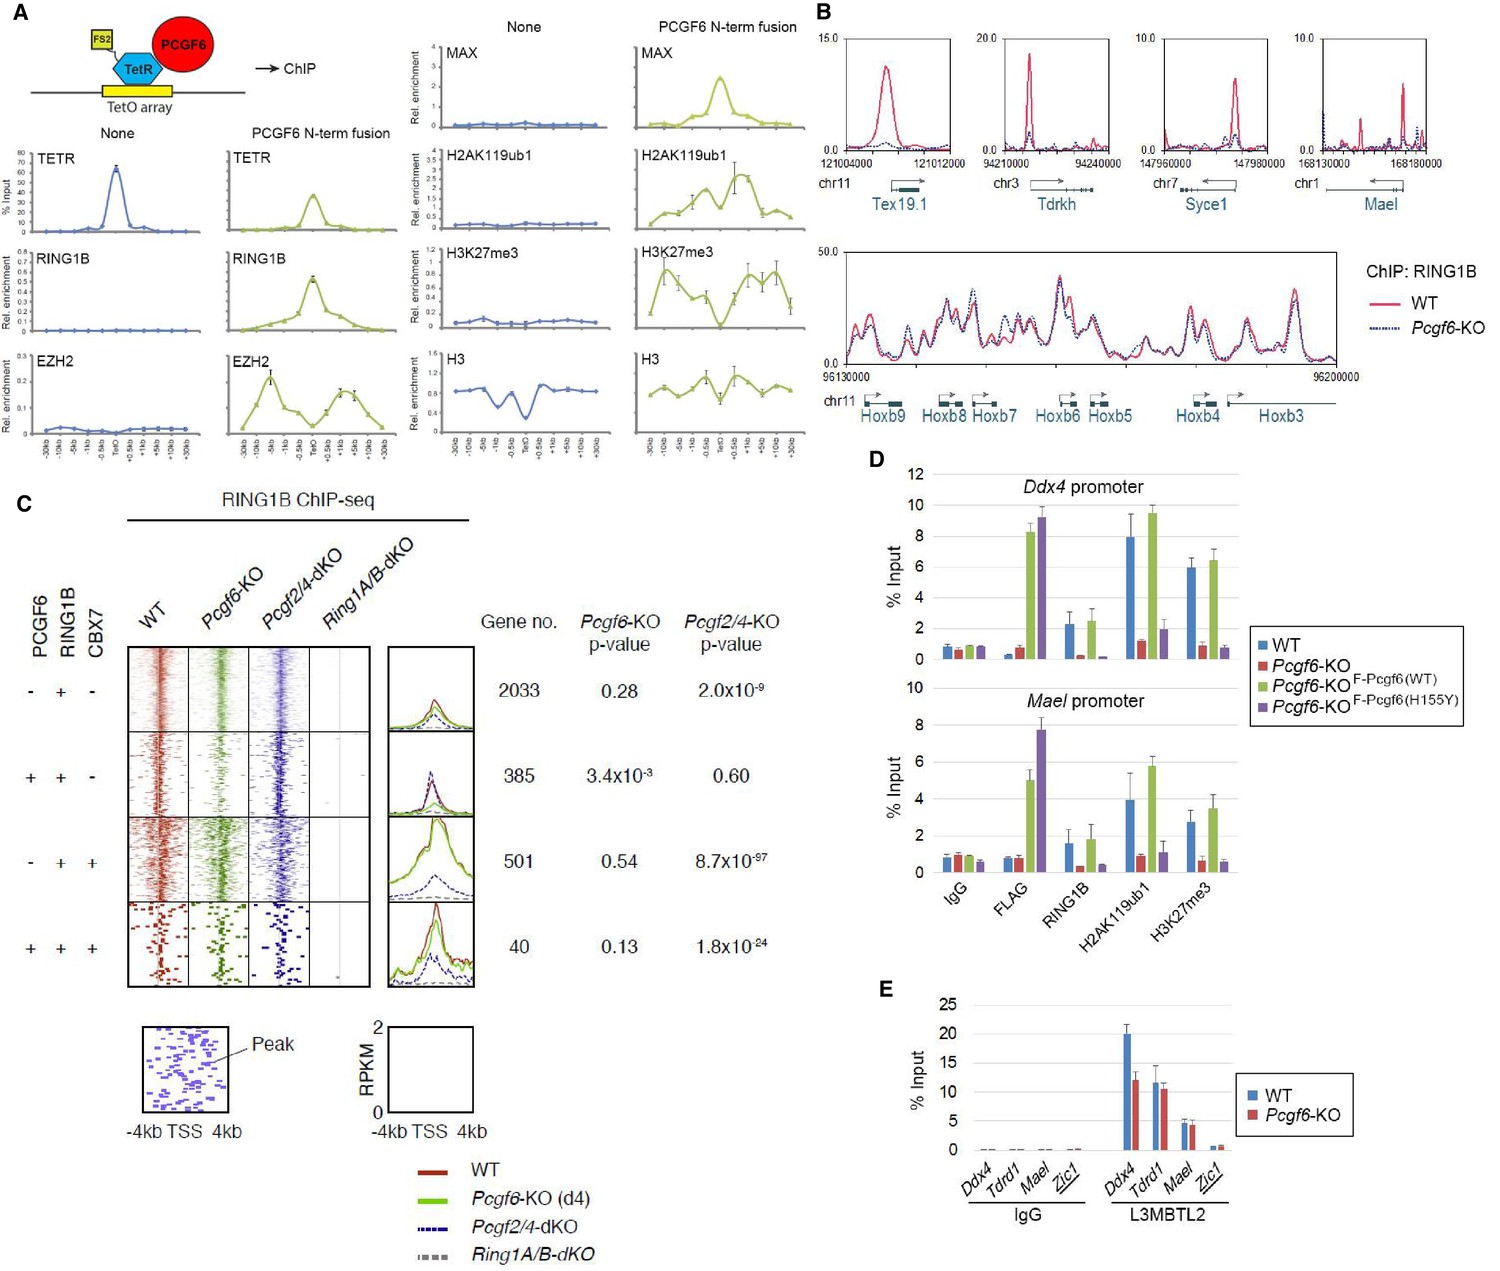
The role of PCGF6 in recruiting PCGF6-PRC1 to its target genes.
(A) Forced tethering of PCGF6 to a TetO array induced activation of PCGF6-PRC1 recruitment. A schematic illustrating the de novo targeting of the TetR-PCGF6 fusion protein to the TetO sequences (left). ChIP analysis for TetR, RING1B, EZH2, MAX, H2AK119ub1, H3K27me3 and H3 across the TetO-containing locus in ESCs revealed TetR-PCGF6-mediated local activation of the PCGF6-PRC1 pathway (bottom). ChIP experiments were performed at least in biological duplicate with error bars showing SEM. (B) Screenshot views of the RING1B distribution at selected target genes in wild type (WT) and Pcgf6-KO ESCs. RING1B distribution in Pcgf6fl/fl;Rosa26::CreERT2tg/+ ESCs before (WT; red) or 4 days after OHT treatment (Pcgf6-KO; blue) revealed by ChIP-seq is shown. The chromosome numbers and locations are indicated on the x-axis. The transcription start sites (TSSs) are denoted by arrows. (C) A heat map view of RING1B distribution in ±4 kb genomic regions around TSS in wild type (WT; brown), Pcgf6-KO (green), Mel18/Bmi1-dKO (blue) and Ring1A/B-dKO (gray) ESCs. RING1B-bound genes are further subclassified by binding of PCGF6 and CBX7 (left). Average distribution and p-value for its change in respective KO are also shown (right). (D) PCGF6-mediated RING1B recruitment to its target via a direct molecular interaction. Local levels of Flag-tagged PCGF6, RING1B, H2AK119ub1 and H3K27me3 at Ddx4 and Mael promoters in mock-transfected Pcgf6fl/fl;Rosa26::CreERT2tg/+ ESCs before (WT) and after OHT treatment (Pcgf6-KO) and in ESCs stably expressing WT [Pcgf6-KO_F-Pcgf6(WT)] or H155Y Pcgf6 [Pcgf6-KO_F-Pcgf6(HY)] constructs were determined by ChIP-qPCR. The relative amount of ChIPed DNA is depicted as a percentage of input DNA. Error bars represent standard deviation determined from at least three independent experiments. (E) PCGF6 is dispensable for local L3MBTL2 binding to target genes. Local levels of L3MBTL2 at the promoter regions of the indicated genes in Pcgf6fl/fl;Rosa26::CreERT2tg/+ ESCs before (WT) or 4 days after OHT treatment (Pcgf6-KO) were determined by ChIP-qPCR. Underlined genes are canonical PRC1 targets.
Figure 3—figure supplement 1

The role of PCGF6 in recruiting PCGF6-PRC1 to its target genes.
(A) Changes in local RING1B deposition at selected PCGF6-PRC1 target genes in WT, Pcgf6-KO, Pcgf2/4-dKO, and Ring1A/B-dKO ESCs are shown as described in Figure 2C. (B) The expression of a 3xFLAG -tagged wild type or mutant PCGF6 in Pcgf6-KO ESCs. Schematic representation for wild type (WT) and a H155Y mutant (HY) (top). The constructs were stably expressed in Pcgf6fl/fl;Rosa26::CreERT2tg/+ ESCs. Immunoprecipitation-Immunoblotting (IP-IB) analysis revealed the association of exogenous PCGF6 WT and HY with endogenous L3MBTL2 and MAX while PCGF6 HY failed to associate with RING1B. Extracts of OHT-untreated Pcgf6fl/fl;Rosa26::CreERT2tg/+ ESC lines expressing either construct were IPed with anti-FLAG antibody. IP (IP) and lysates (Input) were immunoblotted with antibodies against FLAG, RING1B, L3MBTL2 or MAX. (C) Expression levels of the indicated genes in wild type (WT) or Pcgf6-KO ESCs stably expressing wild type [Pcgf6 (WT)] or H155Y mutant [Pcgf6 (H155Y)]. Expression levels were normalized to a Gapdh control and are depicted as fold change relative to wild type ESCs. Error bars represent standard deviation determined from at least three independent experiments. The p-values for the expression changes induced by Pcgf6 deletion were calculated by the Student’s t-test. (D) A heat map view for distribution of H3K9me2 in ±10 kb genomic regions around transcription start sites (TSS) in wild type (WT) and Pcgf6-KO ESCs is shown as described in Figure 1G. The distribution of PCGF6, RING1B, CBX7 is also shown. (E) Schematic representation of the construct for conditional targeting of Cbx1 and Cbx3 loci is shown as described in Figure 1—figure supplement 1A. (F) Gene expression changes in Cbx1/3-dKO ESCs are shown as described in Figure 1—figure supplement 1G.
Figure 4 with 2 supplements
The role of MAX/MGA in recruiting PCGF6-PRC1 to its target genes.
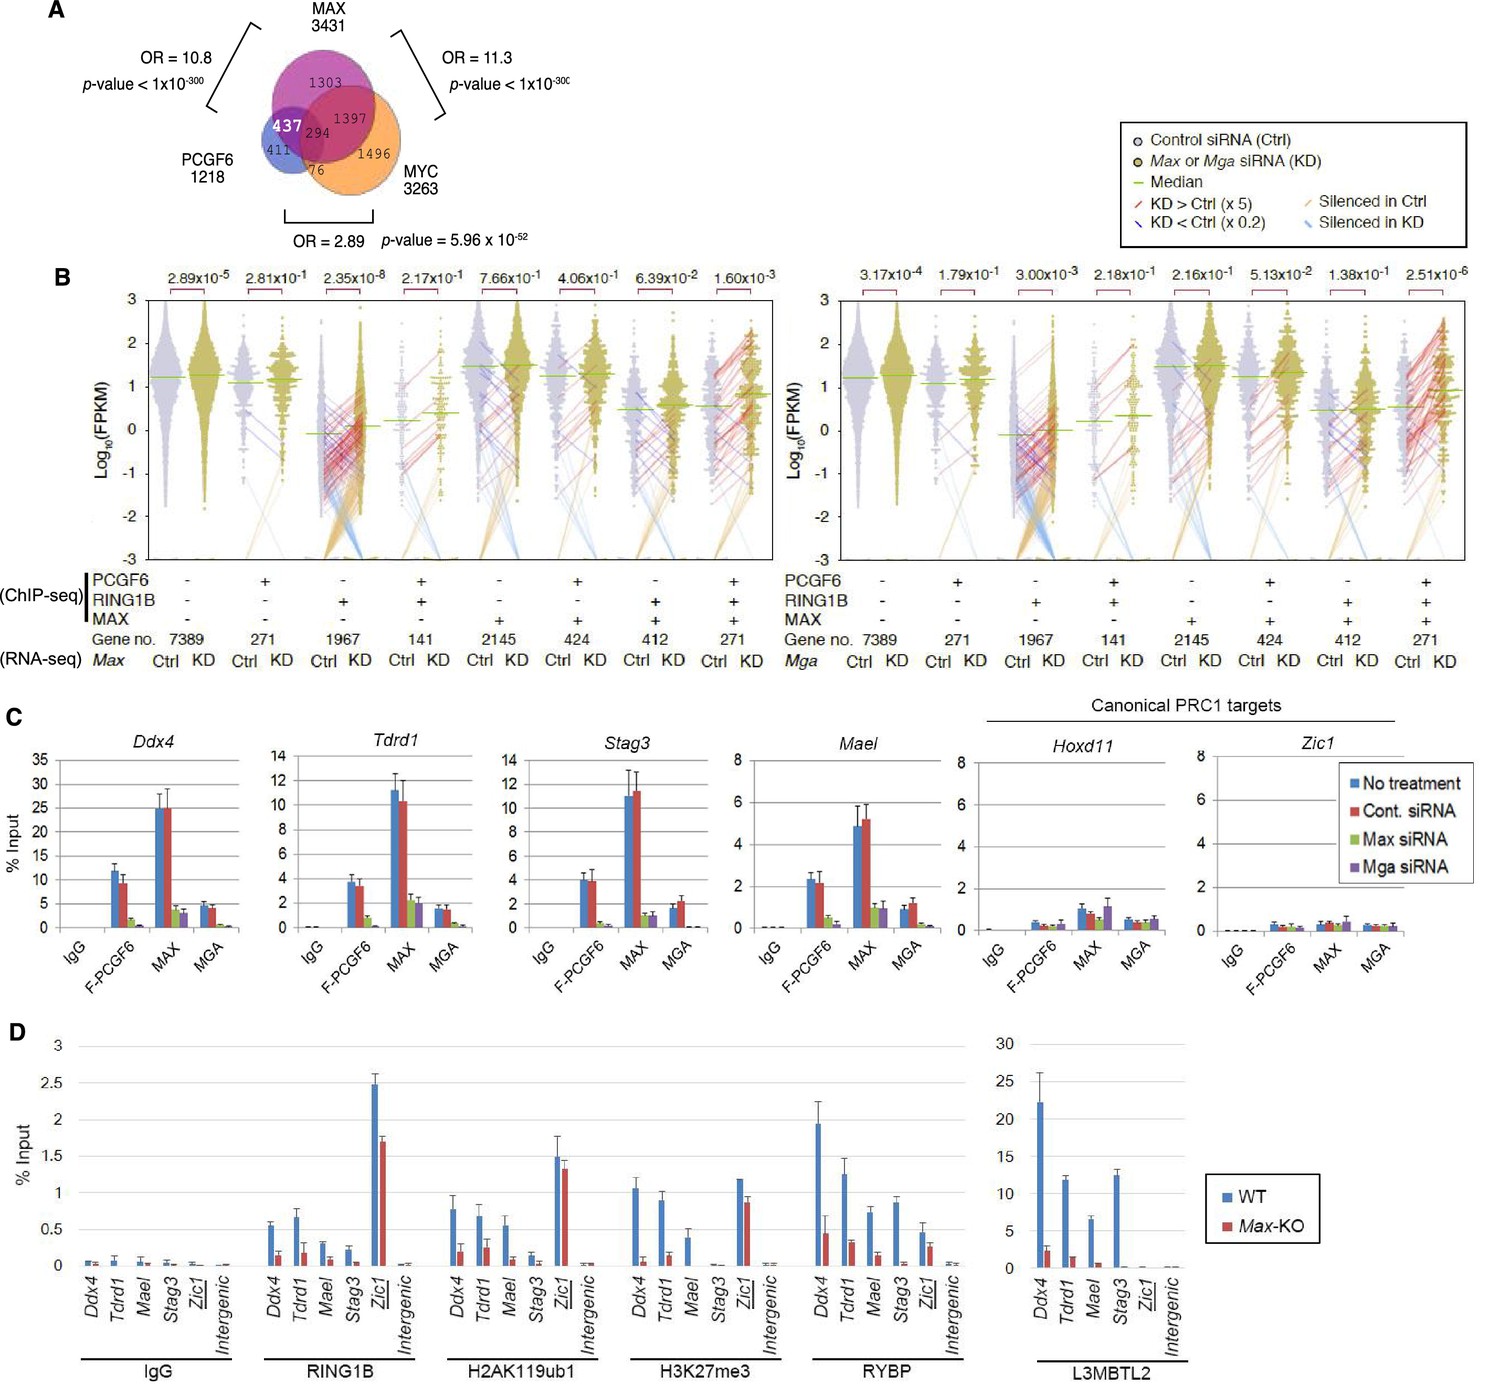
(A) Considerable overlap of genes bound by PCGF6 and MAX. Venn diagram depicts the overlap of PCGF6, MAX and MYC target genes in ESCs. Published ChIP-seq data for MAX and MYC were obtained from NCBI GEO (accession number GSM1171650 and GSM1171648, respectively). Odds ratio (OR) and p-values for the overlap between respective groups are indicated. Numbers represent the number of genes bound by each protein or included in each fraction seen in the Venn diagram. (B) Dot plot representation for gene expression changes in Max-KD (left) and Mga-KD (right) ESCs. Expression levels of respective genes (FPKM: determined by RNA-seq) in each group (classified by ChIP-seq) in control (Ctrl) and respective knockdowns (KD) are shown by grey and yellow dots, respectively. The same codes as described in Figure 2A are used. (C) Changes in binding of FLAG-tagged PCGF6, MAX and MGA at the selected targets induced by knockdown of Max or Mga. Local levels of FLAG-tagged PCGF6, MAX and MGA at the respective promoter regions in untreated ESCs or ESCs treated with either control siRNA, Max siRNA or Mga siRNA were determined by ChIP-qPCR. The relative amount of ChIPed DNA is depicted as a percentage of input DNA. Error bars represent standard deviation determined from at least three independent experiments. (D) Changes in local deposition of RING1B, H2AK119ub1, H3K27me3, RYBP and L3MBTL2 at the indicated targets in Max-KO ESCs. Underlined genes are canonical PRC1 targets. Their deposition in Max conditional KO ESCs before (WT) or after doxycycline treatment (Max-KO) was determined by ChIP-qPCR. The relative amount of ChIPed DNA is depicted as a percentage of input DNA. Error bars represent standard deviation determined from at least three independent experiments.
Figure 4—figure supplement 1
The role of MAX/MGA in recruiting PCGF6-PRC1 to its target genes.
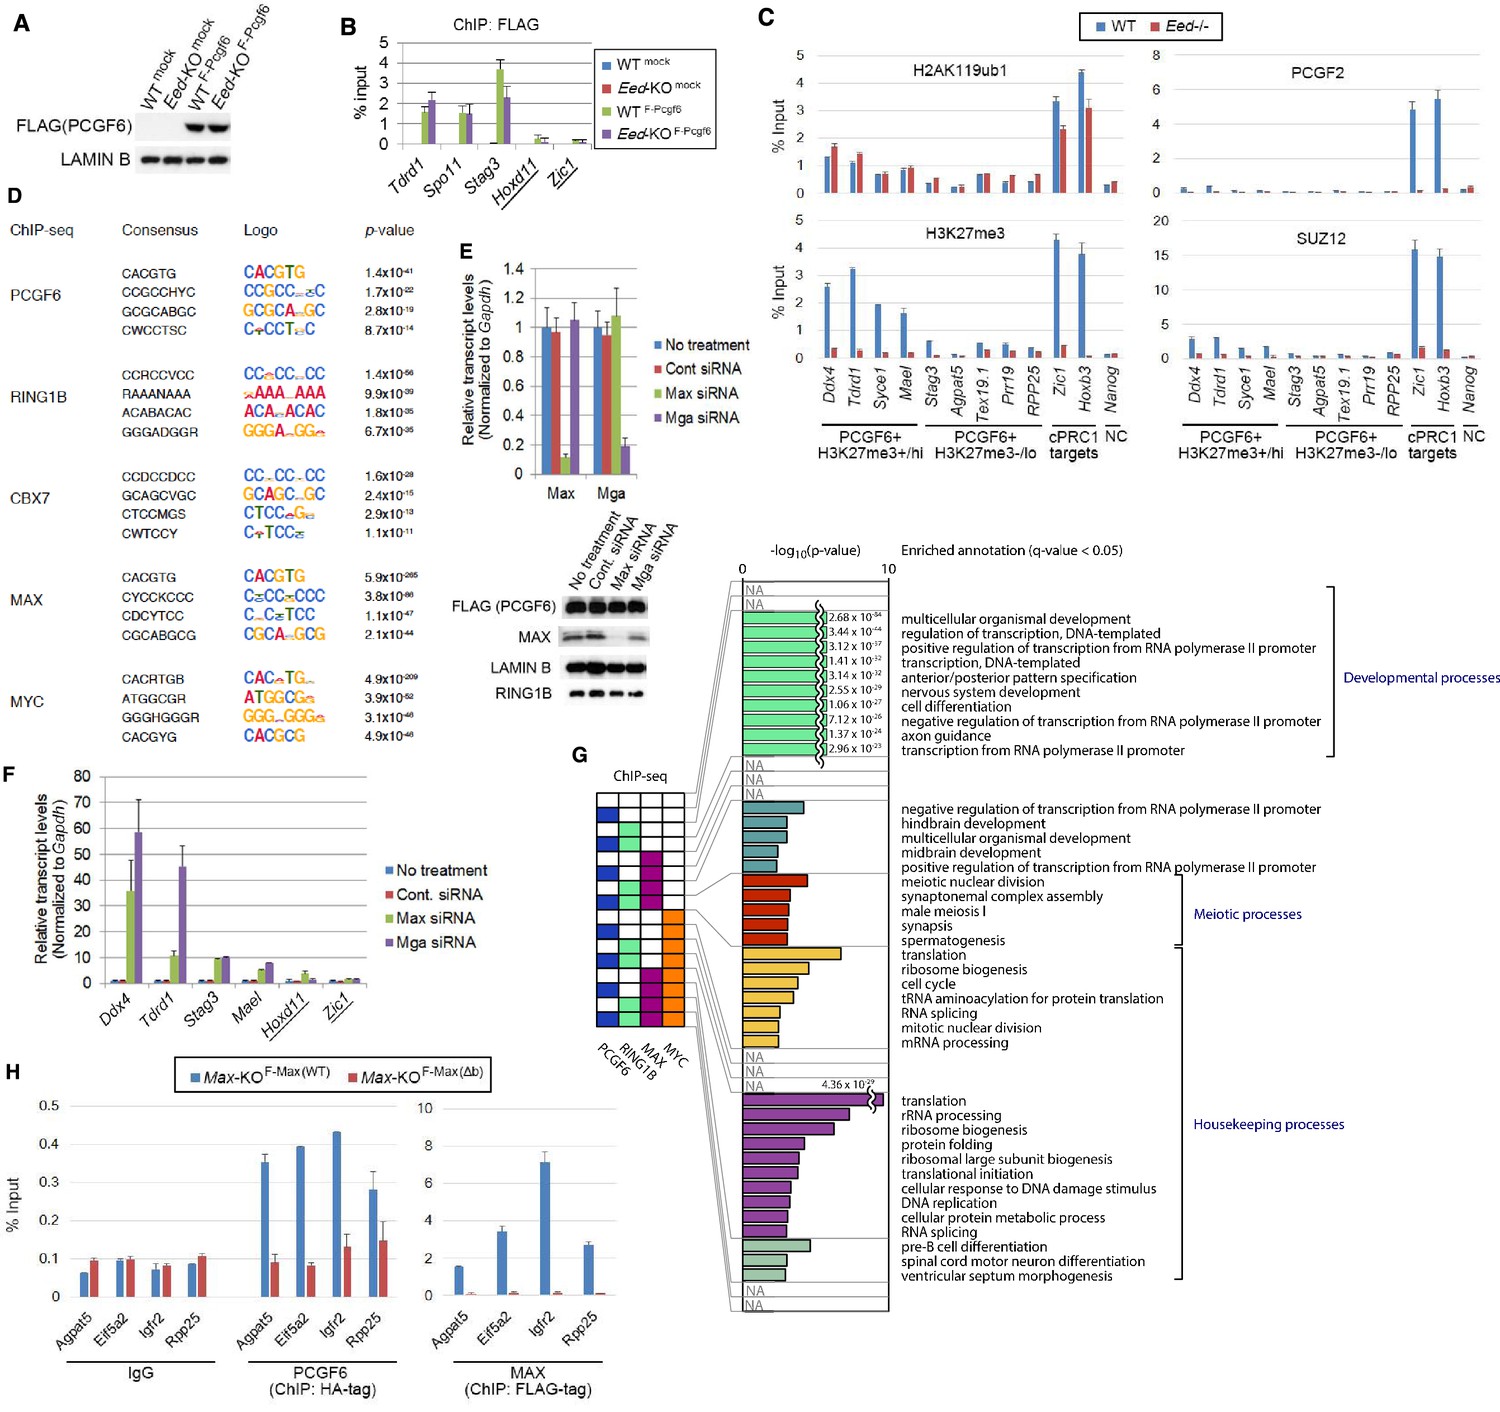
(A) The expression of FLAG-tagged exogenous PCGF6 in wild type (WT) and Eed-KO ESCs. Expression levels of FLAG-tagged PCGF6 and endogenous LAMIN B protein in wild type and Eed-KO ESCs mock or FLAG-PCGF6 construct transfected were tested by immunoblotting. (B) Local levels of FLAG at the indicated promoter regions in wild type or Eed-KO ESCs expressing FLAG-tagged PCGF6 were determined by ChIP-qPCR analysis. Underlined genes are canonical PRC1 targets. The relative amount of ChIPed DNA is depicted as a percentage of input DNA. Error bars represent standard deviation determined from at least three independent experiments. (C) ChIP-qPCR showing a marginal binding of canonical PRC1 (cPRC1; PCGF2) to PCGF6-bound genes with high H3K27me3 (PCGF6 +H3K27me3+/hi) and those with low H3K27me3 (PCGF6 +H3K27me3-/lo) in wild type (WT) ESCs. Eed-KO ESCs were used to confirm whether H3K27me3-dependent recruitment of cPRC1 is active at indicated gene locus. NC: negative control. (D) Top four de novo motif recognition hits for genes bound by PCGF6, RING1B, CBX7 (NCBI GEO accession number GSM1041373), MAX (NCBI GEO accession number GSM1171650) or MYC (NCBI GEO accession number GSM1171648) in wild type ESCs. (E) Expression levels of Max and Mga in untreated ESCs or those treated with control, Max siRNA or Mga siRNA revealed by RT-qPCR analysis (left). Transcription levels were normalized to a Gapdh control and are depicted as fold change relative to untreated ESCs. Error bars represent standard deviation determined from at least three independent experiments. Expression levels of FLAG-PCGF6, MAX, LAMIN B and RING1B in whole cell lysates of untreated and siRNA-treated ESCs are also shown (right). (F) Expression levels of the indicated genes in untreated ESCs or those treated either with control, Max siRNA or Mga siRNA. Underlined genes are canonical PRC1 targets. Expression levels were normalized to a Gapdh control and are depicted as fold change relative to mock ESCs (No treatment). Error bars represent standard deviation determined from at least three independent experiments. (G) Gene ontology (GO) term analysis showing that genes related to meiotic process are highly overrepresented among PCGF6+RING1B+MAX+MYC- genes. Genes were classified based on binding by PCGF6, RING1B, MAX and/or MYC and the enrichment of respective GO terms in each subset of genes was determined. The p-values for the significance of over-representation against total genes are shown along the x-axis. (H) Changes in local PCGF6 and MAX deposition at selected PCGF6/MAX co-bound gene that do not become de-repressed in Max-KO ESCs were determined by ChIP-qPCR using Max-KO ESCs stably expressing both an HA-tagged Pcgf6 and a Flag-tagged Max (WT or Δb) expression vectors, and are shown as described in Figure 2C.
Figure 4—figure supplement 2
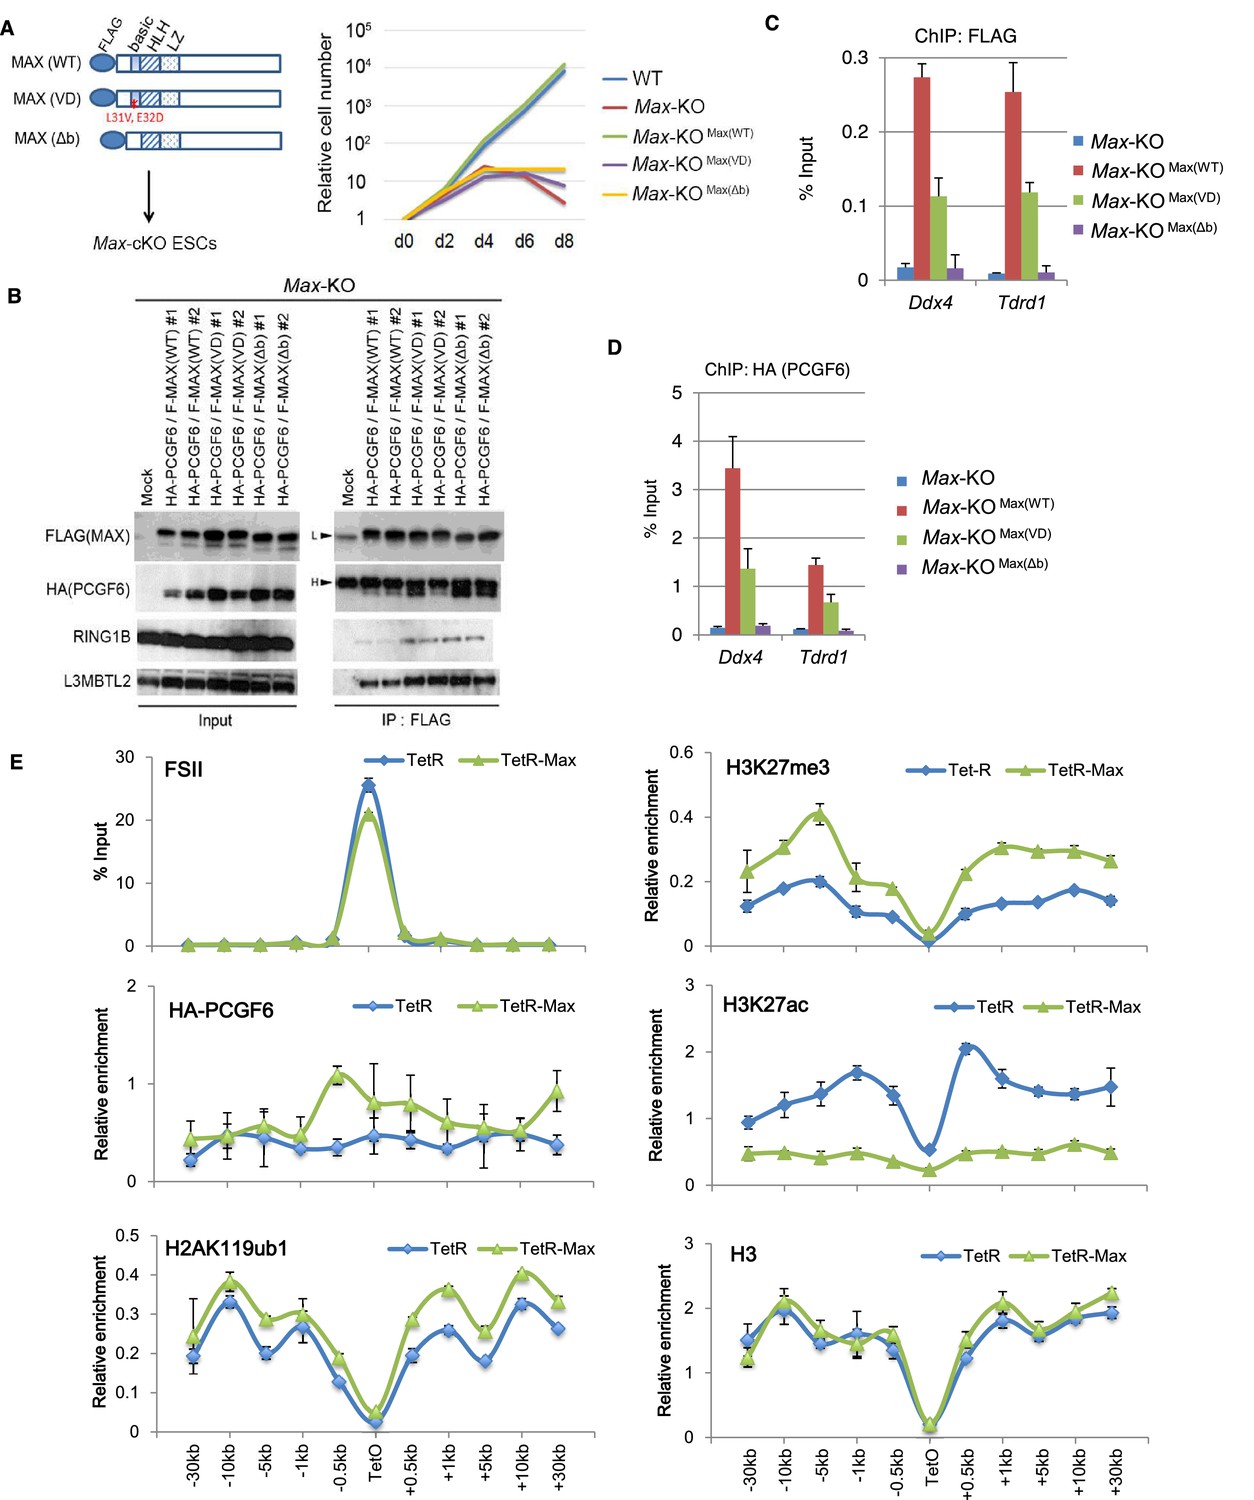
Sequence recognition by MAX/MGA is critical for recruiting PCGF6-PRC1 to its target genes.
(A) MAX-dependent proliferation of ESCs. Schematic representation of FLAG-tagged wild type (WT) and mutant [L31V and E32D substitution (VD) and basic region deletion (Δb)] MAX proteins (left). Failure to rescue growth defects of Max-KO ESCs by either mutant MAX. Mock-transfected Max conditional KO ESCs (WT) stopped growing 4 days after doxycycline treatment (KO) (right). Stable expression of FLAG-tagged WT [KO+MAX(WT)] rescued the growth defect but VD or Δb mutants [KO+MAX(VD) and KO+MAX(Δb)] did not. (B) Association of mutant MAX proteins with other components of the PCGF6-PRC1 complex. Immunoprecipitation-immunoblot (IP-IB) analysis revealed the association of FLAG-tagged MAX WT, VD or Δb with HA-tagged PCGF6, RING1B and L3MBTL2. Max-KO ESCs that expressed HA-tagged PCGF6 and FLAG-tagged wild type or mutant MAX were subjected to IP with anti-FLAG antibody. Resulting precipitates (IP) and lysates (Input) were immunoblotted with antibodies against FLAG, HA, RING1B or L3MBTL2. (C) Binding of FLAG-tagged WT or mutant MAX to target of ChIPed DNA is depicted as a percentage of input DNA. Error bars represent standard deviation determined from at least three independent experiments. (D) Binding of HA-tagged genes in Max-KO ESCs. Local levels of FLAG-tagged WT or mutant MAX at Ddx4 or Tdrd1 promoter regions were determined by ChIP-qPCR. The relative amount PCGF6 to target genes in Max-KO ESCs that express WT or mutant MAX. Local levels of HA-tagged PCGF6 at Ddx4 or Tdrd1 promoter regions were determined by ChIP-qPCR. (E) Forced tethering of MAX to a TetO array induced activation of PCGF6-PRC1 recruitment. ChIP analysis for TetR, HA-tag (PCGF6), H2AK119ub1, H3K27me3, H3K27ac and H3 across the TetO-containing locus in ESCs revealed TetR-MAX-mediated local activation of the PCGF6-PRC1 pathway. ChIP experiments were performed at least in biological duplicate with error bars showing SEM.
Figure 5
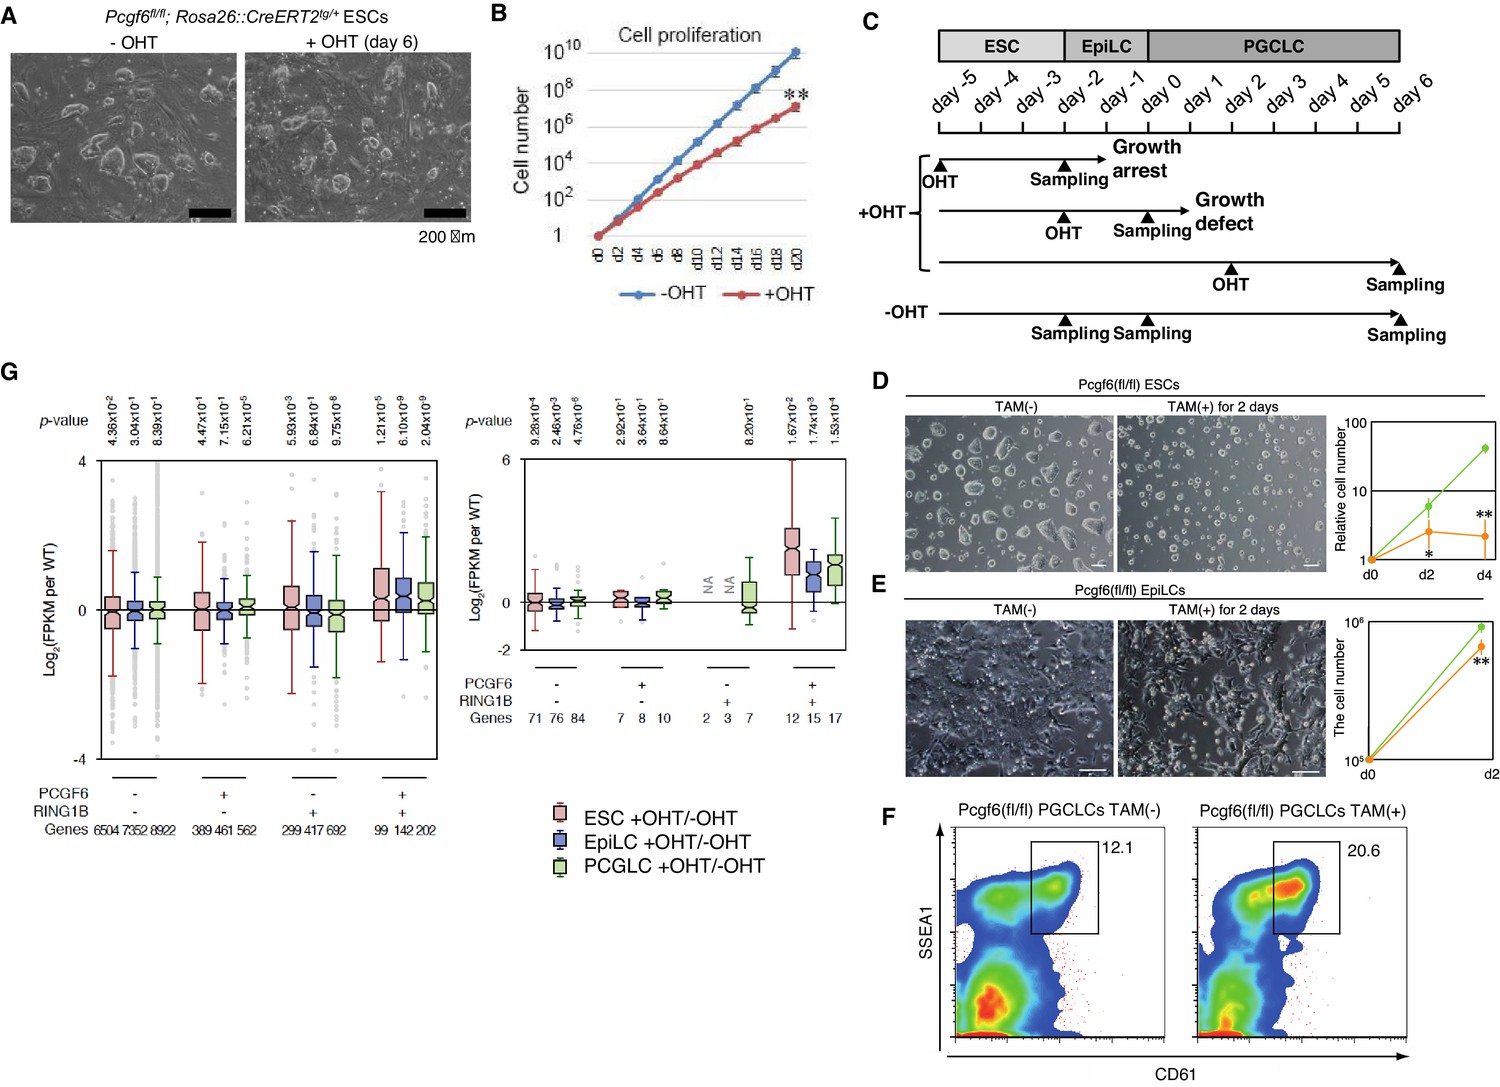
A role for PCGF6 in maintaining ESCs in an undifferentiated state.
(A) Colony morphology of Pcgf6-KO ESCs in the presence of fetal bovine serum (FBS) and 3i. Phase-contrast views of OHT-untreated and –treated (day six) Pcgf6fl/fl;Rosa26::CreERT2tg/+ ESCs are shown. Scale bars indicate 200 µm. (B) Decreased growth rate of Pcgf6-KO ESCs. Proliferation of OHT-untreated or -treated Pcgf6fl/fl;Rosa26::CreERT2tg/+ ESCs in the presence of FBS and 3i is shown. (C) A schematic representation of the in vitro differentiation scheme for Pcgf6fl/fl;Rosa26::CreERT2tg/+ ESCs towards EpiLCs and PGCLCs is shown. OHT was added to deplete Pcgf6 at the indicated time points (closed arrowheads with ‘OHT’). Cells used for RNA-seq analysis were collected at the time points indicated as ‘Sampling’. (D) PCGF6 is indispensable to maintain proliferation of ESCs in serum-free condition. Phase contrast views of Pcgf6-KO [TAM(+); at two days after OHT treatment] and the control [TAM(−)] (left). Growth rates of OHT-treated (yellow) and –untreated (green) cells (right). (E) PCGF6 is indispensable to maintain proliferation of epiLCs. Phase contrast views of Pcgf6-KO [TAM(+); at 2 days after OHT treatment] and the control [TAM(−)] (left). Growth rates of OHT-treated (yellow) and –untreated (green) cells (right). (F) PCGF6 is dispensable for differentiation of post-epiLCs towards PGCLC. OHT-treatment considerably expanded the SSEA1+CD61+ fraction. (G) Gene expression changes upon induced deletion of Pcgf6. Pcgf6fl/fl;Rosa26::CreERT2tg/+ ESCs (red), EpiLCs (blue), and PGCLCs (green) induced upon depletion of Pcgf6 by OHT treatment for each subset of total genes (left) or meiosis-related genes (right) classified by the presence (+) or absence (−) of PCGF6- and RING1B-binding in ESCs. The average, deviation and distribution of the expression changes for the respective subsets of genes determined by RNA-seq analysis are shown. The box plots represent the median (horizontal line), interquartile range (box), range (whiskers), and outliers (circles). The number of genes included in each subset is shown at the bottom. p-values for average gene expression change in each subset upon Pcgf6 depletion were calculated by the Student’s t-test and are indicated at the top.
Figure 6 with 1 supplement
Pleiotropic effects of PCGF6 loss during development.
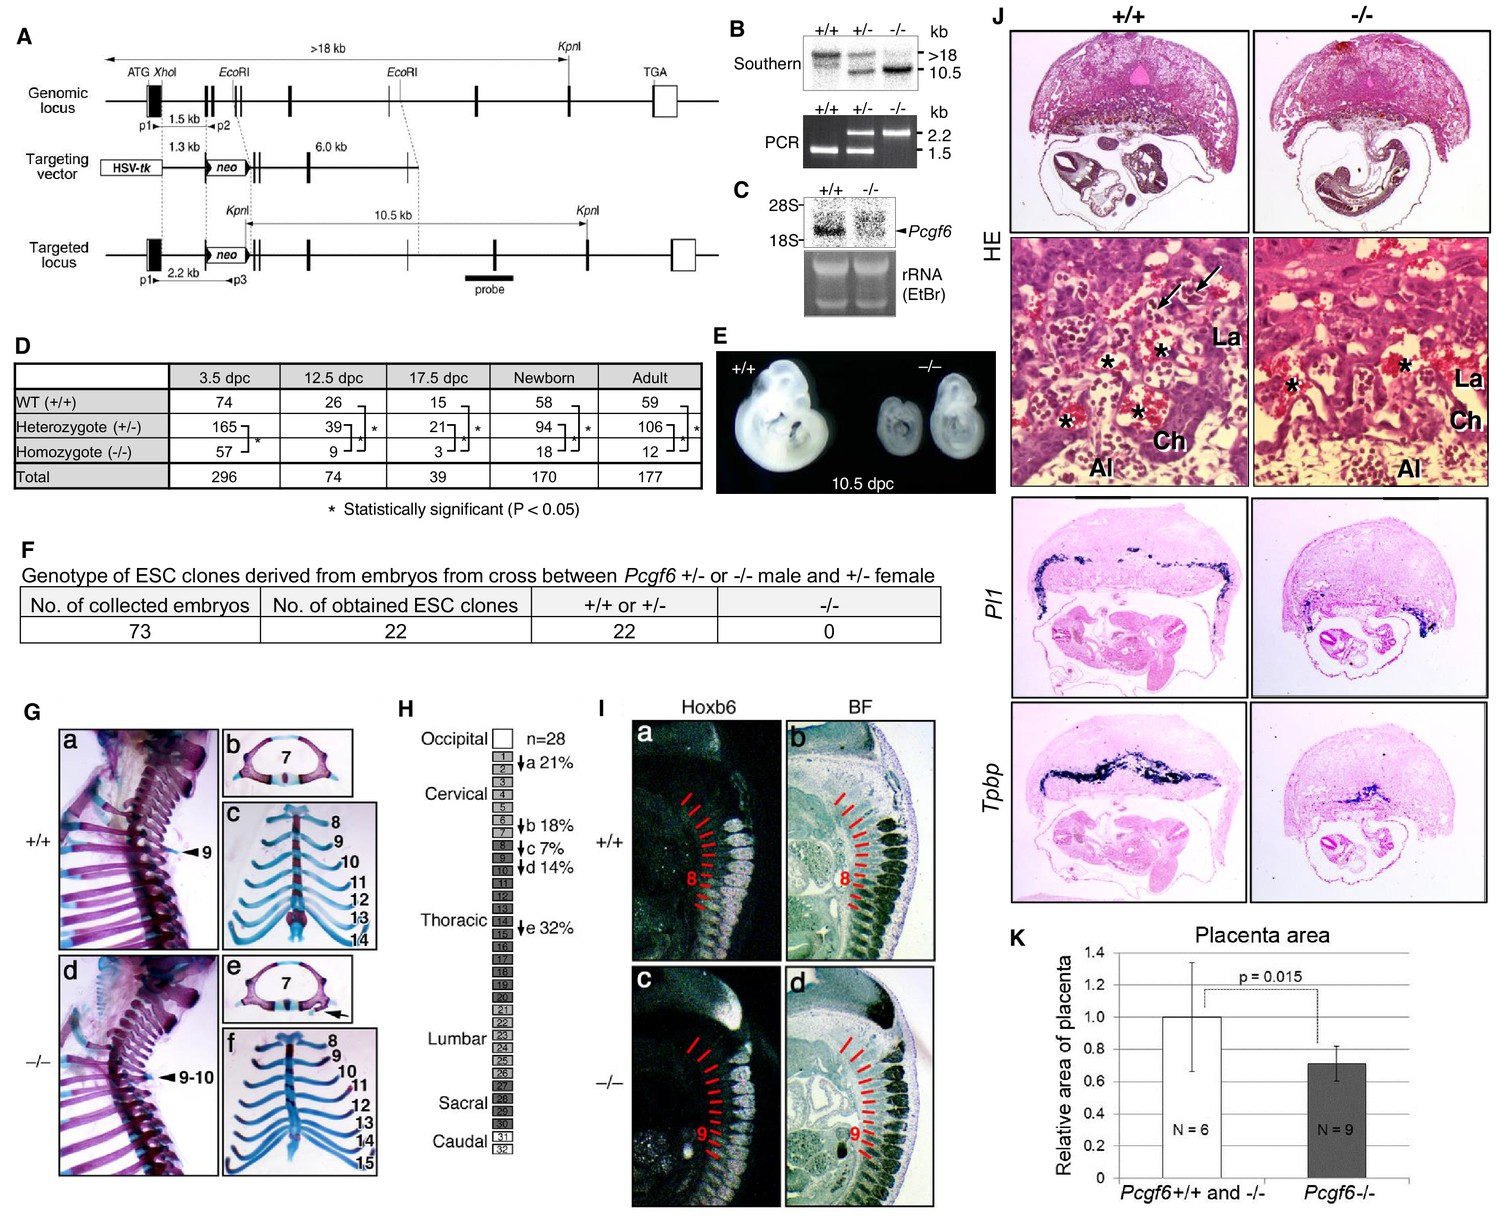
(A) Schematic representation of the Pcgf6 locus, the targeting vector, and the constitutive mutant allele. To disrupt Pcgf6, most of the exon 2 and the entire exon 3 which code for the RING finger domain were replaced with neo. The neo and HSV-tk cassettes were used for positive and negative selection, respectively. The positions of the restriction sites (XhoI, EcoRI and KpnI), external probe and PCR primers, and sizes of diagnostic fragments are indicated. Coding regions and untranslated regions of Pcgf6 are indicated by closed and open boxes, respectively. (B) Southern (top) and PCR (bottom) analyses for genotyping. For Southern blotting, genomic DNA was digested by KpnI and probed with the 3’ probe, as indicated in A. For PCR, a mixture of three primers (p1, p2 and p3 in A) was used. (C) Northern analysis of Pcgf6 mRNA expression in wild type (+/+) and homozygous (−/−) adult kidney (top). Ethidium bromide (EtBr) staining of the same gel is shown below. (D) Genotype distribution of progeny of Pcgf6 heterozygous intercrosses. *p-value<0.05 (χ2 test), indicating a < 5% probability of conforming to the Mendelian law, which predicts a 1:2:1 ratio between +/+:+/−: −/−. (E) Delayed and/or abnormal development of Pcgf6-KO (−/−) embryos at 10.5 dpc. Wild-type (+/+) embryos are shown as controls. (F) Genotype distribution of ESC lines derived from embryos from intercrosses between Pcgf6+/+ or −/− male and +/− female is shown. Genotypes of 22 ESC lines were determined using genomic PCR. (G) Skeletal alterations in Pcgf6−/− newborn mice. (a, d) Lateral views of the cervical and thoracic regions revealed the prominent spinous process on the 9–10 in Pcgf6−/− (d, indicated by an arrow) but on the nine in the wild type (a, indicated by an arrow). (b, e) Overviews of the seventh vertebrae identified association of an anterior tubercle on seven in Pcgf6−/−, which appears on six in the wild type (e, indicated by an arrow). (c, f) Ventral views of rib cages identified an ectopic sternal rib in Pcgf6−/− (f, labeled 15). (H) Schematic representation summarizing the axial alterations in Pcgf6−/− newborn mice. Each arrow represents the following morphological changes in the vertebrae; (a) 1←2: association of the anterior arch of the atlas with the atlas; (b) 6←7: the anterior tubercle(s) on 7, which are normally on 6; (c) 8←9: fusion of rib(s) on 9 to 8; (d) 9←10: the prominent spinous process on 10, which is normally on 9; (e) 14←15: fusion of ribs on 15 to the sternum. (I) Changes in Hoxb6 expression in Pcgf6-KO mice. Hoxb6 expression in 11.5-dpc wild-type (a) and Pcgf6−/− (c) embryos. Segment boundaries are indicated by red lines and segment numbers of anterior expression domains of Hoxb6 are shown. Bright field views are shown in (b, d). (J) HE sections of 11.5 dpc wild type (+/+) and Pcgf6-deficient (−/−) placentae. Al: allantois, Ch: chorion, La: labyrinth layer, asterisks: enucleated erythrocytes from the mother, arrows: fetus-derived nucleated erythrocytes. Note that fetus-derived nucleated erythrocytes are observed in well-developed labyrinth layer in Wild-type mice but not in Pcgf6-KO mice. Expression of trophoblast lineage-restricted markers was analyzed by RNA in situ hybridization. Pl1 identifies trophoblast giant cells. Tpbp identifies spongiotrophoblasts. (K) Quantification of placental area from 10.5 dpc HE sections of wild type (+/+), Pcgf6 heterozygote (+/−) and Pcgf6-deficient (−/−) embryos.
-
Figure 6—source data 1
HE sections of placentae of wild type (+/+) and Pcgf6-KO (−/−) embryos used for analysis shown in Figure 6K.
- https://doi.org/10.7554/eLife.21064.014
Figure 6—figure supplement 1
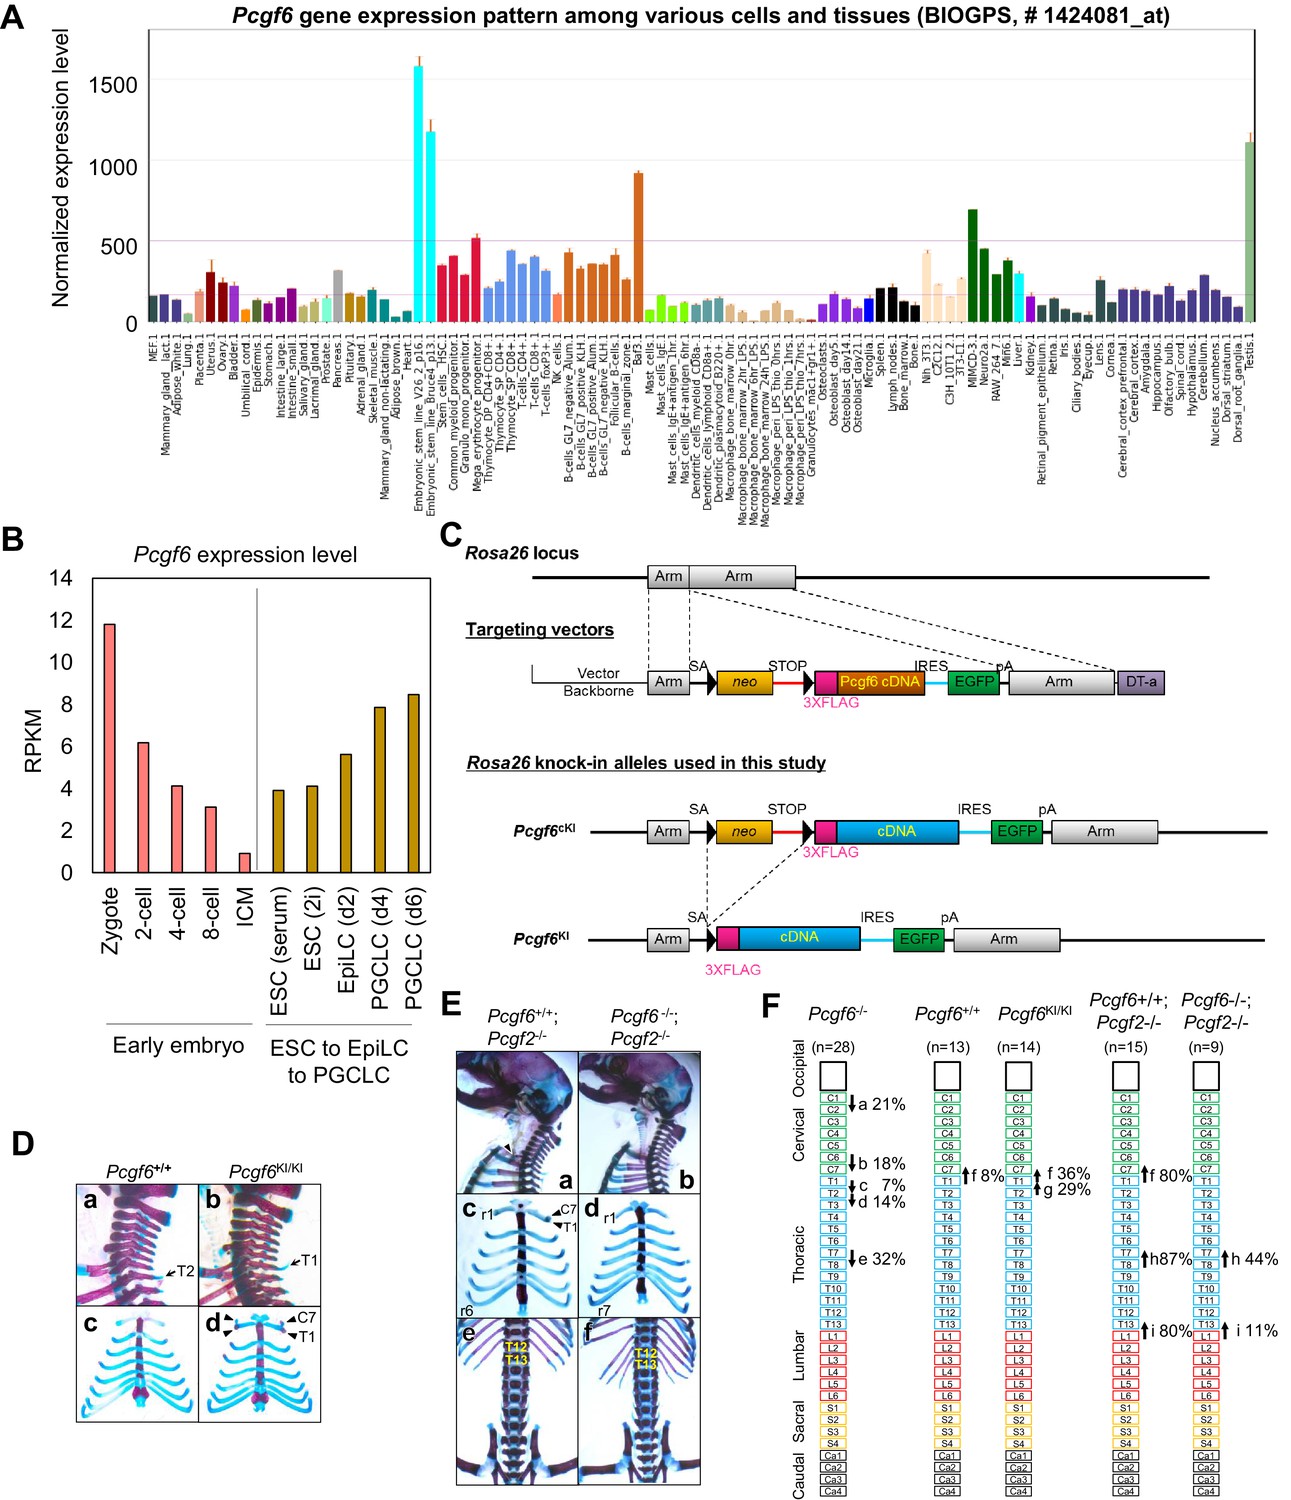
Skeletal alterations in Pcgf6KI/KI and Pcgf6/Pcgf2 dKO newborn mice.
(A) Pcgf6 expression was high in ESCs and in testis, among different cells and tissues. Data was retrieved from BioGPS (biogps.org). (B) Analysis of Pcgf6 expression during early embryogenesis (GEO dataset # GSE66582); and during differentiation from ESCs to EpiLCS, and then to PGCLCs (GEO dataset # GSE86903). Gene expression was measured in RPKM. (C) Schematic representation of the construct for conditional expression of 3xFlag-tagged Pcgf6 cDNA from the Rosa26 locus. The targeting construct contains a 3xFlag-tagged mouse Pcgf6 cDNA downstream of an loxP (closed triangles)-flanked neomycin resistance gene (neo). (D) Skeletal alterations in Pcgf6+/+ and Pcgf6KI/KI newborn mice. (a,b) Lateral views of the cervical and thoracic regions revealed the prominent spinous process on eight in Pcgf6KI/KI (b, indicated by an arrow). (c, d) Ventral views of the rib cages identified ectopic sternal ribs on seven in Pcgf6KI/KI (d, labeled C7). (E) Skeletal alterations in Pcgf6+/+; Pcgf2−/− and Pcgf6−/−; Pcgf2−/− newborn mice. (a, b) Lateral views of the cervical and thoracic regions. An ectopic rib on seven in Pcgf2−/− was not observed on Pcgf6−/− background (a, indicated by an arrowhead). (c, d) Ventral views of the rib cages from the specimens a and b, respectively, showing the ectopic rib (c, indicated by arrowheads). The posteriormost sternal ribs of Pcgf2−/− were on 13 (c, labeled r6) but on 14 on Pcgf6−/− background (d, labeled r7). (e, f) Ventral views of the thoracic and lumber regions. The posteriormost ribs of Pcgf2−/− were on 19 (e, labeled T12) but on 20 on Pcgf6-/- background (f, labeled T13). (F) Schematic representation summarizing the axial alterations in Pcgf6−/−, Pcgf6+/+, Pcgf6KI/KI, Pcgf6+/+; Pcgf2−/− and Pcgf6−/−; Pcgf2−/− newborn mice. Each arrow represents the following morphological changes in the vertebrae; (a)-(e) See Figure 6; (f) 7→8: ectopic rib(s) on 7; (g) 8→9: the prominent spinous process on 8; (h) 14→15: ribs on 14 not fused to the sternum; (i) 20→21: loss of ribs on 20.
Figure 7

Our model for the role of PCGF6-PRC1.
(A) Schematic representation for two major modes of gene silencing by PRC1. The first involves PCGF1-PRC1 (PCGF6) and cPRC1 (MEL18/BMI1), which silences developmental genes, and the second involves PCGF6-PRC1 (PCGF6), which silences germ cell-related and meiosis-related genes. (B) Schematic representation of PCGF6-PRC1-mediated regulation of germ cell-related and meiosis-related genes in ESCs and pre-/peri-implatation embryos.
Additional files
-
Supplementary file 1
The sequences of primers used in quantitative ChIP-PCR and RT-PCR.
- https://doi.org/10.7554/eLife.21064.017
Download links
A two-part list of links to download the article, or parts of the article, in various formats.
Downloads (link to download the article as PDF)
Open citations (links to open the citations from this article in various online reference manager services)
Cite this article (links to download the citations from this article in formats compatible with various reference manager tools)
PCGF6-PRC1 suppresses premature differentiation of mouse embryonic stem cells by regulating germ cell-related genes
eLife 6:e21064.
https://doi.org/10.7554/eLife.21064


