Somatostatin-positive interneurons in the dentate gyrus of mice provide local- and long-range septal synaptic inhibition
- University of Freiburg, Germany
- University of Kiel, Germany
Figures
Figure 1 with 3 supplements
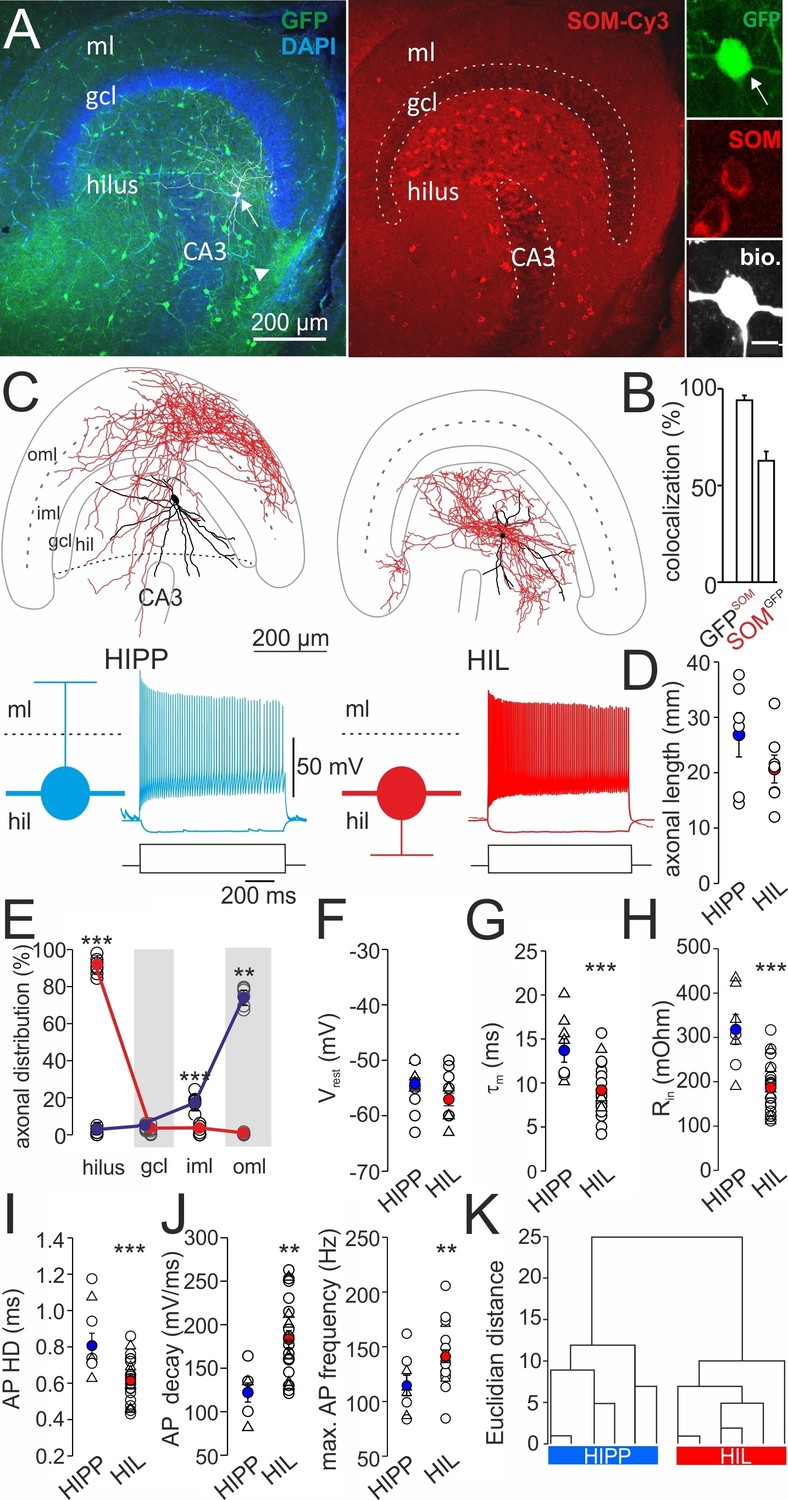
Two morphologically and physiologically contrasting DG-SOMI types.
(A) Left, confocal image stack of a transverse section through the dentate gyrus (DG) of a transgenic mouse expressing GFP and somatostatin (SOM) in GABAergic interneurons (GIN; Oliva et al., 2000). Arrow, points to a GFP-positive cell intracellularly labelled with biocytin and conjugated to Alexa Fluor 647 (white cell). Right, same section showing antibody labelling against SOM. Inset, intracellularly labelled cell co-expresses GFP and SOM. Scale bar 5 µm. Arrow head points to areas of high SOM axon profile density. (B) Quantification of GFP and SOM co-localization (three mice). (C) Reconstructions of two representative intracellularly labeled DG-SOMI types. Somata and dendrites are depicted in black and axons in red. Grey lines depict layer-specific borders. From left to right, hilar perforant path-associated interneuron (HIPP), hilus-associated interneuron (HIL). Below, representative voltage traces of the two SOMI types during 1 s, −100 and 300 pA current injections. Schematics and color codes represent the respective SOMI types throughout all figures. Hilus is defined as area between the granule cell layer (gcl)-to-hilus border and the black striped line (Freund and Buzsáki, 1996). (D) Total axonal length of the two SOMI types on the basis of single-cell reconstructions in the DG (six cells each group). (E) Layer-specific axonal distribution of the two SOMIs in DG sub-areas. Red and blue circles connected by lines correspond to mean values of HIL and HIPP cells, respectively. (F–H) Summary plot of membrane resting potential (Vrest), membrane time constant (τm) and input resistance (Rin) for both interneuron types. (I,J) Summary graph of the half-duration (HD) of single action potentials (APs), the decay of single APs and the maximal discharge frequency. (K) Hierarchical cluster analysis on the basis of morphological and physiological properties of 12 reconstructed cells (depicted by triangles in F-J) reveals two DG-SOMI classes which correspond to previously denominated HIPP and HIL cells (see Materials and methods). Circles represent single data points, circles with lines are means ± SEM; ***p≤0.001, **p≤0.01, *p≤0.05. Abbreviations: gcl, granule cell layer; hil, hilus; iml, inner molecular layer; oml, outer molecular layer.
Figure 1—figure supplement 1
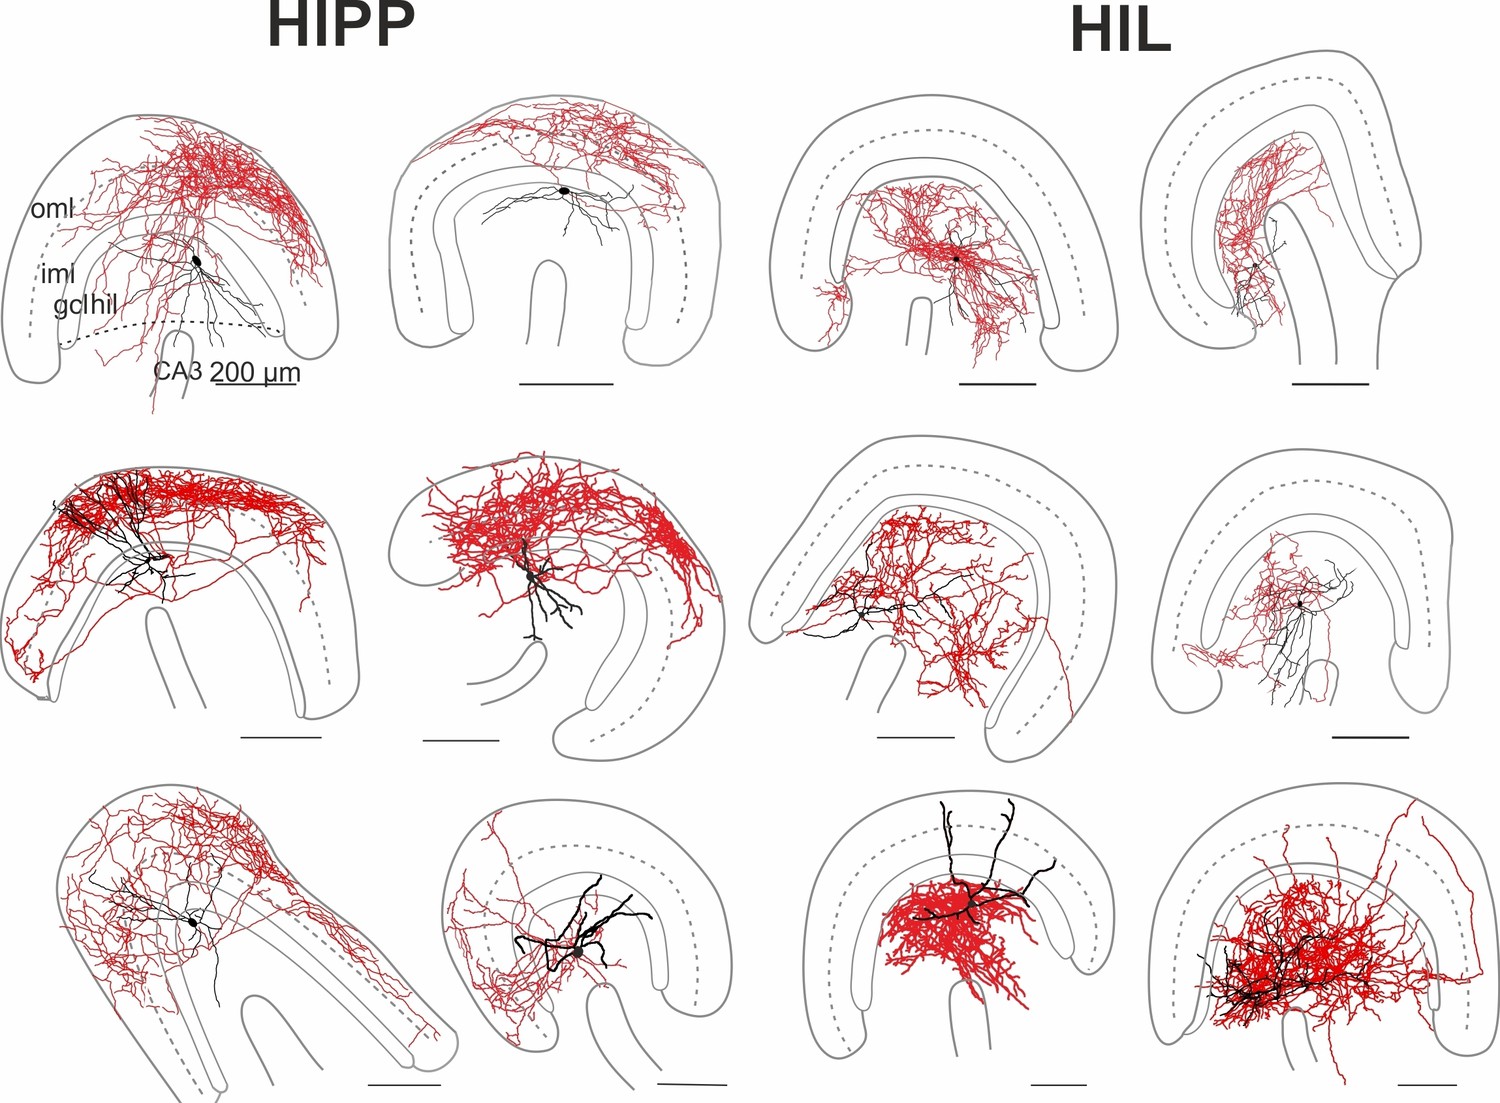
Morphological reconstructions of HIPP and HIL cells in the DG.
Reconstructions of HIPP (left, 6 cells) and HIL (right, 6 cells) are shown. Somata and dendrites are depicted in black and the axons in red. Please note that due to the curfature of the DG, axonal fibers of HIPP cells located in the molecular layer seem to appear in the reconstruction in the inner molecular layer (iml). However, from 3D-image stacks it is evident that the axon is predominantly located in the outer molecular layer (oml). Abbreviations: gcl, granule cell layer; hil, hilus; iml, inner molecular layer; oml, outer molecular layer.
Figure 1—figure supplement 2
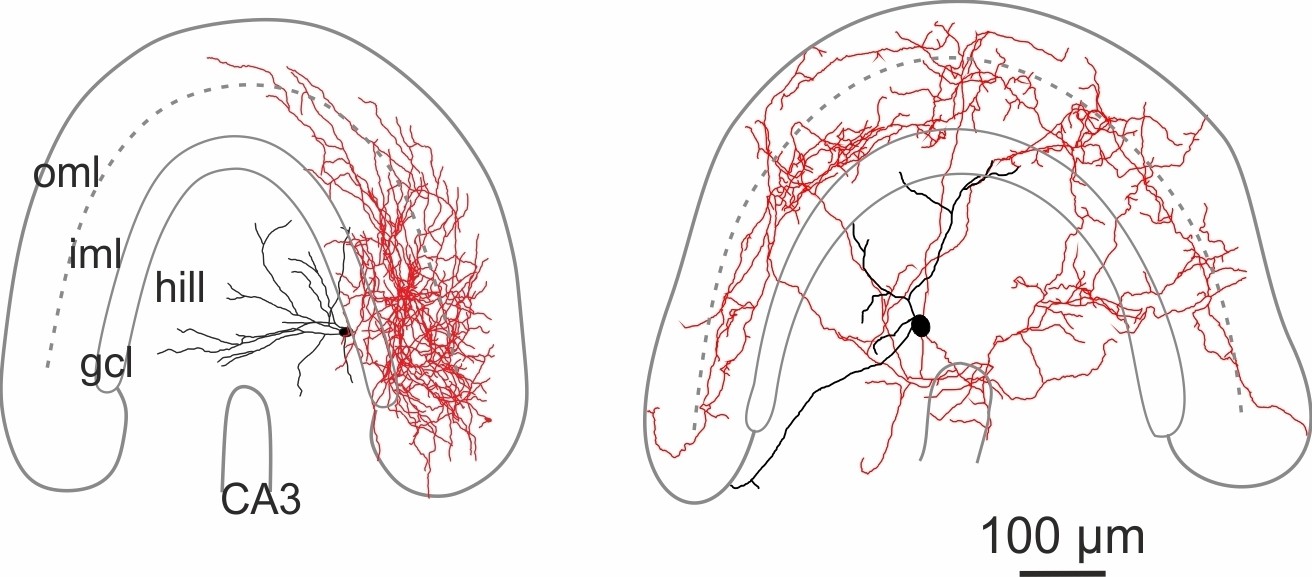
Morphological reconstructions of non-HIPP and non-HIL cells of the DG.
Reconstructions of two SOMIs which have been filled with biocytin during whole-cell recordings in transverse slices of transgenic SOM-GFP-mice expressing GFP in GABAergic interneurons (GIN; Oliva et al., 2000). Somata and dendrites are depicted in black and the axon in red. Note, this SOMI population shows axonal fibers either preferentially distributed in the inner molecular layer (iml, left cell) or throughout the DG (rigt cell). Abbreviations: gcl, granule cell layer; hil, hilus; iml, inner molecular layer; oml, outer molecular layer.
Figure 1—figure supplement 3
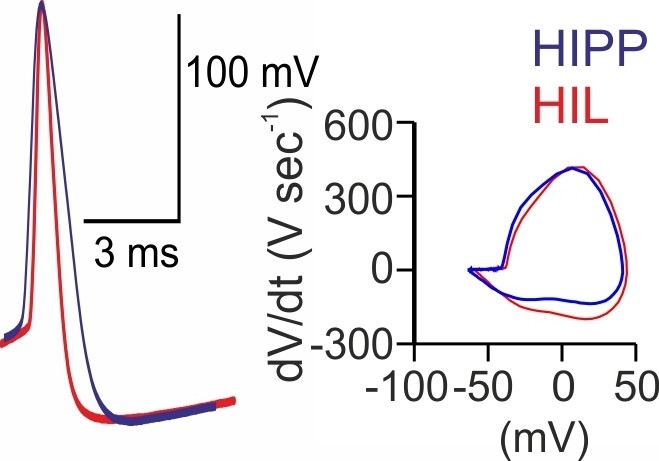
HIPP and HIL cells generate action potentials with different voltage trajectories.
Superposition of individual action potentials (APs) aligned to their peak amplitudes (left) and the corresponding phase plots (right) recorded during the first 10 ms of a 1 s depolarizing current injection of a HIPP (blue) and a HIL cell (red).
Figure 2 with 1 supplement
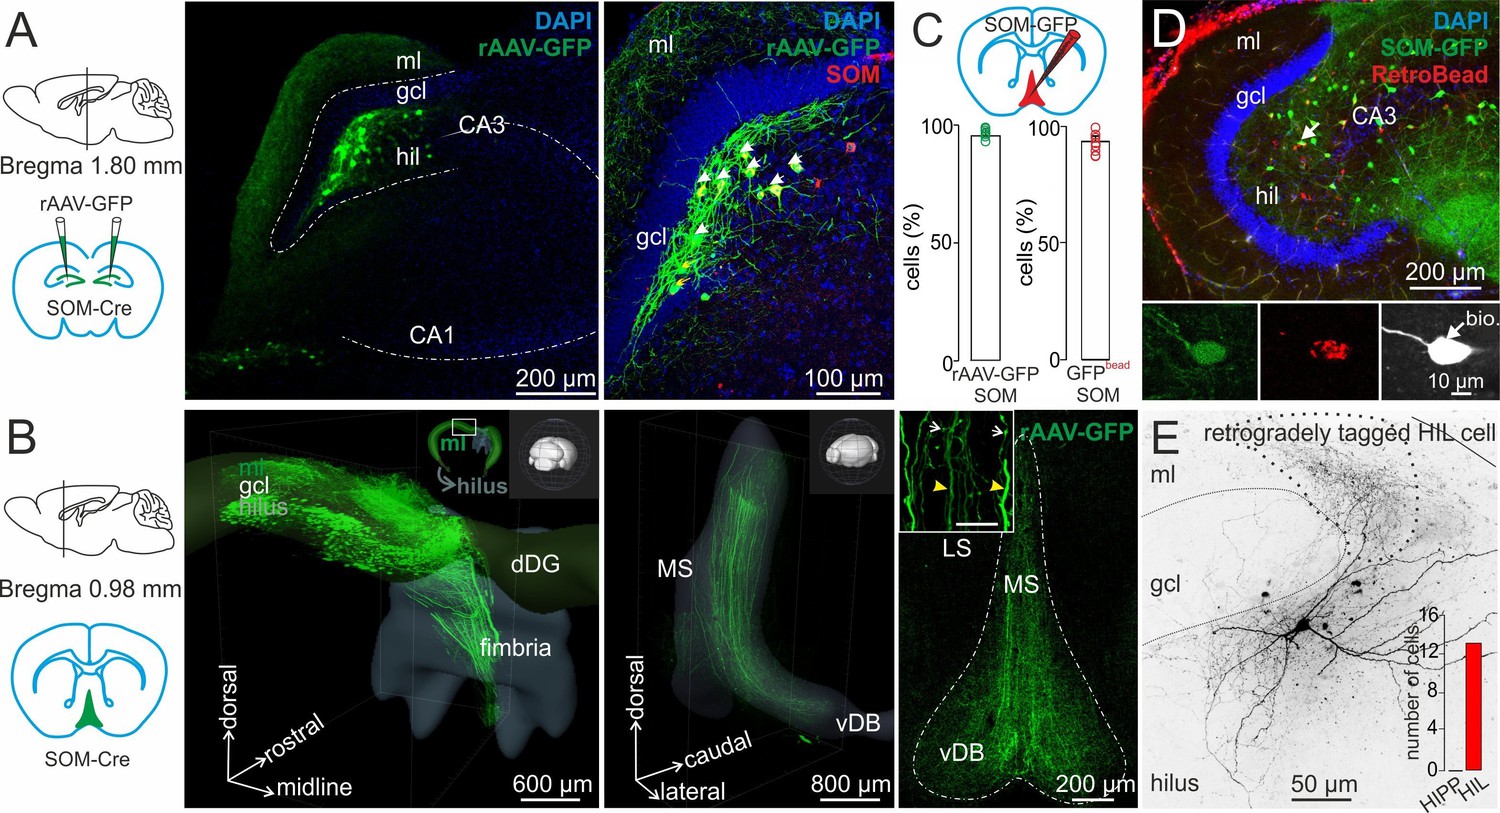
HIL cells form long-range projections to the medial septum and vertical diagonal band of Broca (MSvDB).
(A) Left, schematic represents the bilateral injection of rAAV-FLEX-GFP in dorsal DGs of SOM-Cre mice. Middle, confocal image stack shows SOM+ somata in the hilus and fiber projections in the molecular layer (ml) and hilus (hil). Right, colocalization of immunohistochemically identified SOM (red) and virally expressed GFP. Blue indicates DAPI nuclear staining. Arrows point to somata colocalizing SOM and GFP. (B) Left, schematic illustration of the MSvDB location. Middle, three-dimensional Clarity-processed hippocampal SOM-Cre whole mount after rAAV-GFP injection in the dorsal DG. GFP+ projections leave the dorsal DG (dDG) and project toward the fimbria/fornix. Inset, illustrates the depicted area of the dorsal DG in relation to the orientation of the entire brain. Right, confocal image stack of a frontal 50-µm section of the MSvDB. Dashed line indicates the boarder of the MSvDB. Inset, higher magnification of two types of axons in the MSvDB: thick axon with few varicosities and thin axons with several varicosities. (C–E) Identification of DG-septal projecting SOMIs. (C) Schematic illustrates the injection of the retrograde tracer RedRetroBead (red) in the medial septum. Bar graphs summarize colocalization of SOM (antibody labeling) in the DG of rAAV-GFP injected SOM-Cre mice (left) and retrogradely labeled DG cells in SOM-GIN mice (right). (D) Confocal image stack shows colocalization of GFP in SOM-GIN mice and retrogradely labeled cells (red) after RedRetroBead injection in the MSvDB. Insets, arrow points to a RedRetroBead-labelled soma co-expressing SOM-GFP and intracellularly labeled with biocytin (white) during whole-cell recordings. (E) Morphological identification of a retrogradely tagged HIL cell. Dotted line indicate area of high axonal density. Continuous line depicts boarders of the granule cell layer (gcl). Inset, bar graph summarizes the number of morphologically identified HIL cells projecting to the MSvDB. Bars with lines represent means ± SEM, single circles represent values of individual slices. Abbreviations: gcl, granule cell layer; ml, molecular layer; hil, hilus; dDG, dorsal dentate gyrus; MS, medial septum; LS, lateral septum; vDB vertical limb of the diagonal band of Broca.
Figure 2—figure supplement 1
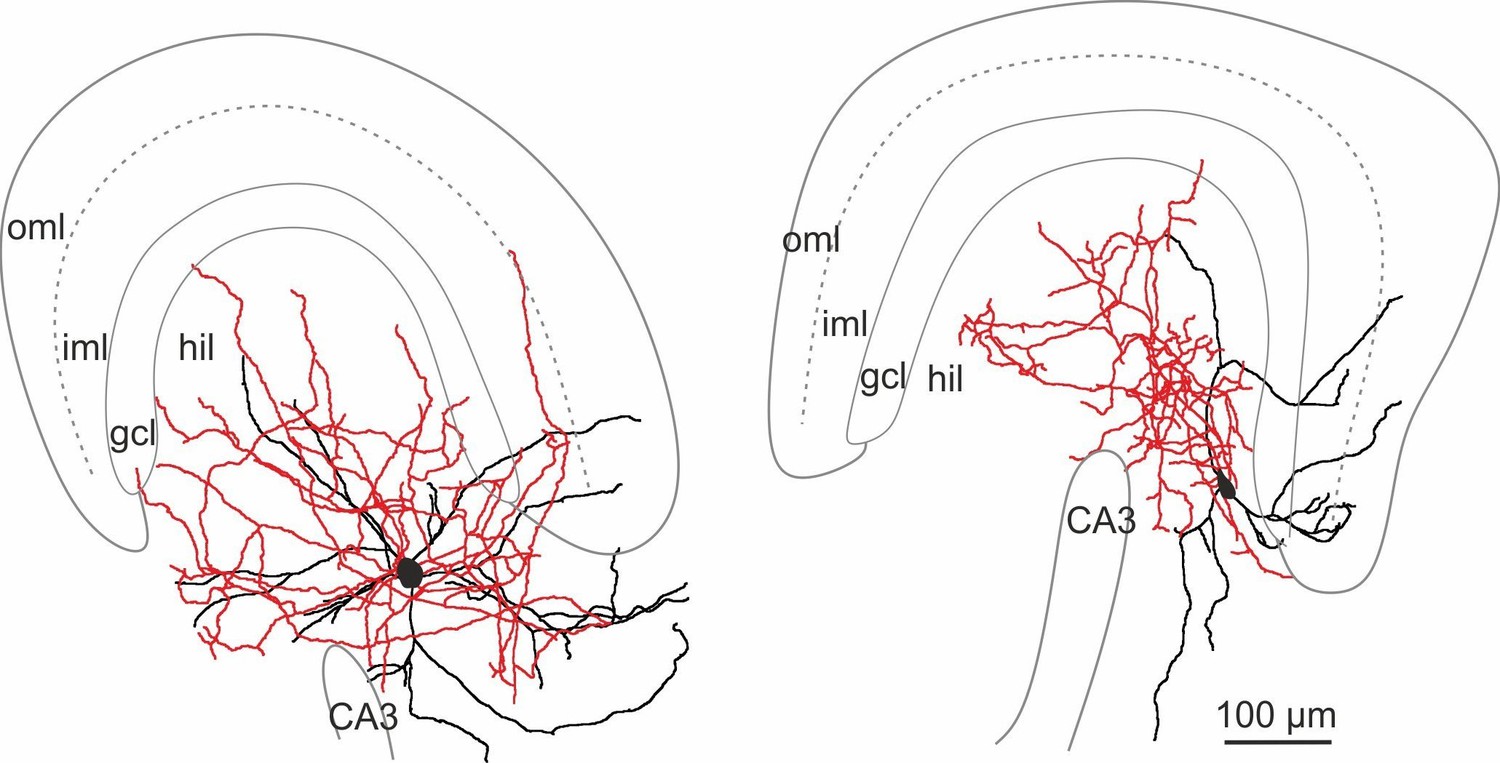
Morphological reconstructions of DG-SOMI cells retrogradely labeled from the medial septum.
Reconstructions of 2 HIL cells intracellularly labeled with biocytin during whole-cell recordings, 3–8 days after RedRetroBead injection into the medial septum. Somata and dendrites are depicted in black and the axons in red. Note, the majority of retrogradelly labeled DG-SOMIs were morphologically identified as HIL cells with axon collaterals preferentially distributed in the hilus (in total: 13 HIL cells, two additonal SOMIs with axon in the gcl, iml and hilus but not in the oml; five injected mice). Abbreviations: gcl, granule cell layer; hil, hilus; iml, inner molecular layer; oml, outer molecular layer.
Figure 3 with 4 supplements

DG-SOMI type-specific expression of long-lasting synaptic plasticity.
(A,C) Left, reconstructions of a HIPP and a HIL cell labeled during plasticity experiments shown in B and D. The somata and dendrites are depicted in black and the axon in red. Right, confocal images of intrinsic SOM-GFP, antibody labeling against SOM (red) and intracellular biocytin loading (white) of the cells shown on the left. (B,D) An associative burst frequency stimulation (aBFS) was applied to glutamatergic input synapses targeting HIPP (B) and HIL cells (D) to induce long-lasting synaptic plasticity (see Materials and methods). Left, schematic illustration of the experimental design. EPSCs were evoked by extracellular stimulation with a pipette positioned at the granule cell layer (gcl) to hilus (hil) border. Individual EPSC peak amplitudes from a single experiment are plotted against time before and after pairing as indicated by the arrow. Insets on the left, average EPSCs (30 traces) during the baseline period (1), PTP (2), 15–20 min after the induction protocol (3) and after DCG-IV bath-application (4, 5). Time-axes on top (HIPP) was broken between 24 and 28 min. Right, summary plot of the time course of EPSC peak amplitudes evoked at glutamatergic HIPP input synapses (five cells). EPSCs were averaged over 30 s intervals and normalized to baseline values. Note, the aBFS resulted in a marked long-term depression (LTD). (D) Right, same as (C) for glutamatergic HIL inputs. Application of the aBFS resulted in a PTP followed by a marked long-term potentiation (LTP; 11 cells). (E) Summary graphs comparing the magnitude of PTP and LTD/LTP of glutamatergic signals. (F) Left, graph summarizes the effect of. 1 µM DCG-IV >20 min after plasticity induction on the amplitude of EPSCs in HIPP and HIL cells. Note, marked DCG-IV effect in HIPP cells pointing to mossy fiber-mediated nature of synaptic signals but variable DCG-IV effects in HIL cells. Right, magnitude of LTD/LTP is not correlated with the DCG-IV effect (Spearman Rank order correlation, p>0.05 for both comparisons). Red circles represent two LTD experiments lacking morphological identification of the recorded SOMIs. Triangles depict HIL and black circles HIPP cells. **p≤0.01. Stars above each group correspond to pairwise comparisons of pre- vs post-aBFS application (paired t-test); stars above line correspond to the comparison in plastic changes between HIPP and HIL cells (Mann-Whitney U test). Average measurements are represented as mean ± SEM. Circles in E and F depict individual experiments.
Figure 3—figure supplement 1
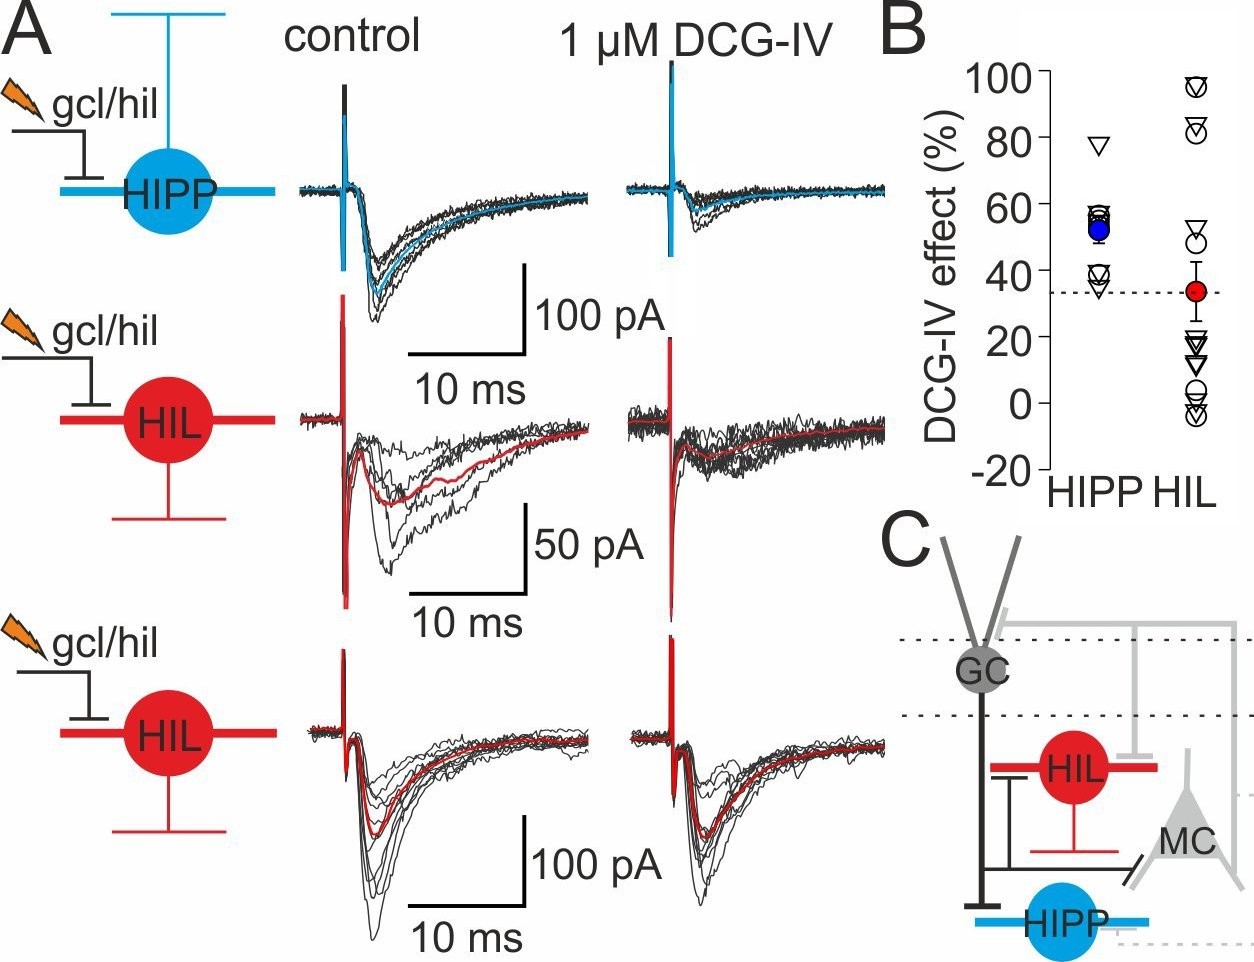
DG-SOMIs receive fast glutamatergic synaptic inputs.
(A) Left, schematic illustrations of the experimental design. EPSCs were evoked in HIPP (blue) and HIL cells (red) with an extracellular stimulation pipette located at the granule cell layer (gcl) to hilus (hil) border. Single traces (black lines) and the average EPSCs (mean of 30 traces, blue and red lines) are shown superimposed. Stimulus artefacts were cut for clarity. Middle, control conditions, EPSCs were recorded in the presence of the GABAA receptor blocker SR59931 (10 µM). Right, EPSC peak amplitudes markedly declined in HIPP cells after bath-application of the group II mGluR agonist DCG-IV (1 µM) indicating their mossy fiber-mediated nature (Sambandan et al., 2010; Hainmüller et al., 2014). The DCG-IV sensitivity of evoked EPSCs in HIL cells was diverse. A subset of neurons showed strong DCG-IV effects (>35%; middle traces) and some HILs were not sensitive against DCG-IV (effect <20%; lower traces). (B) Summary plot of DCG-IV blocking effects (10 HIPP and 16 HIL cells including 5 HIPP and 11 HIL cells which expressed synaptic plasticity; those cells are depicted as triangles and are shown in Figure 3F. The magnitude of the DCG-IV effects between naive cells [circles] and SOMIs which underwent synaptic plasticity [triangles] were not significantly different. p>0.05, t-test for both comparisons). Dotted line indicates border between cells showing a strong DCGIV effect (>35%) and cells showing a mild or no DCGIV effect (<20%). (C) Schematic illustration of the proposed DG circuitry. Mossy fiber inputs of granule cells (GCs; black line with a bar) target both, HIPP and HIL cells and are DCG-IV sensitive. HIL cells receive in addition excitatory inputs of a different origin, very likely from hilar mossy cells (MCs). Lines with bars indicate excitatory input synapses. Grey dotted line indicates weaker connectivity compared to continuous lines. Circles represent single data points, circles with lines are means ± SEM.
Figure 3—figure supplement 2
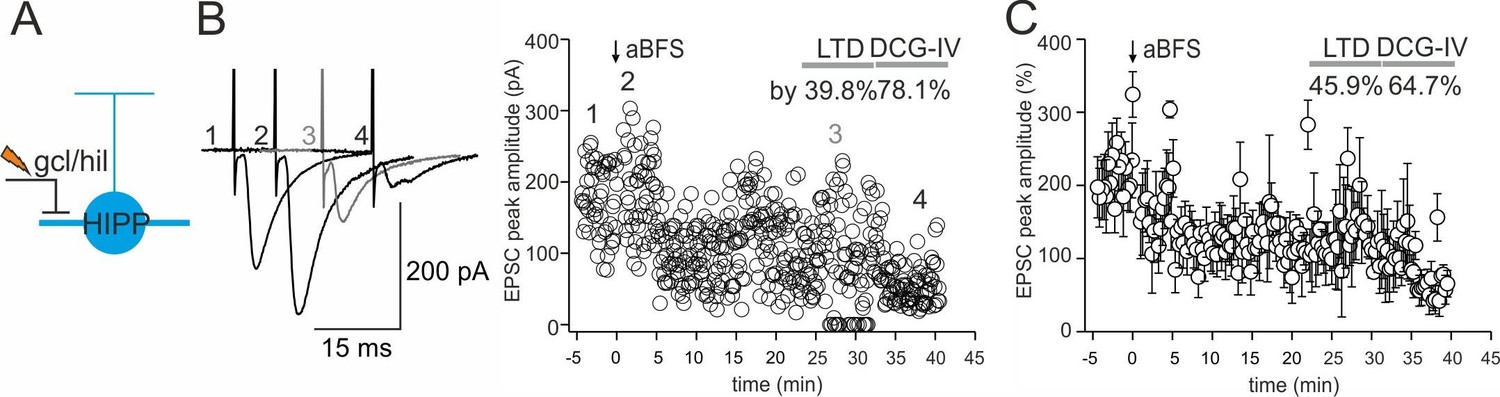
Robust long-term depression (LTD) at DCG-IV-sensitive inputs onto DG-SOMIs.
(A) Schematic illustration of the experimental design. (B) An associative burst frequency stimulation (aBFS) was applied to glutamatergic synapses targeting DG-SOMIs to induce long-lasting synaptic plasticity (see Materials and methods). EPSCs were evoked by extracellular stimulation with a pipette positioned in the granule cell layer (gcl) to hilus (hil) border. Individual EPSC peak amplitudes from a single experiment are plotted against time before and after pairing as indicated by the arrow. Insets on the left, average EPSCs (30 traces) during the baseline period (1), PTP (2), 25–30 min after the induction protocol (3) and after 1 µM DCG-IV bath-application (4) at 35–40 min recording time. Note, bath application of DCG-IV resulted in a marked reduction in EPSC amplitude confirming the mossy fiber-mediated nature of synaptic inputs during extracellular stimulation. (C) Summary plot of the time course of EPSC peak amplitudes evoked at mossy fiber-SOMI inputs (three cells, one HIPP and two non-identified SOMIs). Recordings were performed with >10 MΩ pipettes to prevent the wash out of intracellular components. Circles with lines represent mean ± SEM.
Figure 3—figure supplement 3
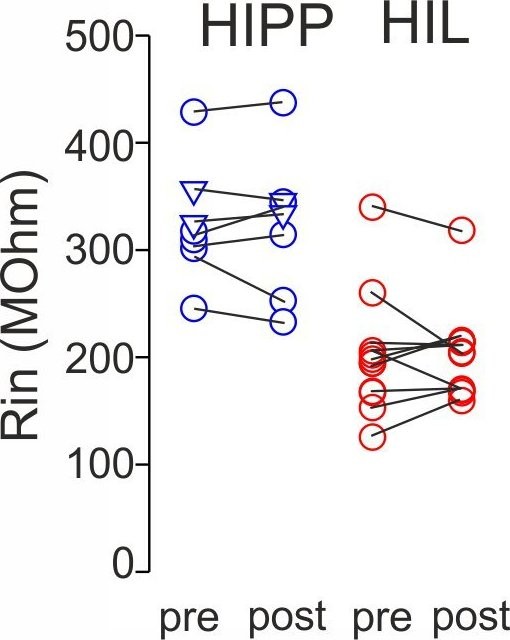
Synaptic plasticity is independent on changes in the input resistance of recorded SOMIs.
Graph summarizes input resistance (Rin) of recorded SOMIs defined by a 10 mV test pulse 5–10 min prior to the application of the associative burst frequency stimulation (aBFS) for the induction of synaptic plasticity (pre) and 15–20 min after plasticity induction (post) for morphologically identified HIPP (blue) and HIL cells (red). Circles connected by lines correspond to one experiment. HIPP: seven cells in total including five cells which showed long-lasting synaptic plasticity (Figure 3) and two HIPP cells without plastic changes (depicted as triangles). HIL: 11 cells with long-lasting synaptic plasticity (Figure 3).
Figure 3—figure supplement 4

Synaptic plasticity is presynaptically expressed.
(A) The percentage of failures in synaptic transmission is plotted for baseline periods 5 min prior to plasticity induction (pre) and 15–20 min after induction of long-term-depression (LTD) in HIPP cells (blue; 5 HIPPs and two non-identified SOMIs expressing LTD, depicted as triangles) and long-term potentiation (LTP) in HIL cells (red; 11 cells). (B) Coefficient of variation (CV) analysis. The inverse of the square of the CV (CV−2) of the amplitude 15–20 min after plasticity induction (CVA2) was plotted against the mean peak amplitude (mean A2); the data were normalized by the CV−2 and mean peak amplitude of EPSCs during the baseline period (A1). Dotted line indicates the identity line (17 cells, 5 HIPP and 10 HIL cells and two morphologically unidentified SOMIs expressing LTD, depicted as triangles). Circles connected by lines represent individual experiment. *p≤0.05.
Figure 4
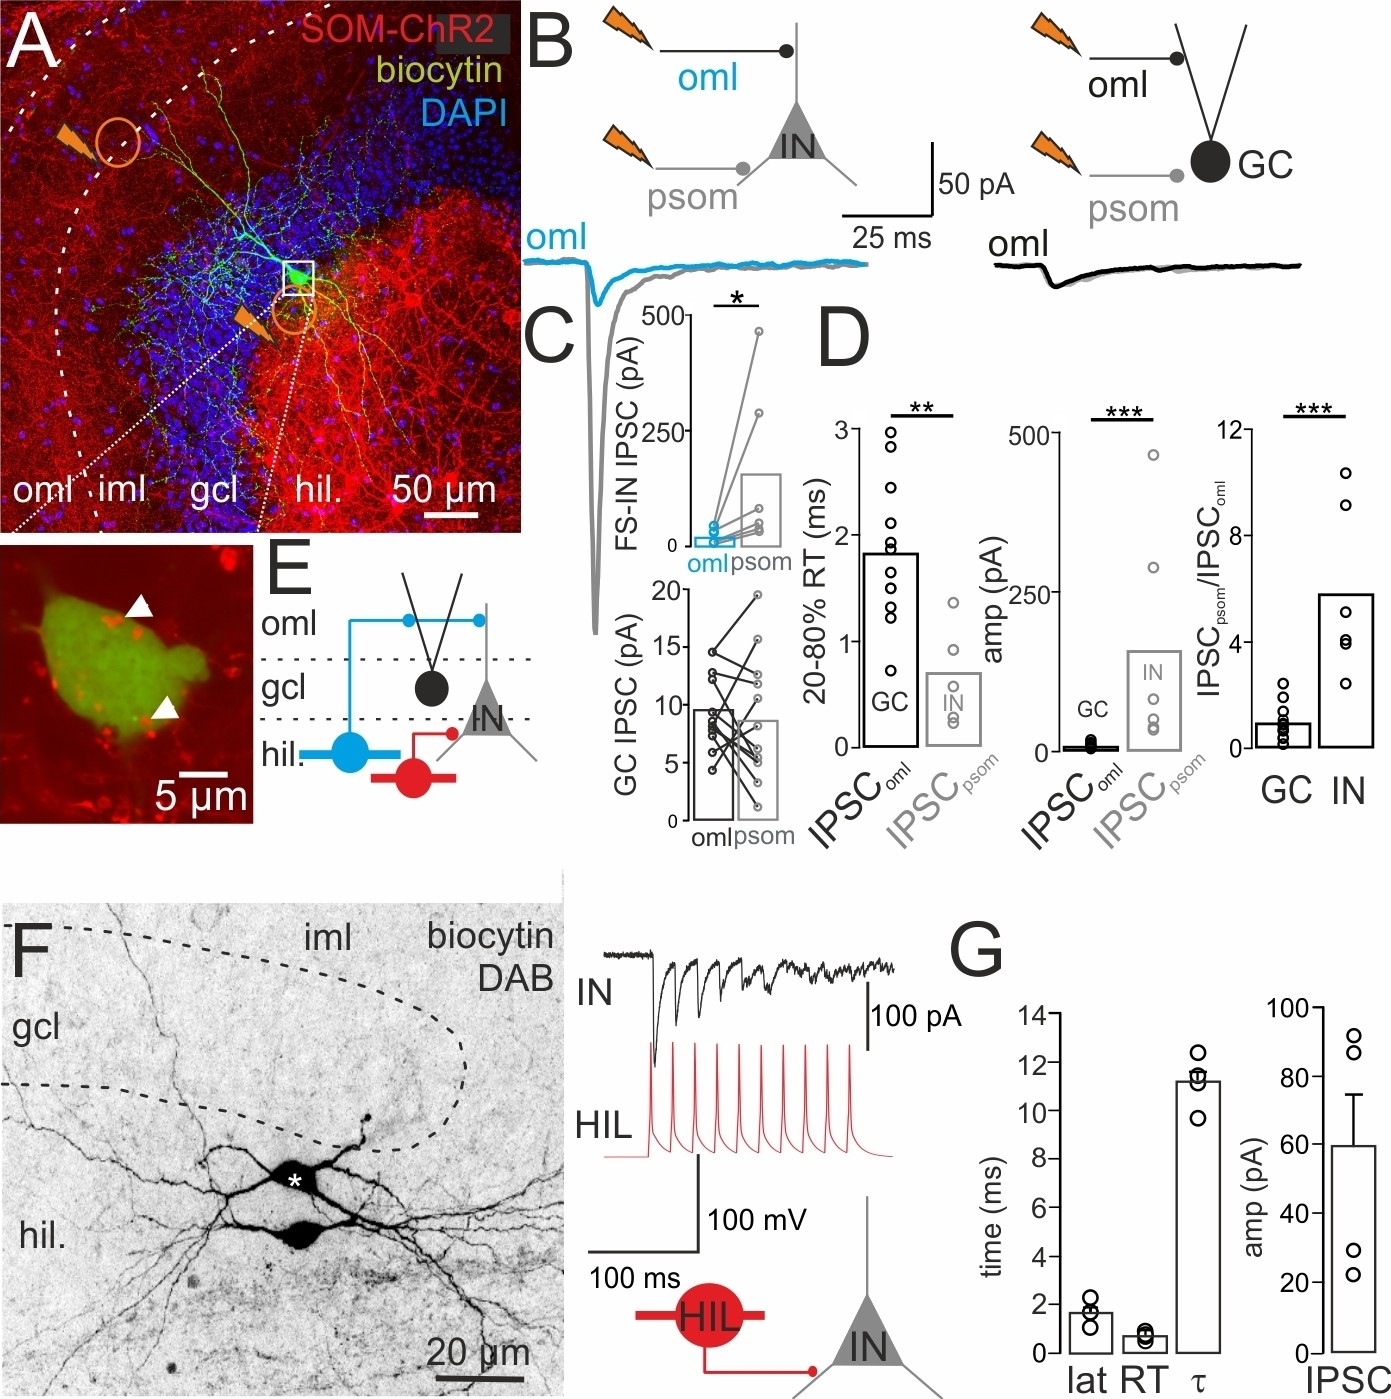
DG-SOMIs provide dendritic and perisomatic inhibition onto DG target cells.
(A) Upper, confocal image stack shows expression of channelrhodopsin-2 (ChR2)-tdTomato (tdT) in SOM+ interneurons upon stereotaxic injection of rAAV-ChR2-tdT in the ventral DG (Materials and methods). Orange circles with jags indicate location of 1-Photon light pulses (0.5 ms, 473 nm) applied to the outer molecular layer (oml) and at the perisomatic (psom) area in an alternating manner to evoke IPSCs in GCs and fast-spiking interneurons (INs). A representative IN with axon arborizations restricted to the granule cell layer (gcl), identifying it as basket cell, was labeled intracellularly during whole-cell recordings and is shown in green. The magnified soma of the same cell is shown below. Arrow heads point to SOM+ bouton-like varicosities. (B) IPSCs recorded in an IN (left) and a GC (right) upon light-pulse application to the oml (blue and black traces, respectively) are superimposed with IPSCs evoked close to the soma (psom; gray traces). (C) Bar graphs summarize amplitude (amp) of oml and psom evoked IPSCs in INs and GCs. (D) Summary of the 20–80% rise time (RT), peak amplitude (amp) and IPSCpsom/IPSComl ratio of IPSCs recorded in GCs and INs (12 GCs, 6 INs including four fast-spiking and two regular-spiking INs, 3 GCs and three fast-spiking INs were recorded simultaneously in one slice). Note, perisomatically evoked IPSCs in INs are larger and faster than the ones evoked by light pulses applied to the oml in GCs. (E) Schematic illustrates connections among DG-INs (blue HIPP, red HIL cell) and GCs (black filled circle). (F) Left, intracellular labeling of a synaptically connected HIL-HIL pair. Star indicates the presynaptic cell. Right, a train of 10 action potentials (50 Hz) in the presynapstic HIL (red) evoked unitary IPSCs (uIPSCs) in the postsynaptic IN (black; traces correspond to the pair shown on the left). (G) Summary plots showing the functional properties of uIPSCs from four HIL-IN pairs (two HIL-HIL, two HIL-basket cells). Circles represent single data points. Circles connected by lines correspond to one experiment. Bars with lines indicate means ± SEM; *p≤0.05, **p≤0.01, ***p≤0.001. Abbreviations: lat, synaptic latency; RT, 20–80% rise time and τ, decay time constant of uIPSC; oml, outer molecular layer; psom, perisomatic.
Figure 5
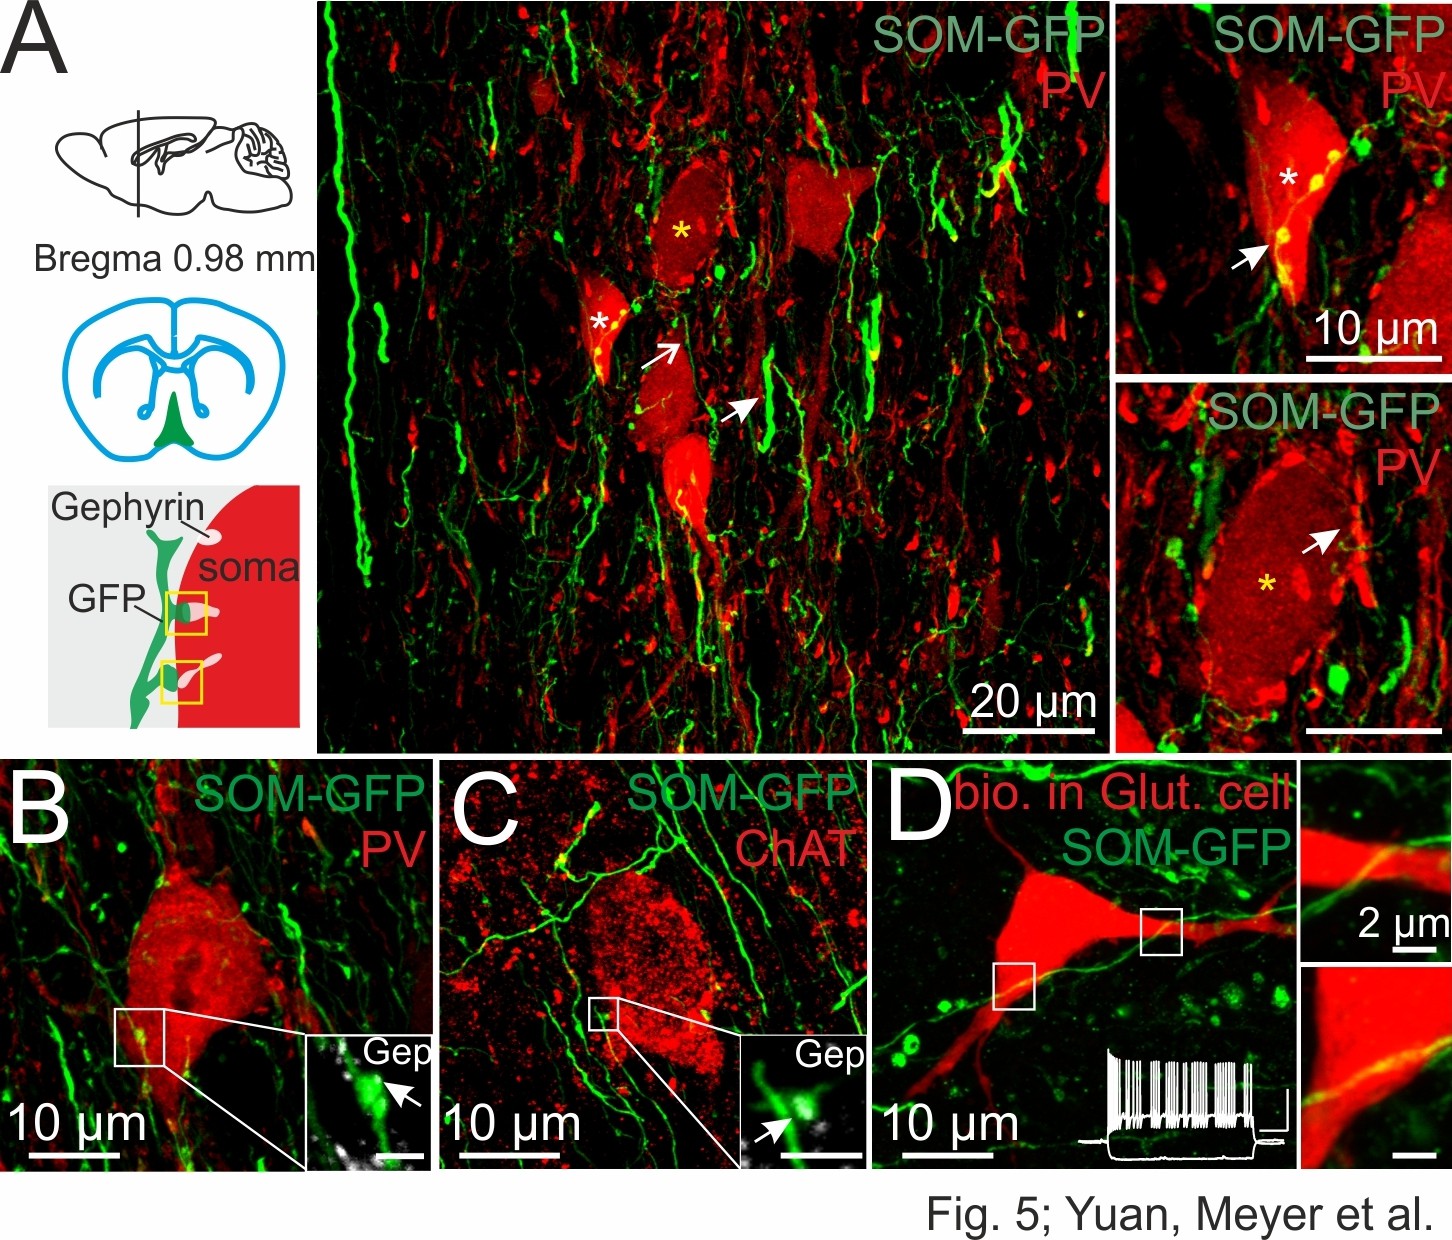
DG-SOMIs form putative synapses onto septal GABAergic, cholinergic and putative glutamatergic cells.
(A) Confocal image stack of SOM fibers expressing GFP in the medial septum and vertical limb of the diagonal band of Broca (MSvDB) upon rAAV-FLEX-GFP injection bilaterally in the dorsal DG of SOM-Cre mice. Thin GFP-positive fibers (open arrow) form ‘en passant’ bouton-like varicosities at close proximity to cell bodies of PVIs (red). Somata marked with a white and yellow star are shown on the right at higher magnification. Top right, arrow points to putative synaptic contacts formed by DG-septal SOMIs. Bottom right, PVI cell bodies are surrounded by PV-expressing boutons very likely originating from local PVIs (arrow). (B,C) Confocal image stacks of putative synaptic contacts formed by DG-septal projecting SOMIs at a PVI soma (B) and at a cell body expressing choline acetyltransferase (ChAT, (C). Insets, high magnifications of the putative contact sites colocalizing gephyrin (Gep; arrow). Scale bar, 2 µm. (D) Intracellularly labeled cell in the MSvDB with biocytin during whole-cell recordings (red). The cell showed a burst-like discharge pattern (inset; cluster-firing cells) during depolarizing current injections (1 s, 300 pA; −100 pA) characteristic for glutamatergic (Glut) neurons in the MSvDB (Manseau et al., 2005; Mattis et al., 2014). White boxes are magnified on the right and show SOMI-GFP fibres in close proximity of the soma and the proximal dendrite of the putative glutamatergic cell. Note, lacking bouton-like shape of this putative contact site.
Figure 6 with 1 supplement
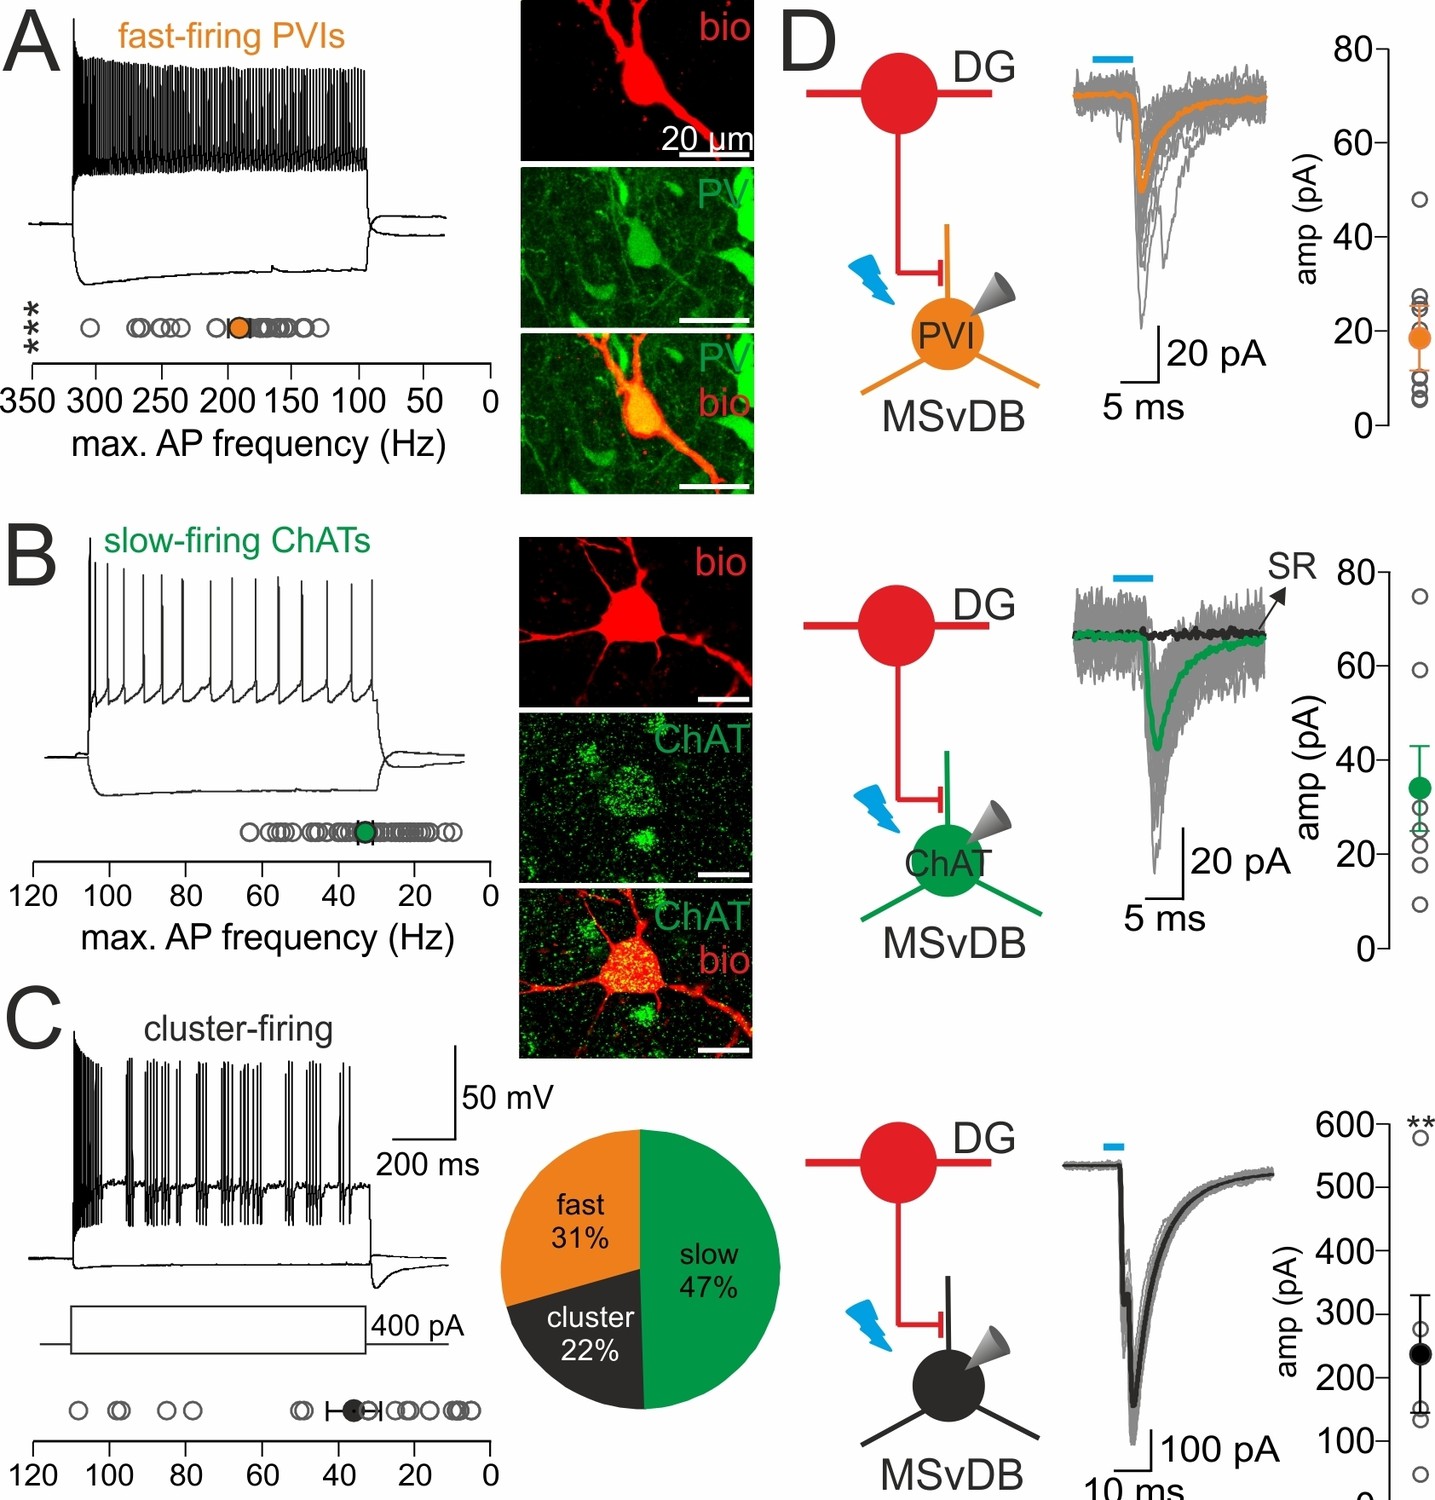
DG-SOMIs provide weak inhibition on GABAergic and cholinergic but strong inhibition onto putative glutamatergic cells in the medial septum.
(A–C) Passive and active membrane properties and the neurochemical marker contents of the three main neuron types in the medial septum and vertical limb of the diagonal band of Broca (MSvDB). Left, characteristic discharge patterns of the three cells types (1 s, −100 and 400 pA current injection) classify them as fast-spiking (A), slow-firing (B) and cluster-firing (C) cells. Plots summarize the maximal discharge frequency of the three cell types. The discharge frequency between PVIs and slow-firing as well as cluster-firing cells was significantly different (***p<0.001 for both comparisons, t-test). Right, intracellular labeling of cells with biocytin (red) with subsequent antibody labeling (green). Note, all fast-firing cells expressed parvalbumin (PV). Slow-firing cells express choline acetyltransferase (ChAT) and cluster-firing cells have been previously identified as glutamatergic (Glut) cells (Manseau et al., 2005; Mattis et al., 2014). Pie chart summarizes the relative proportion of the recorded cell types (32 fast-spiking PVIs, 49 slow-firing ChATs, 23 cluster-firing putative Glut cells). (D) Left, schematic illustration of the experimental procedure. DG-septal projecting SOMIs expressing channelrhodopsin-2 (ChR2) after injection of rAAV-FLEX-ChR2-tdT in the dorsal DG were activated by light-pulses (5 ms, full-field illumination, 473 nm) applied to the MSvDB (red circles represent HIL cells). Middle, IPSCs recorded in the three neuron types. Individual IPSCs (grey traces) and average IPSCs (color-coded traces) are shown superimposed. Bath application of 10 µM SR59931 blocked IPSCs in three slow-firing ChAT cells. Right, summary plots show peak amplitudes of evoked IPSCs in PVIs (10 out of 32 cells), ChATs (7 out of 49 cells) and putative glutamatergic cells (5 out of 23 cells). Open circles are individual data points, filled circles are mean values with lines representing ± SEM; **p≤0.01, Mann-Whitney U test for pair-wise comparisons between PVIs vs putative glutamatergic cells and ChATs vs glutamatergic cells. ***p<0.001 for pair-wise comparisons between PVIs vs putative glutamatergic cells and PVIs vs ChATs. To compare three data sets for significant differences a Kruskal-Wallis one-way analysis of variance on Ranks was performed.
Figure 6—figure supplement 1
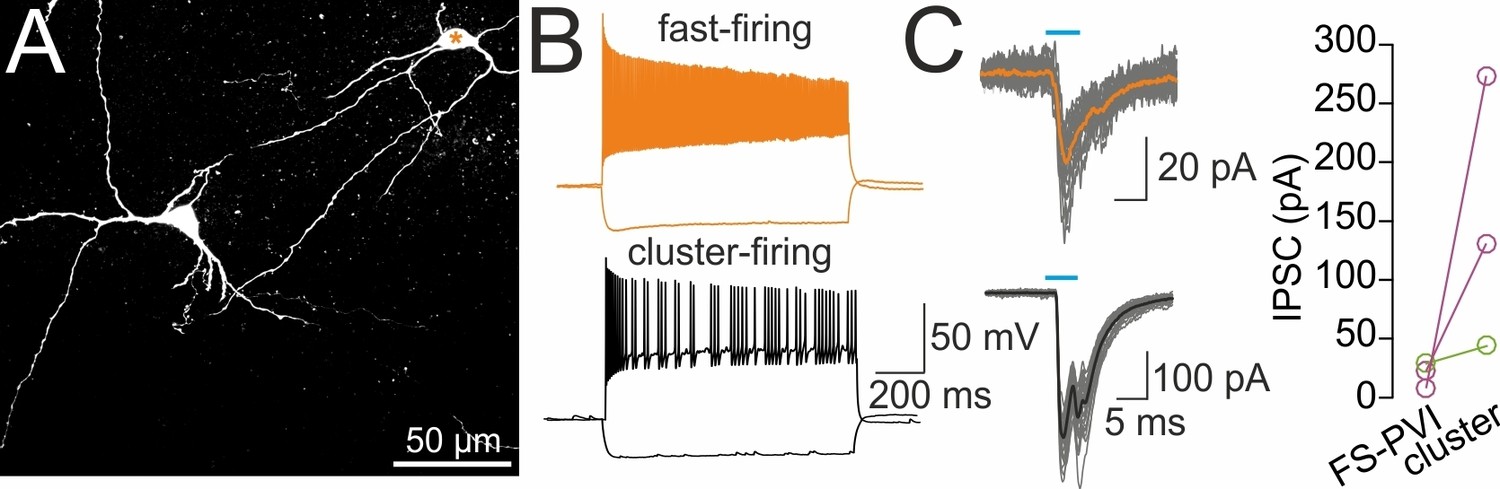
Sequential recordings of fast-spiking PVIs and cluster-firing putative glutamatergic cells in the same slice preparation.
(A) Confocal image stack of two biocytin-filled cells subsequently recorded in slice preparations of the medial septum and vertical limb of the diagonal band of Broca (MSvDB). Orange star depicts fast-spiking cell shown in (B). (B) Passive and active membrane properties of the two neuron types recorded in the MSvDB. Top, fast-spiking PVI; bottom, cluster-firing putative glutamatergic cell (1 s, −100 and 400 pA current injection). (C) Left, DG-septal projecting SOMIs expressing channelrhodopsin-2 (ChR2) were activated by light-pulses as indicated by the blue horizontal line (5 ms, 473 nm, full-field illumination) applied to the MSvDB, 2 weeks after injection of rAAV-FLEX-ChR2-tdT in the dorsal DG of SOM-Cre mice. Top, evoked IPSCs recorded in the fast-firing interneuron. Individual IPSCs (grey traces) and average IPSCs (orange trace) are shown superimposed. Bottom, light-induced IPSCs were recorded in a cluster-firing neuron. Average IPSC is shown in black. Right, graph summarizes mean peak amplitude of IPSCs subsequently recorded from a fast-spiking PVI and a cluster-firing putative glutamatergic cell in the same slice. Circles connected by lines represent individual data points. Color code represents individual mice (two mice).
Figure 7

Schematic of the dentate gyrus neuronal network with some of the main cellular components.
Schematic illustration of the synaptic integration of DG-SOMIs in the local dentate gyrus (DG) and the medial septum and vertical limb of the diagonal band of Broca (MSvDB) circuitry. The perforant path (PP) transmits information from the entorhinal cortex to the DG by targeting distal dendrites of granule cells (GCs) and GABAergic cells including PVIs (orange). DG-SOMIs consist of at least two contrasting types. HIPP (blue) and HIL (red) cells are recruited by GC inputs via mossy fiber (MF) synapses (black lines with bars) and glutamatergic inputs from mossy cells (MCs) which show target preference for HIL cells (grey lines with bars). Repetitive associative activation of glutamatergic inputs induces long-lasting depression of synaptic transmission onto HIPP cells but long-lasting potentiation onto HIL neurons. HIPPs provide weak and slow dendritic inhibition onto local GCs and interneurons, including PVIs. HILs provide perisomatic inhibition onto local DG-interneurons including PVIs and additionally form extra-DG long-range projections to the medial septum to strongly inhibit cluster-firing putative glutamatergic cells and to mildly inhibit fast-spiking PVIs and slow-discharging cholinergic cells.
Author response image 1
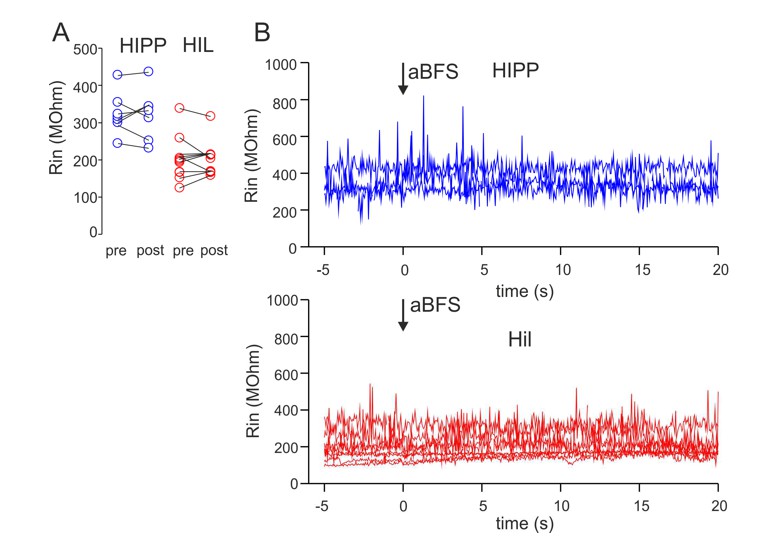
The input resistance (Rin) of HIPP and HIL cells does not change over recording time and in dependence on the applied associative burst frequency (aBFS) stimulation for the induction of synaptic plasticity.
(A) Rin was determined on the basis of 10 mV test pulses applied to the recorded cells throughout the experiment. The mean values are plotted for baseline periods (pre) as well as 15-20 min after the aBFS application (post). Rin was not significantly different between baseline periods and after plasticity induction (P > 0.05, t-Test). Circles connected by lines represent individual experiments (8 blue circles represent 5 HIPP cells showing synaptic plasticity included in Figure 3 of the manuscript plus 3 DG-SOMIs expressing LTD and shown in Figure 3—figure supplement 2 of the revised manuscript; 9 red circles represent 9 HIL cells expressing LTP and shown in Figure 3 of the manuscript). (B) Rin was plotted against the recordings time for a subset of HIPPs (4 cells) and HILs (8 cells). Note the stable Rin throughout the experiment.
Author response image 2
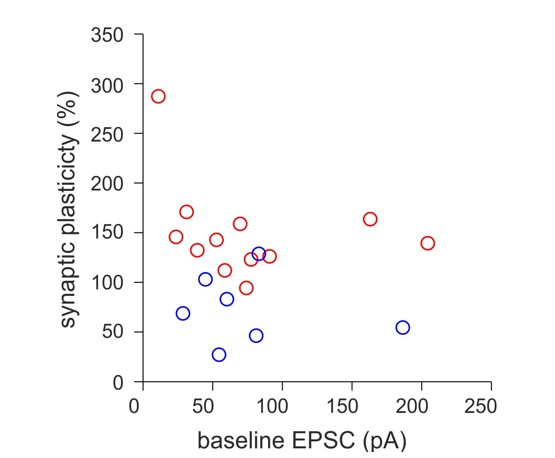
The magnitude of synaptic plasticity does not depend on the peak amplitude of EPSCs during the baseline period.
The percentage of synaptic plasticity was plotted against the peak amplitude of the mean EPSCs recorded during baseline periods prior to the application of the aBFS for plasticity induction. Circles represent individual experiments from HIPP (blue) and HIL (red) cells.
Author response image 3
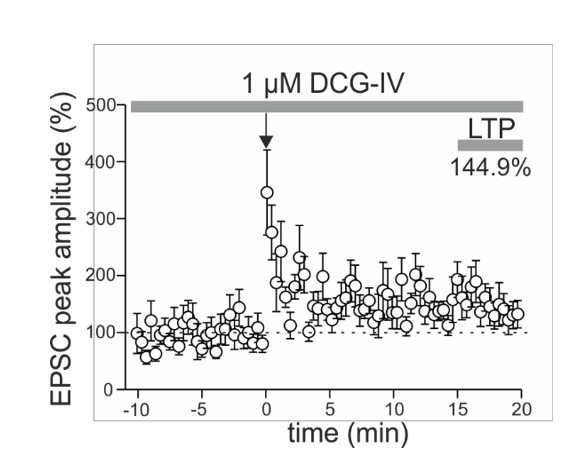
Long-lasting potentiation can be induced at glutamatergic inputs targeting somatostatin-expressing interneurons (SOMIs) in the presence of the group II mGluR agonist DCG-IV.
EPSCs were evoked by extracellular stimulation with a pipette positioned at thegranule cell layer to hilus border. Plot summarizes the time course of EPSC peak amplitudes evoked at glutamatergic input synapses targeting SOMIs before and after associative pairing as indicated by the arrow. EPSCs were averaged over 30 sec intervals and normalized to baseline values. Long-term potentiation (LTP) was determined 15-20 min after plasticity induction. Note, DCG-IV was bath-applied throughout the entire experiment to block mossy fiber-mediated EPSCs (4 SOMIs). These data together with our finding that LTP can be induced at glutamatergic inputs onto SOMIs that are strongly DCG-IV sensitive and therefore mediated by mossy fibers (blocking effect >40%; see Figure 3F left in the main manuscript), suggests that LTP induction in SOMIs is independent on the nature of the input synapse.
Download links
A two-part list of links to download the article, or parts of the article, in various formats.
Downloads (link to download the article as PDF)
Open citations (links to open the citations from this article in various online reference manager services)
Cite this article (links to download the citations from this article in formats compatible with various reference manager tools)
Somatostatin-positive interneurons in the dentate gyrus of mice provide local- and long-range septal synaptic inhibition
eLife 6:e21105.
https://doi.org/10.7554/eLife.21105


