CHARGE syndrome modeling using patient-iPSCs reveals defective migration of neural crest cells harboring CHD7 mutations
- Keio University School of Medicine, Japan
- Tokyo Metropolitan University, Japan
- Kanagawa Children's Medical Center, Japan
- Juntendo University School of Medicine, Japan
- Stanford University School of Medicine, United States
- Howard Hughes Medical Institute, Stanford University School of Medicine, United States
Figures
Figure 1 with 1 supplement
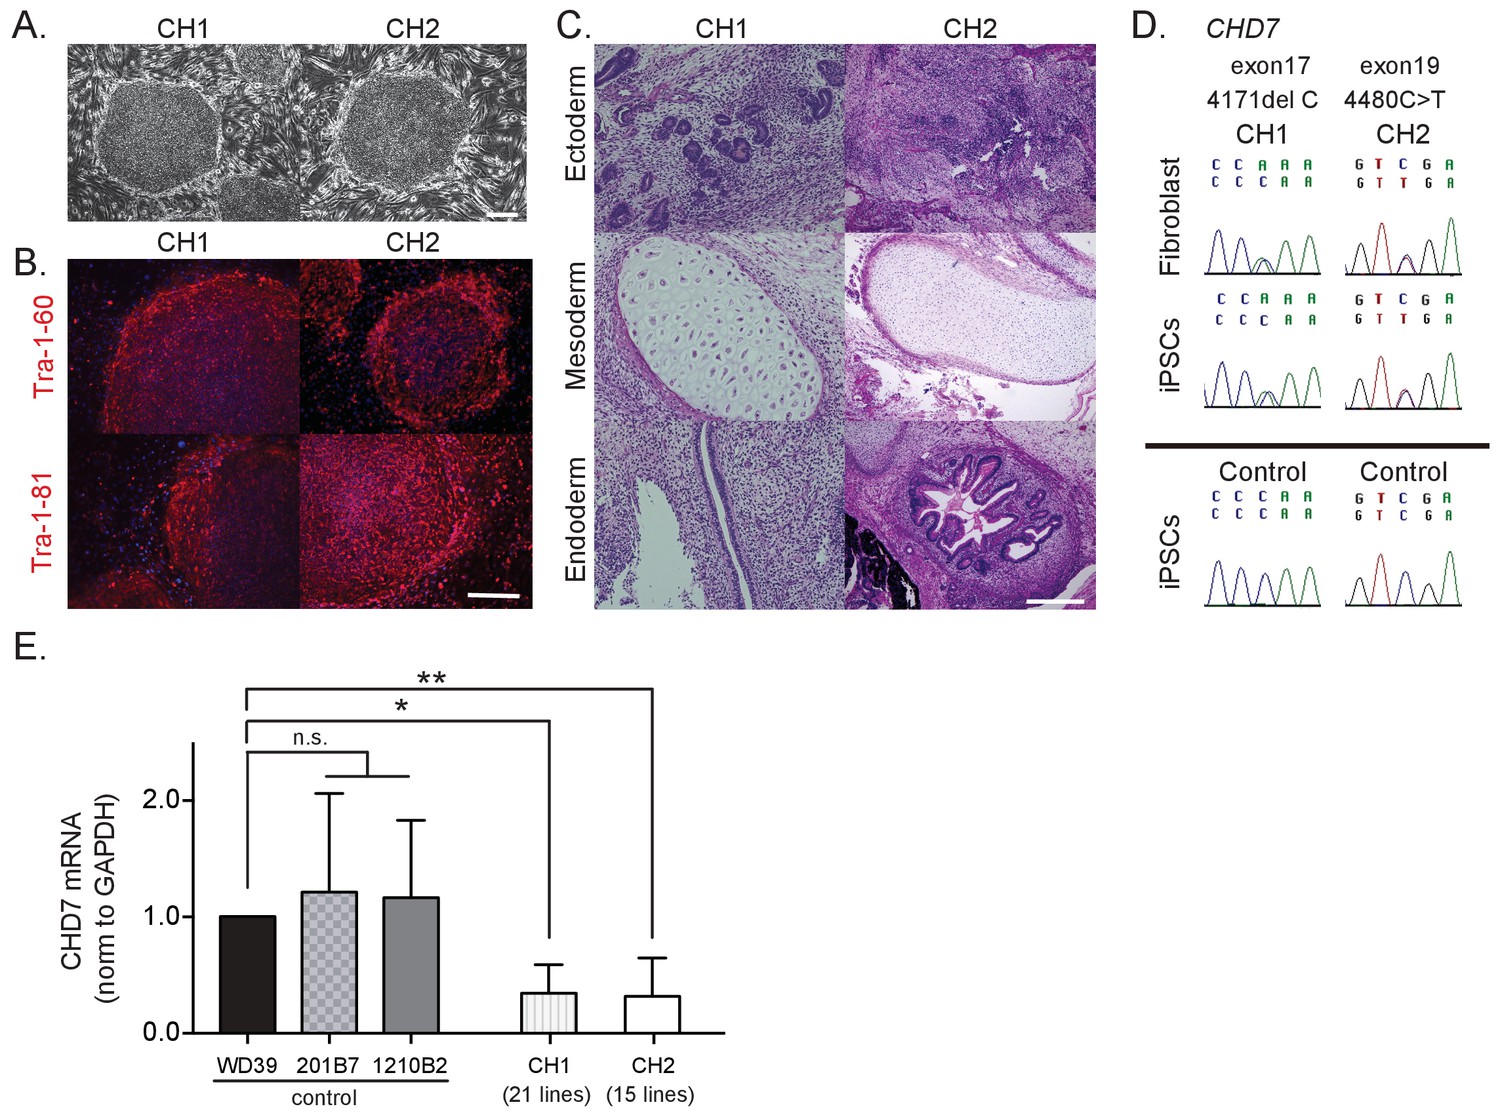
Characterization of CHARGE patient-derived iPSCs.
(A) Representative images of generated iPSCs from CHARGE patients CH1 and CH2 showing human ESC-like morphologies. Bar: 300 μm. (B) TRA1-60 and TRA1-81 protein, pluripotent markers, expression in CHARGE iPSCs. Bar: 300 μm. (C) Hematoxylin and eosin staining of teratoma derived from CHARGE iPSCs, which were transplanted into the testes of NOD-SCID mice. Bar: 300 μm. (D) Direct sequencing analysis of the CHD7 mutations in CHARGE patient’s fibroblasts and iPSCs. The original CHD7 mutations in the patient’s fibroblasts were conserved in the generated iPSCs. The corresponding sequences in control iPSCs are shown below. (E) qRT-PCR analysis showed that CHD7 mRNA expression is significantly reduced in both sets of CHARGE-iPSCs. Control iPSCs (WD39, 201B7, and 1210B2); CH1, 21 lines (CH1#1, #3–17, #19–21, #24, #25); CH2, 15 lines (CH2#1–3, #5, #7–8, #10, #16–23). Technical replicates = 3, Biological replicates (the number of independent sample collection from cells per group) >3, mean ± S.D., n.s.: not significant, *p<0.05, **p<0.01 (Dunn’s multiple comparisons test: compared with WD39). The following file is avail able for Figure 1,Figure 1—figure supplement 1, Figure 1—source data 1.
-
Figure 1—source data 1
Features and phenotypes of the enrolled CHARGE patients, and raw data and statistical data of Figure 1.
Tab1: Features and phenotypes of the enrolled CHARGE patients. Both patients showed symptoms typical of CHARGE syndrome. Tab2: Statistical data of Figure 1F. qRT-PCR analysis of CHD7 using control and CHARGE iPSC lines.
- https://doi.org/10.7554/eLife.21114.005
Figure 1—figure supplement 1
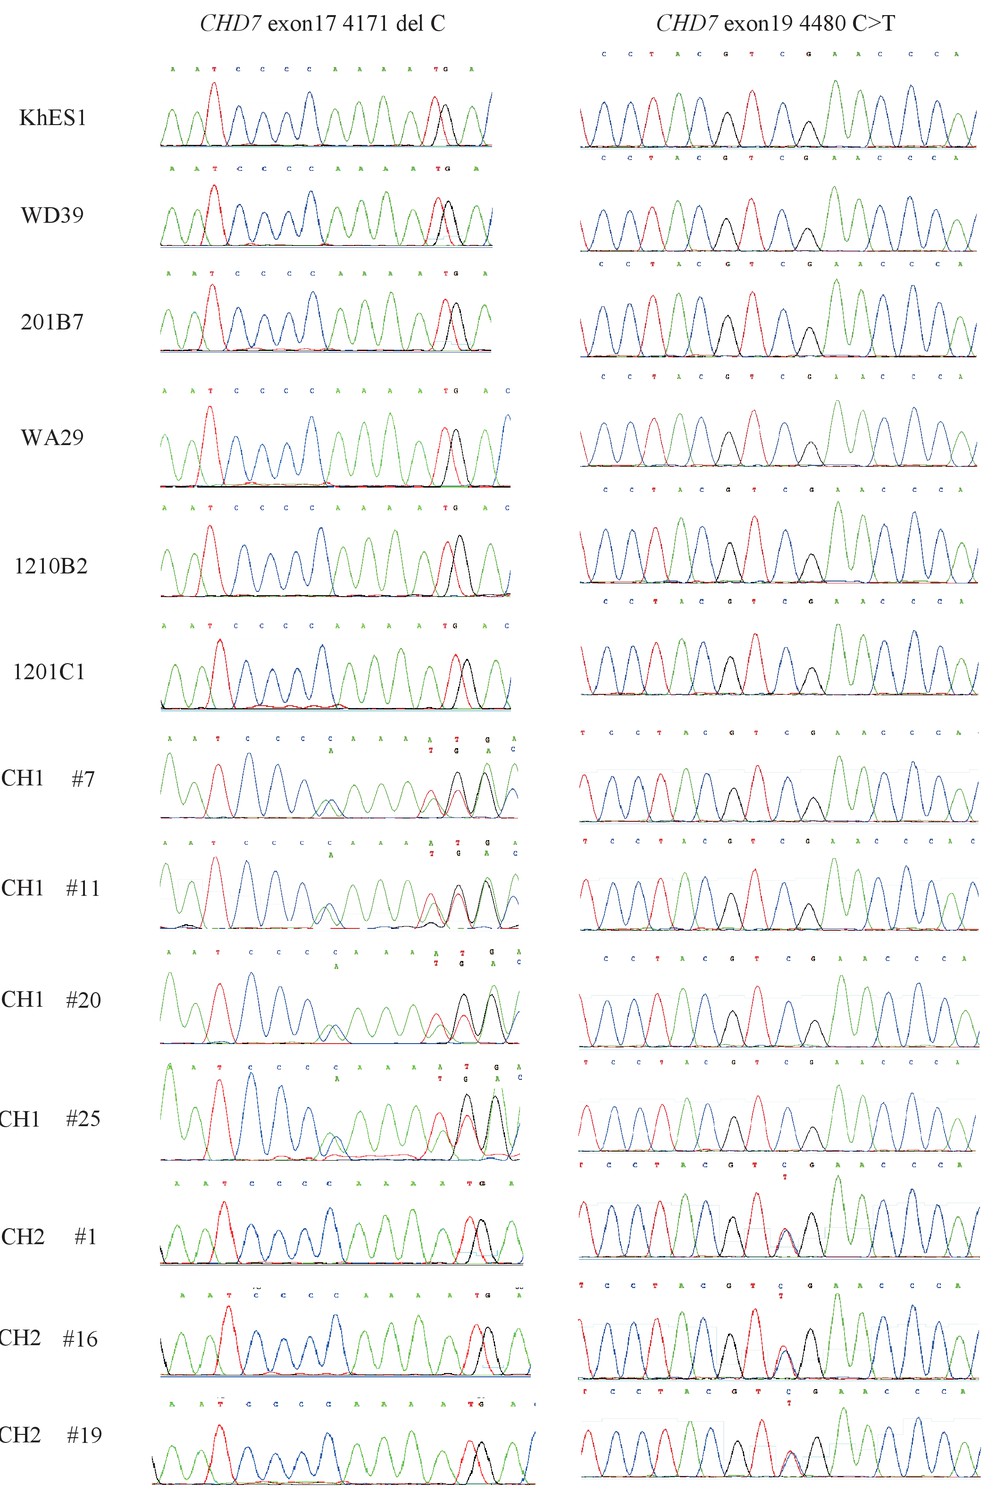
Direct sequencing analysis of the CHD7 mutations in all iPSC lines used in this study.
https://doi.org/10.7554/eLife.21114.004
Figure 2
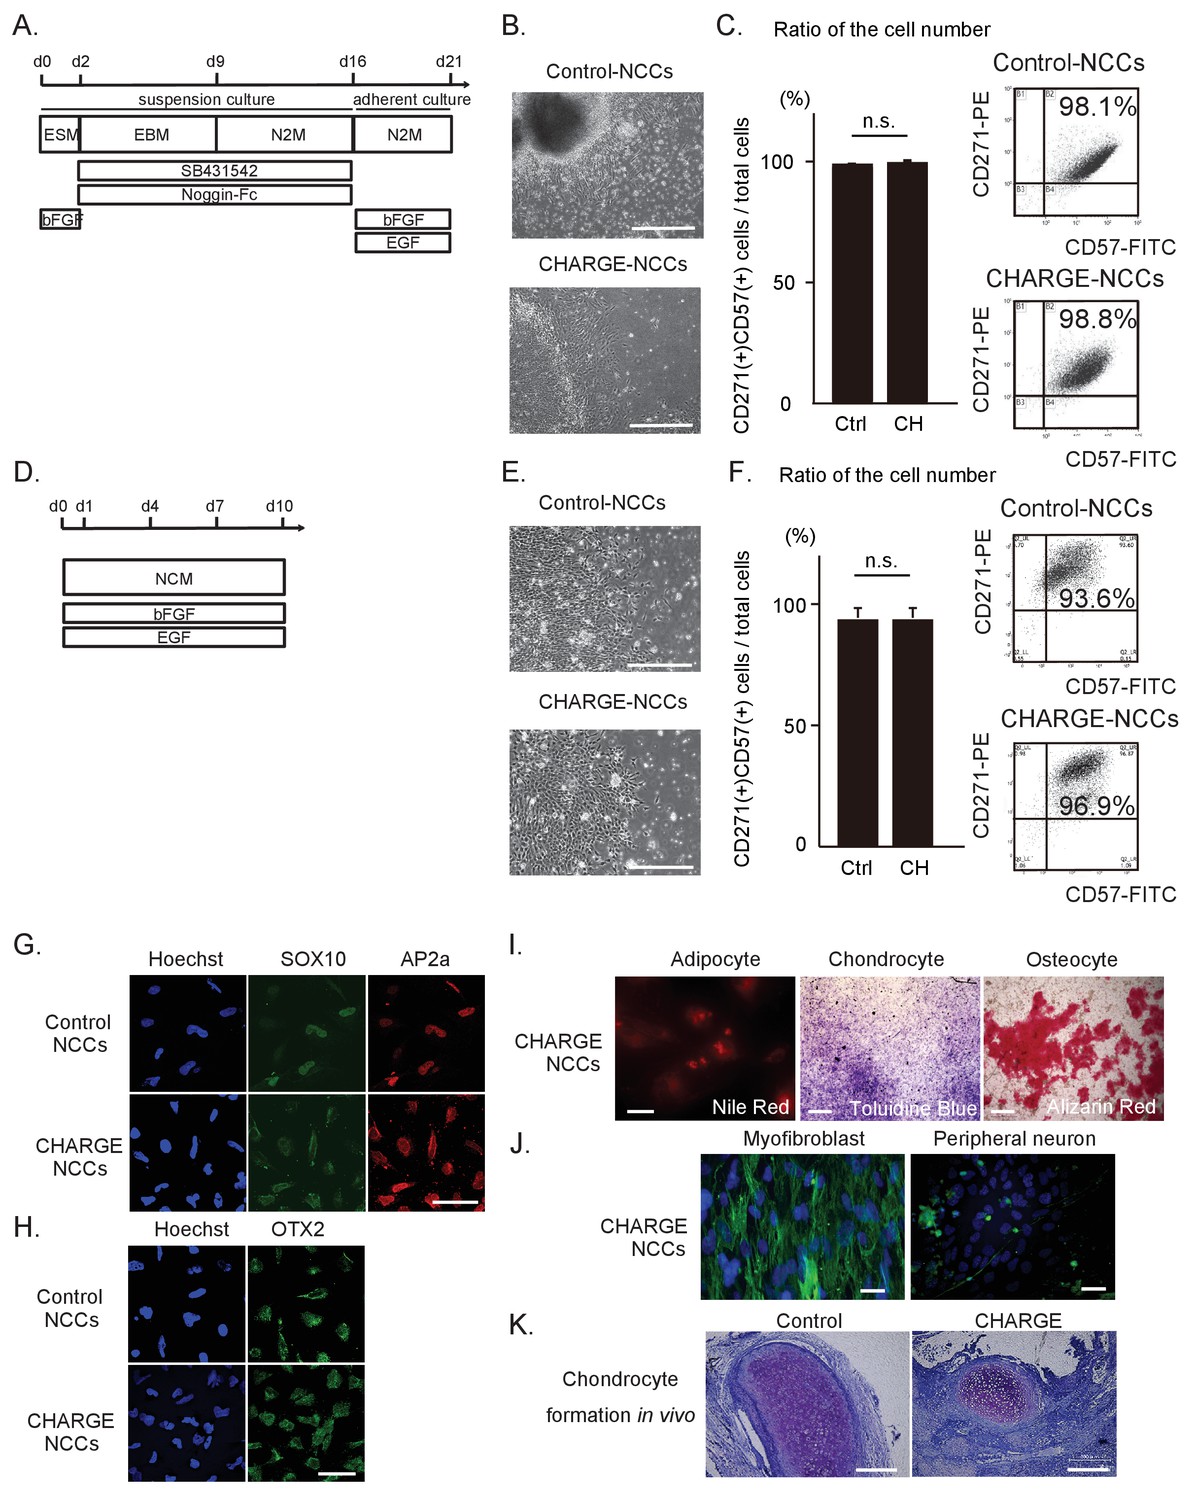
Differentiation of patient iPSCs into NCCs.
The iPSC-NCCs in (B) and (C) were obtained by Method A, and the iPSC-NCCs in (D)-(K) were obtained by Method B. (A) Schematic presentation of the protocol for NCC differentiation from iPSCs using dual SMAD inhibition (Method A). (B) Representative phase-contrast images of control and CHARGE iPSC-NCCs. Bar: 500 μm. (C) (Left) Quantification of the ratio of the cell number of CD271 and CD57 double-positive cells per total induced cells calculated by flow cytometry. n.s., not significant (Unpaired t test, p=0.77). Biological replicates (independent inductions): Control, N = 3; CHARGE, N = 3. (Right) Representative flow cytometric CD271 and CD57 profiles of control and CHARGE iPSC-NCCs. (D) Schematic presentation of the protocol for NCC differentiation from iPSCs through neuroepithelial spheres (Method B). (E) Representative phase-contrast images of control and CHARGE iPSC-NCCs. Bar: 500 μm. (F) (Left) Quantification of the ratio of the cell number of CD271 and CD57 double-positive cells per total induced cells calculated by flow cytometry. n.s., not significant (Unpaired t test, p=0.55). Biological replicates (independent inductions): Control, N = 6; CHARGE, N = 4. (Right) Representative flow cytometric CD271 and CD57 profiles of control and CHARGE iPSC-NCCs. (G) Expression of SOX10 and AP2a protein in control and CHARGE iPSC-NCCs. Bar: 50 μm. (H) Expression of OTX2 in control and CHARGE iPSC-NCCs. Bar: 50 μm. (I) Representative images of CHARGE iPSC-NCCs differentiated into adipocytes, chondrocytes, and osteocytes in vitro. Bars: adipocytes: 50 μm, chondrocytes: 1000 μm, osteocytes: 500 μm. (J) Representative images of CHARGE iPSC-NCCs differentiated into myofibroblasts and peripheral neurons in vitro. Bars: 50 μm. (K) Representative images of control and CHARGE iPSC-NCCs differentiated into chondrocytes by transplantation into the testes of NOD-SCID mice. Bars: 300 μm. The following file is available for Figure 2C and F, Figure 2—source data 1.
-
Figure 2—source data 1
Raw data and statistical data of Figure 2.
- https://doi.org/10.7554/eLife.21114.007
Figure 3 with 1 supplement
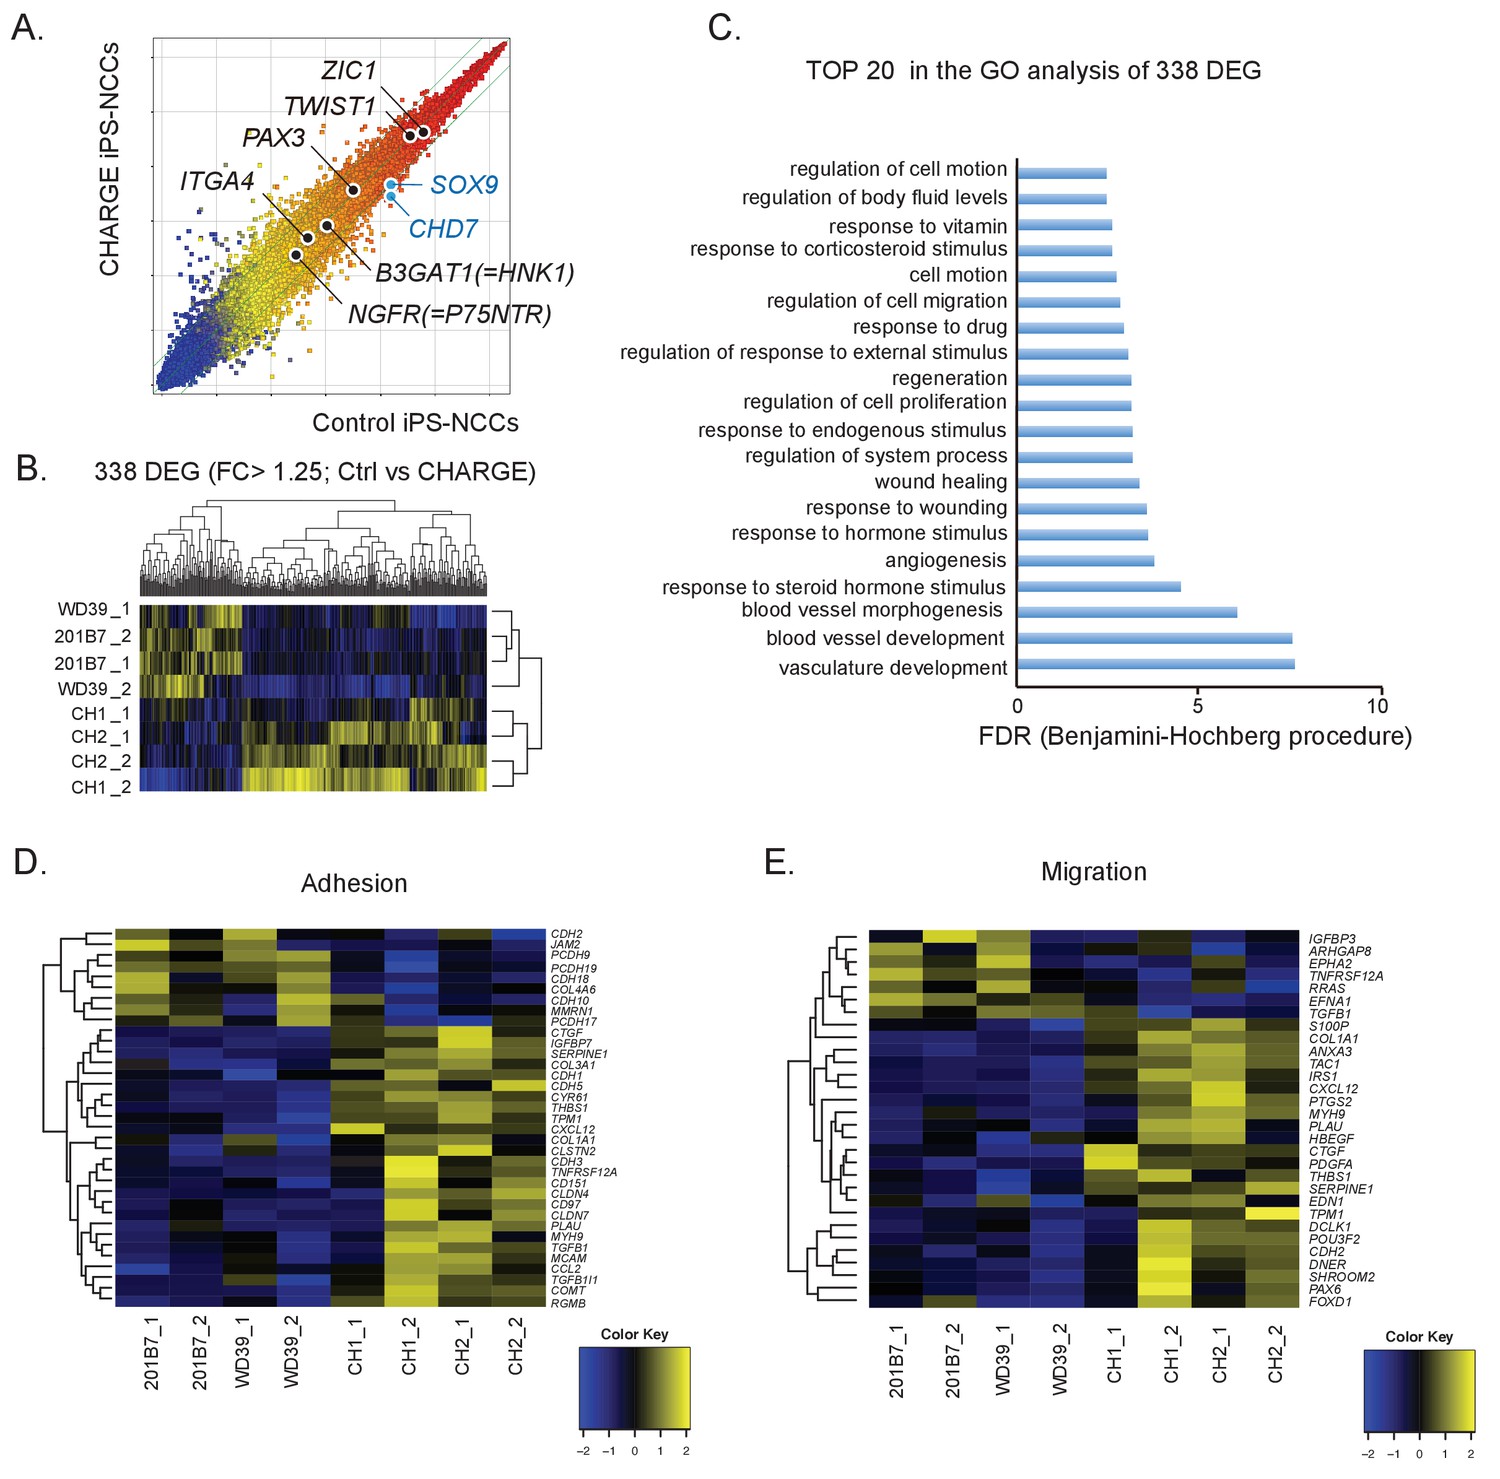
Comparative gene expression analysis suggests migration defects in CHARGE iPSC-NCCs.
(A) Scatter plot of control vs. CHARGE iPSC-NCCs obtained by Method B. Control: 201B7 iPSC-NCCs; CHARGE: CH2#16 iPSC-NCCs. (B) Hierarchical clustering of 338 differentially expressed genes (FC >1.25) between control and CHARGE iPSC-NCCs. The control lines consisted of 201B7 and WD39 iPSC-NCCs. The CHARGE lines consisted of CH1#25 (CH1) and CH2#16 (CH2). Each sample from the same line was prepared by independent NCC induction. (C) The top 20 list of the GO analysis of the 338 differentially expressed genes between control and CHARGE iPSC-NCCs. (D) Hierarchical clustering with 35 genes related to the GO term ‘adhesion.’ (E) Hierarchical clustering with 30 genes related to the GO term ‘migration.’ The following file is available for Figure 3, Figure 3—figure supplement 1 and Figure 3—figure supplement 1—source data 1.
Figure 3—figure supplement 1
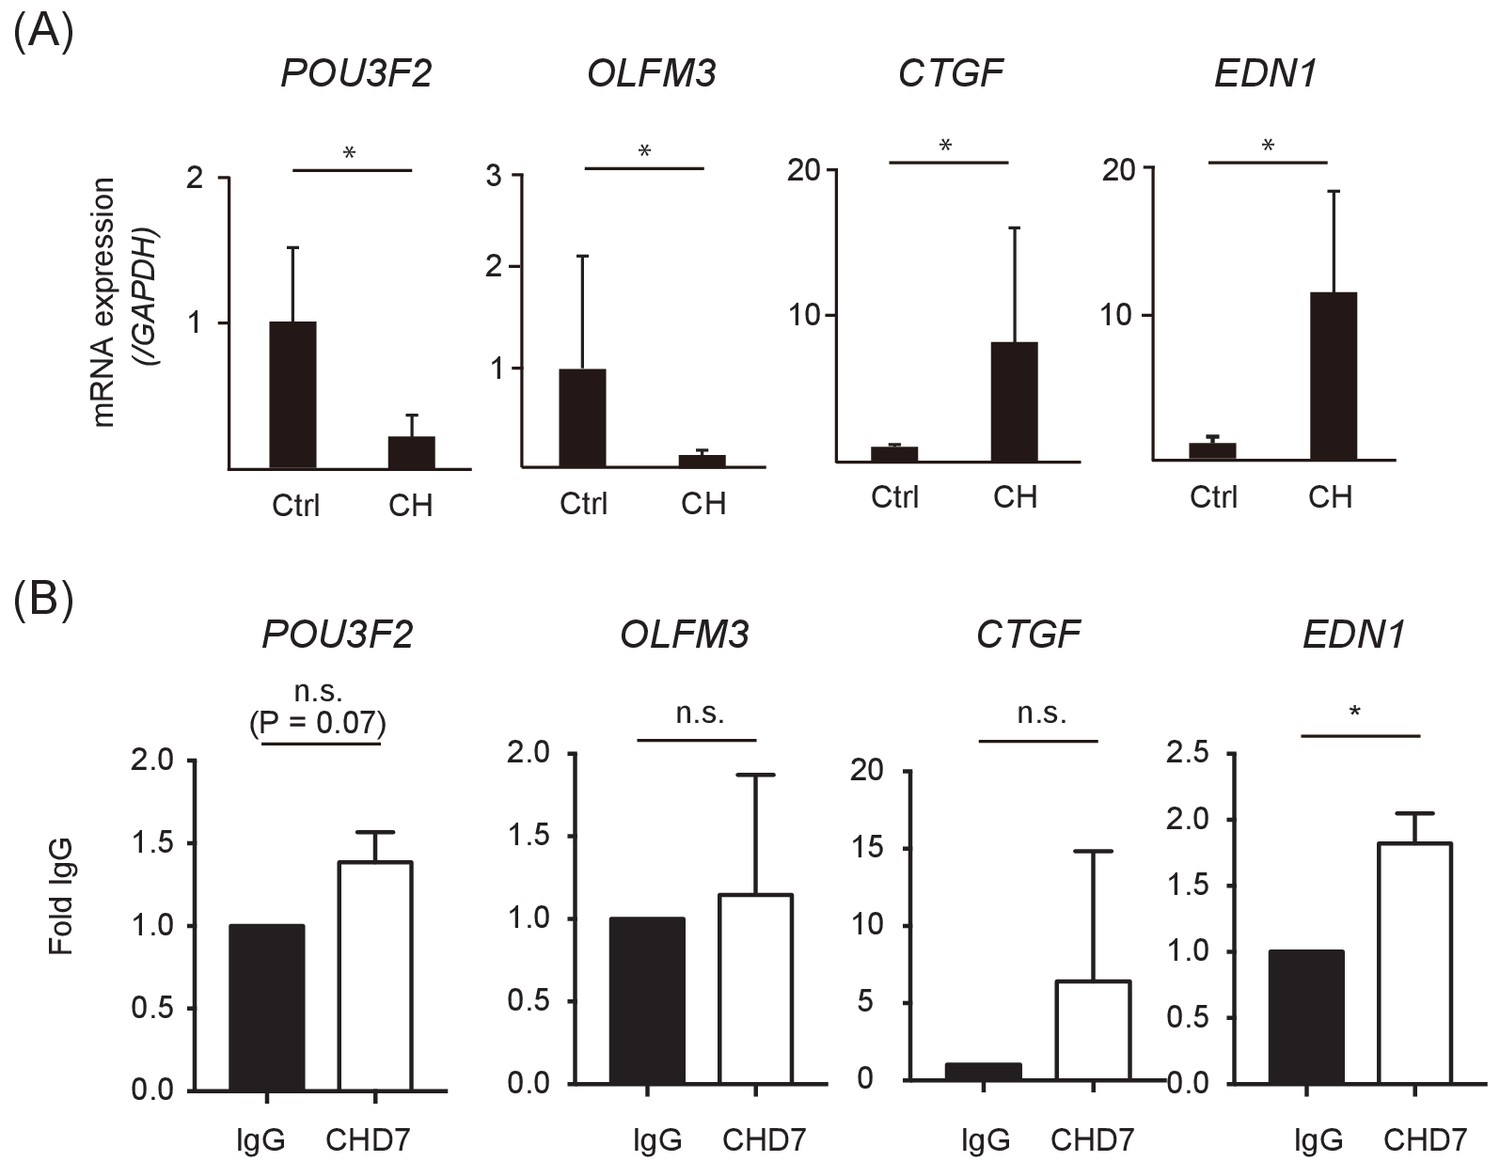
Examples of differentially expressed genes between control and CHARGE iPSC-NCCs.
(A) qRT-PCR analysis of control and CHARGE iPSC-NCCs. Ctrl: WD39, 201B7; CH: CH1#25, CH2#16. Error bars represent standard deviations from samples by four independent inductions per group (biological replicate). RT-PCR was performed using three replicates per sample (technical replicates). *p<0.05 (Mann-Whitney U test). (B) ChIP-qRT-PCR analysis for CHD7. The graph represents qPCR on DNA purified from ChIP-CHD7 of control (201B7) iPSC-NCCs, using distal enhancer primers for genes. The experiments were done by three independent exeriments (technical replicates). *p<0.05 (Mann-Whitney U test).
-
Figure 3—figure supplement 1—source data 1
Statistical data of Figure 3—figure supplement 1
Tab1: Statistical data of Figure 3—figure supplement 1A. Tab2: Statistical data of Figure 3—figure supplement 1B.
- https://doi.org/10.7554/eLife.21114.010
Figure 4 with 2 supplements
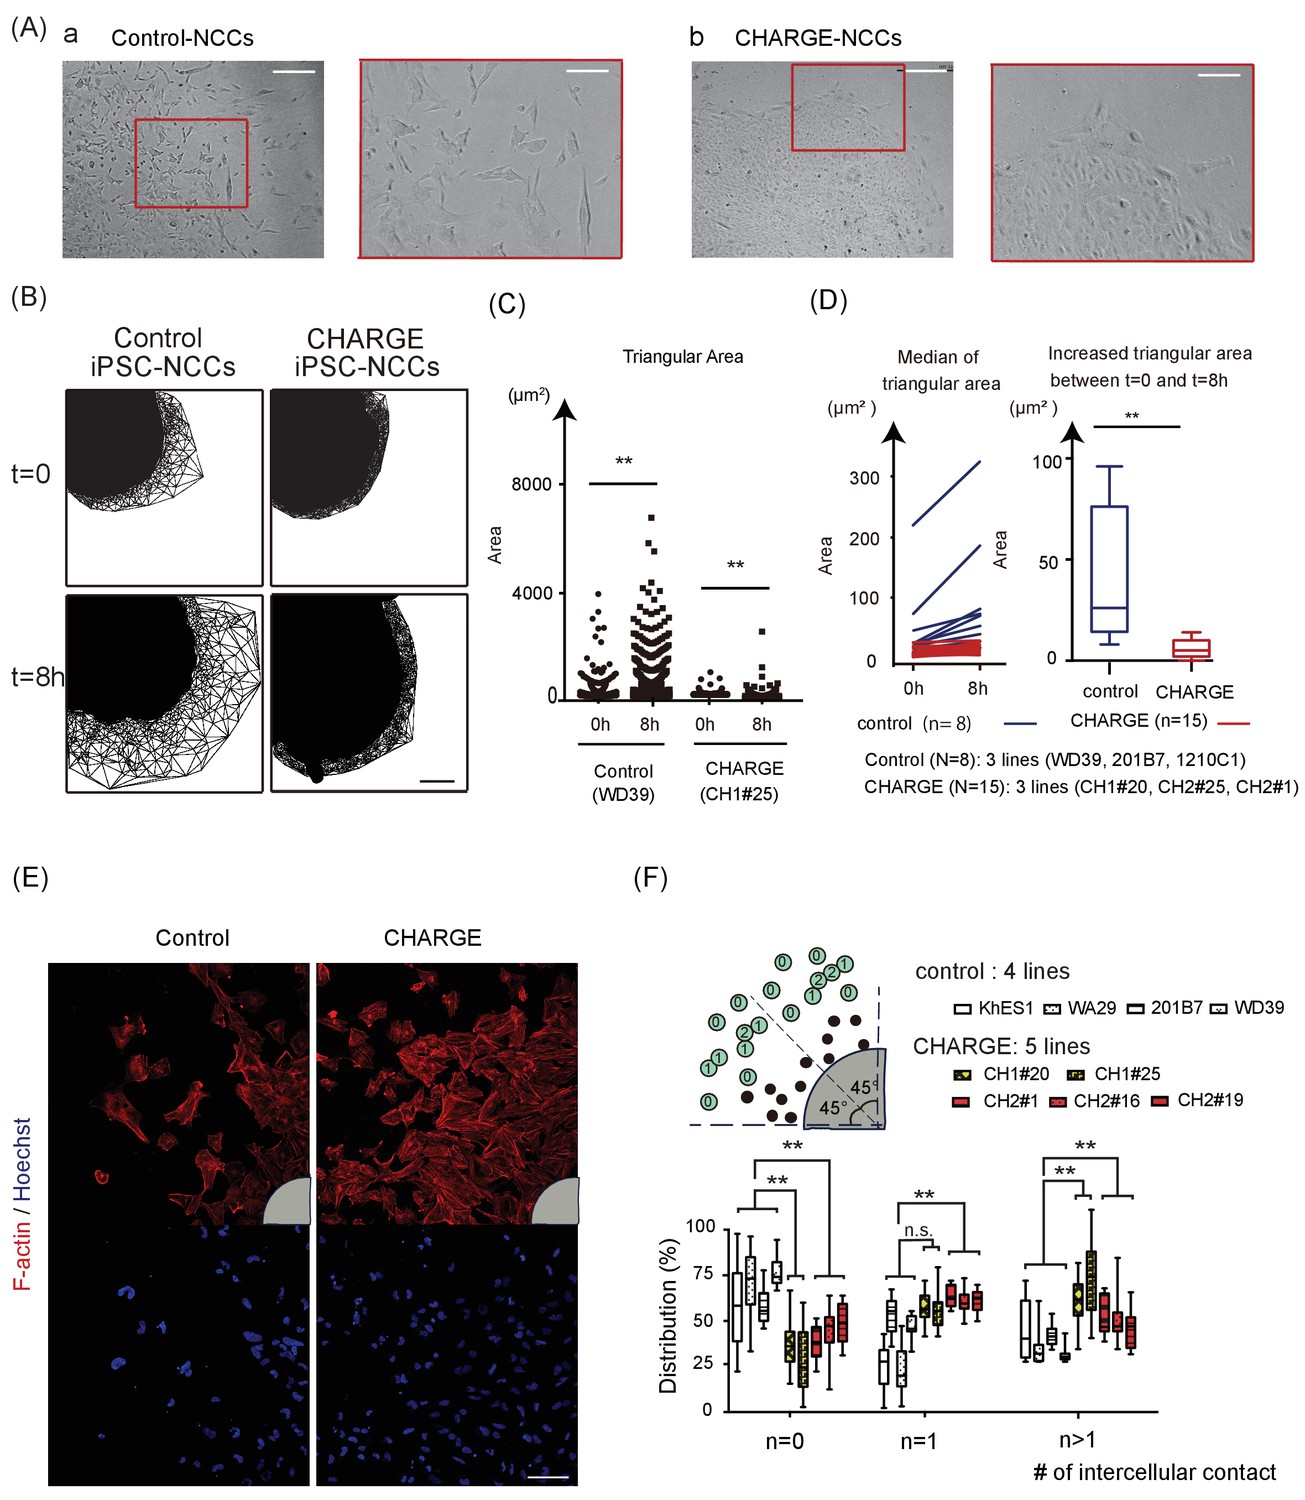
Defective Scattering of CHARGE iPSC-NCCs in vitro.
(A) Representative images of control and CHARGE iPSC-NCCs obtained by Method A. The control iPSC-NCCs residing at the outermost periphery began to scatter apart (Figure 4A–a). In contrast, the CHARGE iPSC-NCCs exhibited a distinct behavior in Phase 2, remaining closely associated with their neighbors (Figure 4A–b). The red square on the left corresponds to that on the right in both a and b. Bars (left in a and b): 250 μm. Bars (right in a and b): 100 μm. (B) Cell dispersion at t = 0, and t = 8 hr was analyzed using the Delaunay triangulation algorithm. Control: WD39; CHARGE: CH1#25. Bar:100 μm. (C) Dot plots represent the distribution of each triangular area shown in (B). (Left) Triangular area of the control iPSC-NCCs at t = 0 and t = 8 hr. **p<0.01 (Mann-Whitney U test, Cohen’s d 0.39). (Right) Triangular area of the CHARGE iPSC-NCCs at t = 0 and t = 8 hr. **p<0.01 (Mann-Whitney U test, Cohen’s d 0.03). (D) Blue bars represent for control iPSC-NCCs, and red bars represent for CHARGE iPSC-NCCs. (Left) Median of the triangular area of the control and CHARGE iPSC-NCCs at t = 0 and t = 8 hr. Control iPSC-NCCs, N = 8 (WD39, 201B7, 1201C1); CHARGE iPSC-NCCs, N = 15 (CH1#20, CH1#25, CH2#1). (Right) Box plots showing the increased median value of the triangular area from t = 0 to t = 8 hr. **p<0.01 (Mann-Whitney U test, Cohen’s d 1.66). (E) Representative images of iPSCs-NCCs at the outermost periphery visualized with F-actin and nuclear staining. Bar: 100 μm. Gray quarter circles show the postion of each sphere. (F) The outermost nine cells (green circle) in each of the eight 45 degree-sector of a sphere were scored by counting the number of their contacting-neighboring cells. The number in a green circle represents the score. The box plots show the distribution of the number of intercellular contacts among the outermost migrating cells in each line. Biological replicates: control, 15 inductions (KhES1, 3; WD39, 3; 201B7, 5; WA29, 4); CH1, 7 inductions (CH1#20, 3; CH1#25, 4); CH2, 12 inductions (CH2#1, 4; CH2#16, 3; CH2#19, 5). Number of cells scored: control, 3707 cells (KhES1, 1017 cells; WD39, 1197 cells; 201B7, 657 cells; WA29, 836 cells); CH1, 3600 cells (CH1#20, 1989 cells; CH1#25, 1611 cells); CH2, 3213 cells (CH2#1, 738 cells; CH2#16, 1791 cells; CH2#19, 684 cells). n = 0; **p<0.01 (Dunnett’s multiple comparisons test; Cohen’s d 2.67 (control vs CH1), Cohen’s d 1.93 [control vs CH2]). n = 1; n.s.; not significant, **p<0.01 (Dunn’s multiple comparisons test; Cohen’s d (control vs CH1) 1.02, Cohen’s d 1.71 [control vs CH2]. n > 1; **p<0.01 (Dunnett’s multiple comparisons test; Cohen’s d 2.88 (control vs CH1), Cohen’s d 1.54 [control vs CH2]). The following file is available for Figure 4, Figure 4—video 1 and 2, Figure 4—source data 1.
-
Figure 4—source data 1
Raw data and statistical data of Figure 4.
Tab 1: Statistical data of Figure 4C. a. Statistical data of Figure 4C (left). Control (WD39): t = 0 vs t = 8 hr. b. Statistical data of Figure 4C (right). CHARGE (CH1#25): t = 0 vs t = 8 hr. c. Statistical data of Figure 4C (left and right). Tab 2: Statistical data of Figure 4D. Tab 3: Statistical data of Figure 4F. Tab 4: Raw data of Figure 4F. N: the number of neighbouring cells attached with the nine outermost cells in each of the eight 45 degree-sector of a sphere. White columns show the number of N = 0, 1, or >1 cells per sphere.
- https://doi.org/10.7554/eLife.21114.012
Figure 4—video 1
Time-lapse movies of attached control and CHARGE iPSCs-NCCs.
Representative images of control and CHARGE iPSC-NCCs scattering from an attached sphere on day16. Figure 4—video 1: control (WD39). Figure 4—video 2: CHARGE(CH1#25). Bar: 100 μm; time interval: 10 min/frame, 5 frames/sec; total, 151 and 185 frames in Figure 4—video 1 and 2, respectively.
Figure 4—video 2
Time-lapse movies of attached control and CHARGE iPSCs-NCCs.
Representative images of control and CHARGE iPSC-NCCs scattering from an attached sphere on day16. Figure 4—video 1: control (WD39). Figure 4—video 2: CHARGE(CH1#25). Bar: 100 μm; time interval: 10 min/frame, 5 frames/sec; total, 151 and 185 frames in Figure 4—video 1 and 2, respectively.
Figure 5 with 1 supplement
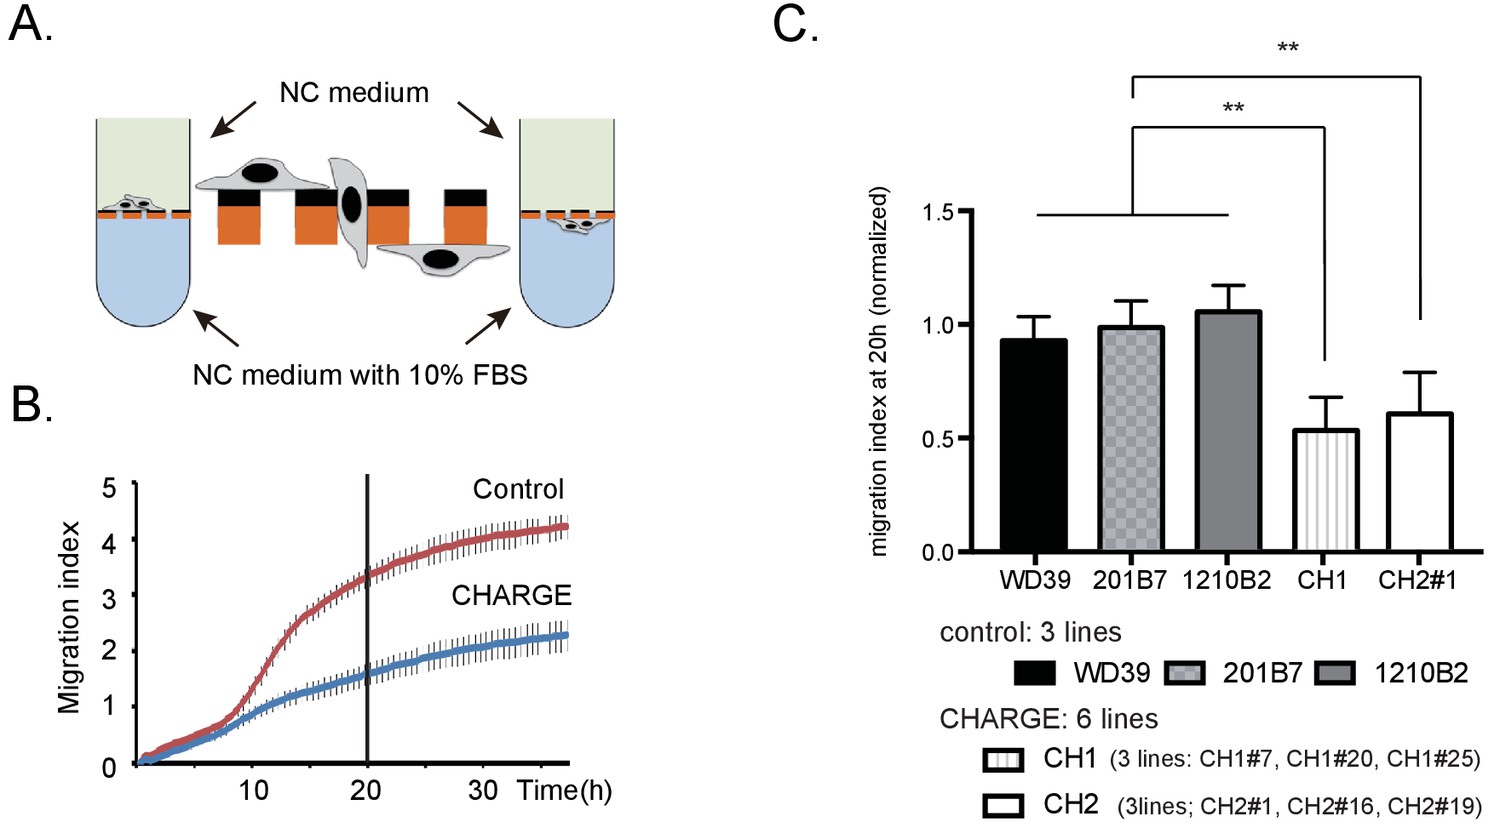
Migratory disabilities of CHARGE iPSC-NCCs.
(A) xCELLigence. The migration index of iPSC-NCCs was measured using xCELLigence, by which migrating cells through microelectrode sensors were monitored automatically. (B) Representative curve of control (WD39; red) and CHARGE (CH2#1; blue) iPSC-NCCs migration index during 36 hr. Bar: SD. (C) Quantitative analysis of migration index after 20 hr of monitoring with xCELLigence, normalized to the control iPSC-NCCs migration index. Bar: SD. Biological replicates (the number of independent NCC inductions): control, N = 20 (WD39, N = 8; 201B7, N = 7; 1210B2, N = 5); CH1, N = 6 (CH1#7, N = 1, CH1#20, N = 1; CH1#25, N = 4); CH2, N = 11 (CH2#1, N = 5; CH2#16, N = 5; CH2#19, N = 1). Technical replicates: 2–4 per experiment. **p<0.01 (Turkey’s multiple comparisons test): The following file is available for Figure 5, Figure 5—figure supplement 1, Figure 5—source data 1.
-
Figure 5—source data 1
Raw data of xCelligence assay of iPSC-NCCs in vitro.
Tabs 'Experiment 1' - 'Experiment 13': Raw data of migration indexes in each experiment. Each table in a sheet shows an independent experiment. Orange column shows migration index at 20 hr, and is used for quantitative analysis in Figure 5C. Tab 1: Statistical data of Figure 5C. Quantitative analysis of migration index after 20 hr of monitoring with xCELLigence, normalized to the control iPSC-NCCs migration index. Tab 2: Raw data and statistical data of Figure 5—figure supplement 1A. Control iPSC-NCCs migration index upon treatment with aphidicolin or vehicle for 36 hr. Tab 3: Raw data and statistical data of Figure 5—figure supplement 1B. BrdU assay of control and CHARGE iPSC-NCCs at 24 hr after replating. Tab 4: Raw data and statistical data of Figure 5—figure supplement 1C. Cell adhesion assay of control and CHARGE iPSC-NCCs to fibronectin.
- https://doi.org/10.7554/eLife.21114.017
Figure 5—figure supplement 1
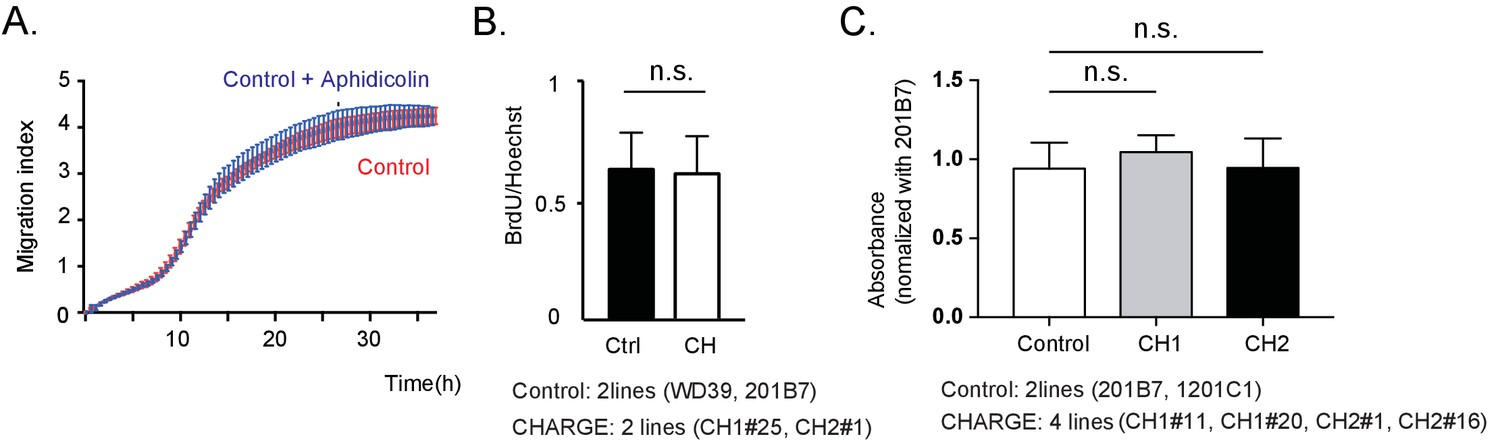
Control and CHARGE iPSC-NCCs exhibit similar proliferation and adhesion.
(A) Representative curves of control iPSC-NCCs migration index upon treatment with aphidicolin (10 μg/ml) or vehicle (DMSO) for 36 hr. No significant difference was observed. (p=0.66; Two-way repeated measure ANOVA). Technical replicates: 4. Bar: SD. (B) BrdU assay of control and CHARGE iPSC-NCCs at 24 hr after replating. No significant difference between the control and CHARGE iPSC-NCCs was observed (p=0.86; Unpaired t test, Cohen’s d 0.12). Biological replicates (the number of independent NCC inductions): control, N = 5 (WD39, N = 3; 201B7, N = 2); CH1, N = 2 (CH1#25, N = 2); CH2, N = 2 (CH2#1, N = 2). Number of cells counted: control, N = 3244 (WD39, N = 2675; 201B7, N = 569); CH1 (CH1#25, N = 647); CH2 (CH2#1, N = 931). Graphs display the mean ± SD. (C) Cell adhesion assay of control and CHARGE iPSC-NCCs onto fibronectin. Each type of iPSC-NCC was cultured to semi-confluence in NC medium and was then replated (1 × 10⁵ cells per ml) with WST-1 and incubated for 90 min. The absorbance of each well was measured and normalized to that of 201B7 iPSC-NCCs in each experiment. Bar: SD., Biological replicates: control (201B7, 1201C1), N = 6; CH1 (CH1#11, CH1#20), N = 3; CH2 (CH2#1, CH2#16), N = 10. Technical replicates: 4–6 per experiment., n.s., not significant (p=0.35 (Control vs CH1), p=0.99 (Control vs CH2); Dunnett’s multiple comparisons test).
Figure 6 with 1 supplement
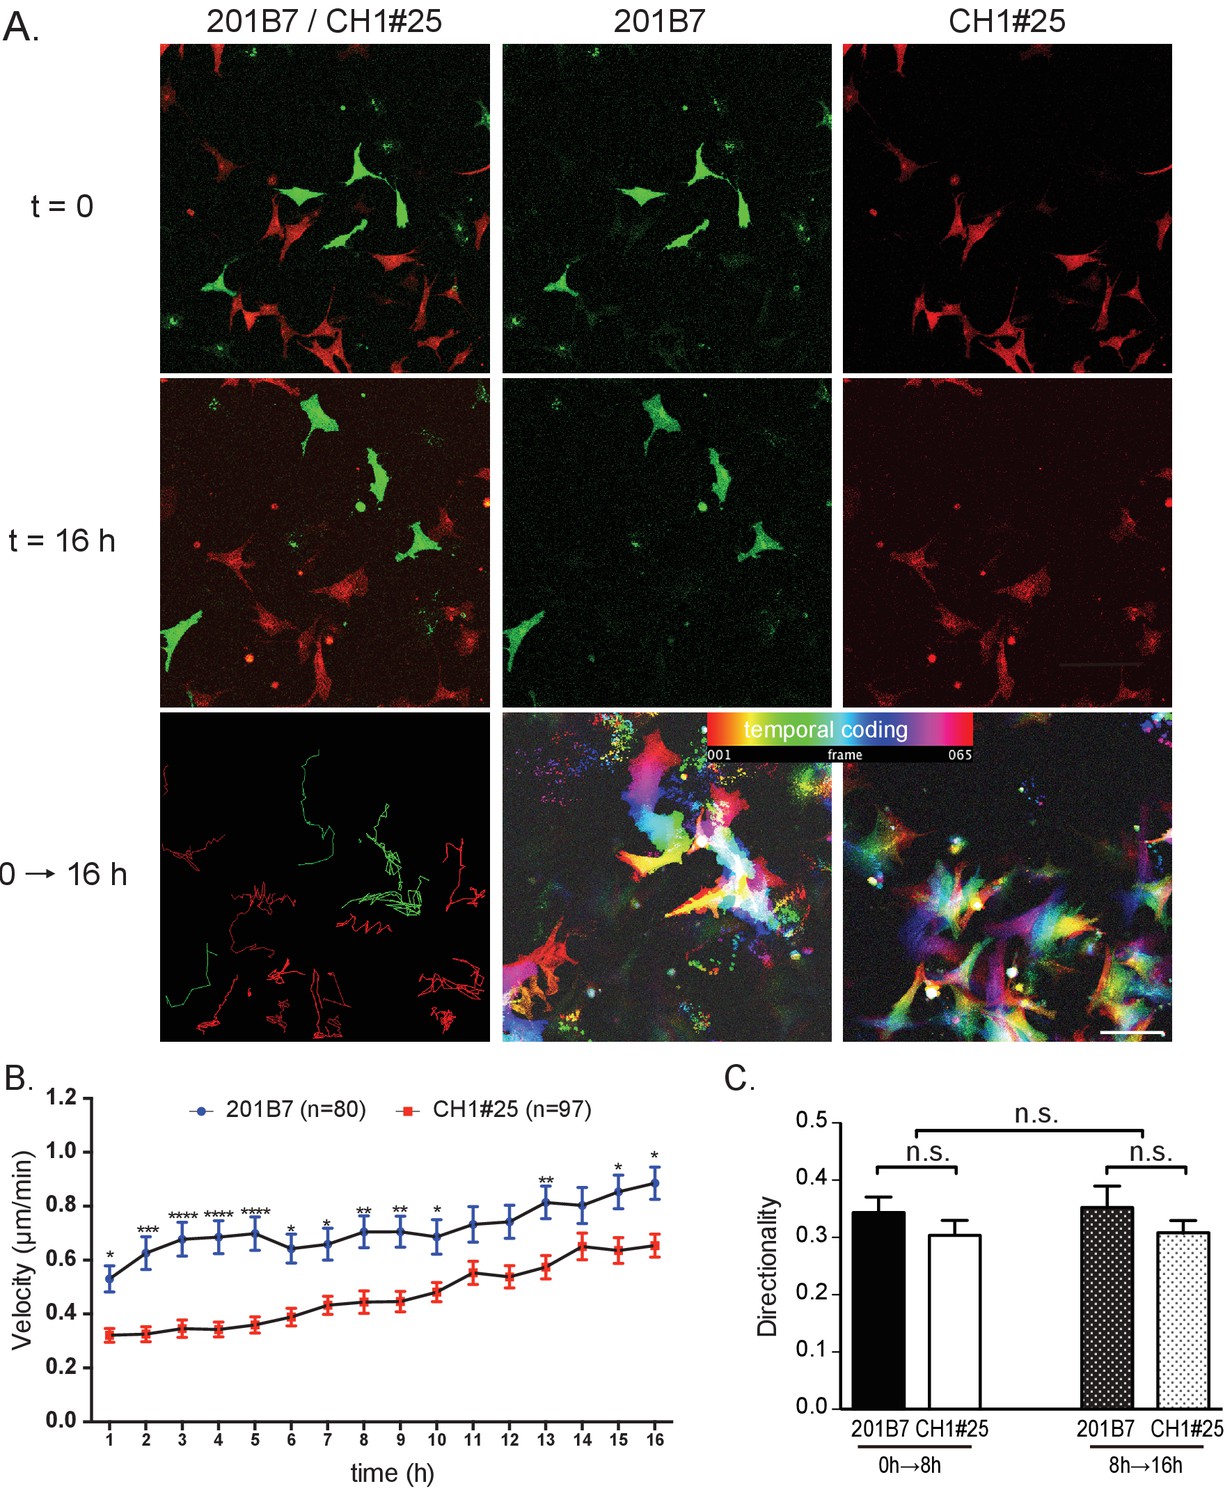
Single cell motility analysis of iPSC-NCCs in vitro.
(A) Representative images of migratory 201B7 (control; green) and CH1#25 (CHARGE; red) iPSC-NCCs at 0 hr and 16 hr, along with a combined view. Bar: 50 μm. (B) Average velocities of migratory iPSC-NCCs were assessed by tracking control and CHARGE iPSC-NCCs for 16 hr. Number of cells tracked: 201B7, 89 cells tracked; CH1#25, 124 cells tracked. *p<0.05, **p<0.01, ***p<0.001 (Sidak’s multiple comparisons tests). (C) Quantitative analysis of the directionality of migratory iPSC-NCCs tracked in (B). n.s., not significant (Tukey's multiple comparisons test). Bars in (B) and (C) display the mean ± SEM. The following file is available for Figure 6, Figure 6—source data 1, Figure 6—figure supplement 1, Figure 6—figure supplement 1—source data 1.
-
Figure 6—source data 1
Raw data and statistical data of Figure 6
Tab 1: Statistical data of Figure 6B. Average velocities of migratory iPSC-NCCs assessed by tracking control and CHARGE iPSC-NCCs for 16 hr. Tab 2: Raw data of single cell motility analysis of iPSCs-NCCs in vitro. Quantitative analysis in Figure 6B was calculated using the data below. Tab 3: Statistical data of Figure 6C. Tab 4: Raw data of single cell motility analysis of iPSCs-NCCs in vitro. Quantitative analysis in Figure 6C was calculated using the data below.
- https://doi.org/10.7554/eLife.21114.021
Figure 6—figure supplement 1
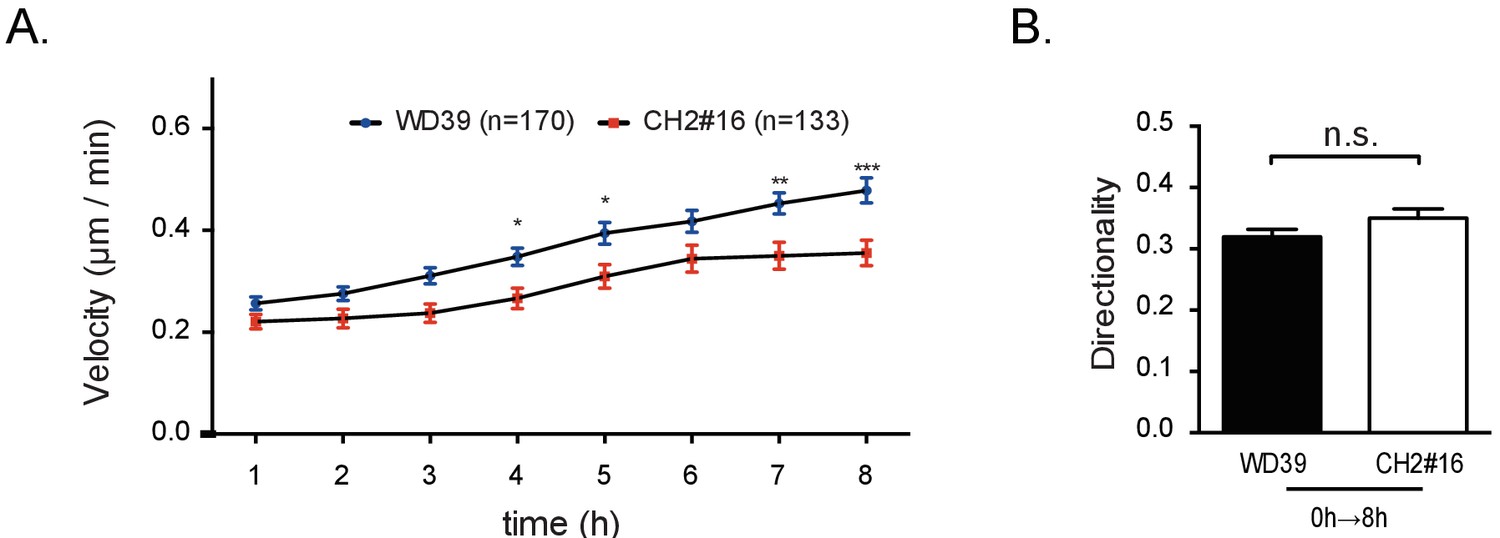
Single-cell motility analysis of iPSC-NCCs using other control and CHARGE iPSC-NCC lines.
Number of cells tracked: WD39 (control), 170 cells tracked; CH2#16 (CHARGE), 133 cells tracked. (A) Migratory velocities of control and CHARGE iPSC-NCCs. *p<0.05, **p<0.01, ***p<0.001 (Sidak's multiple comparisons test: pTime < 0.001, pCellType < 0.001). (B) Quantitative analysis of migratory iPSC-NCC directionality. Bars in (B) and (C) display the mean ± SEM. n.s.: not significant (Mann-Whitney U test, p=0.12; Cohen’s d 0.17).
-
Figure 6—figure supplement 1—source data 1
Raw data and statistical data of Figure 6—figure supplement 1.
Tab 1: Statistical data of Figure 6—figure supplement 1A. Average velocities of migratory iPSC-NCCs assessed by tracking control and CHARGE iPSC-NCCs over 16 hr. Tab 2: Raw data of single cell motility analysis of iPSCs-NCCs in vitro. Quantitative analysis in Figure 6—figure supplement 1A was calculated using the data below. Tab 3: Statistical data of Figure 6—figure supplement 1B. Quantitative analysis of the directionality of migratory iPSC-NCCs tracked. Tab 4: Raw data of single cell motility analysis of iPSCs-NCCs in vitro. Quantitative analysis in Figure 6—figure supplement 1B was calculated using the data below.
- https://doi.org/10.7554/eLife.21114.020
Figure 7 with 2 supplements
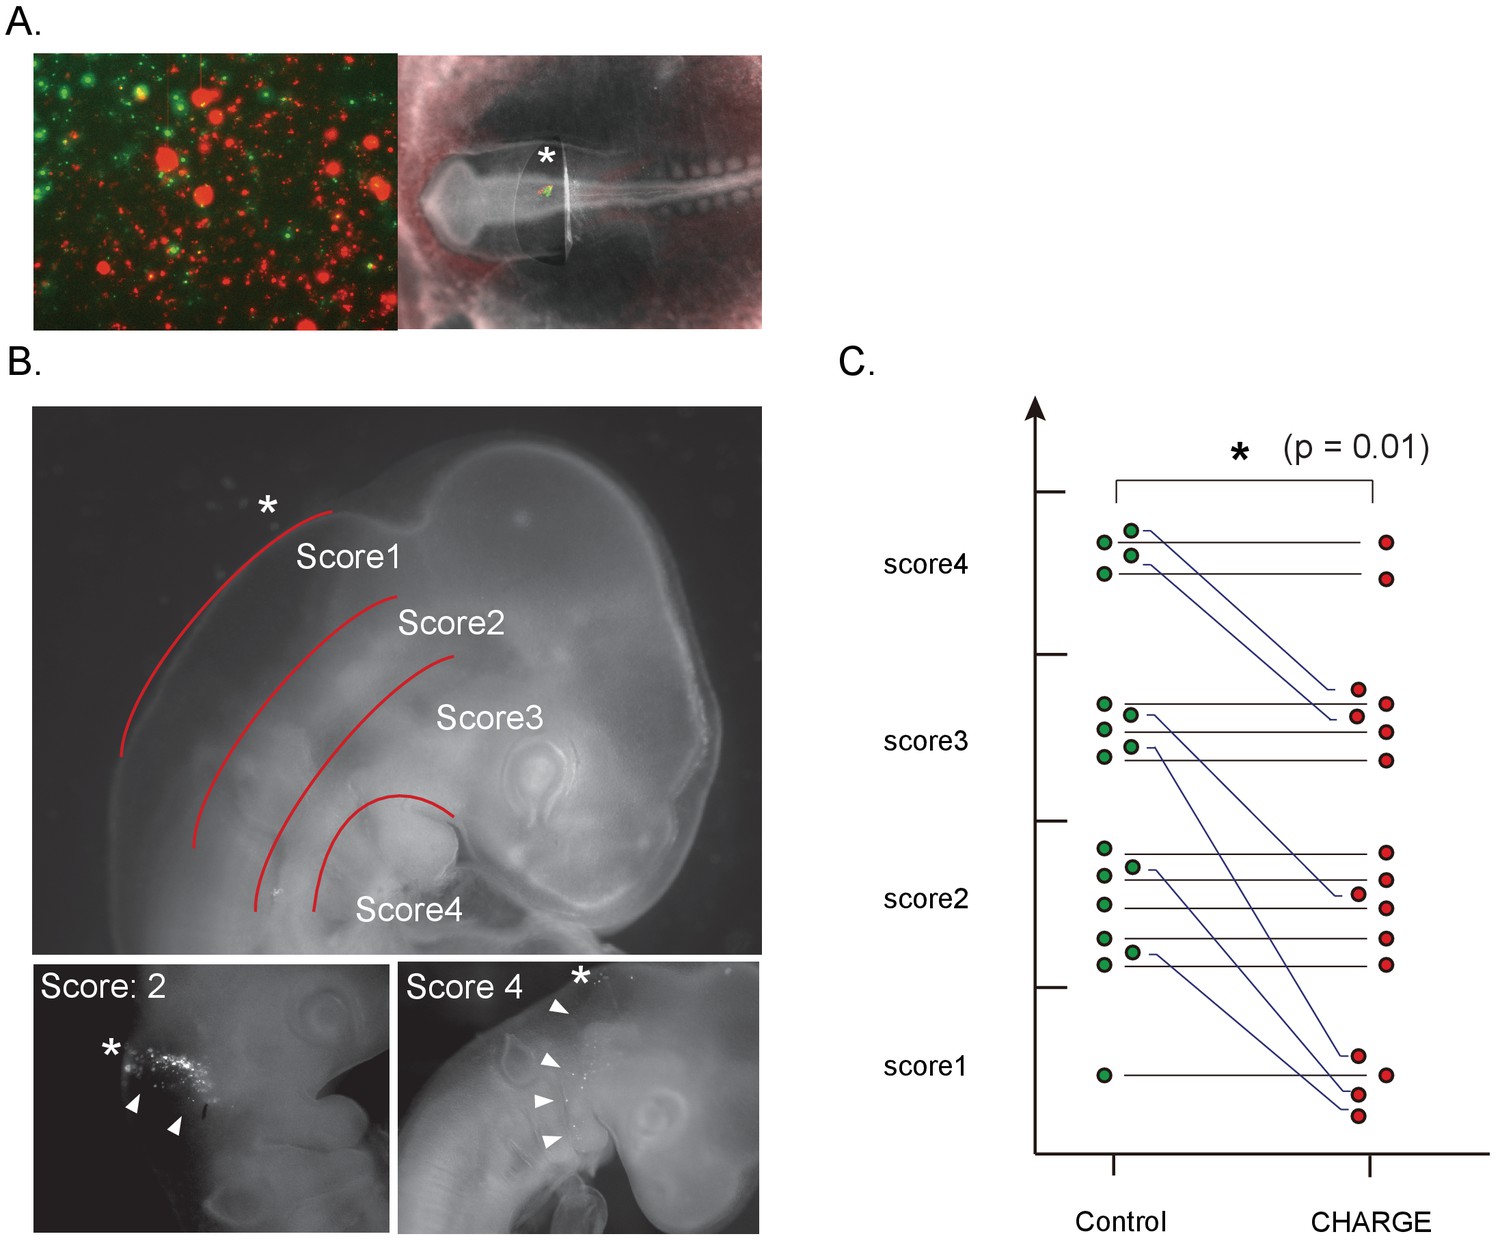
Defective migration of CHARGE iPSC-NCCs in chick embryos.
(A) (Left) Representative image of in vitro control and CHARGE iPSC-NCCs that were prestained with Vybrant DiI and DiO, respectively. (Right) Representative image of chick embryo at the HH 8–10 stage in which iPSC-NCCs were injected around the hindbrain. (B) (Upper) Scoring of migration in transplanted chick embryos: Score I, dorsal side of otic cyst; Score II, around otic cyst; Score III, from ventral side of otic cyst to dorsal side of pharyngeal arch; Score IV, migrated into pharyngeal arches. (Lower-left panel) Example of chick embryos with a score of II. (Lower-right panel) Example of chick embryos with a score of IV. The asterisks in the panels of B indicate the NCC transplantation sites. (C) Graph of transplanted chick embryo scores; cells transplanted into the same embryo were connected with a line. **p<0.01 (Wilcoxon signed-rank test). The following file is available for Figure 7, Figure 7—figure supplement 1, Figure 7—video 1 and Figure 7—figure supplement 1—source data 1.
-
Figure 7—source data 1
A list of transplanted cells and scores.
Tab 1: A list of transplanted cells and scores. Detais of the graph in Figure 7C. Transplanted control and CHARGE cells were stained with Vybrant DiI or DiO. We transplanted iPSC-NCCs into 93 embryos (HH8-10) in total, and 17 surviving embryoswere analyzed in this assay. Comparison of the maximum distance of Ctrl and CH shows that control cells migrated a greater distance from the site of transplant in some embryos evenly scored.
- https://doi.org/10.7554/eLife.21114.025
Figure 7—figure supplement 1
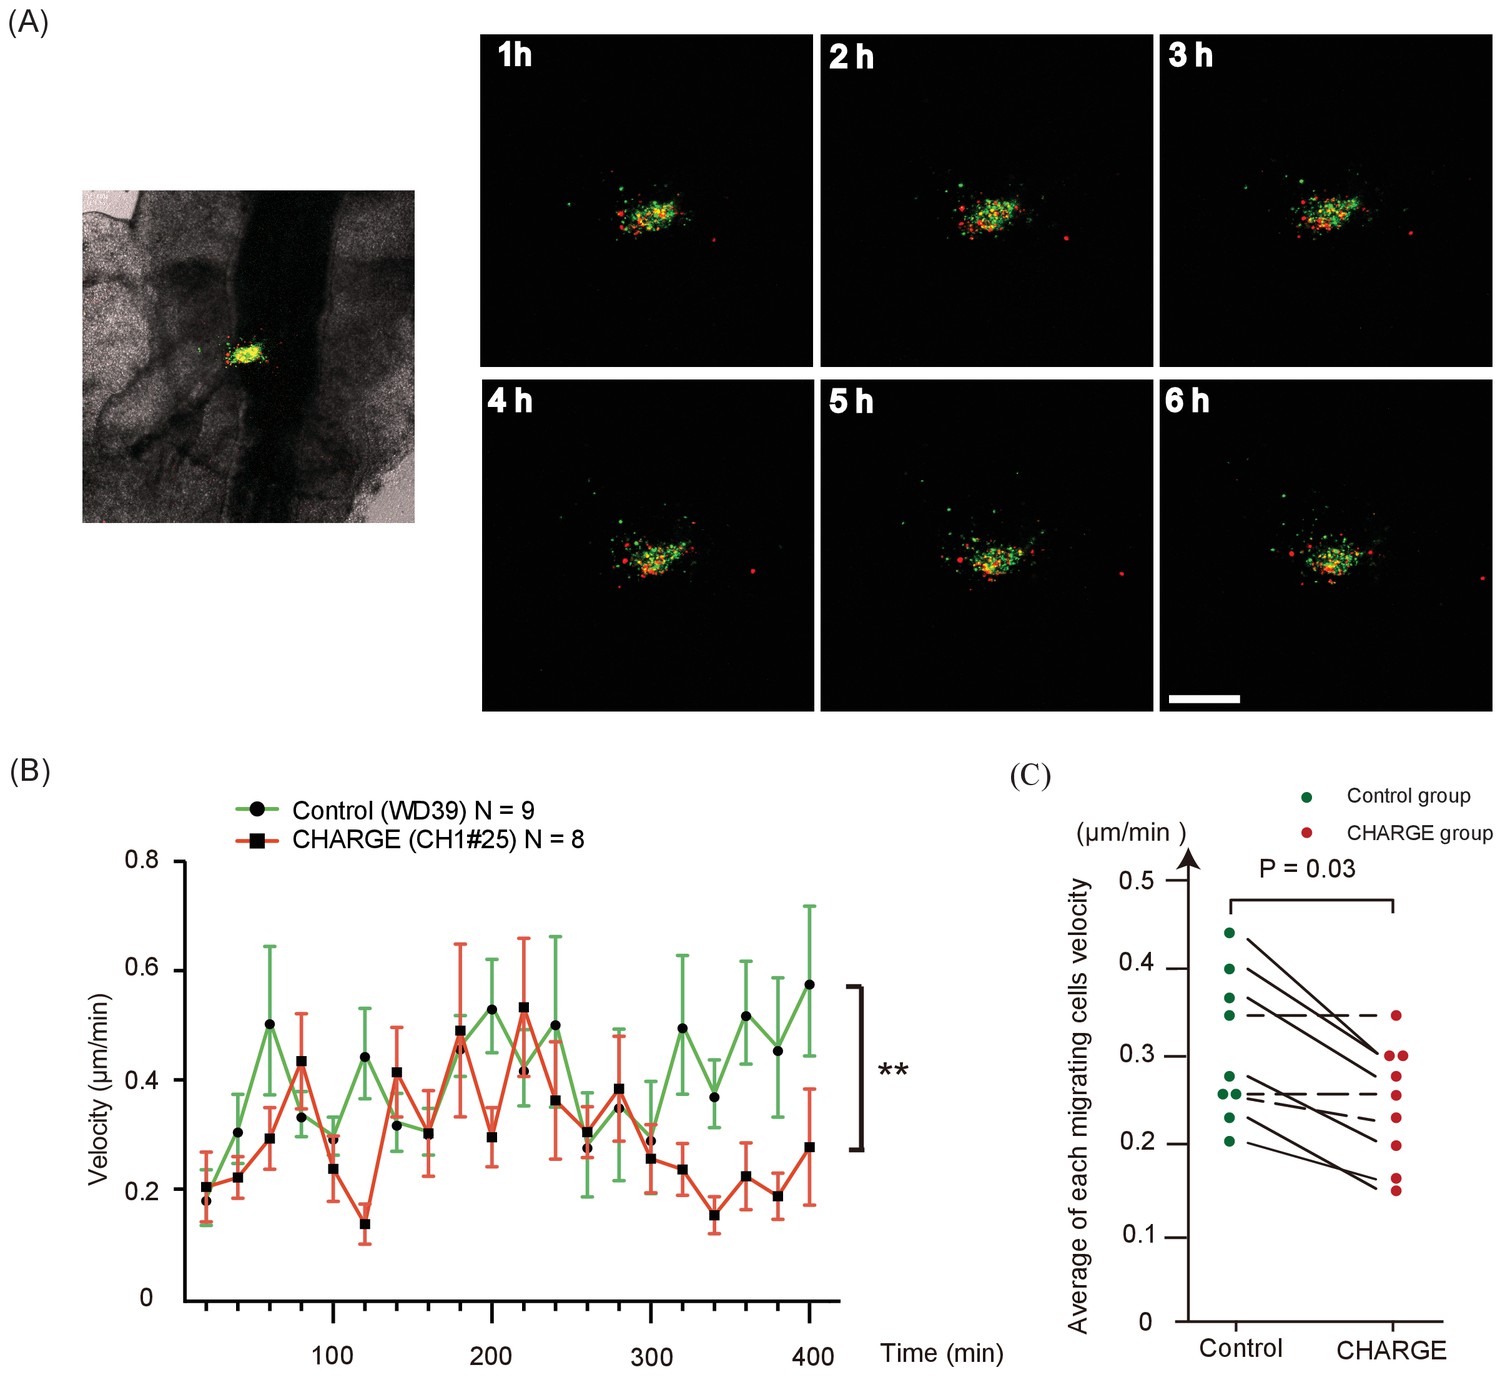
Time-lapse analysis of transplanted NCCs in chick embryos.
(A) Time-lapse images of transplanted cells stained with Vybrant DiO (control iPSC-NCCs) and Vybrant DiI (CHARGE iPSC-NCCs) in an HH stage 8–10 chick embryo (embryo #2). Bar: 100 μm. (B) Average velocities of migratory transplanted cells were assessed by tracking control (green), and CHARGE (red) cells for 400 min in the embryo. The graph shows the cell velocities in the embryo #2 (number of tracked cells: control (WD39; green), n = 9; CHARGE (CH1#25; red), n = 8). **p<0.01 (two-way ANOVA). (C) Graph of the average of each migrating cell velocity in a chick embryo. Solid lines show a significant difference between the velocity of control and CHARGE iPSC-NCCs. Dotted lines show no significant difference between the control and CHARGE iPSC-NCCs. Green circles represent control iPSC-NCCs, and red circles represent CHARGE iPSC-NCCs. p=0.03 (Wilcoxon signed-rank test).
-
Figure 7—figure supplement 1—source data 1
Raw data of Figure 7—figure supplement 1
Tab 1: Raw data of Figure 7—figure supplement 1. In all, 4–14 cells per cell line were tracked for 6–7 hr as migrating cells in each experiment. Velocity was calculated at each time point and analyzed statistically by two-way ANOVA.Velocity of migrating cells: Control > CHARGE (p=0.03; Wilcoxon signed-rank test). Tabs, 'embryo #1' - 'embryo #9': Raw data of control and CHARGE cell velocities tranplanted in each embryo. The cell velocities of individual cells were calculated by manual tracking using the Manual Tracking plugin of the Fiji software.
- https://doi.org/10.7554/eLife.21114.024
Figure 7—video 1
A time-lapse movie of transplanted NCCs in chick embryos.
A time-lapse image of transplanted cells stained with Vybrant DiO (control iPSC-NCCs, green) and Vybrant DiI (CHARGE iPSC-NCCs, red) in an HH stage 8–10 chick embryo (embryo #2). Bar: 100 μm; time interval: 20 min/frame, three frames/sec; total, 18 frames.
Figure 8

Model summarizing defective migration of CHARGE NCCs using patient-derived iPSCs.
Defects in cell delamination, migration, and motility in our model reflect phenotypes in CHARGE syndrome that develop in utero. Various aspects of NCC migration were not well coordinated in CHARGE NCCs due to the dysfunction of CHD7.
Author response image 1
Author response image 2

The results of flow cytometric analysis of control and CHARGE iPSC-NCCs from method-B (control; red line, CHARGE; blue line).
Isotype controls were used as negative controls (black line).
Additional files
-
Transparent reporting form
- https://doi.org/10.7554/eLife.21114.028
Download links
A two-part list of links to download the article, or parts of the article, in various formats.
Downloads (link to download the article as PDF)
Open citations (links to open the citations from this article in various online reference manager services)
Cite this article (links to download the citations from this article in formats compatible with various reference manager tools)
CHARGE syndrome modeling using patient-iPSCs reveals defective migration of neural crest cells harboring CHD7 mutations
eLife 6:e21114.
https://doi.org/10.7554/eLife.21114


