Elucidation of a four-site allosteric network in fibroblast growth factor receptor tyrosine kinases
- New York University School of Medicine, United States
- New York University, United States
- Wenzhou Medical University, China
- New York Structural Biology Center, United States
Figures
Figure 1
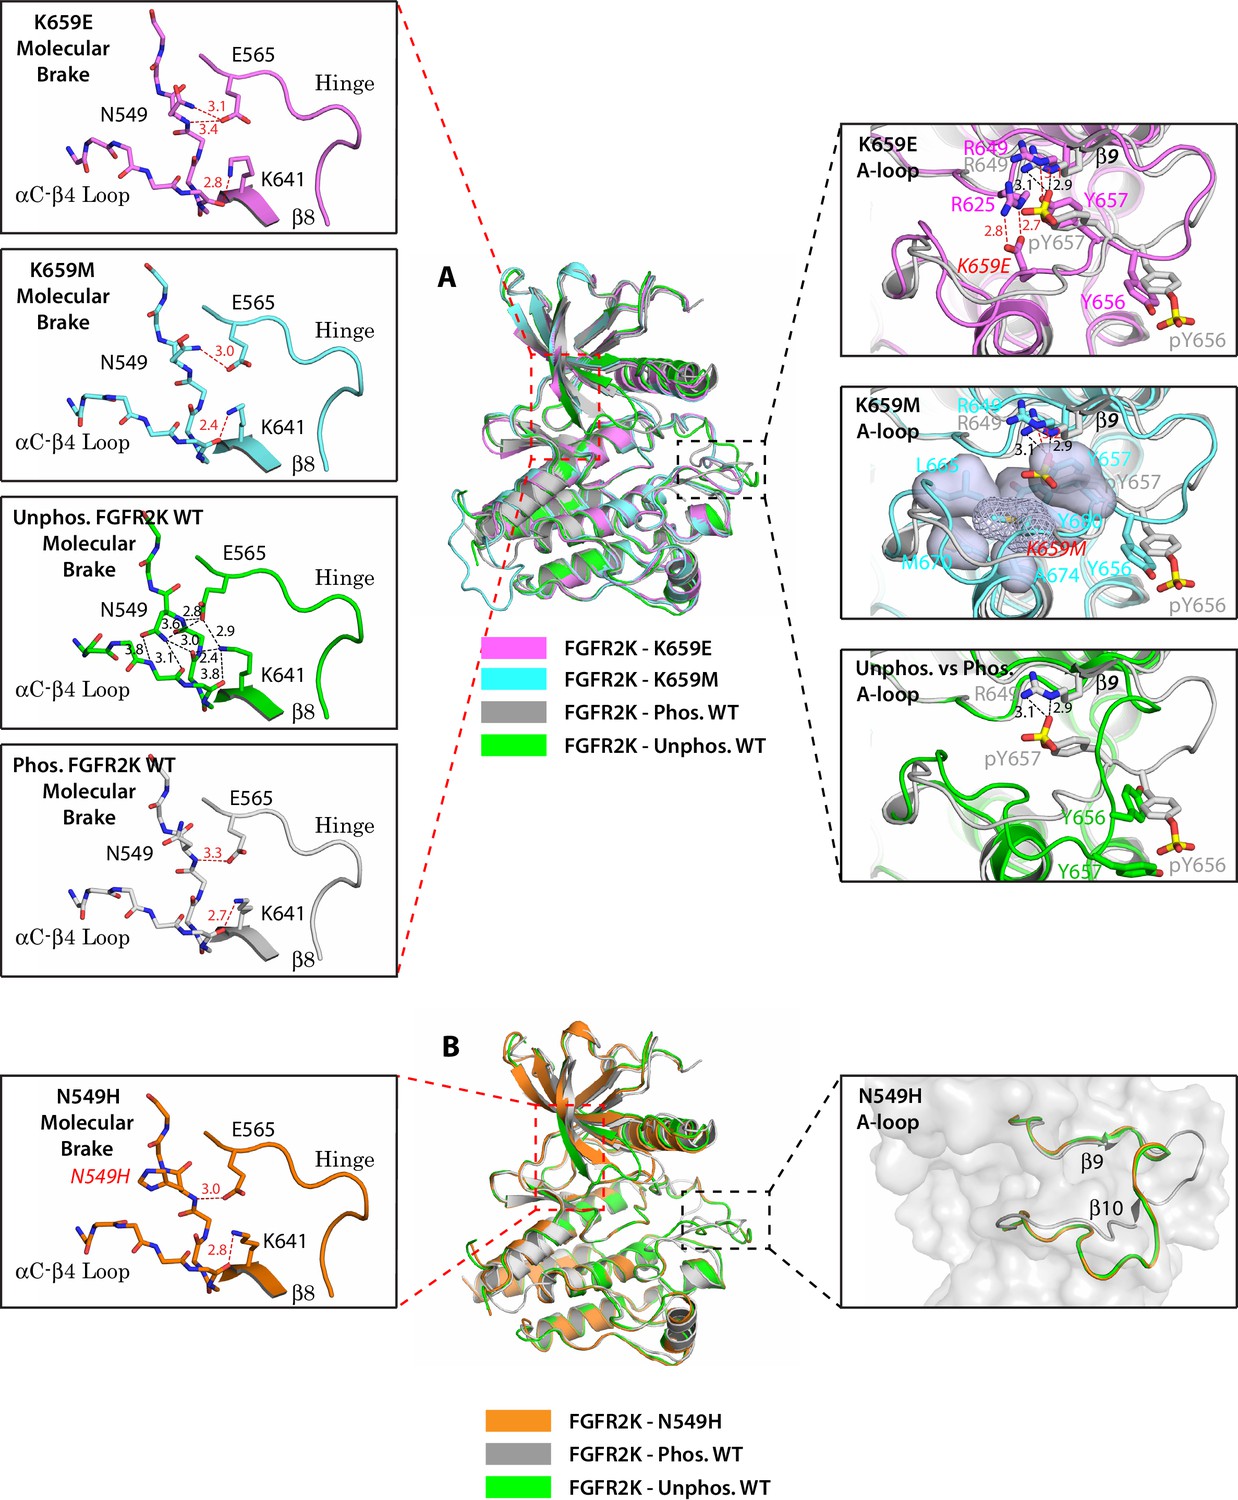
Single mutations at the A-loop cause disengagement of the molecular brake while single mutations at the molecular brake constituents are unable to drive the A-loop to the active conformation.
(A) Overlays of crystal structures corresponding to unphosphorylated K659E FGFR2K (PDB ID: 4J97 [Chen et al., 2013], in magenta), unphosphorylated K659M FGFR2K (PDB ID: 4J96 [Chen et al., 2013], in cyan), unphosphorylated WT FGFR2K (PDB ID: 2PSQ [Chen et al., 2007], in green) and the A-loop phosphorylated WT FGFR2K (PDB ID: 2PVF [Chen et al., 2007], in grey). The insets to the left of the panel display close-up views of the molecular brake regions of each of the four superimposed crystal structures. The insets to the right show close-up views of the A-loops of K659E (upper inset), K659M (middle inset) and the unphosphorylated WT FGFR2K (lower inset) compared with that of the A-loop phosphorylated WT FGFR2K. The three hydrogen bonds introduced by the K659E mutation that support the active conformation of the A-loop are shown as red dashed lines. The hydrophobic interactions introduced by the K659M mutation are represented by semitransparent surfaces, and the hydrogen bonds between Y657 and R649 are shown as red dashed lines. (B) Crystal structure of the unphosphorylated N549H mutant of FGFR2K (PDB ID: 2PWL [Chen et al., 2007], in orange) superimposed onto those of the unphosphorylated WT FGFR2K (PDB ID: 2PSQ [Chen et al., 2007], in dark green) and the A-loop phosphorylated WT FGFR2K (PDB ID: 2PVF [Chen et al., 2007], in grey). The inset to the left shows a close-up view of the molecular brake region of the N549H mutant. The inset to the right shows a close-up view of the three superimposed A-loop conformations. Note that the A-loop conformation of the N549H mutant is identical to that of unphosphorylated WT FGFR2K despite the dissociation of the molecular brake by the mutation. Side chains of relevant residues are shown as sticks and the mutated residues are labeled in red letters. Relevant hydrogen bond distances (in Å) are indicated. Atom colorings are as follows: oxygens in red, nitrogens in blue, phosphorus in yellow, and carbons are colored according to the kinase structure to which they belong.
Figure 2 with 1 supplement
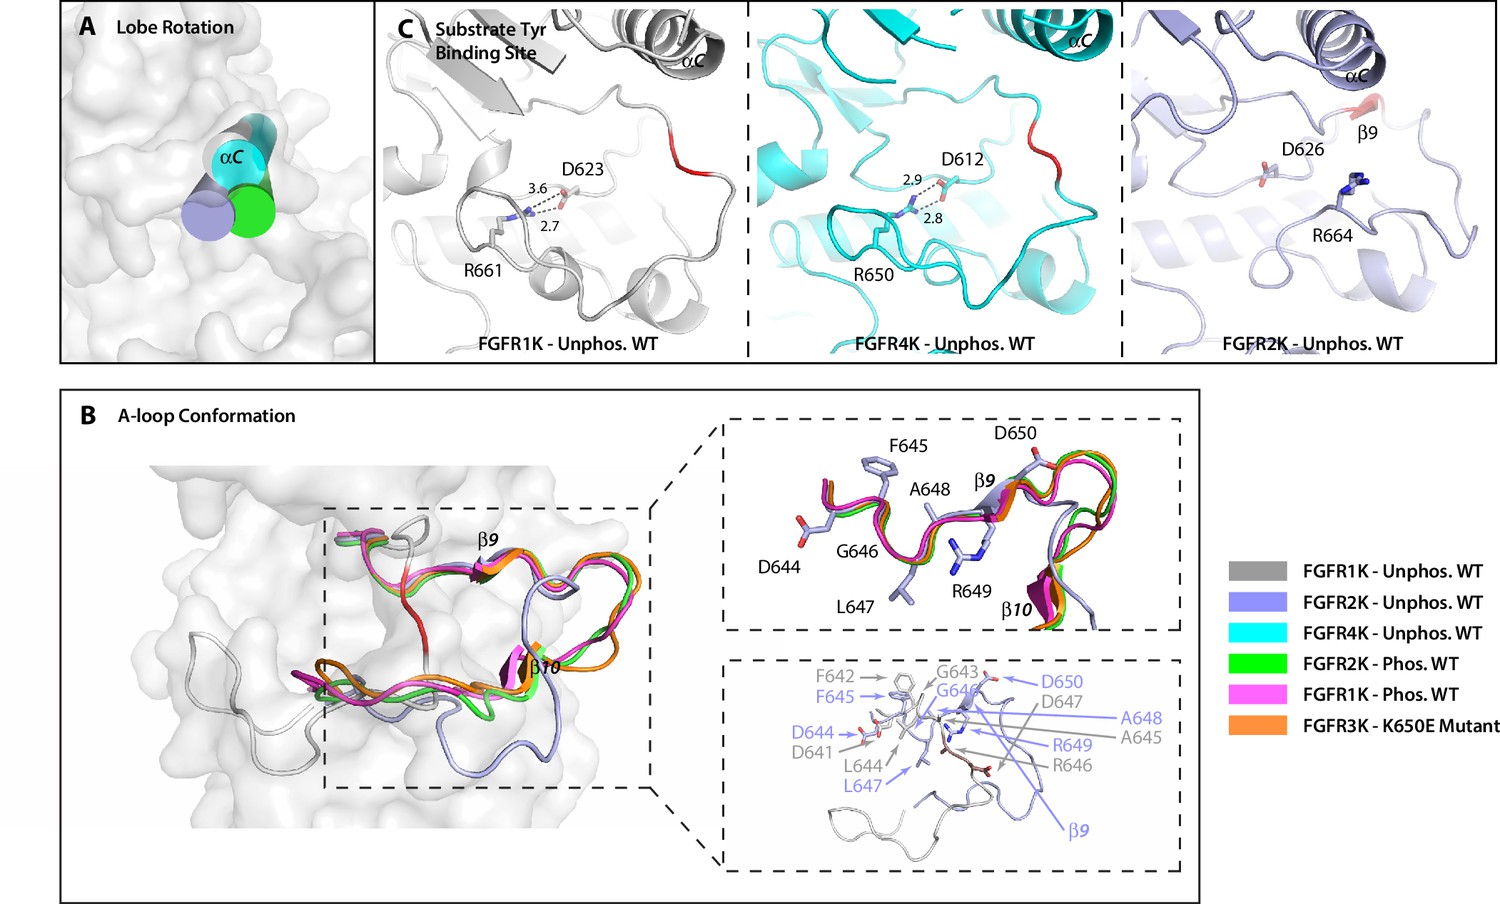
The crystal structure of unphosphorylated WT FGFR2K is in a partially active conformation.
(A) The orientation of the αC helix (rendered as a cylinder) in the crystal structure of unphosphorylated WT FGFR2K is similar to those seen in crystal structures of the A-loop phosphorylated FGFR1K and FGFR2K. (B) The conformation of first seven residues of the A-loop (DFGLARD) of the unphosphorylated WT FGFR2K resembles those of phosphorylated activated FGFR1K and FGFR2K. Note that as in these latter phosphorylated activated FGFRK structures, the unphosphorylated FGFR2K features the β9 strand which pairs with the catalytic loop. (C) The substrate tyrosine binding site in the unphosphorylated FGFR2K is fully accessible which is in stark contrast to that in the unphosphorylated FGFR1K and FGFR4K in which a prominent salt-bridge between an FGFR-invariant arginine (R661 in FGFR1K, R664 in FGFR2K and R655 in FGFR4K) and the catalytic base (D623 in FGFR1K, D626 in FGFR2K and D617 in FGFR4K) blocks the active site. Hydrogen bonds are shown as dashed lines with the distances given in Å. The A-loop section in the unphosphorylated FGFR1K and FGFR2K that forms a β9 strand upon A-loop phosphorylation is highlighted in red. Note that the β9 strand is already present in the unphosphorylated FGFR2K implying that this structure is in a partially active state.
Figure 2—figure supplement 1

PRE experiments and chemical shift analysis provide evidence of an FGFR1K-like autoinhibited A-loop conformation for FGFR2K.
(A) Analysis of chemical shift changes between unphosphorylated and Y657 phosphorylated FGFR2K. Amide 15N and ILV methyl 13C chemical shift perturbations (CSPs) greater than 0.02 ppm are plotted on the structures of FGFR1K (PDB ID: 3KY2) and FGFR2K (PDB ID: 2PSQ) (left panel). The A-loop is colored in blue and the two A-loop tyrosine residues are shown in green. The colored spheres show the magnitude of chemical shift perturbations introduced upon phosphorylation as indicated in the figure. The right panels of (A) show example 1H/15N HSQC and 1H/13C HMQC spectral regions highlighting perturbed residues in the absence (black) and presence of A-loop phosphorylation (red). (B) Distances from the Cγ atoms of V704 and I707 to the nitrogen atom of Y656 in FGFR1K (PDB ID: 3KY2) and FGFR2K (PDB ID: 2PSQ) structures, respectively. The A-loop tyrosines are shown in red. The distance of the Cγ is an approximation for the position of the (1-oxyl-2,2,5,5-tetramethyl-3-pyrroline-3-methyl)-methanethiosulfonate (MTSL) nitroxide spin label. The middle panel of (B) shows 1H/15N HSQC correlation spectra of [15N-Tyr] I707C FGFR2K labeled with MTSL in the oxidized (blue) and reduced (red) forms. The right panel of (B) shows the intensity retention plot calculated by dividing the peak intensities in the oxidized form of MTSL with those of the reduced form. Calculated distances of the spin label to tyrosine residues are displayed on top of the bars. Residues Y704 and Y466 serve as internal distance calibration controls. Y704 completely disappeared in the presence of the oxidized label indicating its close proximity to MTSL (calculated distance <10 Å, actual distance =~7 Å) and Y466 retained an intensity retention above 0.9 indicating a distance greater than ~25 Å (actual distance =~46 Å in 3KY2). Y656 and Y657 showed intensity retentions of ~0.6, which corresponds to a distance of ~19 Å that is consistent with the A-loop packing against the C-lobe as observed in the autoinhibited crystal structures of FGFR1K (3KY2) and FGFR4K (4QQT).
Figure 3
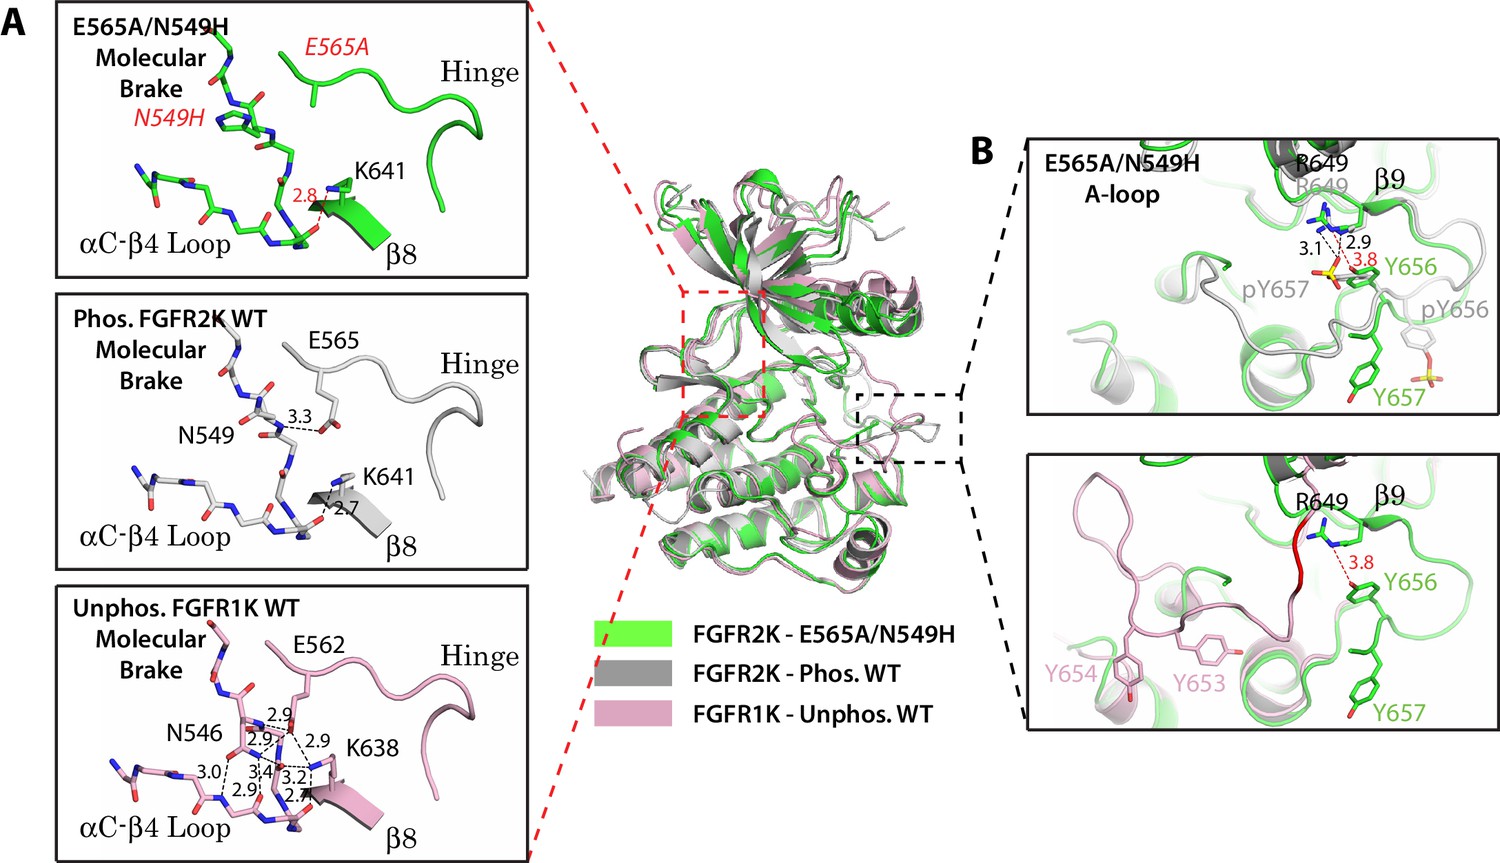
Two mutations within the molecular brake disrupt the hydrogen bonding at the molecular brake and drive the A-loop into the active conformation.
Crystal structures are displayed for the E565A/N549H double mutant of FGFR2K (in green), phosphorylated activated WT FGFR2K (PDB ID: 2PVF [Chen et al., 2007], in grey), and unphosphorylated autoinhibited WT FGFR1K (PDB ID: 1FGK [Mohammadi et al., 1996], in pink). (A) Close-up views of the molecular brake region for each of the three structures. Note that reminiscent of the A-loop phosphorylated activated FGFR2K, the molecular brake is disengaged in the unphosphorylated E565A/N549K structure. The two mutated residues, namely N549H and E565A, are labeled with red letters. (B) Comparison of the A-loop conformations for the three structures. The top panel shows a zoomed-in view of the A-loop conformation for E565A/N549K superimposed onto that of phosphorylated FGFR2K. The bottom panel shows a zoomed-in view of the A-loop conformation for E565A/N549K superimposed onto that of unphosphorylated WT FGFR1K. Backbone residues in unphosphorylated FGFR1K within the A-loop that form the β9 strand after A-loop phosphorylation are highlighted in red. Hydrogen bonds are shown as dashed black (WT structures) and red (mutant structure) lines with distances displayed in Å. Side chains of relevant residues are shown as sticks. Atom colorings are the same as in Figure 1.
Figure 4
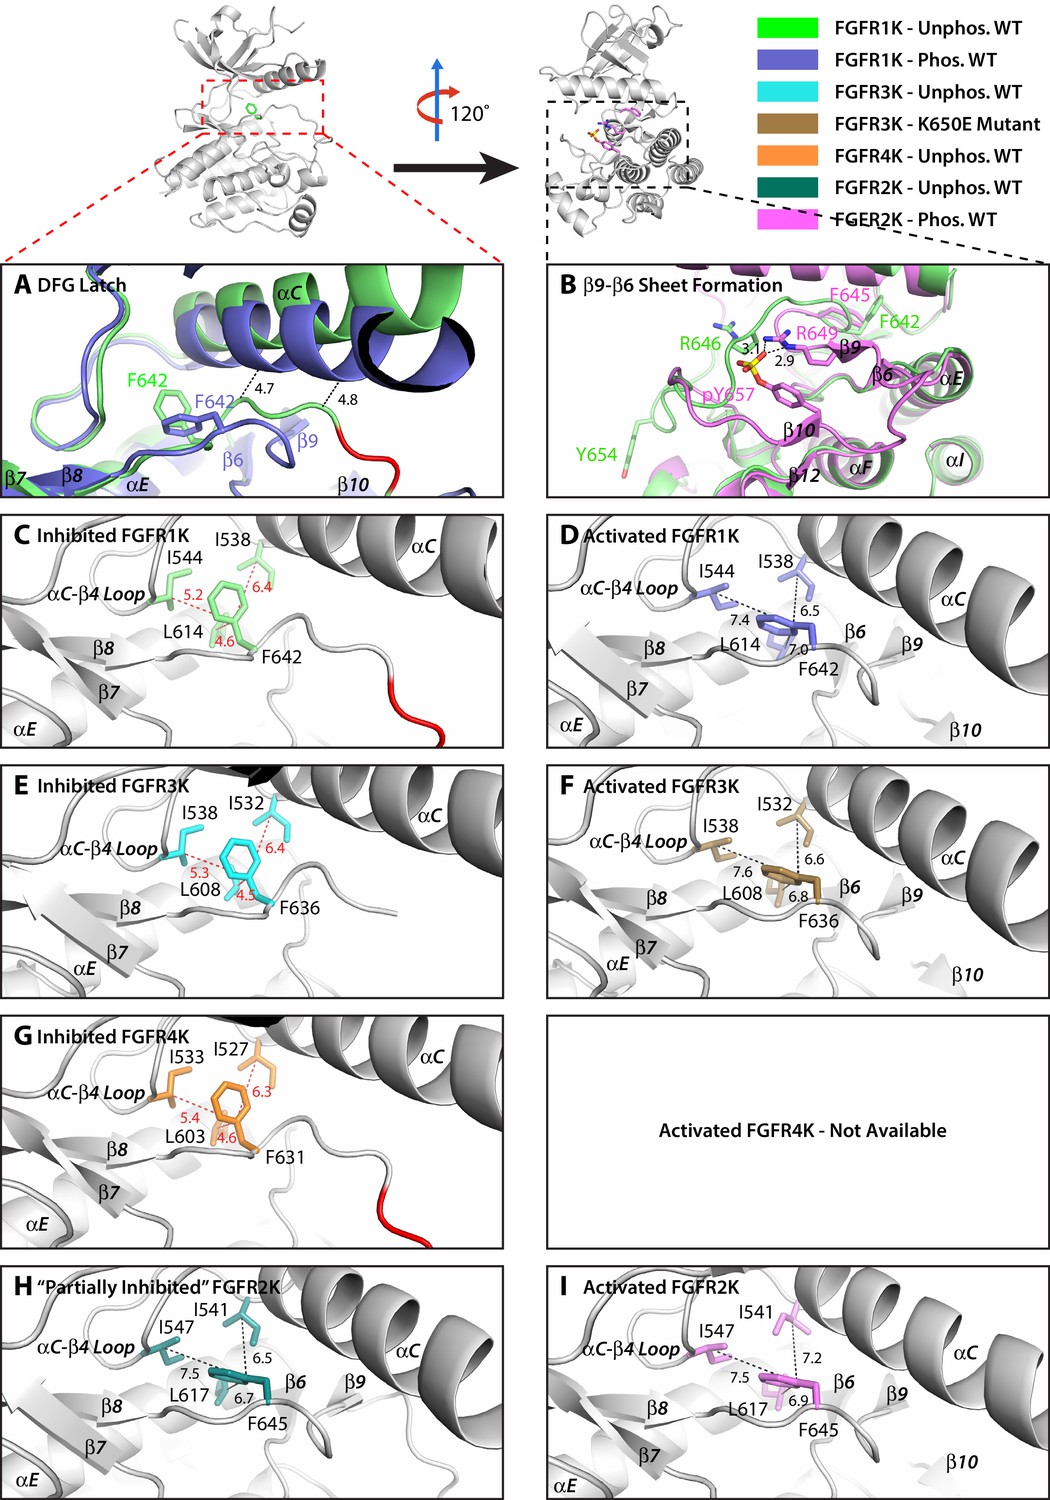
The hydrophobic DFG latch in FGFR kinases restrains N-lobe rotation necessary for kinase activation.
(A) Comparison of the orientation of αC helix and the conformation of the DFGLAR motif at the start of the A-loop between the unphosphorylated autoinhibited WT FGFR1K (PDB ID: 1FGK [Mohammadi et al., 1996], in green) and A-loop tyrosine phosphorylated WT FGFR1K (PDB ID: 3GQI [Bae et al., 2009], in blue) structures. The side chains of the phenylalanine of the DFG motif are rendered in sticks. The dashed lines are used to illustrate the steric clashes that prevent the αC helix from rotating downward in the unphosphorylated autoinhibited FGFR1K structure. The portion of the A-loop in the unphosphorylated WT FGFR1K that becomes β9 strand upon A-loop tyrosine phosphorylation is highlighted in red. (B) Two close-range hydrogen bonds, depicted by dashed lines, between the phosphate moiety of the phosphorylated A-loop tyrosine and conserved arginine (R649 in FGFR1K) stabilize the β9-β6 sheet between the A-loop and the catalytic loop. (C–I) Zoomed-in views of the DFG latch environments observed in the crystal structures of the unphosphorylated WT FGFR1K (PDB ID: 1FGK [Mohammadi et al., 1996], in green), phosphorylated WT FGFR1K (PDB ID: 3GQI [Bae et al., 2009], in blue), unphosphorylated WT FGFR3K (Chen unpublished, in cyan), K650E gain-of-function mutant of FGFR3K (PDB ID: 4K33 [Huang et al., 2013], in brown), unphosphorylated FGFR4K (PDB ID: 4QQT [Huang et al., 2015], in orange), unphosphorylated WT FGFR2K (PDB ID: 2PSQ [Chen et al., 2007], in dark green), and phosphorylated WT FGFR2K (PDB ID 2PVF [Chen et al., 2007], in purple). Distances between the DFG phenylalanine and neighboring leucine and isoleucine residues are indicated by dashed red (autoinhibited kinase) or black (activated kinase) lines with the distance given in Å. Atom colorings are the same as in Figure 1.
Figure 5
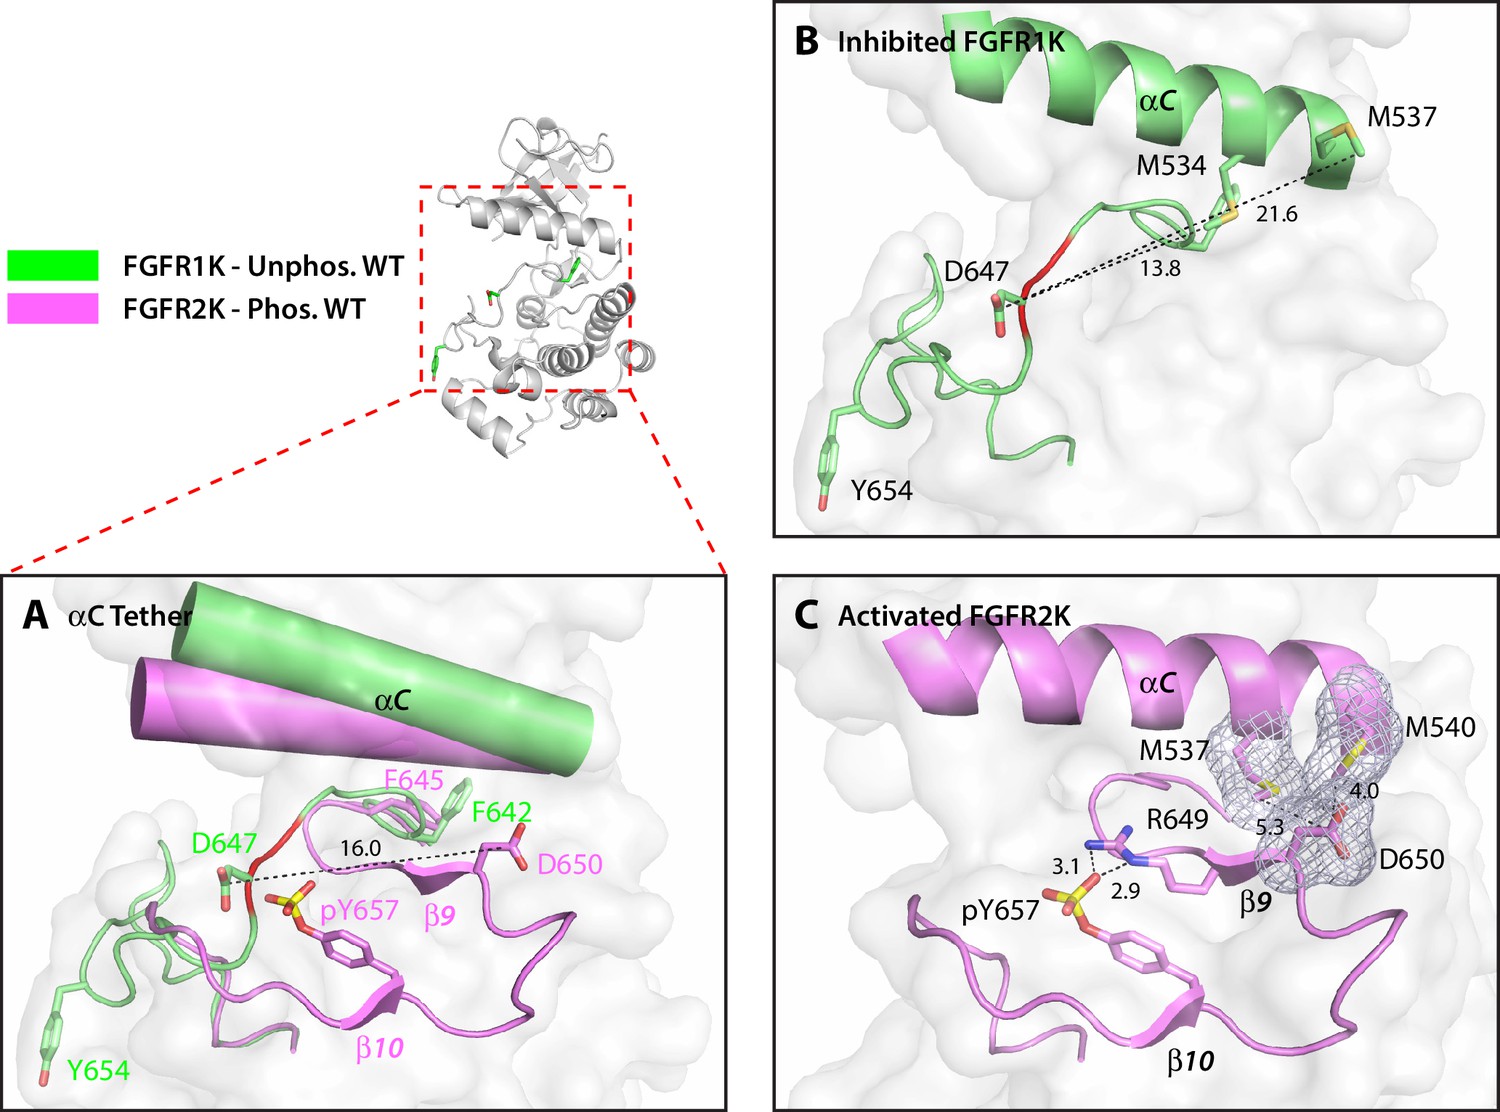
The hydrophobic αC tether in FGFR kinase facilitates N-lobe rotation, a mandatory event in kinase activation.
(A) Structural comparison of the conformation of the αC helix and A-loop between unphosphorylated WT FGFR1K (PDB ID: 1FGK [Mohammadi et al., 1996], in green) and A-loop tyrosine phosphorylated WT FGFR2K (PDB ID 2PVF [Chen et al., 2007], in purple). Notably, there are major structural and orientation changes of the αC helix, DFG phenylalanine, and A-loop between the two structures. For example, there is a large change in the location of conserved aspartic acid between the two structures (i.e. D647 in FGFR1K and D650 in FGFR2K). (B) As highlighted by the distances in Å, D647 in unphosphorylated WT FGFR1K is distant from the two methionines on the αC helix and therefore the aC tether is ‘off’. In red is the section of the A-loop in the unphosphorylated FGFR1K that becomes β9 strand upon A-loop tyrosine phosphorylation. (C) In the phosphorylated WT FGFR2K structure, the D650 makes van der Waals contacts with the two methionines from the αC helix and the αC tether is ‘on’. Engagement of the aC tether acts in concert with a salt bridge between the A-loop phosphotyrosine and conserved arginine to facilitate β9 strand formation. The hydrophobic interactions are represented by semi-transparent mesh. The distances between the aspartic acid and the two methionines on the αC helix are shown as black dashed lines with the distances given in Å. Hydrogen bonds stabilizing the active A-loop conformation are shown as black dashed lines with distances in Å. Atom colorings are the same as in Figure 1.
Figure 6 with 1 supplement
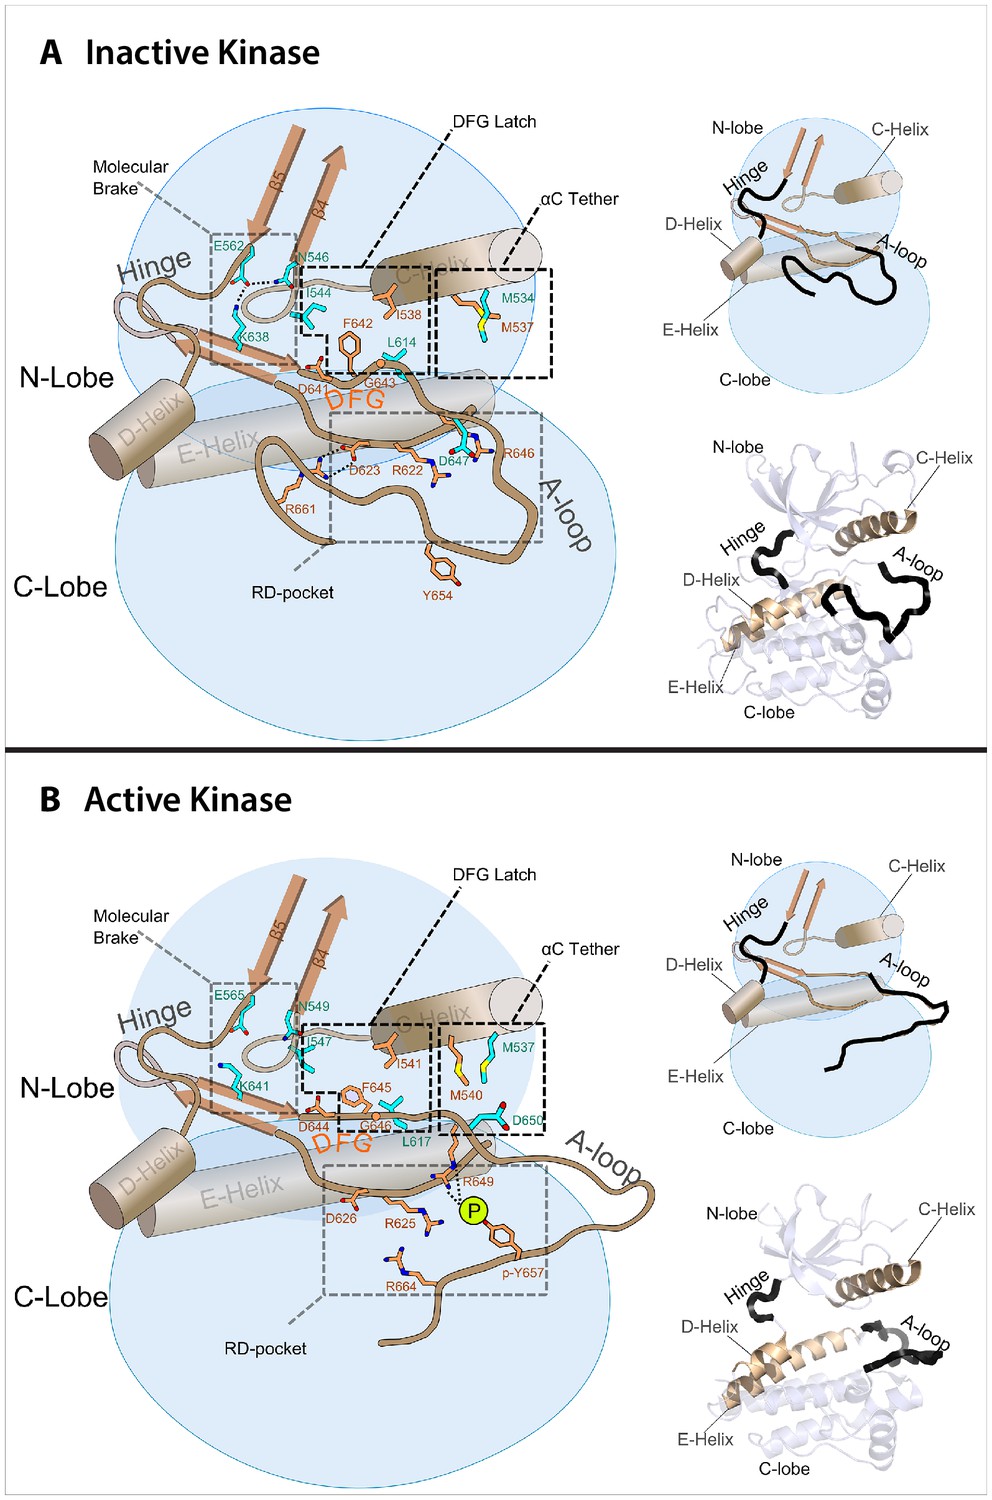
Model of the allosteric network for the kinase domain of FGFR.
Depiction of the four molecular sites/regions comprising the long-range allostery in FGFRK: (1) molecular brake: an inhibitory network of hydrogen bonds near the kinase hinge; (2) DFG latch: a network of hydrophobic connectivity centered at the DFG motif; (3) aC tether: a hydrophobic tether between the αC helix and the A-loop; (4) A-loop plug: a salt bridge between an FGFR-invariant arginine in the A-loop (R661 in FGFR1) and the catalytic base aspartic acid (D623 in FGFR1).
Figure 6—figure supplement 1
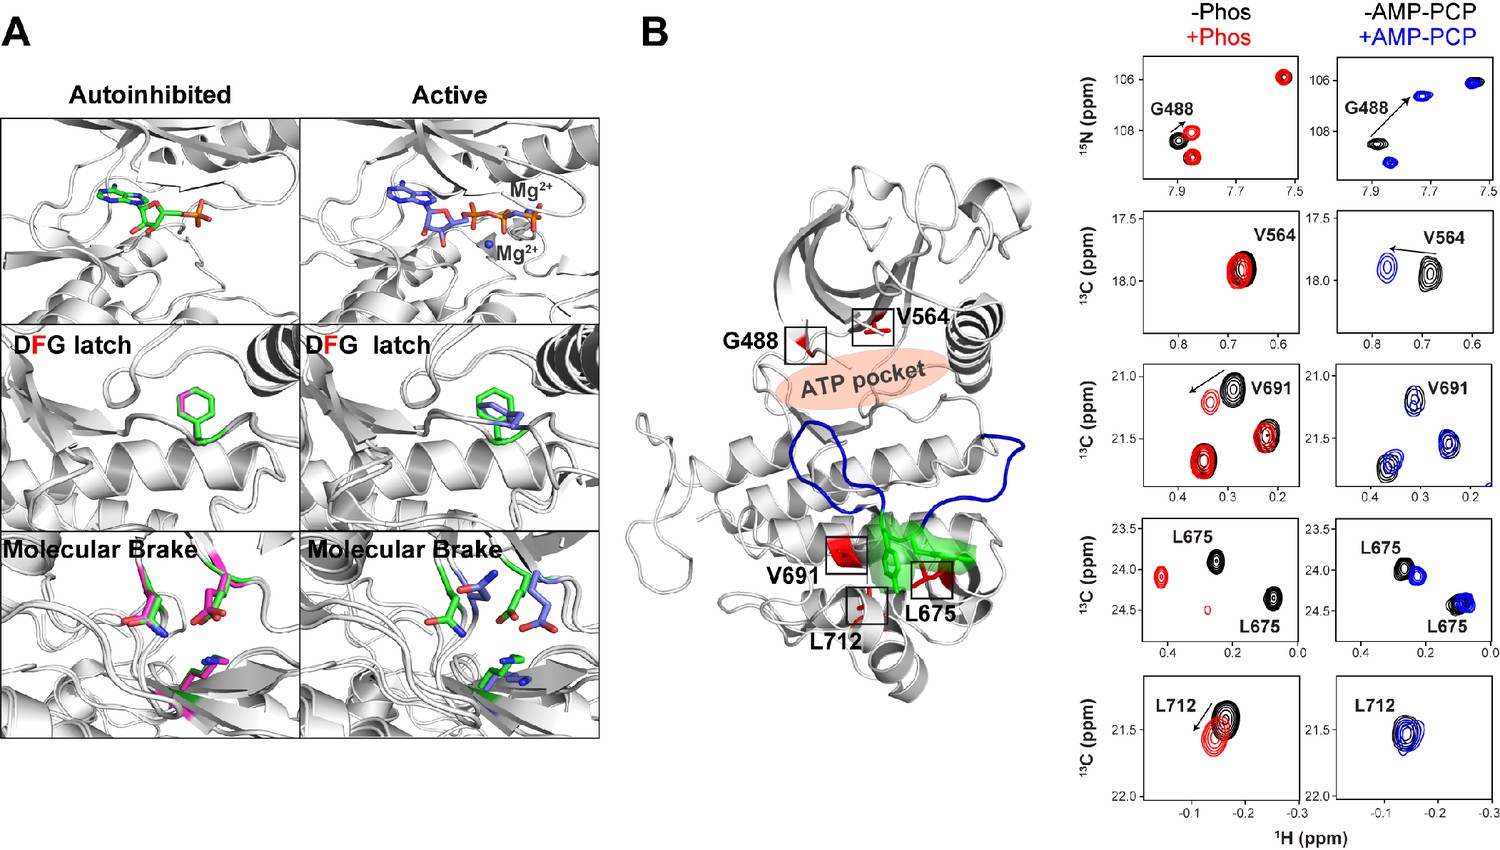
Effect of AMP-PCP binding on kinase activation.
(A) Comparison of structural changes induced upon AMP-PCP binding to the autoinhibited and activated conformations of FGFR1K. The top left and right panels show the difference between AMP-PCP visibility between the autoinhibited (green) (Mohammadi et al., 1996b) and active (purple) forms (PDB ID: 2PVF) of the kinase domain. The lack of electron density for the β and γ phosphates and Mg2+ suggests a relatively poor affinity for the nucleotide. Nevertheless, this autoinhibited structure is able to bind nucleotide yet does not undergo a conformational change to the active conformation. The middle left and bottom left panels show an overlay of unphosphorylated FGFR1K with (green) and without (magenta) nucleotide in the binding pocket (green). The middle right and bottom right panels show an overlay of unphosphorylated FGFR1K with nucleotide in the pocket (green) and the phosphorylated FGFR1K structure with nucleotide in the pocket (purple). The structural views of the molecular brake and DFG latch imply that the presence of nucleotide does not impact the conformations of these two key regions in the allosteric communication network. (B) Comparison of chemical shift perturbations induced upon Y657 phosphorylation (left spectra) and AMP-PCP binding (right spectra). Highlighted peaks in the spectra are mapped onto 3KY2 in red to illustrate their proximity to Y656/Y657 (green) and the entire A-loop (blue). AMP-PCP binding resulted in large chemical shift changes around its binding site (G488 and V564), while changes induced by A-loop phosphorylation gave several changes within the C-lobe near the A-loop packing location.
Figure 7
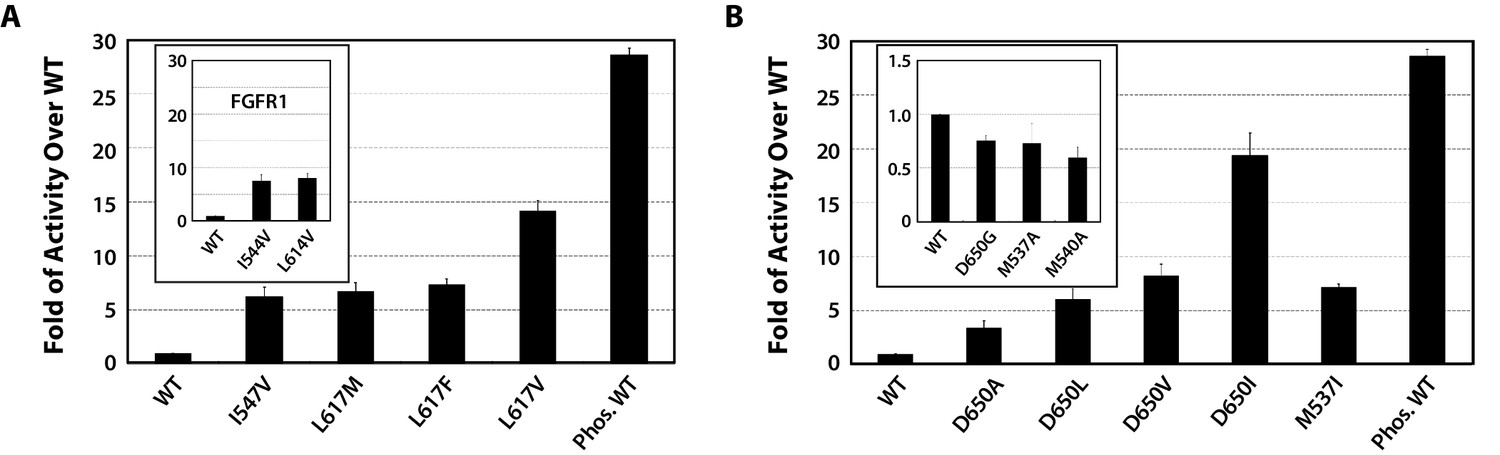
Kinase substrate phosphorylation assay confirms the role of the DFG latch and αC tether in FGFR kinase regulation.
(A) Comparison of the substrate phosphorylation activities of FGFR2K and FGFR1K mutants harboring mutations that weaken the DFG latch with those of the unphosphorylated WT FGFR2K and FGFR1K (inset). The activities are measured at 30 s post reaction and are expressed as fold activity over that of WT FGFR2K or FGFR1K (inset). (B) Comparison of the activities FGFR2K mutants harboring mutations that strengthen or weaken the αC tether. The inset shows data for the FGFR2K mutants with a weakened αC tether. Activities are measured at 30 s post reaction and are expressed as fold activity over the activity of the unphosphorylated WT FGFR2K. Error bars represent mean ± SD.
Figure 8
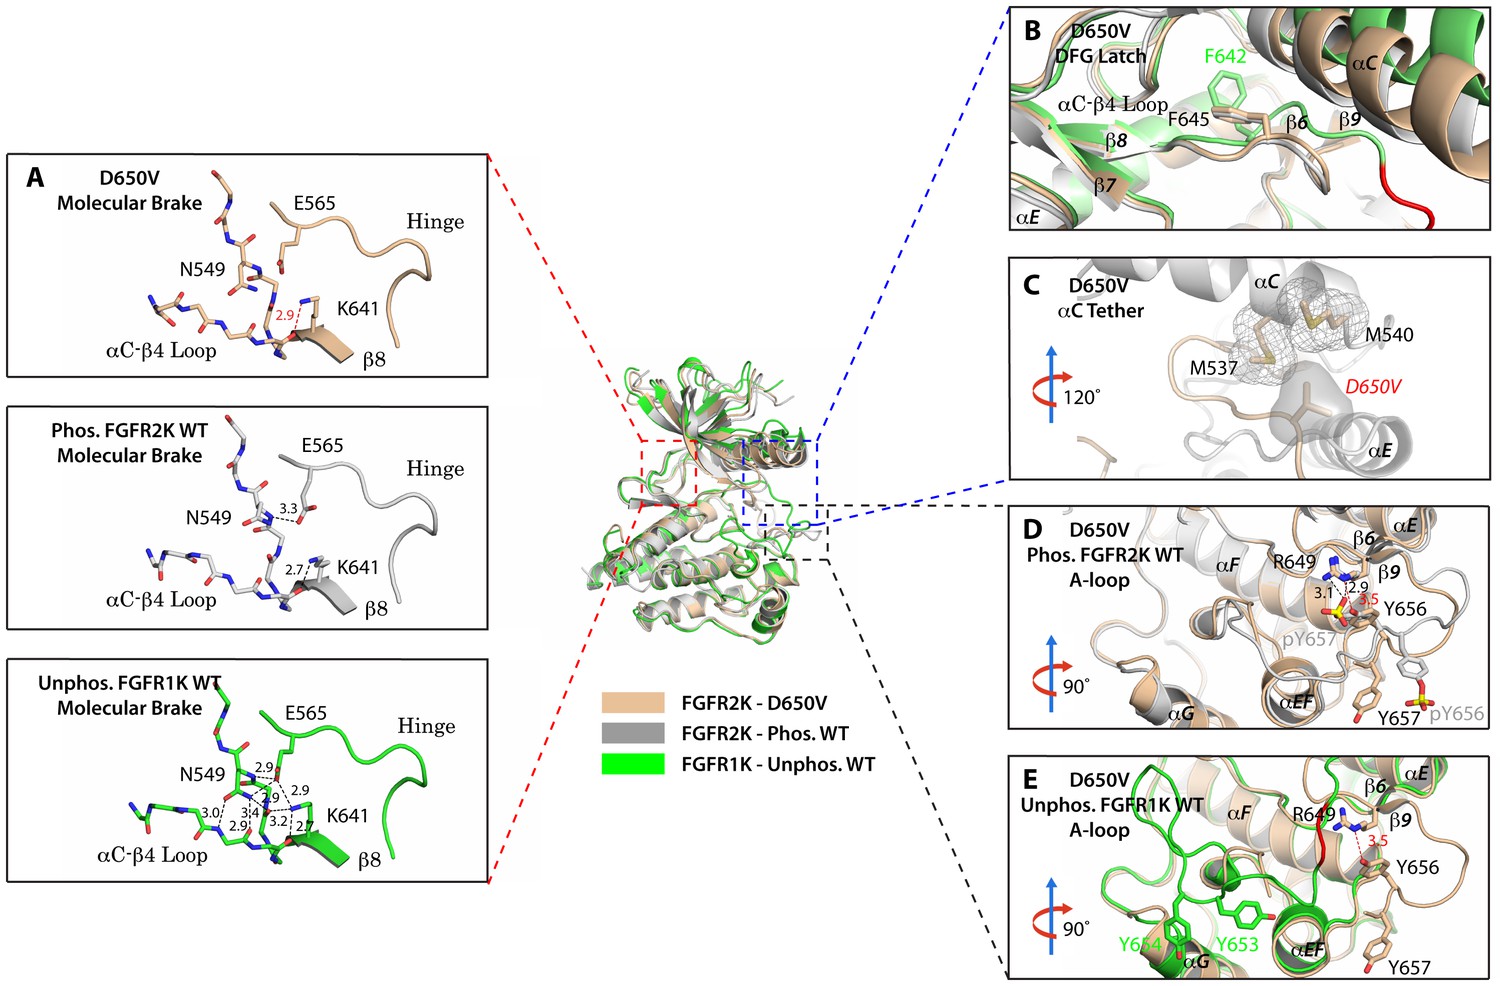
The D650V gain-of-function mutation strengthens the αC tether thereby stabilizing the kinase active conformation.
Superimposition of the crystal structures of the D650V FGFR2K mutant (in wheat), unphosphorylated autoinhibited FGFR1K (PDB ID: 1FGK [Mohammadi et al., 1996], in green), and the A-loop tyrosine phosphorylated WT FGFR2K (PDB ID: 2PVF [Chen et al., 2007], in grey). (A) Close-up views of the molecular brake regions of each of the structures. Note that the molecular brake is disengaged in the unphosphorylated D650V mutant similar to that of the A-loop phosphorylated activated FGFR2K. (B) Close-up view of the DFG latch region showing that the DFG phenylalanine in the D650V mutant adopts the same rotamer position as the corresponding phenylalanine in the A-loop tyrosine phosphorylated WT FGFR2K. (C) Close-up view of the αC tether showing enhanced hydrophobic contacts between V650 and methionines in the αC helix. (D) Comparison of the A-loop regions of the unphosphorylated D650V mutant and the A-loop tyrosine phosphorylated WT FGFR2K showing that the A-loop in the D650V mutant is primarily in the active conformation. The labels for mutant residues are in red. (E) Comparison of the A-loop region of the unphosphorylated D650V mutant and the unphosphorylated inhibited WT FGFR1K showing that the A-loop in the D650V mutant is not in the inhibited conformation. The hydrophobic interactions are represented by semitransparent mesh and solid surface, and the hydrogen bond between pY657 and R649 is shown as a black dashed line with the distance given in Å. Side chains of selected residues are shown as sticks. Atom colorings are the same as in Figure 1.
Figure 9 with 2 supplements
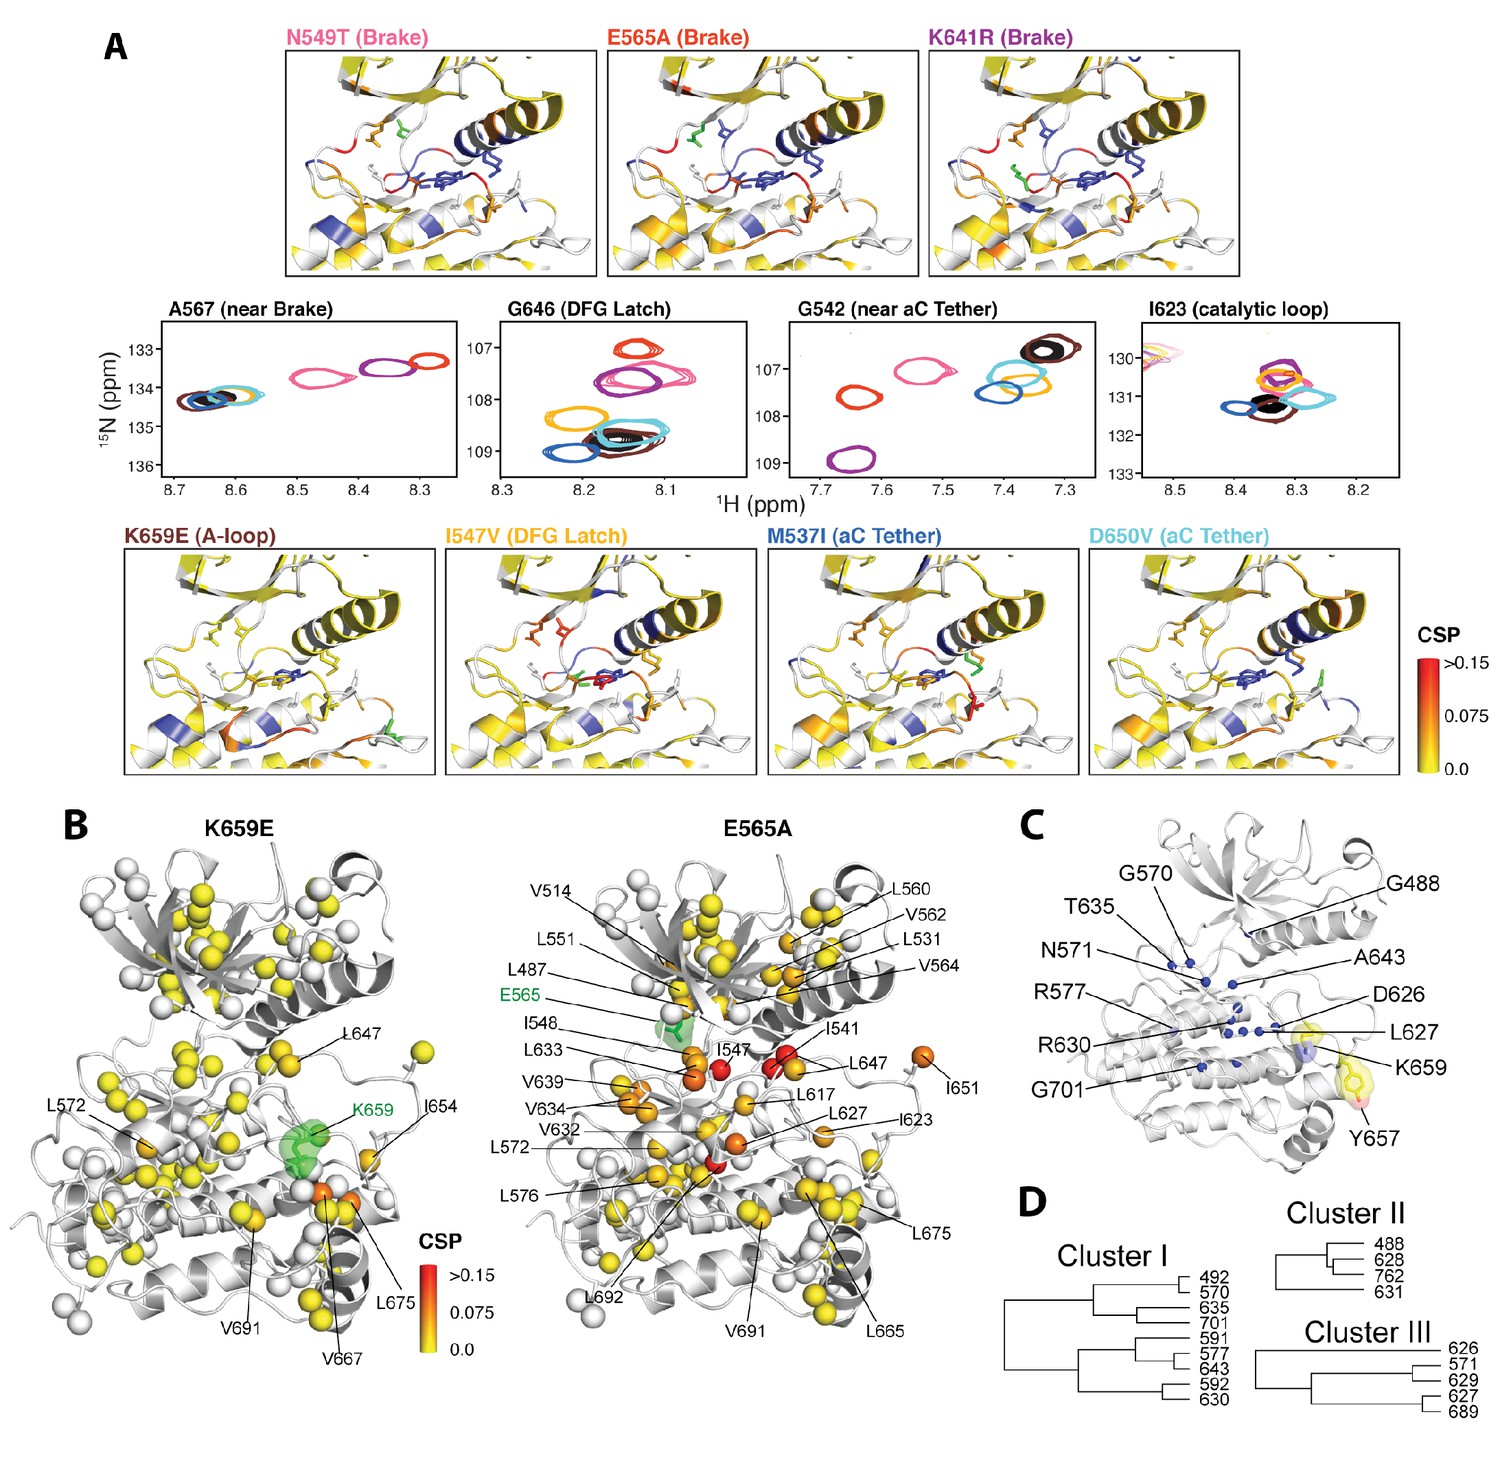
NMR chemical shift perturbation and CHESCA analysis for FGFR2K mutations.
(A) 1H/15N correlation spectra are shown in the middle four panels for residues A567, G646, G542, and I623 located near the molecular brake, within the DFG latch, near the αC tether, and within the catalytic loop, respectively. The colors of this spectral overlay match to those of the seven mutants listed in the top three and bottom four panels. Perturbations are mapped onto the active WT FGFR2K structure (PDB ID: 2PVF [Chen et al., 2007]) with the magnitude of changes reflecting the difference between unphosphorylated WT FGFR2K and the respective activating mutation (red indicates the maximum perturbation, while yellow corresponds with no perturbation). Blue colored regions correspond to residues whose chemical shifts disappeared or shifted beyond detection for the given mutant. The mutated residue in each structure is colored green. (B) Ile, Leu, and Val chemical shift perturbations of K659E (left) and E565A (right) relative to those of unphosphorylated WT FGFR2K. The methyl perturbation sites shown in spheres are mapped onto the autoinhibited WT FGFR1K (PDB ID: 3KY2 [Bae et al., 2010]); note that the residue numbering convention corresponds to that of FGFR2K. White spheres correspond to residues unassigned or overlapped in the mutants. (C) Residues within the allosteric network identified using CHESCA are mapped onto the FGFR1K structure with a sphere at the backbone nitrogen position (PDB ID: 3KY2 [Bae et al., 2010]). The chemical shifts from a series of mutations at K659 (T, N, Q, M, E) and WT phosphorylated and unphosphorylated FGFR2K were used for the analysis. (D) Phylogenic tree showing the three separate clusters of residues with correlation coefficients |rij| = 0.97. Based on the similar functional network, these three clusters comprise the same allosteric network (Figure 9—figure supplement 2).
Figure 9—figure supplement 1
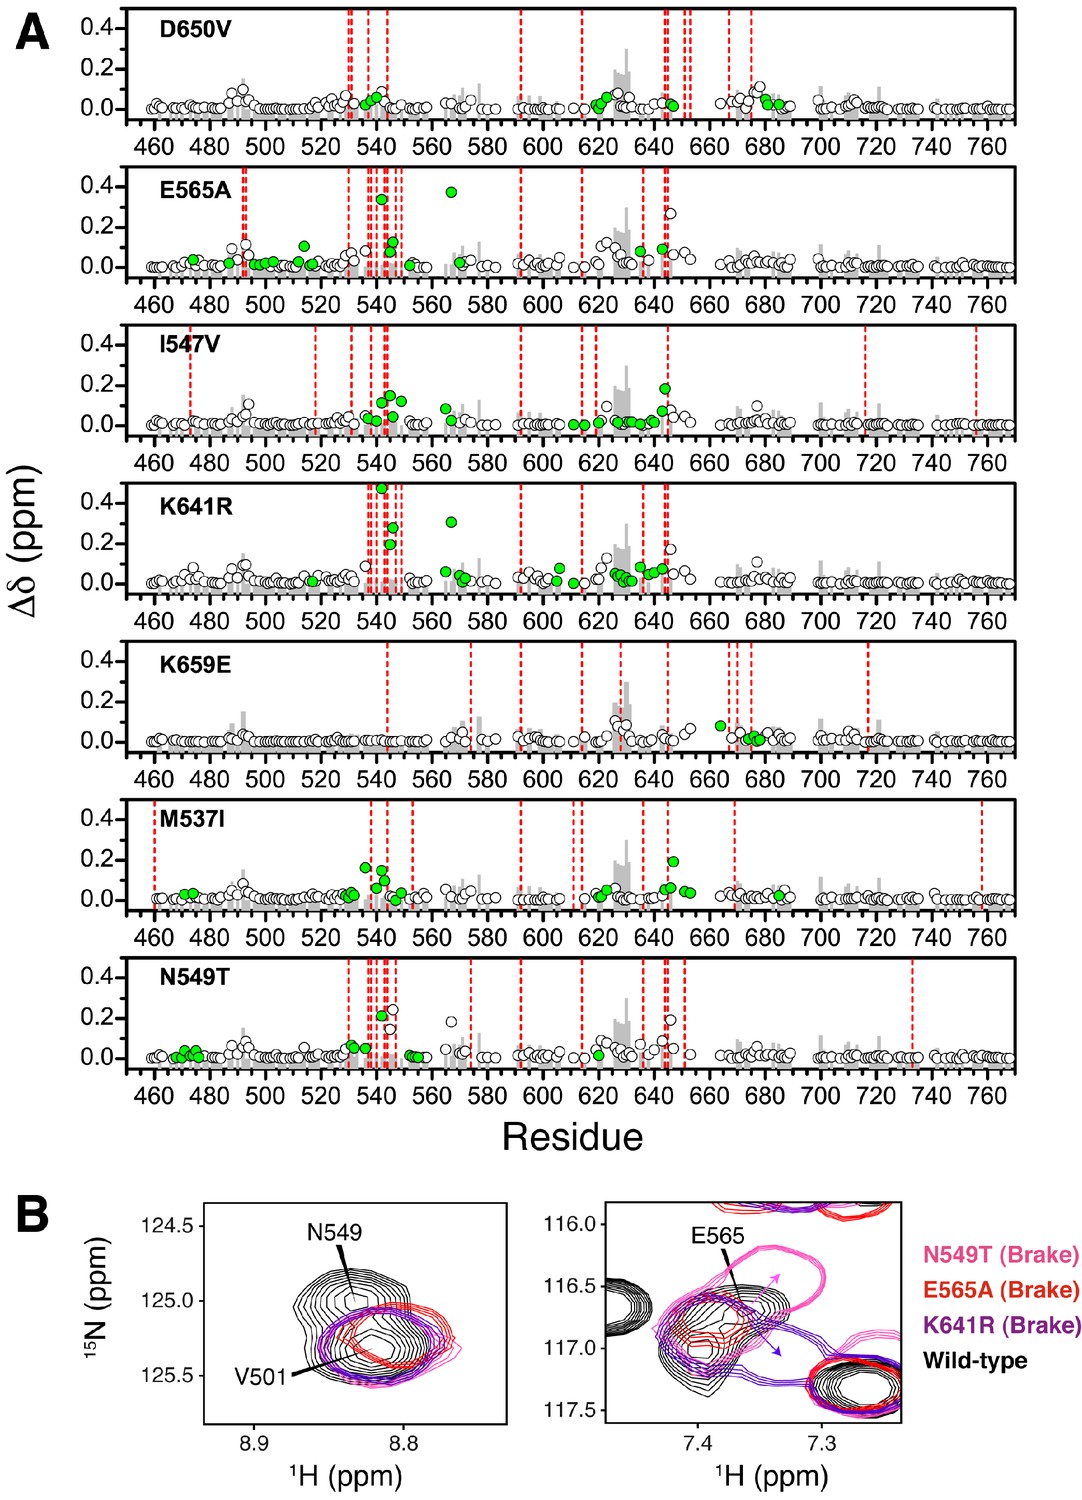
Chemical shift perturbations for pathogenic mutants of FGFR2K.
(A) The combined chemical shift perturbation (Δδ) as a function of residue was calculated according to equation 1 between the unphosphorylated WT FGFR2K and that of the indicated mutant. Green circles show residues that are within 10 Å of the mutation site and therefore may have chemical shift perturbations resulting from electrostatic changes of the mutant. The grey bars in the background correspond to the combined chemical shift perturbation between phosphorylated and unphosphorylated FGFR2K (i.e., active vs. autoinhibited). The red vertical lines are residues that were missing in the spectrum relative to unphosphorylated FGFR2K. (B) 1H/15N TROSY spectra showing molecular brake residues N549 and E565 and how they are perturbed in the three brake mutants (N549T, E565A, K641R) relative to wild-type FGFR2K.
Figure 9—figure supplement 2
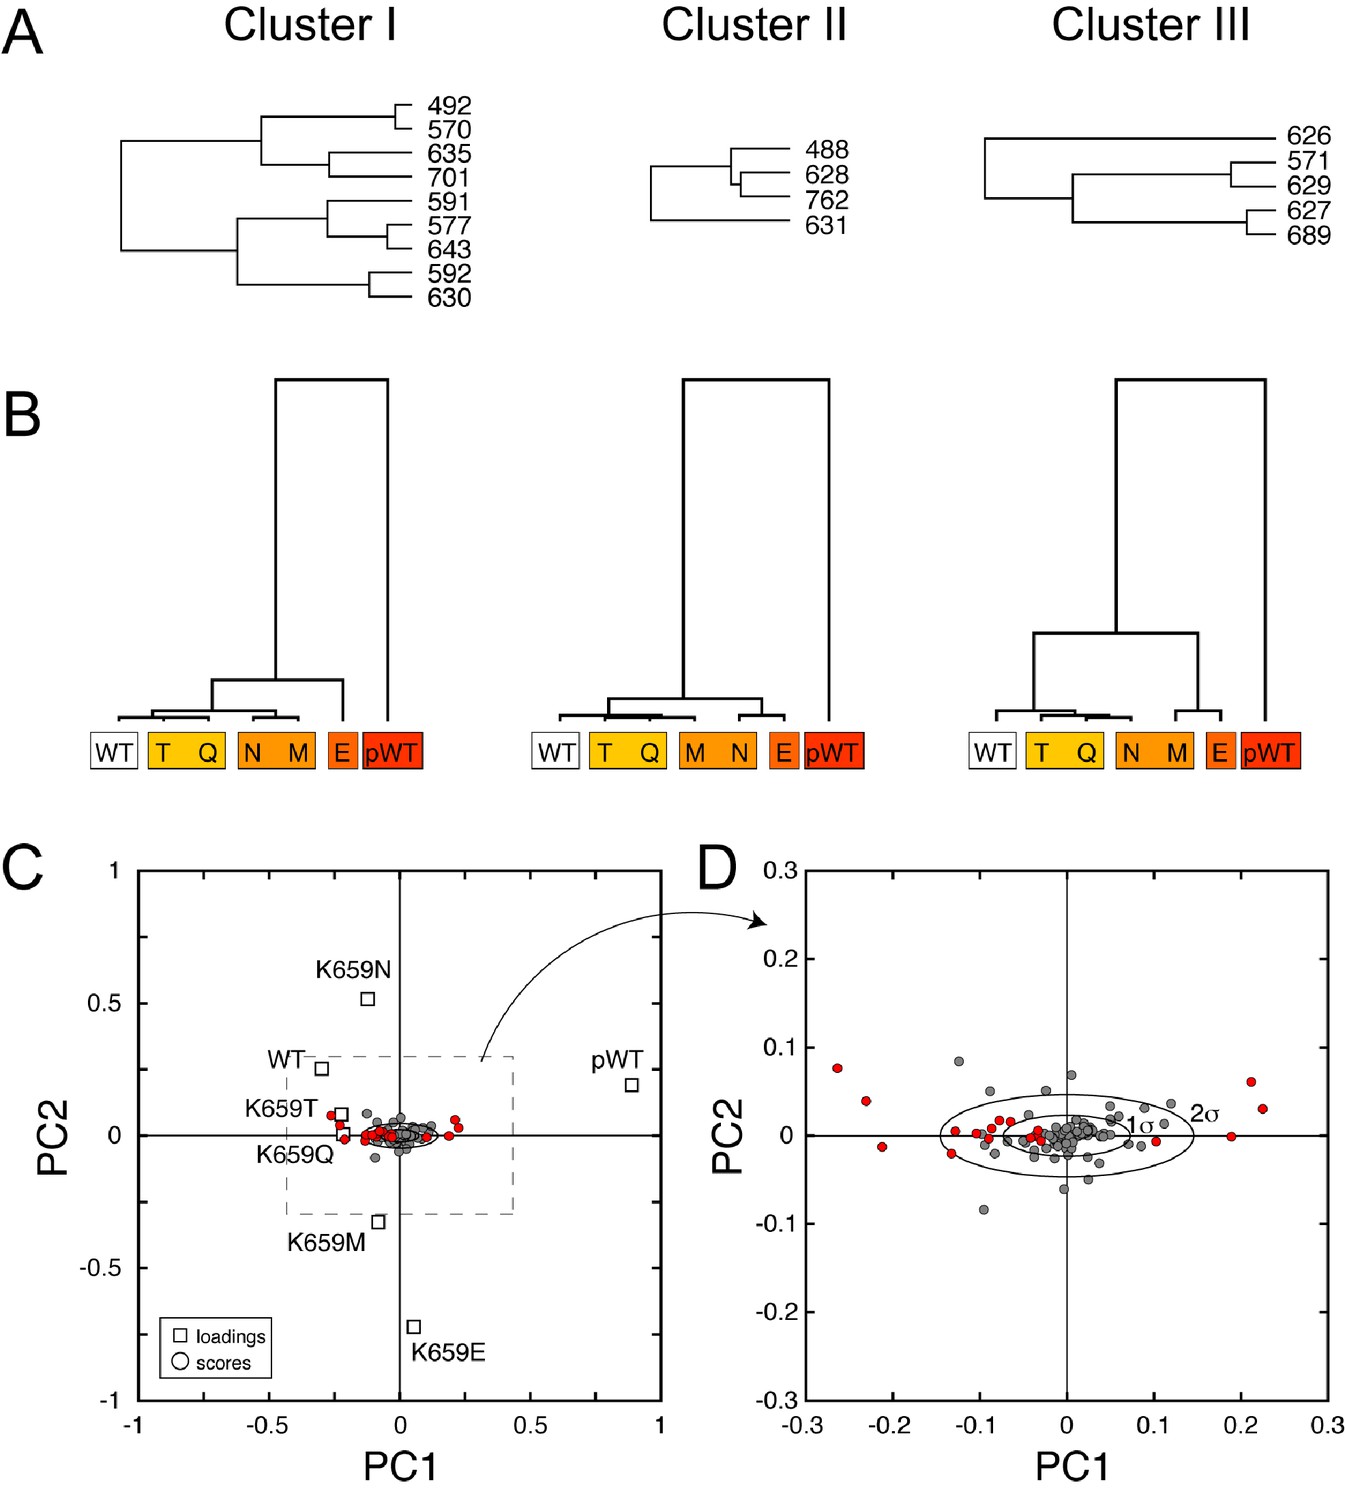
CHESCA functional network and single-value decomposition analysis.
(A) The three dendrograms shown in Figure 9D were obtained using the complete linkage CHESCA approach (Boulton et al., 2014) where each cluster corresponds to residues having correlation coefficients |rij| > 0.97. (B) State-based dendrograms showing the results of agglomerative clustering using residues corresponding to the individual clusters I-III. (C and D) Score and loading plots indicating that the residues identified as part of the allosteric network (in red) align along the same principle component (PC1), which further validates the conclusion that clusters I-III belong to the same allosteric network. The analysis was performed as described by Melacini and co-workers (Selvaratnam et al., 2011; Boulton et al., 2014).
Figure 10
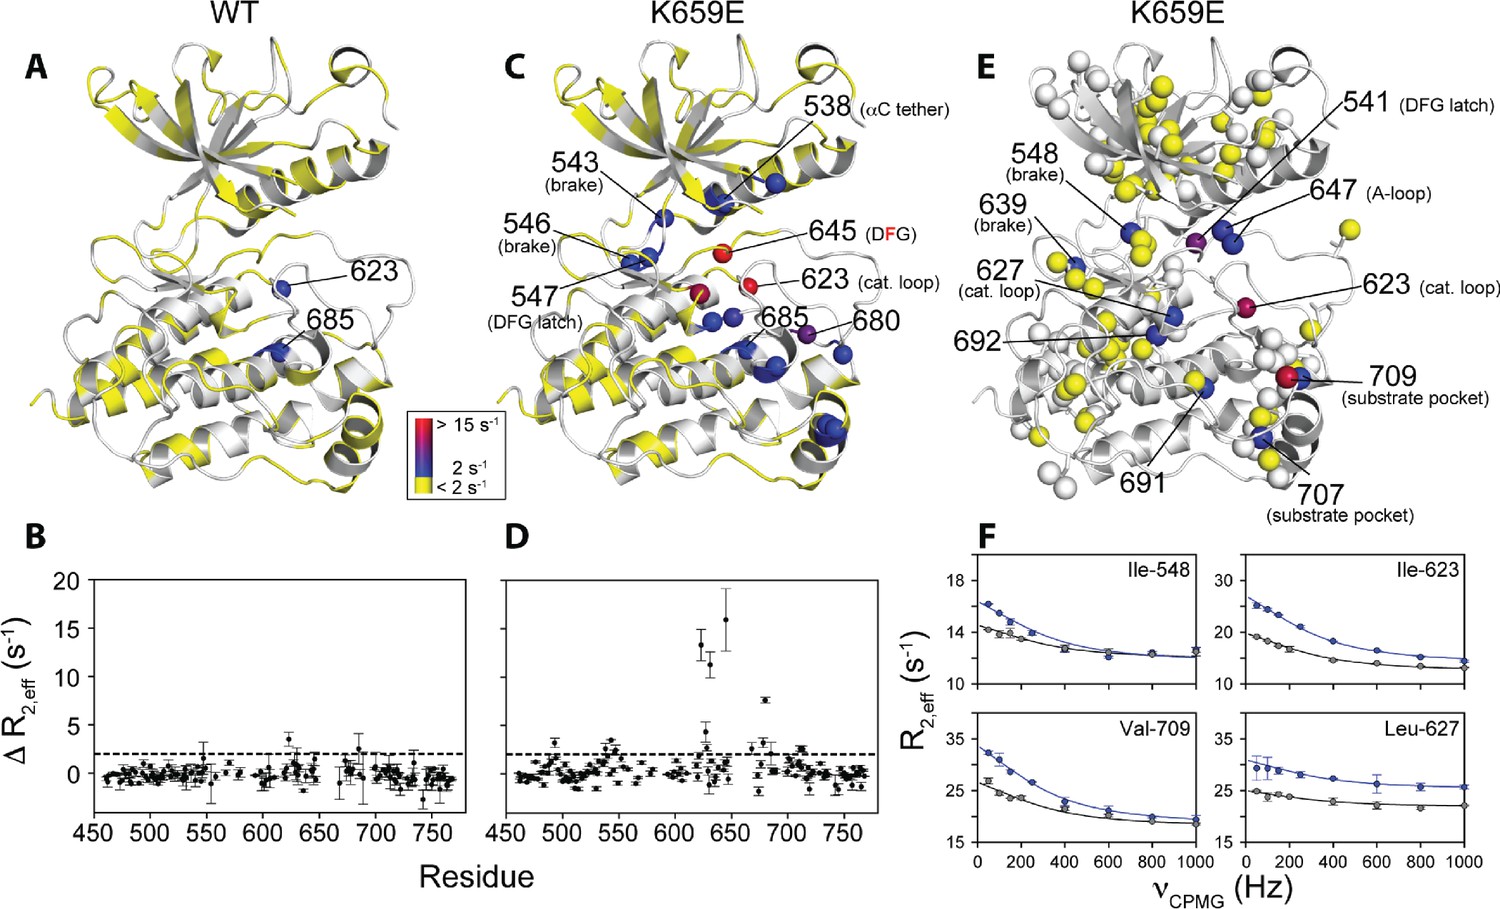
Comparison and quantification of microsecond-to-millisecond dynamics for wild-type and K659E FGFR2K.
(A–D) ΔR2,eff15N CPMG relaxation dispersion values for WT (panel A, B) and K659E mutant (panel C, D) plotted onto unphosphorylated WT FGFR1K (PDB ID: 3KY2 [Bae et al., 2010]) note that the residue numbering convention corresponds to that of FGFR2K. Significant dispersions (>2 s−1) are represented by the dotted line on each ΔR2,eff plot as a function of residue (panels B and D). All 15N CPMG data were acquired at a 1H frequency of 600 MHz. (E) Results from 13C multiple quantum CPMG relaxation dispersion experiments acquired at 800 MHz are plotted onto the unphosphorylated WT FGFR1K structure (PDB ID: 3KY2). The ΔR2,eff13C values are shown for Ile, Leu, and Val methyl groups (spheres). (F) CPMG dispersion curves for select residues at 800 MHz (blue) and 600 MHz (black). The lines represent a globally fit kex value equal to 2000 ± 500 s−1. For panels A, C, and E, significant dispersions (>2 s−1) are represented on a scale from blue to red with dispersions below 2 s−1 shown in yellow. White regions (A and C) or white spheres (E) indicate unassigned or unresolved residues.
Figure 11
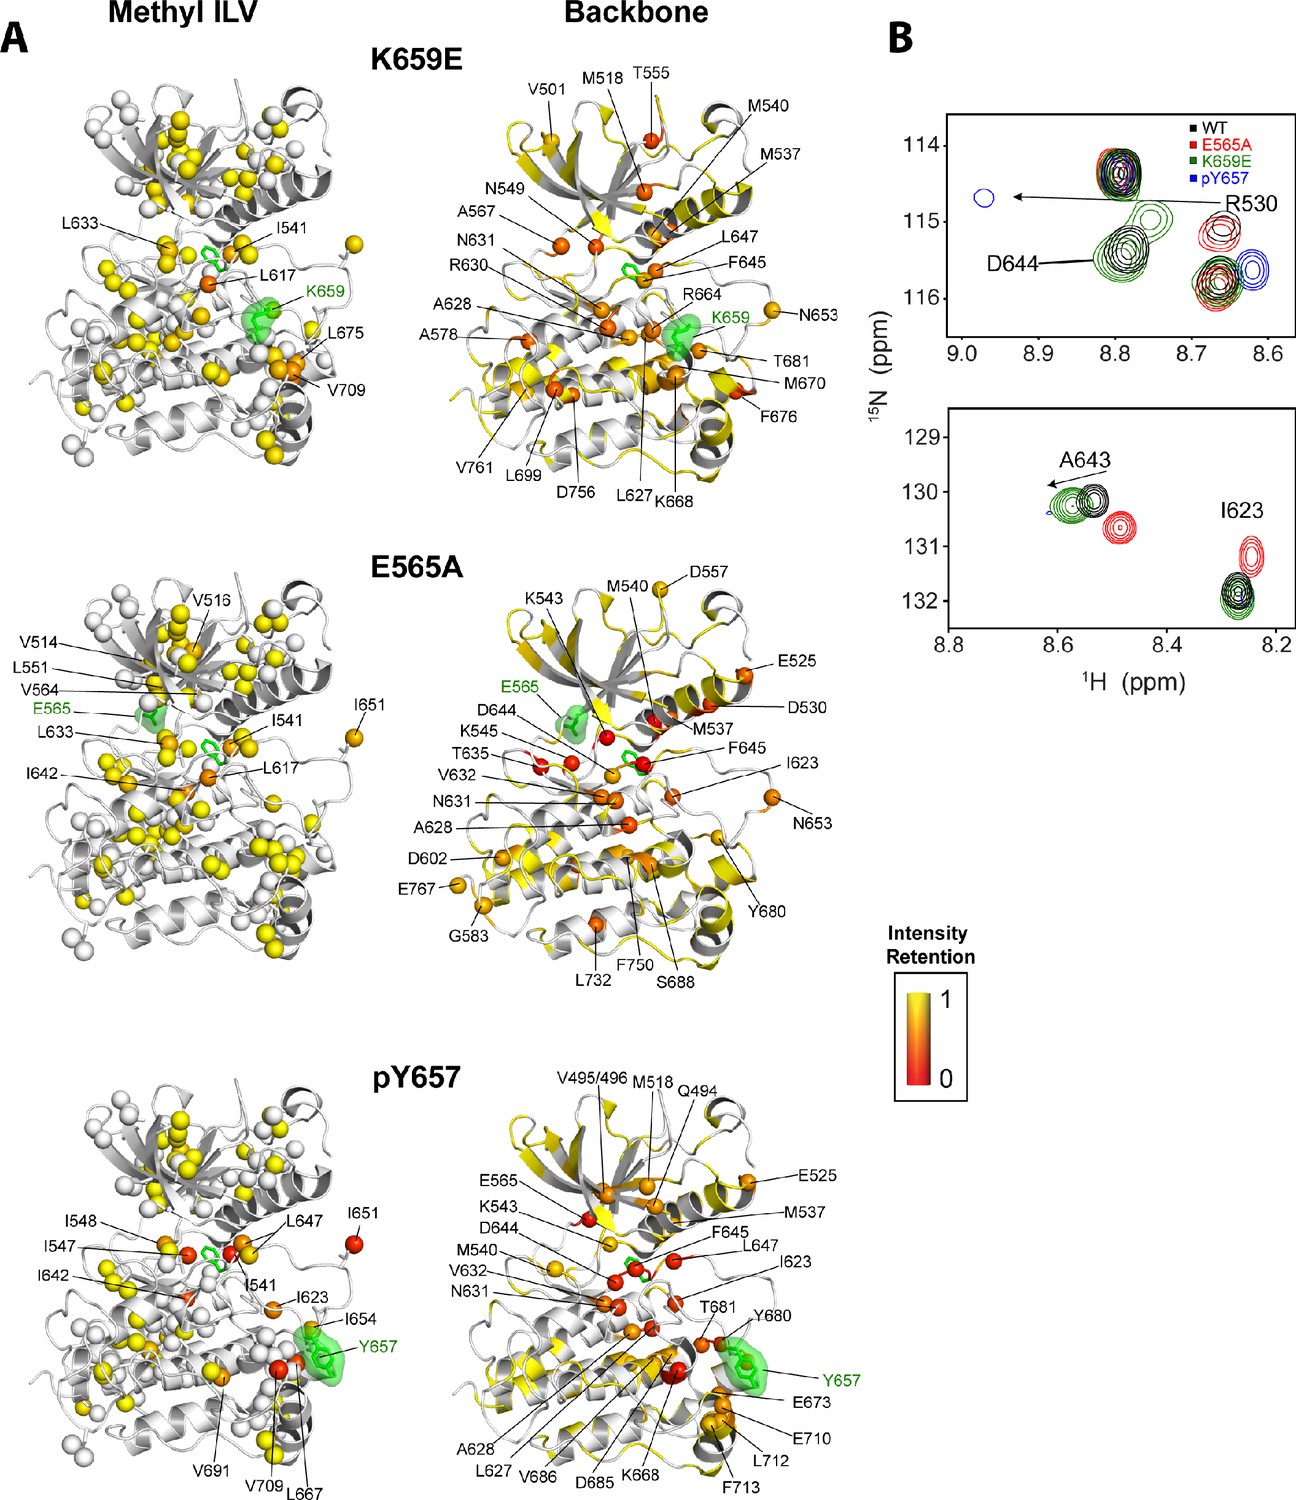
Intensity retentions of phosphorylated Y657 WT FGFR2K and pathogenic mutants K659E and E565A.
(A) Intensity retentions from 1H/13C HMQC and 1H/15N TROSY-HSQC spectra for Ile, Leu, and Val methyl groups (left column) and backbone (right column) of K659E (top), E565A (middle), and phosphorylated Y657 (bottom) relative to unphosphorylated WT FGFR2K. Intensity retentions were calculated by dividing the peak intensities of each mutant and phosphorylated WT protein by those of the WT. The site of mutation or phosphorylation is shown as a green surface. The side chain phenylalanine (F645) in the DFG motif is also depicted with green sticks in each structure to highlight its involvement in the allosteric pathway. All marked residues on the structures corresponding to the Ile, Leu, and Val methyl group data had intensity retentions below 0.8. Similarly, all residues marked and represented as spheres for the backbone data indicate intensity retentions below 0.8. The intensity retentions are represented on a color scale (red to yellow) from 0 to 1 where 1 represents full retention and 0 represents a complete loss of signal. (B) Overlay of 1H/15N TROSY-HSQC spectra for unphosphorylated WT, mono-phosphorylated Y657, E565A, and K659E showing the diminished or loss of peak intensities for phosphorylated Y657 and/or E565A. The top overlay highlights residue D644 within the DFG motif, which is present for WT and K659E, but missing from the phosphorylated Y657 spectrum and significantly diminished for E565A. Note that at a lower contour cutoff, D644 is observed for E565A. R630 is also shown in this same panel and indicates a large chemical shift perturbation for K659E that was previously reported for the pathogenic mutants characterized at K659 (Chen et al., 2013). The bottom spectral overlay in panel B shows a similar trend for residue G643. Here, signal strength for phosphorylated Y657 FGFR2K is significantly diminished, while E565A shows a chemical shift perturbation without a loss in signal intensity.
Figure 12
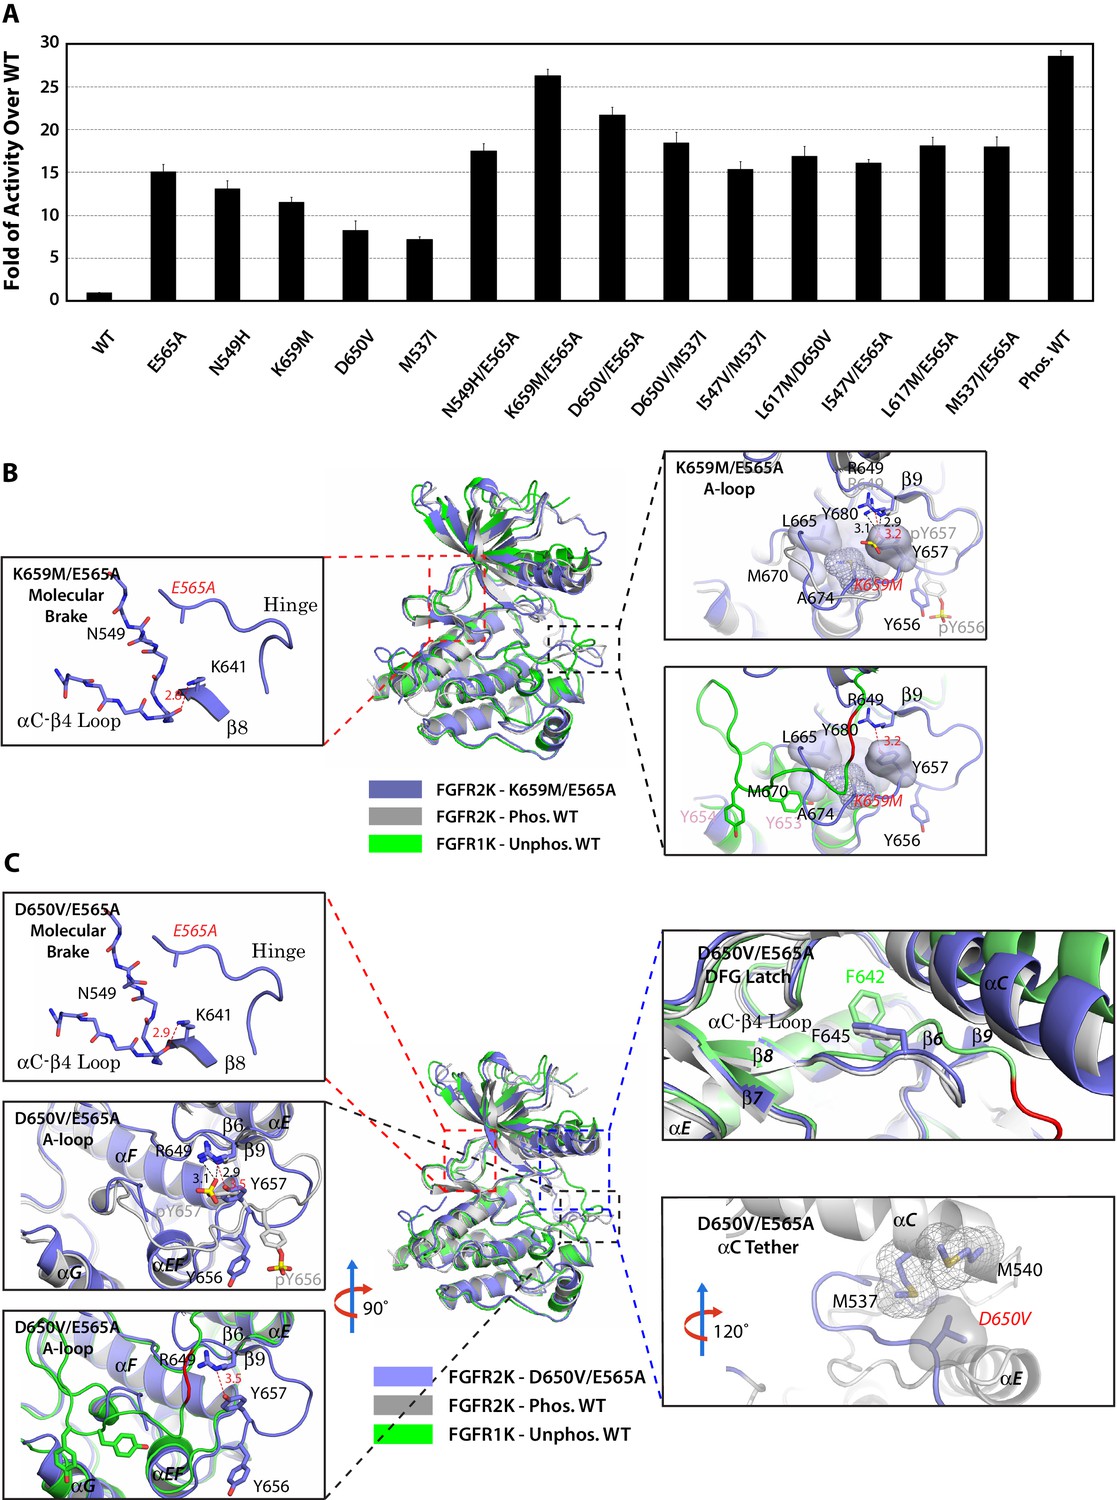
Combined mutations from two sites of the allosteric network further stabilize the active state conformation of FGFR2K.
(A) Comparison of substrate phosphorylation activities of nine double mutants that carry combined mutations from the same site (N549H/E565A) or two different sites. Activities were measured 30 s post reaction and are expressed as the fold of activity over the unphosphorylated WT FGFR2K. Error bars represent mean ± SD. (B) Superimposition of the crystal structures of the K659M/E565A double mutant (in blue), unphosphorylated autoinhibited FGFR1K (PDB ID: 1FGK [Mohammadi et al., 1996], in green), and the A-loop tyrosine phosphorylated WT FGFR2K (PDB ID: 2PVF [Chen et al., 2007], in grey). The right inset shows a zoomed-in view of the molecular brake region of the K659M/E565A double mutant. Note that reminiscent of the A-loop phosphorylated activated FGFR2K, the molecular brake is completely disengaged in the unphosphorylated K659M/E565A double mutant. The upper inset to the right of the panel shows a zoomed-in view of the A-loop conformation of the K659M/E565A double mutant overlaid onto that of A-loop phosphorylated FGFR2K. Lower inset to the right of this panel shows a zoomed-in view of the A-loop conformation of K659M/E565A double mutant superimposed onto that of unphosphorylated autoinhibited WT FGFR1K. In the lower inset, the section of A-loop in the unphosphorylated FGFR1K that is destined to become β9 strand upon A-loop phosphorylation is highlighted in red. Note that the A-loop in the K659M/E565A double mutant is in an activated conformation. The hydrophobic interactions that the K659M mutation introduces to support the active conformation of the A-loop are represented by semitransparent surfaces, and the hydrogen bond between Y657 and R649 is shown as a red dashed line with the distance given in Å. (C) Comparison of the crystal structures of the D650V/E565A double mutant (in blue), unphosphorylated autoinhibited FGFR1K (PDB ID: 1FGK [Mohammadi et al., 1996], in green), and the A-loop tyrosine phosphorylated WT FGFR2K (PDB ID: 2PVF [Chen et al., 2007], in grey). The top left inset shows a close-up view of the molecular brake region of the D650V/E565A double mutant. Note that reminiscent of the A-loop phosphorylated activated FGFR2K, the molecular brake is disengaged in the unphosphorylated double mutant. The middle inset on the left shows the superimposition of the A-loop region for unphosphorylated D650V/E565A and A-loop tyrosine phosphorylated WT FGFR2K. The bottom inset to the left shows the superimposition of the A-loop region for unphosphorylated D650V/E565A and unphosphorylated inhibited WT FGFR1K. Note that the A-loop in the D650V/E565A double mutant is primarily in an activated conformation. The upper inset to the right shows a close-up view of the DFG latch region showing that the DFG phenylalanine in the D650V/E565A double mutant adopts the same rotamer position as the corresponding phenylalanine in the A-loop tyrosine phosphorylated WT FGFR2K. The lower inset to the right shows a close-up view of the αC tether where hydrophobic contacts are made between V650 and the two methionines in the αC helix. The hydrophobic interactions are represented by mesh and semitransparent solid surface, and the hydrogen bond between Y657 and R649 is shown as a black dashed line with the distance given in Å. In panels B and C, the labels for the mutant kinases are in red. Only side chains of relevant residues are rendered in sticks. Atom colorings are as in Figure 1.
Tables
Table 1
X-ray data collection and refinement statistics.
Construct | E565A/N549H | E565A/K659M | D650V | E565A/D650V |
|---|---|---|---|---|
Data Collection | ||||
Resolution (Å) | 50–2.90 (2.95–2.9) | 50–2.05 (2.09–2.05) | 50–1.86 (1.93–1.86) | 50–2.35 (2.39–2.35) |
Space group | P212121 | P4322 | P212121 | P212121 |
Unit Cell Parameters (Å, °) | a = 67.334 b = 78.557 c = 116.546 α = 90.00 β = 90.00 γ = 90.00 | a = 73.937 b = 73.937 c = 311.359 α = 90.00 β = 90.00 γ = 90.00 | a = 67.215 b = 78.786 c = 116.544 α = 90.00 β = 90.00 γ = 90.00 | a = 66.973 b = 77.860 c = 115.809 α = 90.00 β = 90.00 γ = 90.00 |
Content of the asymmetric unit | 2 | 2 | 2 | 2 |
Measured reflections (#) | 197265 | 501457 | 648645 | 368127 |
Unique Reflections (#) | 14079 | 55036 | 46452 | 25875 |
Data redundancy | 14.0 (12.6) | 9.1 (4.0) | 14.0 (11.0) | 14.2 (11.6) |
Data completeness (%) | 100 (100) | 98.8 (94.7) | 87.9 (57.6) | 99.8 (99.8) |
Rsym (%) | 14.8 (36.3) | 3.3 (8.6) | 4.8 (18.2) | 8.7 (25.5) |
I/sig | 26.5 (7.2) | 76.9 (22.6) | 75.5 (17.3) | 42.3 (9.5) |
Refinement | ||||
R factor/R free | 25.41/31.12 | 18.22/20.67 | 21.90/25.81 | 21.51/27.49 |
Number of protein atoms | 4330 | 4830 | 4452 | 4570 |
Number of non-protein/solvent atoms | 74 | 62 | 72 | 84 |
Number of solvent atoms | 2 | 258 | 182 | 38 |
Rmsd bond length (Å) | 0.002 | 0.008 | 0.007 | 0.009 |
Rmsd bond angle (°) | 0.467 | 0.969 | 0.882 | 1.109 |
PDB ID | 5UHN | 5UI0 | 5UGL | 5UGX |
-
The value in parenthesis refer to the highest resolution shell.
Table 2
Summary of FGFR kinase single and double mutations used in the article.
FGFR2K single mutation | Location |
|---|---|
M537I | αC tether |
M537A | αC tether |
M540A | αC tether |
I547V (I544V in FGFR1K) | DFG latch |
L617M | DFG latch |
L617F | DFG latch |
L617V (L614V in FGFR1K) | DFG latch |
N549K | molecular brake |
N549H | molecular brake |
N549T | molecular brake |
E565A | molecular brake |
K641R | molecular brake |
D650A | αC tether |
D650L | αC tether |
D650V | αC tether |
D650I | αC tether |
D650G | aC tether |
K659E (K650E in FGFR3K) | A-loop |
K659M | A-loop |
FGFR2K Double Mutations | Locations |
N549H/E565A | molecular brake / molecular brake |
K659M/E565A | A-loop / molecular brake |
D650V/E565A | αC tether / molecular brake |
M537I/E565A | αC tether / molecular brake |
D650V/M537I | αC tether / αC tether |
I547V/M537I | DFG latch / αC tether |
L617M/D650V | DFG latch / αC tether |
I547V/E565A | DFG latch / molecular brake |
L617M/E565A | DFG latch / molecular brake |
Download links
A two-part list of links to download the article, or parts of the article, in various formats.
Downloads (link to download the article as PDF)
Open citations (links to open the citations from this article in various online reference manager services)
Cite this article (links to download the citations from this article in formats compatible with various reference manager tools)
Elucidation of a four-site allosteric network in fibroblast growth factor receptor tyrosine kinases
eLife 6:e21137.
https://doi.org/10.7554/eLife.21137


