RAGE deficiency predisposes mice to virus-induced paucigranulocytic asthma
- University of Queensland, Australia
- Sydney Medical School, University of Sydney, Australia
- The University of Queensland, Australia
- Queensland University of Technology, Australia
- QIMR Berghofer Medical Research Institute, Australia
- The University of Queensland, Princess Alexandra Hospital Brisbane, Australia
- Graduate School of Health, University of Technology Sydney, Australia
Figures
Figure 1
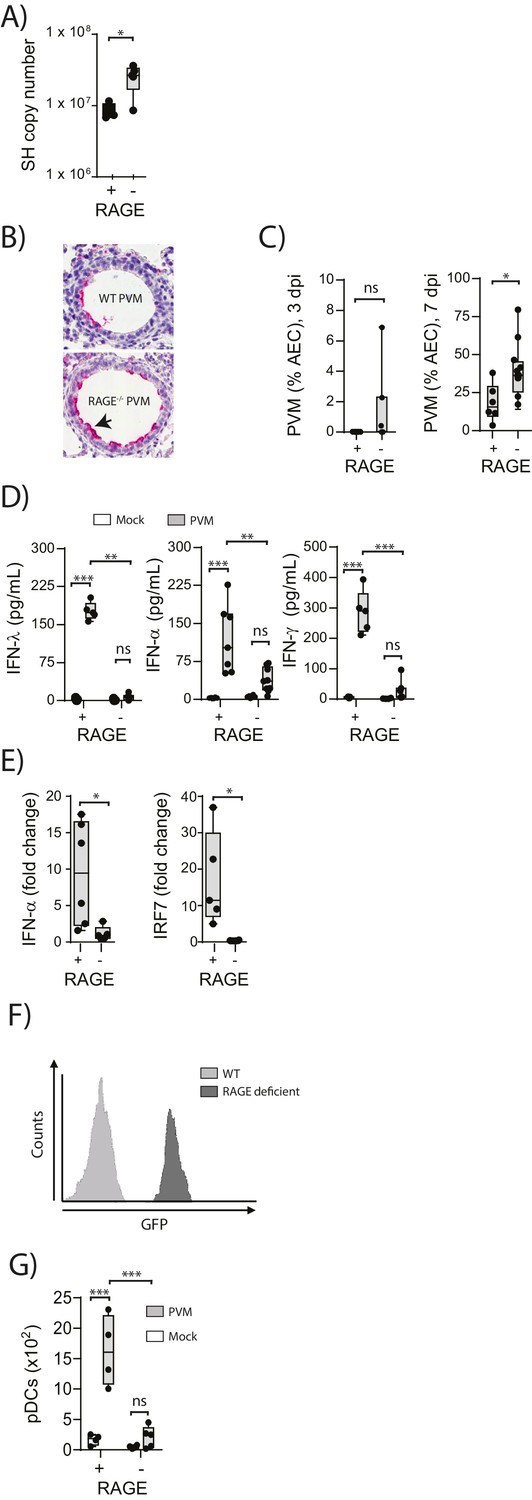
Increased virus replication and defective innate immunity in PVM-infected neonatal RAGE deficient mice.
(A) RAGE deficient (RAGE−) and WT (RAGE+) mice were infected with 10 PFU of PVM at seven days of age and the viral load in the lungs (as determined by qPCR) was assessed 7 days post-infection (dpi). (B) Representative images of PVM staining in the lungs of WT and RAGE deficient mice seven dpi. Arrow indicates positive staining. (C) Percentage of airway epithelial cells (AECS) positive for PVM by immunohistochemistry. (D) Interferon levels in the bronchoalveolar lavage fluid of neonatal mice seven days post-PVM or mock infection (i.e. at 14-days of age). (E) The expression of IFN-α4 and IRF7 in the lungs of RAGE deficient and WT mice seven dpi. The expression of IFN-α4 and IRF7 was determined using the ΔΔCt method where naïve WT and RAGE deficient mice were used as the calibrator samples. (F) Histogram demonstrating GFP expression by plasmacytoid dendritic cells (pDCs) derived from naïve adult RAGE deficient and WT mice. pDCs were defined as CD11c+CD11b-B220+SiglecH+CD45RA+ cells. (G) The number of pDCs presents in the lungs of neonatal mice seven days post-PVM or mock infection (i.e. at 14-days of age). Statistical significance was determined by a Student’s t-test (A, C and E) or a two-way ANOVA with Tukey’s multiple comparisons test (D and G). Statistical significance is denoted by asterisks (*p<0.05;**p<0.01; ***p<0.001; ns: not significant). Box and whisker plots show the minimum value, the median and the maximum value. Data are representative of two independent experiments. n = 3–10.
Figure 2
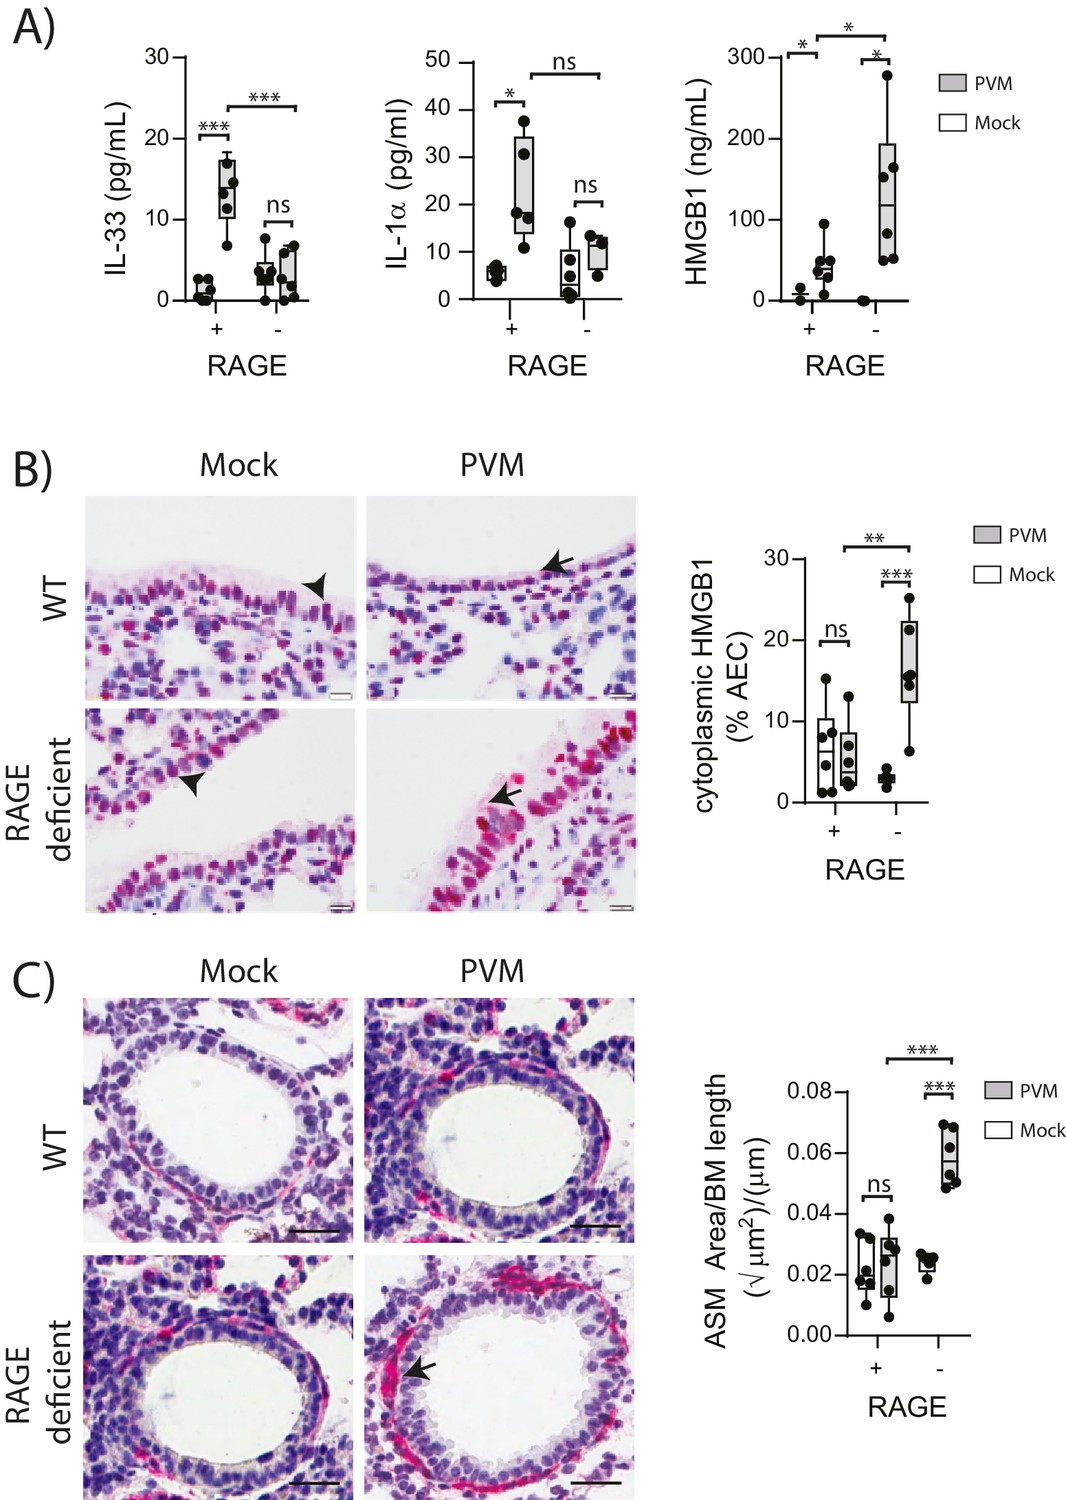
PVM-infected neonatal RAGE deficient mice have higher levels of cytoplasmic and extracellular HMGB1.
(A) Levels of alarmins in the bronchoalveolar lavage fluid of neonatal mice. RAGE deficient (RAGE−) and WT (RAGE+) mice were infected with 10 PFU of PVM or mock at 7 days of age and alarmin levels were assessed seven dpi. (B) Representative images of mouse lung tissue sections stained for HMGB1 seven dpi (i.e. at 14-days of age). Original magnification x400 and scale bars indicate 20 μm. HMGB1 staining is shown in red whilst the nucleus is stained in blue. Arrows indicate cytoplasmic HMGB1, arrowheads indicate nuclear HMGB1. The percentage of airway epithelial cells (AECs) with cytoplasmic HMGB1 was quantified as described in the materials and methods. (C) Representative images of mouse lung tissue sections stained for smooth muscle actin seven dpi (i.e. at 14-days of age). Original magnification x400 and scale bars indicate 20 μm. Smooth muscle staining is shown in red whilst the nucleus is stained in blue. Arrow indicates positive staining. The airway smooth muscle area (ASM) was calculated relative to the basement membrane (BM) length of small airways. Statistical significance was determined by a two-way ANOVA with Tukey’s multiple comparisons test. Statistical significance is denoted by asterisks (*p<0.05;**p<0.01; ***p<0.001; ns: not significant). Box and whisker plots show the minimum value, the median and the maximum value. Data are representative of two independent experiments. n = 3–6.
Figure 3
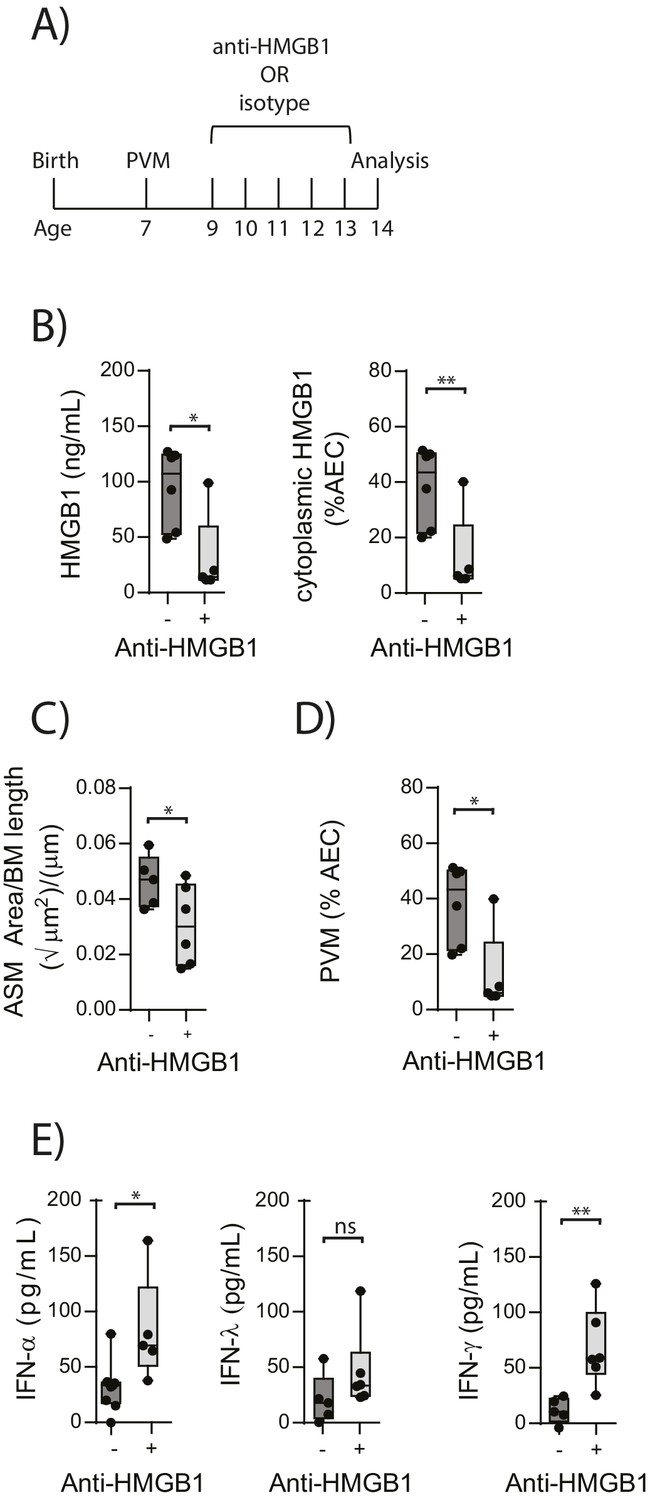
Blocking HMGB1 reduces ASM mass and virus replication in neonatal, PVM-infected RAGE deficient mice.
(A) Schematic representation of the experimental protocol. Neonatal RAGE deficient mice were infected with 10 PFU of PVM at 7 days of age and treated with 50 µg of anti-HMGB1 or an IgG isotype control once per day from two to six days post-infection. (B) Levels of extracellular HMGB1 in the bronchoalveolar lavage fluid of treated mice seven days post-PVM infection. The percentage of airway epithelial cells (AECs) with cytoplasmic HMGB1 in treated mice is also displayed seven days post-PVM infection. (C) Lung sections were obtained from treated mice seven days post-PVM infection (i.e. at 14-days of age). These were then stained for smooth muscle actin by immunohistochemistry and the airway smooth muscle area (ASM) was calculated relative to the basement membrane (BM) length of small airways. (D) Percentage of airway epithelial cells (AECS) positive for PVM in treated mice seven days post-PVM infection (i.e. at 14-days of age). (E) Interferon levels in the bronchoalveolar lavage fluid of treated mice seven days post-PVM infection (i.e. at 14-days of age). Statistical significance was determined by a Student’s t-test. Statistical significance is denoted by asterisks (*p<0.05;**p<0.01; ***p<0.001; ns: not significant). Box and whisker plots show the minimum value, the median and the maximum value. Data are derived from a single experiment. n = 5–7.
Figure 4
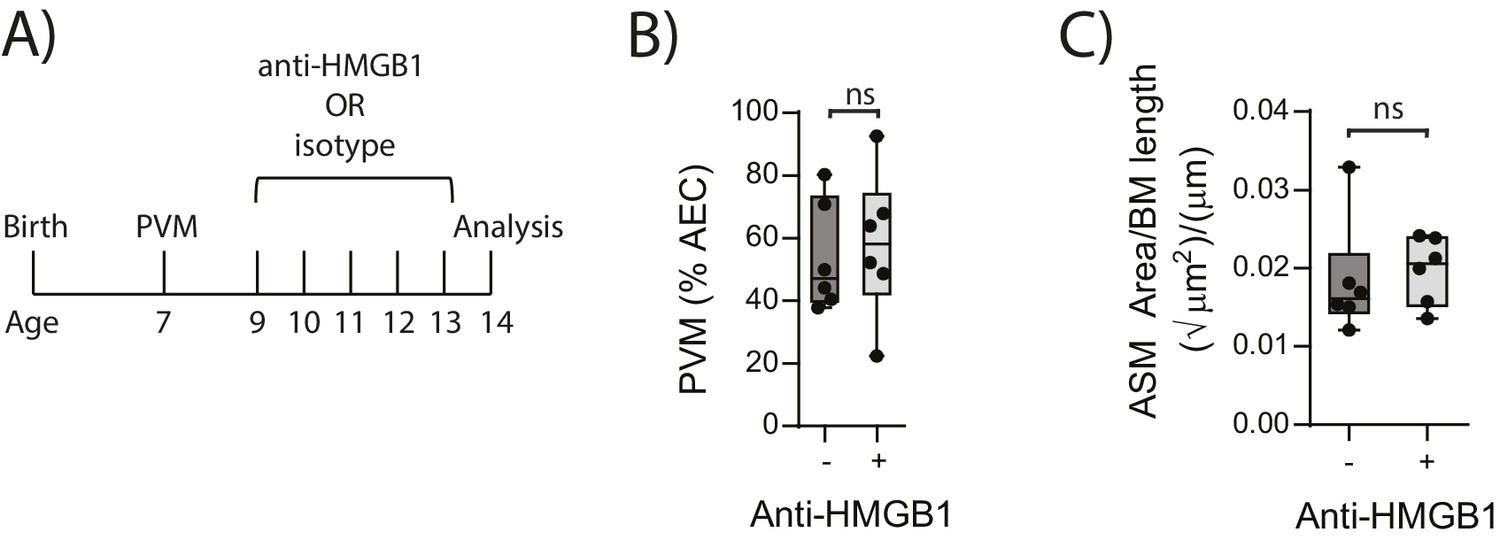
Blocking HMGB1 does not reduce ASM mass and virus replication in neonatal, PVM-infected WT mice.
(A) Schematic representation of the experimental protocol. Neonatal WT mice were infected with 10 PFU of PVM at seven days of age and treated with 50 µg of anti-HMGB1 or an IgG isotype control once per day from two to six days post-infection. (B) Percentage of airway epithelial cells (AECS) positive for PVM in treated mice seven days post-PVM infection (i.e. at 14-days of age). (C) Lung sections were obtained from treated mice seven days post-PVM infection (i.e. at 14-days of age). These were then stained from smooth muscle actin by immunohistochemistry and the airway smooth muscle area (ASM) was calculated relative to the basement membrane (BM) length of small airways. Statistical significance was determined by a Student’s t-test. Statistical significance is denoted by asterisks (*p<0.05;**p<0.01; ***p<0.001; ns: not significant). Box and whisker plots show the minimum value, the median and the maximum value. Data are derived from a single experiment. n = 6.
Figure 5
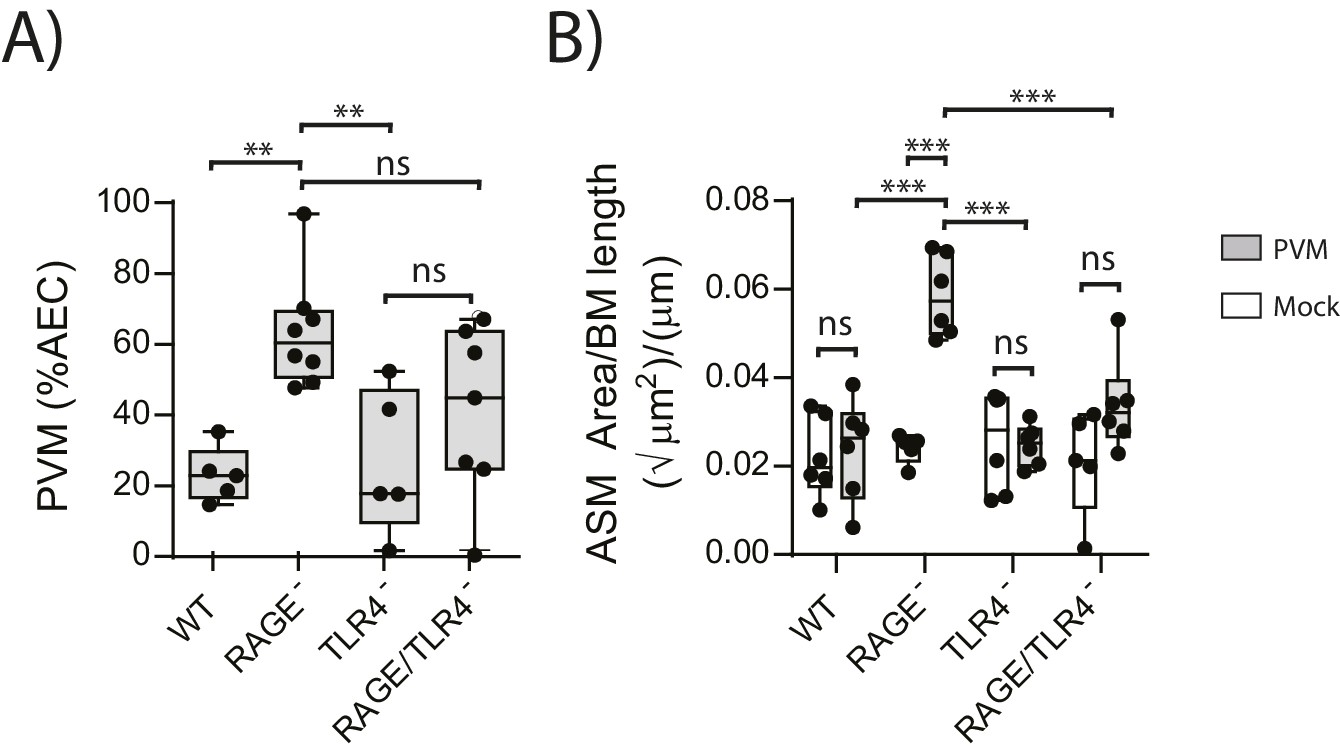
ASM mass is reduced in PVM-infected RAGE/TLR4 deficient mice.
(A) Percentage of airway epithelial cells (AECS) positive for PVM by immunohistochemistry. RAGE deficient, WT (RAGE+), TLR4 deficient and RAGE/TLR4 deficient mice were infected with 10 PFU of PVM at 7 days of age and the viral infection was assessed seven days post-infection. (B) Lung sections were obtained from neonatal RAGE deficient, WT, TLR4 deficient and RAGE/TLR4 deficient mice seven days post-PVM infection (i.e. at 14-days of age). These were then stained from smooth muscle actin by immunohistochemistry and the airway smooth muscle area (ASM) was calculated relative to the basement membrane (BM) length of small airways. Statistical significance was determined by a two-way ANOVA with Tukey’s multiple comparisons test. Statistical significance is denoted by asterisks (*p<0.05;**p<0.01; ***p<0.001; ns: not significant). Box and whisker plots show the minimum value, the median and the maximum value. Data are representative of two independent experiments. n = 5–8.
Figure 6
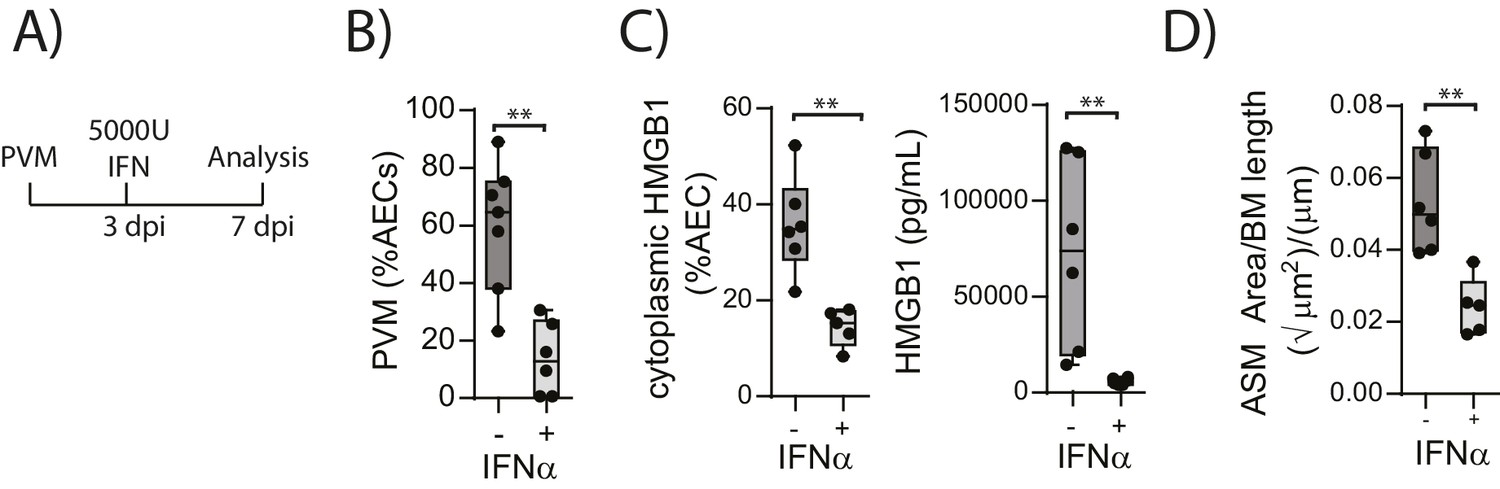
Interferon supplementation reduces virus replication, levels of extracellular HMGB1 and ASM mass and in neonatal, PVM-infected RAGE deficient mice.
(A) Schematic representation of the experimental protocol. Neonatal RAGE deficient mice were infected with 10 PFU of PVM at seven days of age. Three days post-infection 5000 U of IFN-α or diluent only was administered intranasally to the mice. (B) Percentage of airway epithelial cells (AECS) positive for PVM in treated mice seven days post-PVM infection (i.e. at 14-days of age). (C) The percentage of airway epithelial cells (AECs) with cytoplasmic HMGB1 seven days post-PVM infection in treated mice. Levels of extracellular HMGB1 in the bronchoalveolar lavage fluid of treated mice seven days post-PVM infection is also displayed. (D) Lung sections were obtained from treated mice seven days post-PVM infection (i.e. at 14-days of age). These were then stained for smooth muscle actin by immunohistochemistry and the airway smooth muscle area (ASM) was calculated relative to the basement membrane (BM) length of small airways. Statistical significance was determined by a Student’s t-test. Statistical significance is denoted by asterisks (*p<0.05;**p<0.01; ***p<0.001; ns: not significant). Box and whisker plots show the minimum value, the median and the maximum value. Data are representative of two independent experiments. n = 5–7.
Figure 7

Neonatal RAGE deficient mice do not display a pronounced TH2 response to an early life infection with PVM.
RAGE deficient and WT (RAGE+) mice were infected with 10 PFU of PVM or mock at seven days of age and the inflammatory profile was assessed seven days post-infection (A) Inflammatory cells in the bronchoalveolar lavage fluid were enumerated by differential counting following Geimsa staining. (B) Cytokine levels in the bronchoalveolar lavage fluid of neonatal mice seven days post-PVM or mock infection (i.e. at 14-days of age). (C) Cytokine levels in the lungs of neonatal mice seven days post-PVM or mock infection (i.e. at 14-days of age). Statistical significance was determined by a one-way ANOVA with Tukey’s multiple comparisons test (A) or a two-way ANOVA (B and C). Statistical significance is denoted by asterisks (*p<0.05;**p<0.01; ***p<0.001; ns: not significant). Box and whisker plots show the minimum value, the median and the maximum value. Data are representative two independent experiments. n = 5–10.
Figure 8
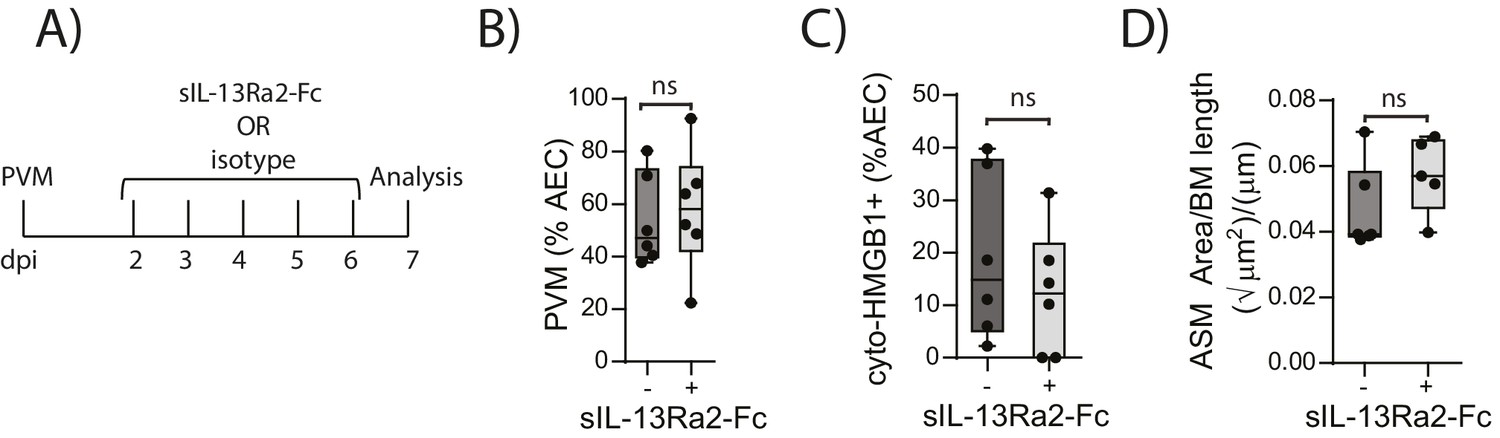
Blocking IL-13 does not reduce ASM mass and virus replication in neonatal, PVM-infected RAGE deficient mice.
(A) Schematic representation of the experimental protocol. Neonatal RAGE deficient mice were infected with 10 PFU of PVM at seven days of age and treated i.p. with 100 µg of sIL-13Ra2-Fc or an IgG isotype control once per day from two to six days post-infection. (B) Percentage of airway epithelial cells (AECS) positive for PVM in treated mice seven days post-PVM infection (i.e. at 14-days of age). (C) The percentage of airway epithelial cells (AECs) with cytoplasmic HMGB1 in treated mice seven days post-PVM infection. (D) Lung sections were obtained from treated mice seven days post-PVM infection (i.e. at 14-days of age). These were then stained for smooth muscle actin by immunohistochemistry and the airway smooth muscle area (ASM) was calculated relative to the basement membrane (BM) length of small airways.). Statistical significance was determined by a Student’s t-test. Statistical significance is denoted by asterisks (*p<0.05;**p<0.01; ***p<0.001; ns: not significant). Box and whisker plots show the minimum value, the median and the maximum value. Data are derived from a single experiment. n = 5–6.
Figure 9
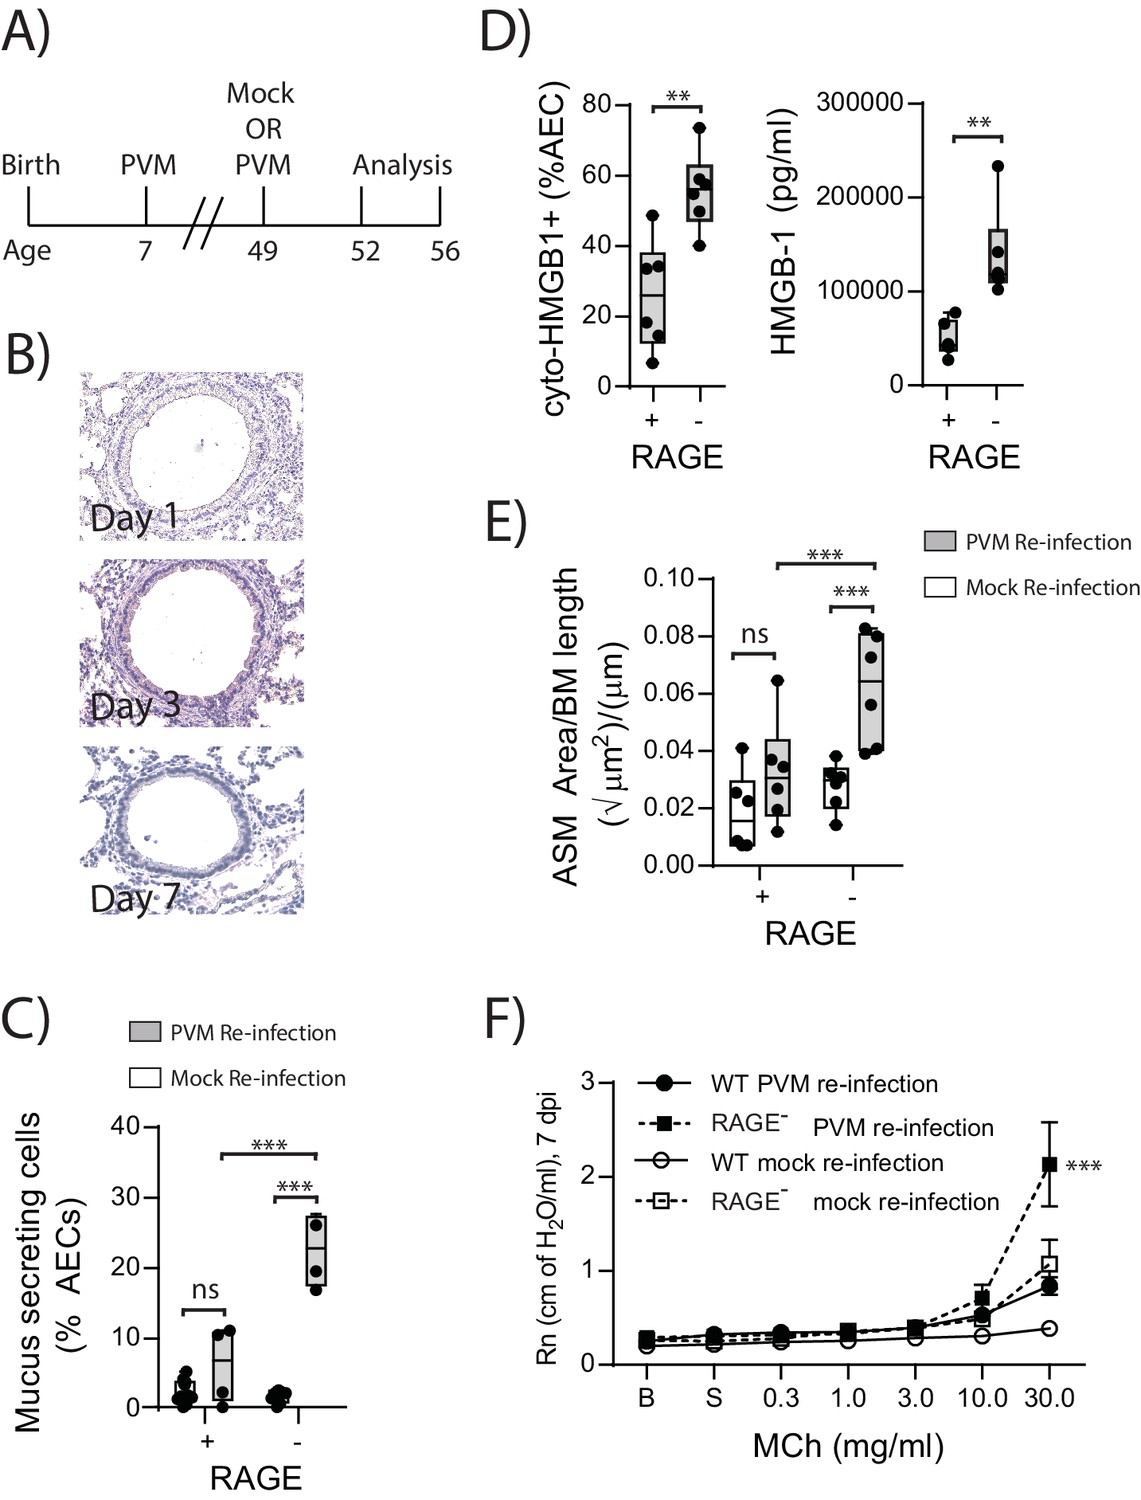
Reinfection with PVM induces the cardinal features of asthma in adult RAGE deficient mice.
(A) Schematic representation of the experimental protocol. Neonatal WT (RAGE+) and RAGE deficient mice were inoculated with PVM (10 PFU) or mock at seven days of age and later re-infected with PVM (100 PFU) or mock 42 days after the primary infection. (B) Representative images of PVM staining in the lungs of RAGE deficient mice at various timepoints post-infection. (C) Percentage of airway epithelial cells (AECs) producing mucus was quantified by immunohistochemistry at seven days post-reinfection (i.e. at 56-days of age). (D) The percentage of airway epithelial cells (AECs) with cytoplasmic HMGB1 three days post re-infection (i.e. at 52-days of age). Levels of extracellular HMGB1 in the bronchoalveolar lavage fluid of mice three days post re-infection (i.e. at 52-days of age) are also displayed. (E) Lung sections from WT and RAGE deficient mice seven days post re-infection (i.e. at 56-days of age) were stained for smooth muscle actin by immunohistochemistry and the airway smooth muscle area (ASM) was calculated relative to the basement membrane (BM) length of small airways. (F) Airway hyperreactivity to increasing doses of aerosolised methacholine (MCh) at seven days post-reinfection (i.e. at 56-days of age). Statistical significance was determined by a two-way ANOVA with Tukey’s multiple comparisons test (B, D and E) or a Student’s t-test (C). Statistical significance is denoted by asterisks (*p<0.05;**p<0.01; ***p<0.001; ns: not significant). Box and whisker plots show the minimum value, the median and the maximum value. Data are representative of two independent experiments. n = 3–6.
Figure 10
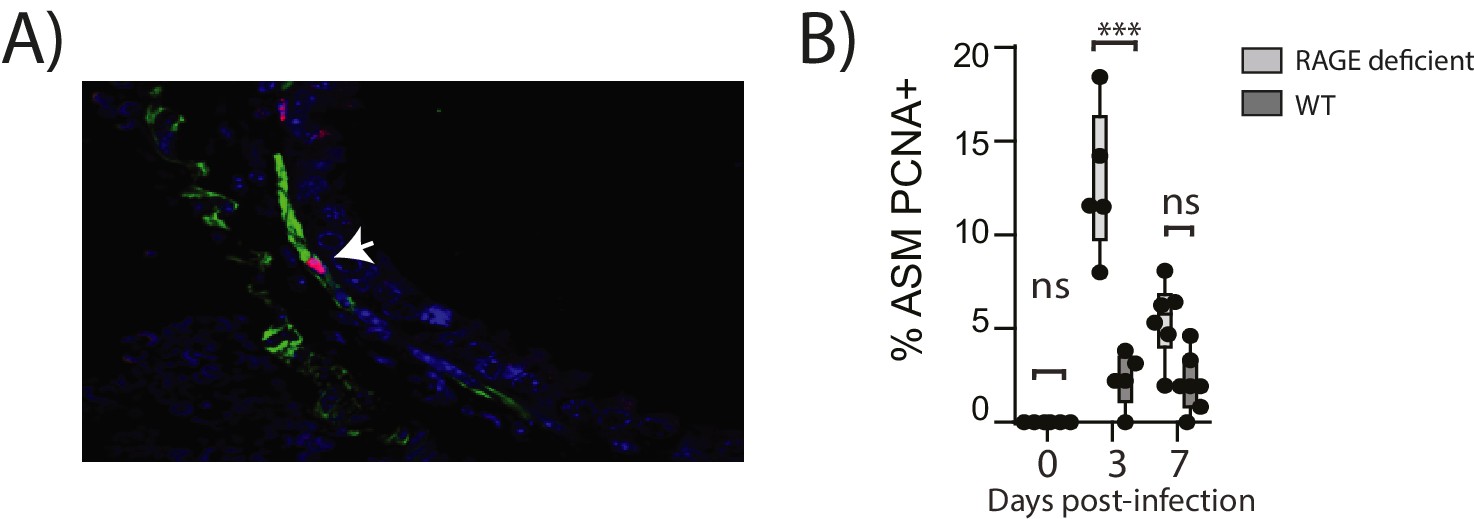
Reinfection with PVM induces airway smooth muscle proliferation in RAGE deficient mice.
Neonatal mice were infected with PVM (10 PFU) at seven days of age and later re-infected with PVM (100 PFU) 42 days after the primary infection. (A) Representative immunofluorescent image (60X magnification) showing ASM cell proliferation in RAGE deficient mice three days post re-infection (i.e. at 52 days of age). ASM (green), PCNA (red) and DAPI (blue). Arrow indicates positive PCNA staining (H) The percentage of airway smooth muscle (ASM) cells positive for PCNA overtime. Statistical significance was determined by a two-way ANOVA with Tukey’s multiple comparisons test. Statistical significance is denoted by asterisks (*p<0.05;**p<0.01; ***p<0.001; ns: not significant). Box and whisker plots show the minimum value, the median and the maximum value. Data are representative of two independent experiments. n = 5–7.
Figure 11
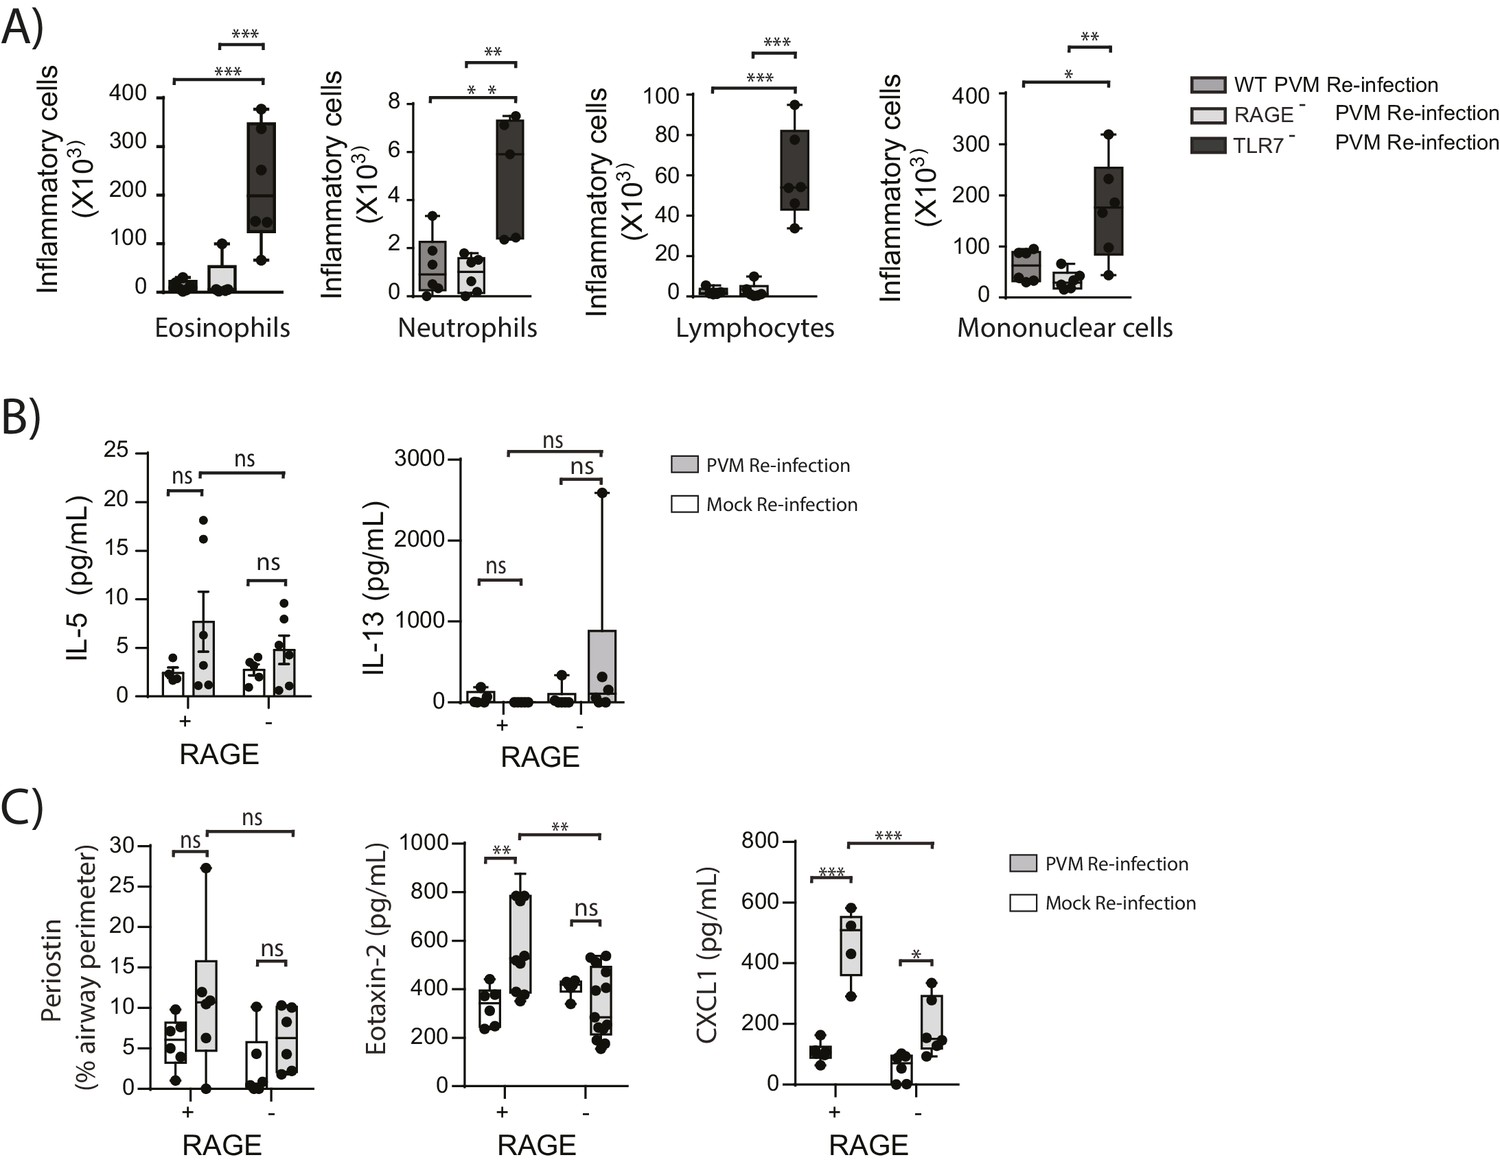
RAGE deficient mice do not display a pronounced TH2 response upon re-infection with PVM.
Neonatal WT (RAGE+), TLR7 deficient and RAGE deficient mice were infected with PVM (10 PFU) or mock at seven days of age and later re-infected with PVM (100 PFU) or mock 42 days after the primary infection. (A) Inflammatory cells in the bronchoalveolar lavage fluid were enumerated by differential counting following Geimsa staining seven days post-reinfection (i.e. at 56-days of age). (B) Cytokine levels in the bronchoalveolar lavage fluid of neonatal mice seven days post-re infection (i.e. at 56-days of age). (C) Cytokine levels in the lungs of neonatal mice seven days post- reinfection (i.e. at 56-days of age). Periostin levels were determined by immunohistochemistry and quantified as a percentage of the epithelial basement membrane length. Statistical significance was determined by a Student’s t-test (A) and a two-way ANOVA with Tukey’s multiple comparisons test (B and D). Statistical significance is denoted by asterisks (*p<0.05;**p<0.01; ***p<0.001; ns: not significant). Box and whisker plots show the minimum value, the median and the maximum value. Data are representative of two independent experiments. n = 4–9.
Figure 12
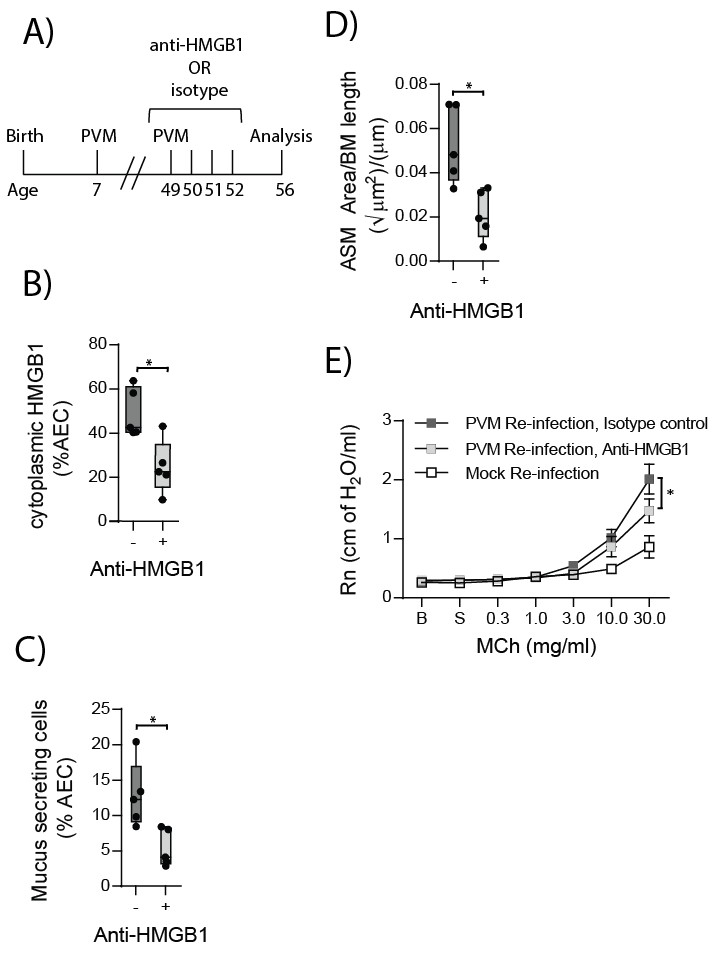
Anti-HMGB1 treatment following re-infection with PVM protects against asthma development in RAGE deficient mice.
(A) Schematic representation of the experimental protocol. RAGE deficient mice were infected with 10 PFU of PVM at seven days of age and later re-infected with 100 PFU of PVM 42 days post-primary infection. RAGE deficient mice were treated once per day from day zero to day four post-reinfection with 50 µg of an anti-HMGB1 antibody or an IgG isotype control. (B) The percentage of airway epithelial cells (AECs) with cytoplasmic HMGB1 seven days post-PVM re-infection in treated mice (i.e. at 56-days of age). (C) Percentage of airway epithelial cells (AECs) producing mucus in the lungs of treated mice was quantified by immunohistochemistry at seven days post-reinfection (i.e. at 56-days of age). (D) Lung sections were obtained from treated mice seven days post re-infection (i.e. at 56-days of age). These were then stained for smooth muscle actin by immunohistochemistry and the airway smooth muscle area (ASM) was calculated relative to the basement membrane (BM) length of small airways. (E) Airway hyperreactivity to increasing doses of aerosolised methacholine (MCh) in treated mice at seven days post-reinfection (i.e. at 56-days of age). Statistical significance was determined by a Student’s t-test (A–C) and a two-way ANOVA with Tukey’s multiple comparisons test (D). Statistical significance is denoted by asterisks (*p<0.05;**p<0.01; ***p<0.001; ns: not significant). Box and whisker plots show the minimum value, the median and the maximum value. Data are derived from a single experiment. n = 5.
Figure 13
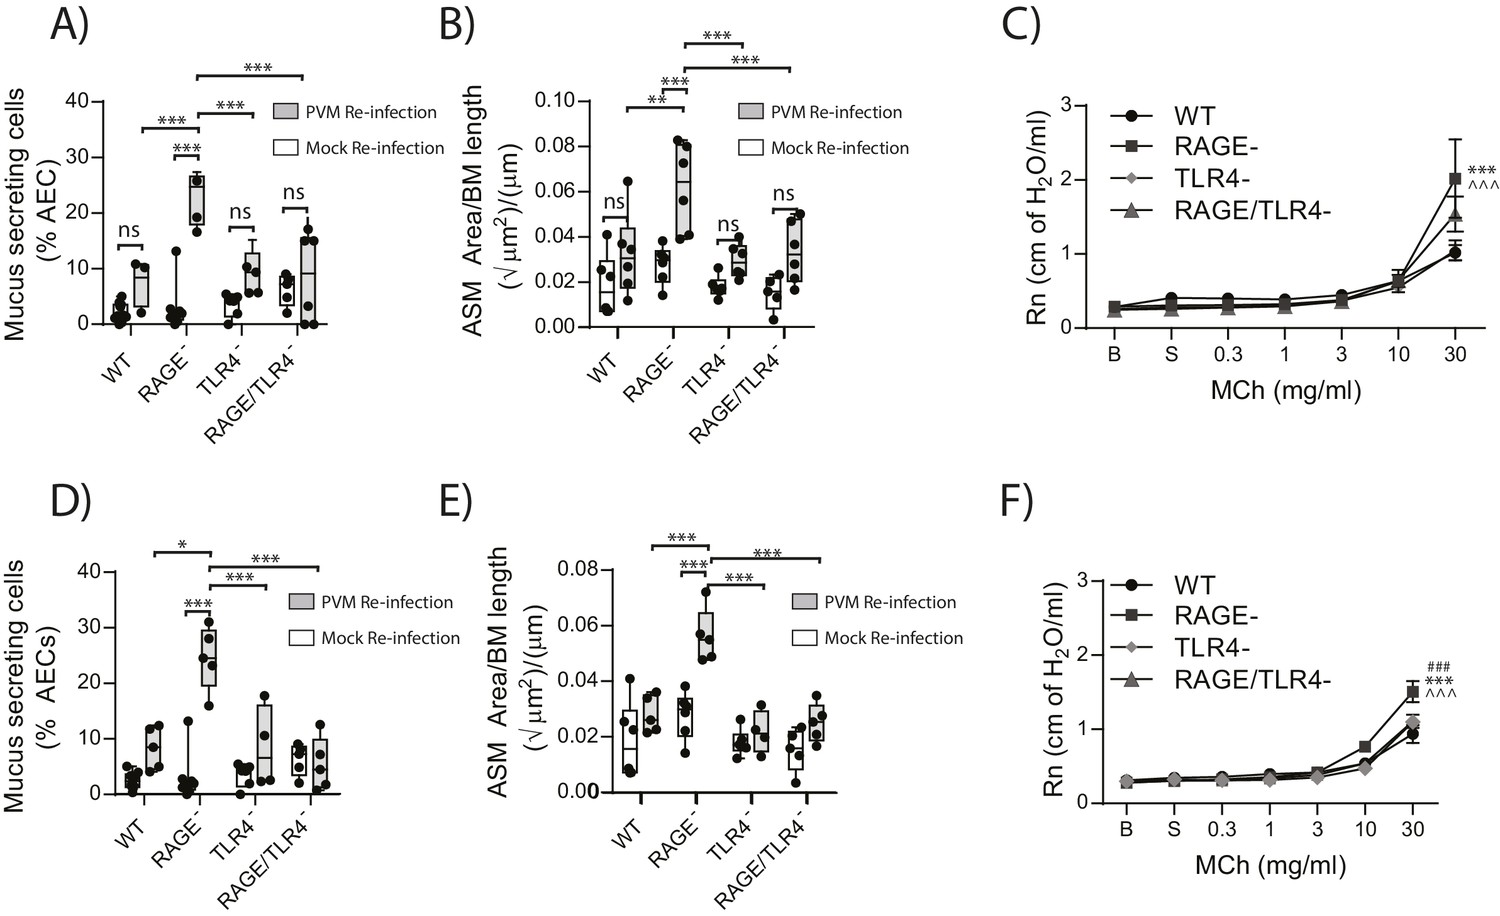
RAGE/TLR4 deficient mice are protected from asthma development following re-infection with PVM.
Neonatal mice were infected with PVM (10 PFU) or mock at seven days of age and later re-infected with PVM (100 PFU) or mock 42 days after the primary infection. (A) Percentage of airway epithelial cells (AECs) producing mucus in the lungs of treated mice was quantified by immunohistochemistry at seven days post-reinfection (i.e. at 56-days of age) and (D) 21 days post-reinfection (i.e. at 70-days of age). (B) Lung sections were obtained from WT and RAGE deficient mice seven days post re-infection (i.e. at 56-days of age) and (E) 21 days post-reinfection (i.e. at 70-days of age). These were then stained for smooth muscle actin by immunohistochemistry and the airway smooth muscle area (ASM) was calculated relative to the basement membrane (BM) length of small airways. (C) Airway hyperreactivity to increasing doses of aerosolised methacholine (MCh) in treated mice at seven days post-reinfection (i.e. at 56-days of age). Statistical significance is denoted by asterisks (one symbol p<0.05;two symbols p<0.01; three symbols p<0.001; ns: not significant). Statistical significance is shown relative to WT mice (*) and TLR4 deficient (∧) mice. (F) Airway hyperreactivity to increasing doses of aerosolised methacholine (MCh) in treated mice at 21 days post-reinfection (i.e. at 70-days of age). Statistical significance was determined by a two-way ANOVA with Tukey’s multiple comparisons test. Statistical significance is denoted by asterisks (one symbol p<0.05;two symbols p<0.01; three symbols p<0.001; ns: not significant). Statistical significance is shown relative to WT mice (*), TLR4 deficient (∧) and RAGE/TLR4 deficient mice (#). Box and whisker plots show the minimum value, the median and the maximum value. Data are representative of two independent experiments. n = 3–6.
Figure 14

A schematic representation of the proposed model of disease.
During a primary PVM infection, reduced interferon production results in increased virus replication. This is then associated with the release of HMGB1 (assumedly due to virus-induced stress/damage). In a TLR4-dependent fashion, HMGB1 drives the growth of airway smooth muscle (ASM). Upon reinfection with PVM later in life, there is no active virus replication (presumably due to a protective immune response). However, exposure to PVM triggers the production of HMGB1 which then drives ASM growth and mucus production in a TLR4 dependent manner.
Author response image 1

Tables
Table 1
Primary antibodies.
Primary antibody (dilution) | Clone | Supplier |
|---|---|---|
Rabbit anti-PVM glycoprotein (G) antiserum (1:8000) | N/A | Gift from Dr. Ursula Buchholz, NIAID, USA |
Rabbit anti-HMGB1 (1:400) | Ab 18256 | Abcam |
Mouse anti-actinα-smooth muscle (1:400) | 1 A4 | Sigma-Aldrich |
Biotinylated anti-periostin (1:400) | AG-20B-0033B-C100 | AdipoGen |
Table 2
Primers used in the present study.
Primer | Sequence |
|---|---|
IFN-α | FW: accaacagatccagaaggctcaag RV: agtcttcctgggtcagaggaggtt |
IFN-β | FW: agagttacactgcctttgccatcc RV: ccacgtcaatctttcctcttgctt |
IFN-γ | FW: tcttgaaagacaatcaggccatcc RV: gaatcagcagcgactccttttcc |
IFN-λ | FW: gattgccacattgctcagttc RV: cttctcaagcagcctcttctc |
IRF-7 | FW: cttagccgggagcttggatctact RV: cccttgtacatgatggtcacatcc |
HPRT | FW: aggccagactttgttggatttgaa RV: caacttgcgctcatcttaggcttt |
TNF-α | FW: gtctactgaacttcggggtgatcg RV: agccttgtcccttgaagagaacct |
PVM (SH domain) | FW: gcctgcatcaacacagtgtgt RV: gcctgatgtggcagtgctt |
Download links
A two-part list of links to download the article, or parts of the article, in various formats.
Downloads (link to download the article as PDF)
Open citations (links to open the citations from this article in various online reference manager services)
Cite this article (links to download the citations from this article in formats compatible with various reference manager tools)
RAGE deficiency predisposes mice to virus-induced paucigranulocytic asthma
eLife 6:e21199.
https://doi.org/10.7554/eLife.21199


