Replication Study: BET bromodomain inhibition as a therapeutic strategy to target c-Myc
- Northwestern University, United States
Figures
Figure 1
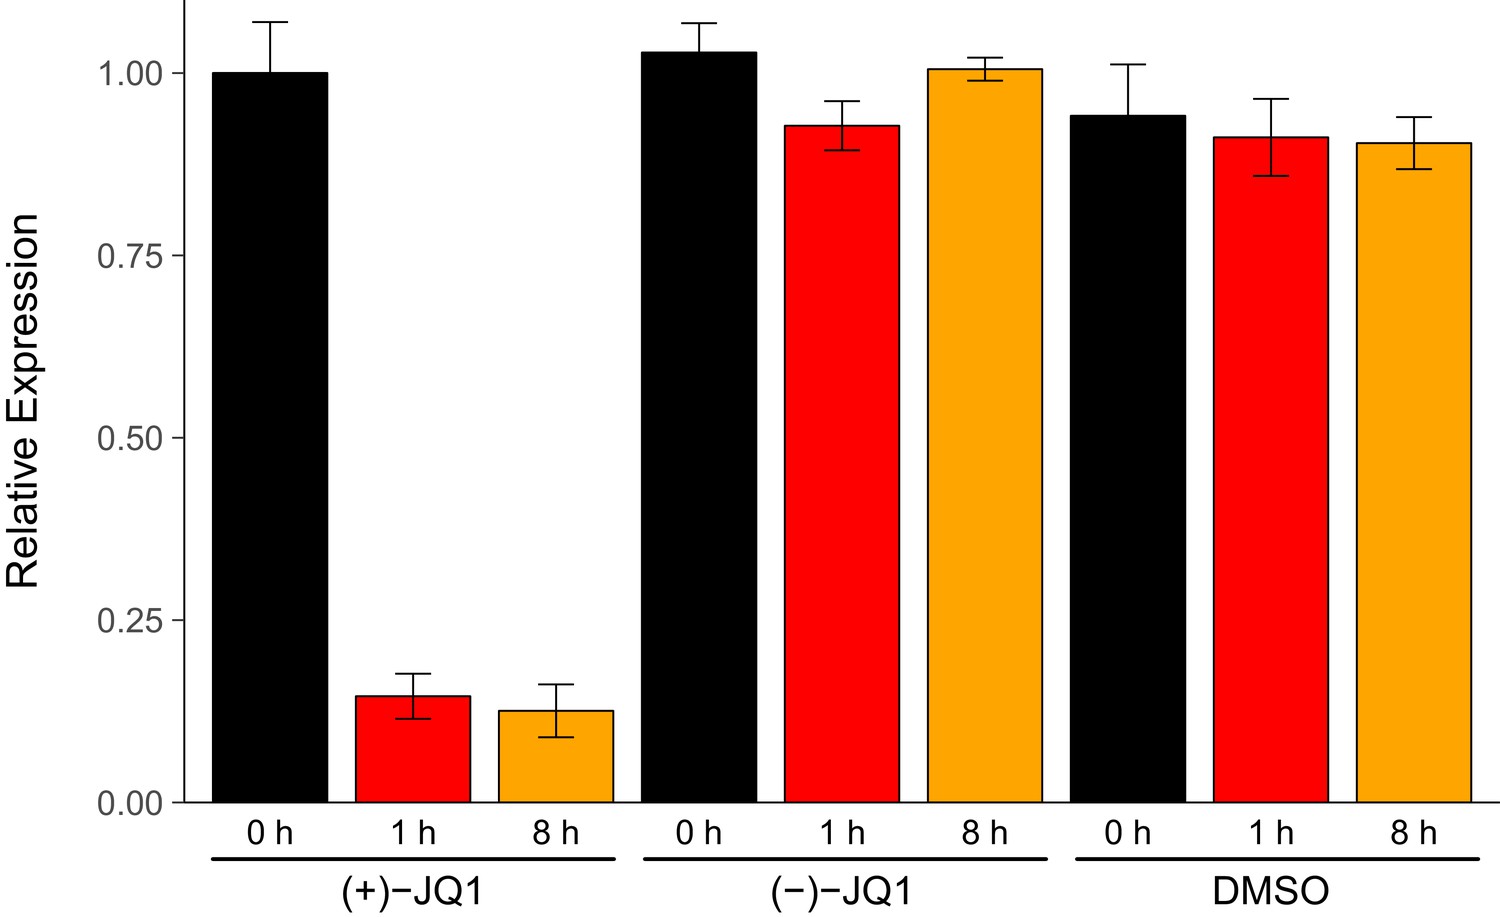
MYC expression in JQ1-treated MM.1S-luc cells.
MM.1S-luc cells were treated with 500 nM (+)-JQ1, 500 nM (−)-JQ1, or an equivalent volume of DMSO. Total RNA was isolated at 0 hr, 1 hr, and 8 hr after treatment and qRT-PCR analysis was performed to detect MYC and GAPDH levels. Relative expression (MYC/GAPDH) is presented for each time point and condition normalized to (+)-JQ1 treated cells at 0 hr. Means reported and error bars represent s.d. from five independent biological repeats. Mixed-design analysis of variance (ANOVA) with time (0 hr, 1 hr, and 8 hr) as the within-subjects factor and treatment ((+)-JQ1, (−)-JQ1, or vehicle) as the between-subjects factor; interaction effect: F(4,24) = 268.9, p=1.49x10⁻¹⁹, treatment main effect: F(2,12) = 393.5, p=1.15x10⁻¹¹, time main effect: F(2, 24) = 368.0, p=9.84x10⁻¹⁹. Planned paired t-test of MM.1S-luc cells harvested 8 hr after (+)-JQ1 treatment compared to cells 0 hr after (+)-JQ1 treatment; t(4) = 38.92, uncorrected p=2.60x10⁻⁶, a priori Bonferroni adjusted significance threshold = 0.025; (Bonferroni corrected p=5.21x10⁻⁶). Planned paired t-test of MM.1S-luc cells harvested 1 hr after (+)-JQ1 treatment compared to cells 0 hr after (+)-JQ1 treatment; t(4) = 25.10, uncorrected p=1.50x10⁻⁵, a priori Bonferroni adjusted significance threshold = 0.025; (Bonferroni corrected p=2.99x10⁻⁵). Additional details for this experiment can be found at https://osf.io/9swnx/.
Figure 2
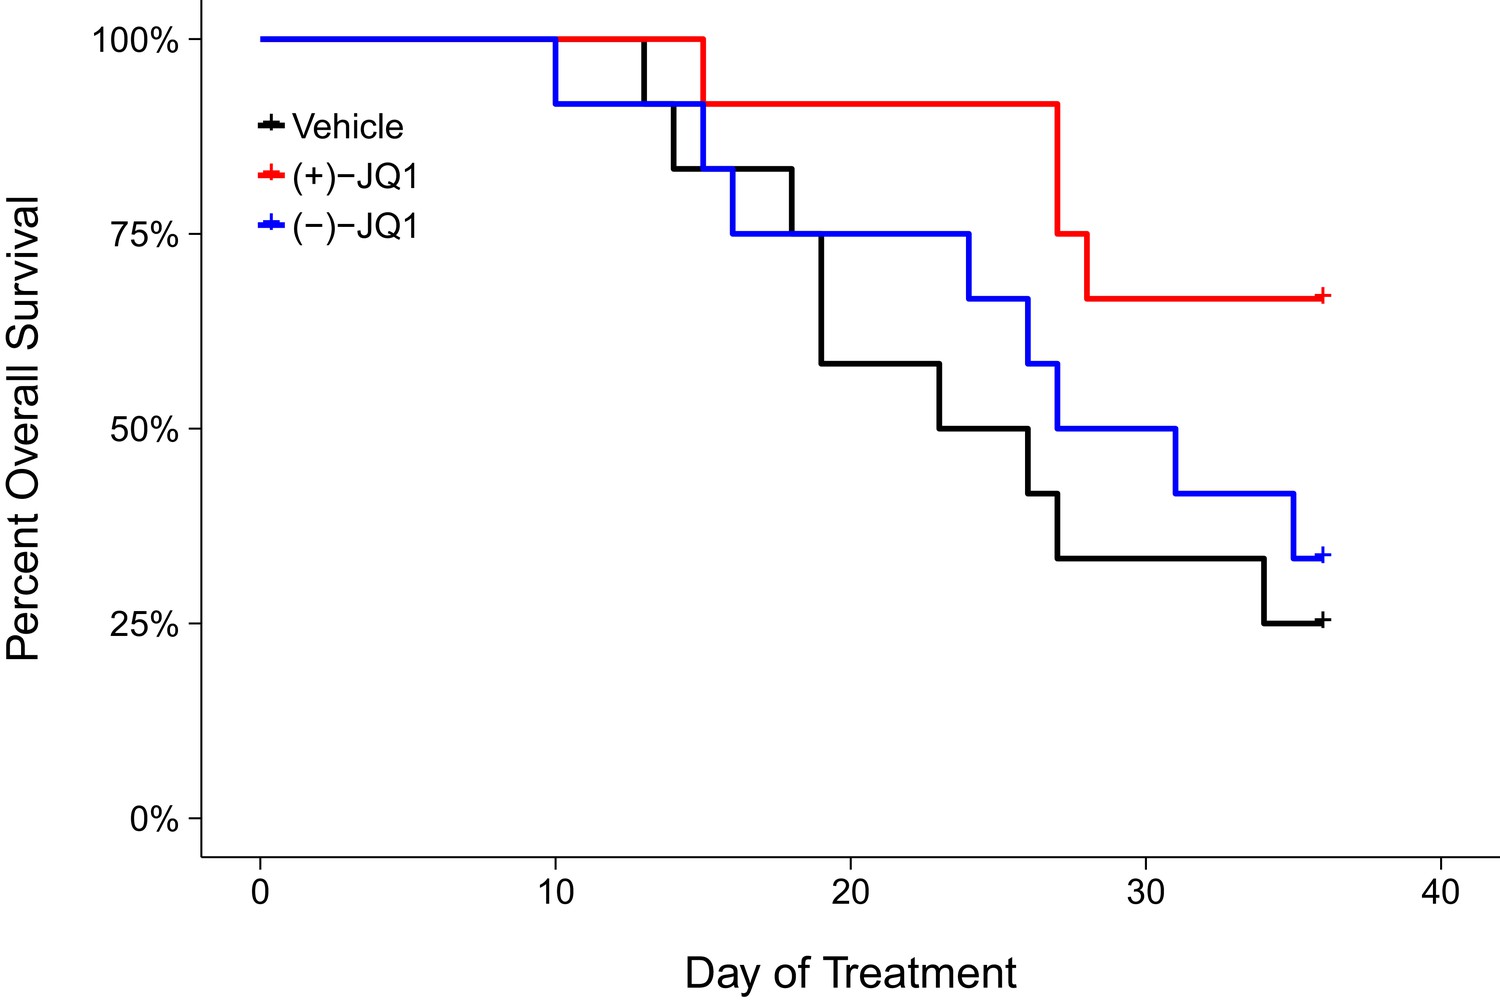
Overall survival in JQ1-treated MM.1S-luc orthotopic xenograft model.
Kaplan-Meier plot of overall survival during the pre-specified study period of 36 days. Female SCID-beige mice with established MM.1S-luc orthotopic xenografts were randomized to daily IP injections of 50 mg/kg (+)-JQ1, 50 mg/kg (−)-JQ1, or vehicle control. Number of mice: n = 12 for each group. Log-rank (Mantel-Cox) test of (+)-JQ1 treatment compared to vehicle control; uncorrected p=0.024, a priori Bonferroni adjusted alpha level = 0.025; (Bonferroni corrected p=0.047). Log-rank (Mantel-Cox) test of (+)-JQ1 compared to (−)-JQ1; uncorrected p=0.093, a priori Bonferroni adjusted alpha level = 0.025; (Bonferroni corrected p=0.187). Additional details for this experiment can be found at https://osf.io/pnvtd/.
Figure 3 with 1 supplement
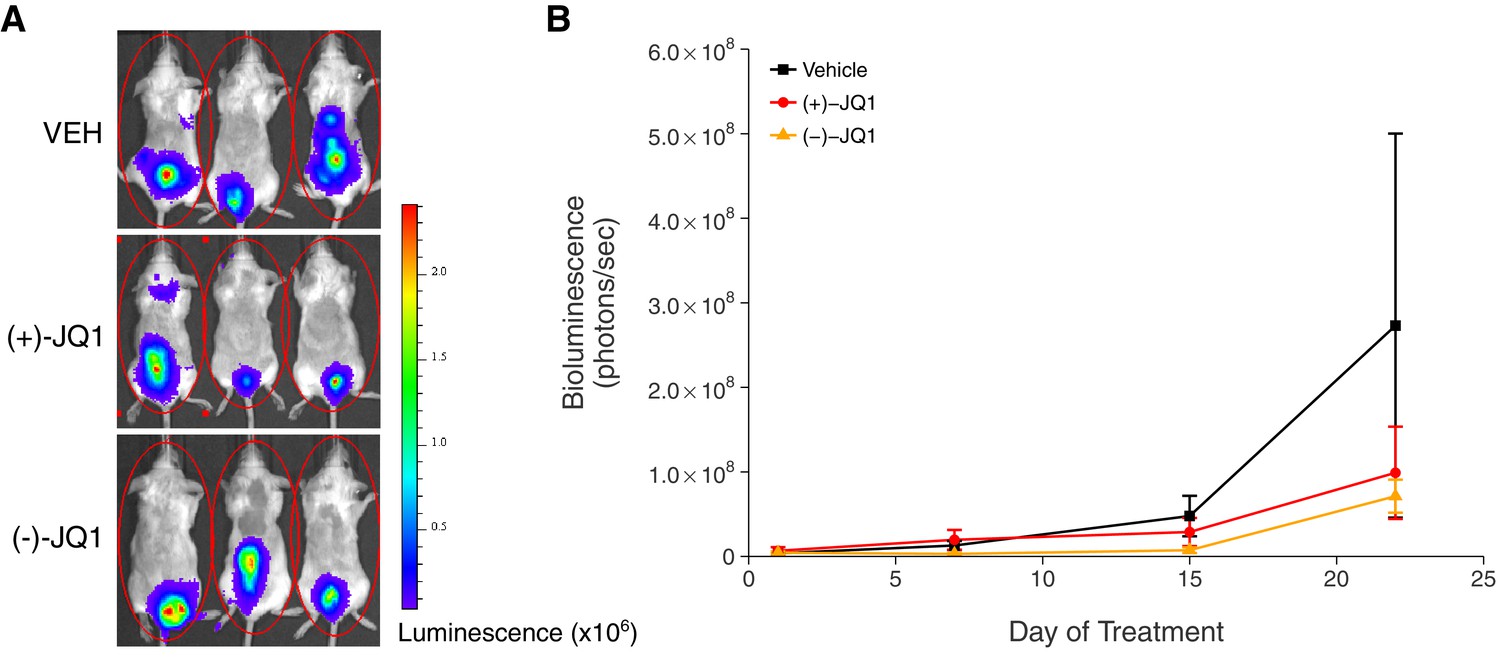
Tumor burden in JQ1-treated MM.1S-luc orthotopic xenograft model.
Female SCID-beige mice were orthotopically xenografted after intravenous injection with MM.1S-luc cells. Following detection of established disease (diffusely engrafted in the skeleton with an increase in bioluminescence), mice were randomly assigned to receive daily IP injections of 50 mg/kg (+)-JQ1, 50 mg/kg (−)-JQ1, or vehicle control (VEH). (A) Representative whole-body bioluminescence images of mice bearing MM.1S tumors 22 days after the start of the indicated treatment. (B) Line graph of tumor burden, as measured by whole-body bioluminescence, of tumor bearing mice during the course of the indicated treatment. Means reported and error bars represent s.e.m. The number of mice per condition at start of treatment (n = 12 for each group) and at day 22 ((+)-JQ1 = 11, (−)-JQ1 = 9, Vehicle = 7). One-way ANOVA on a natural log transformed day 22 bioluminescence signal; F(2,24) = 1.126, p=0.341. The pairwise contrast between (+)-JQ1 treatment and Vehicle; Fisher’s LSD test; t(24) = 1.303, p=0.205 with a priori alpha level = 0.05. The pairwise contrast between (+)-JQ1 and (−)-JQ1 treatment; Fisher’s LSD test; t(24) = 1.221, p=0.234 with a priori alpha level = 0.05. Additional details for this experiment can be found at https://osf.io/pnvtd/.
Figure 3—figure supplement 1
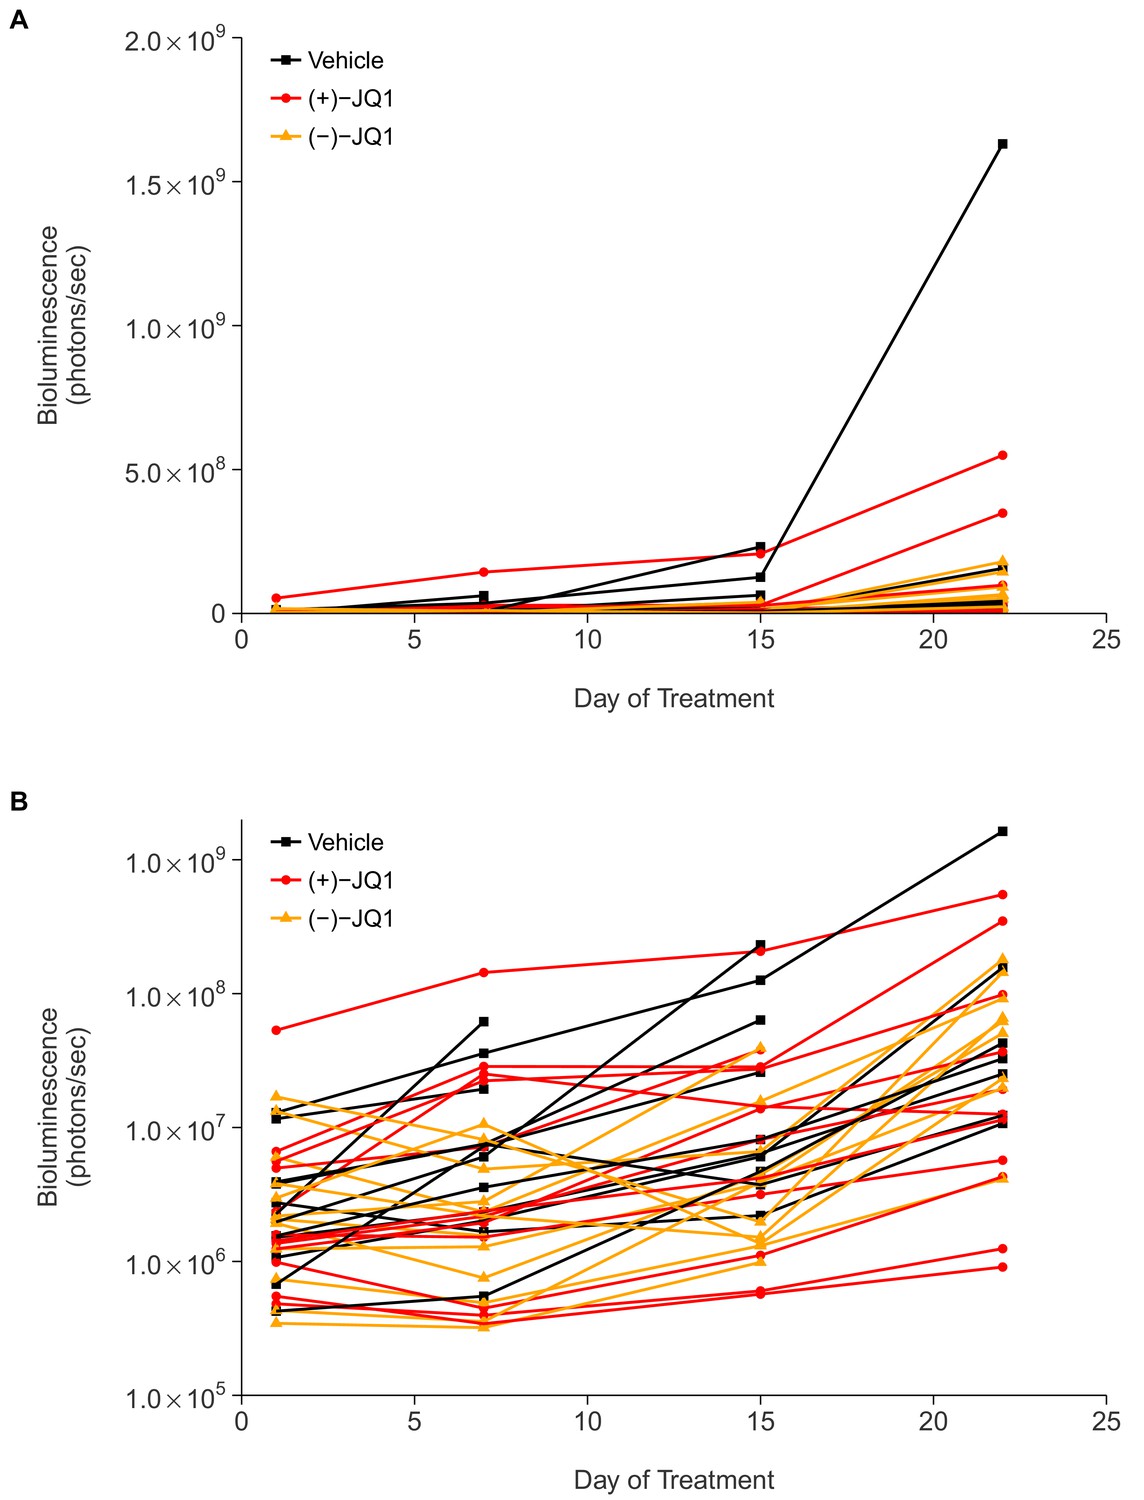
Individual tumor xenografts.
This is the same experiment as in Figure 3, but with the bioluminescence data plotted on a continuous scale (A) or natural log transformed scale (B) for each animal rather than averages. Female SCID-beige mice with established MM.1S-luc orthotopic xenografts were randomly assigned to receive daily IP injections of 50 mg/kg (+)-JQ1, (−)-JQ1, or vehicle control. The number of mice per condition at start of treatment (n = 12 for each group) and at day 22 ((+)-JQ1 = 11, (−)-JQ1 = 9, Vehicle = 7). Additional details for this experiment can be found at https://osf.io/pnvtd/.
Figure 4

Meta-analyses of each effect.
Effect size and 95% confidence interval are presented for (Delmore et al., 2011), this replication study (RP:CB), and a random effects meta-analysis of those two effects. Sample sizes used in Delmore et al. (2011) and this replication attempt are reported under the study name. (A) Relative MYC expression in MM.1S-luc cells treated with 500 nM (+)-JQ1 for 8 hr compared to 0 hr (meta-analysis p=0.224), and the comparison between (+)-JQ1 treatment for 1 hr to 0 hr (meta-analysis p=0.155). (B) HR for mice treated daily with 50 mg/kg (+)-JQ1 compared to vehicle control (meta-analysis p=0.0112). (C) Tumor burden, determined by bioluminescence at day 22, in mice bearing MM.1S-luc tumors and treated daily with 50 mg/kg (+)-JQ1 or vehicle control (meta-analysis p=0.110). Additional details for this experiment can be found at https://osf.io/9snja/.
Download links
A two-part list of links to download the article, or parts of the article, in various formats.
Downloads (link to download the article as PDF)
Open citations (links to open the citations from this article in various online reference manager services)
Cite this article (links to download the citations from this article in formats compatible with various reference manager tools)
Replication Study: BET bromodomain inhibition as a therapeutic strategy to target c-Myc
eLife 6:e21253.
https://doi.org/10.7554/eLife.21253


