Framing of grid cells within and beyond navigation boundaries
- Zanvyl Krieger Mind/Brain Institute, Johns Hopkins University, United States
- Johns Hopkins University, United States
Figures
Figure 1
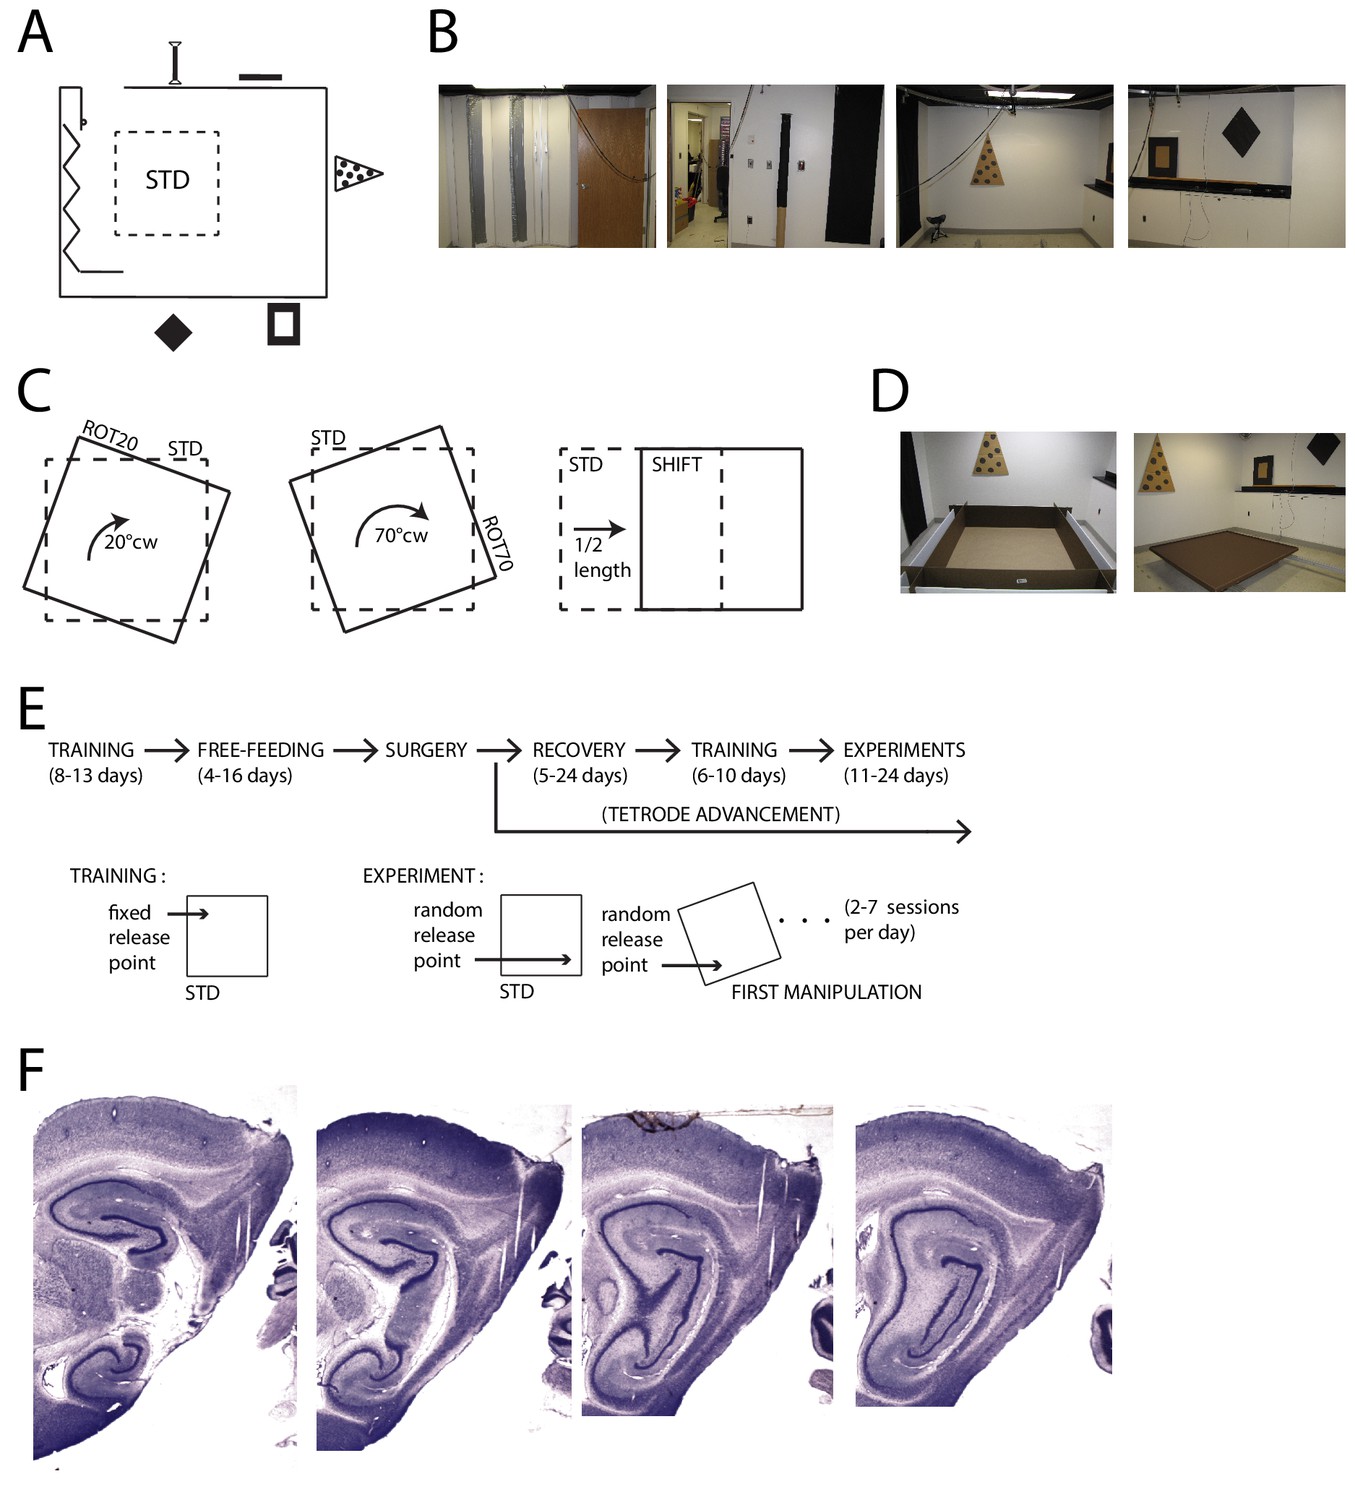
Apparatus and Recordings.
(A) Schematic of the room and foraging platform in STD position, approximately to scale. Locations of wall cues are depicted around the room perimeter. (B) Panoramic set of photos portraying all the room walls. (C) Schematics of the type of experimental manipulations: 20° CW rotation (ROT20, left), 70° CW rotation (ROT70, center, geometrically equivalent to a 20° CCW rotation), and platform translation (SHIFT, right). (D) Pictures of the two types of platforms: with high walls (left) or small lips (right). (E) Timeline of pre/post-surgery training, subsequent experiments, and their difference in the protocol. During training only the STD configuration was used, and the rat was always released from the same quadrant of the platform (the same for all rats). Experiment days always started with an STD session and were followed by one or more manipulated sessions (occasionally STD was also repeated). The rat was released from a quadrant of the platform that was randomly determined at the beginning of each session (including STD) and removed from the platform at the end of it. A ROT70 is here illustrated as the first manipulated session of the day, but the sequence of manipulations typically varied from day to day in a semi-random fashion. (F) Representative sagittal histological sections with tetrode tracks from one rat (rat 377).
Figure 2 with 1 supplement

Response to platform rotation by 20° CW (ROT20).
(A) Individual examples of rate maps for three units in the STD and ROT20 sessions. Top, rate maps calculated in the room reference frame. Bottom, autocorrelograms, from which the orientations of the three canonical grid axes (dashed black: STD, solid white: ROT20) were extracted and the grid rotation (mean angular difference between the two sets of axes, noted to the right of the autocorrelograms) was calculated. Right, rotation-adjusted crosscorrelogram between the two rate maps, computed after the STD rate map was rotated to equalize the orientation of its grid with that in ROT20. Center (0,0) of the crosscorrelogram is marked with cross-hair. Phase shift (noted above the crosscorrelogram in x,y cm) is the vector between the center of the crosscorrelogram and that of its closest correlation field. Each example shows that the grid did not rotate as much as the box, under-rotating by 4°, 8°, and 3°. In contrast, there was little phase offset between the two grid patterns. Unit ID is at the left of the figure (r: rat number; d: day of recording; t: tetrode number; c: cell number on that tetrode). (B) All grid rotations in ROT20. Dashed lines indicate the expected grid rotation for ideally room-controlled (R) or platform-controlled (P) grids. The grids on average rotated in the CW direction, with an undershoot of ~6°. Note that because of the 60° rotational symmetry of the grids, the abscissa represents a circular coordinate system, with the −30° value equal to the +30° value. Grids of different scale (ordinate) responded equivalently (see Figure 8). (C) Phase shifts for the grids in B, calculated on rotation-adjusted crosscorrelograms as in A. Top: Absolute phase shift magnitude. The amount of phase shift was very small compared to the size of the platform (superimposed shape of the platform is to scale). Bottom: Phase shift magnitude as a proportion of grid period. When the phase shift for each cell was plotted as a fraction of the grid period for that cell, the average shift is much smaller than the size of an individual grid vertex (superimposed grid is in an arbitrary orientation).
Figure 2—figure supplement 1
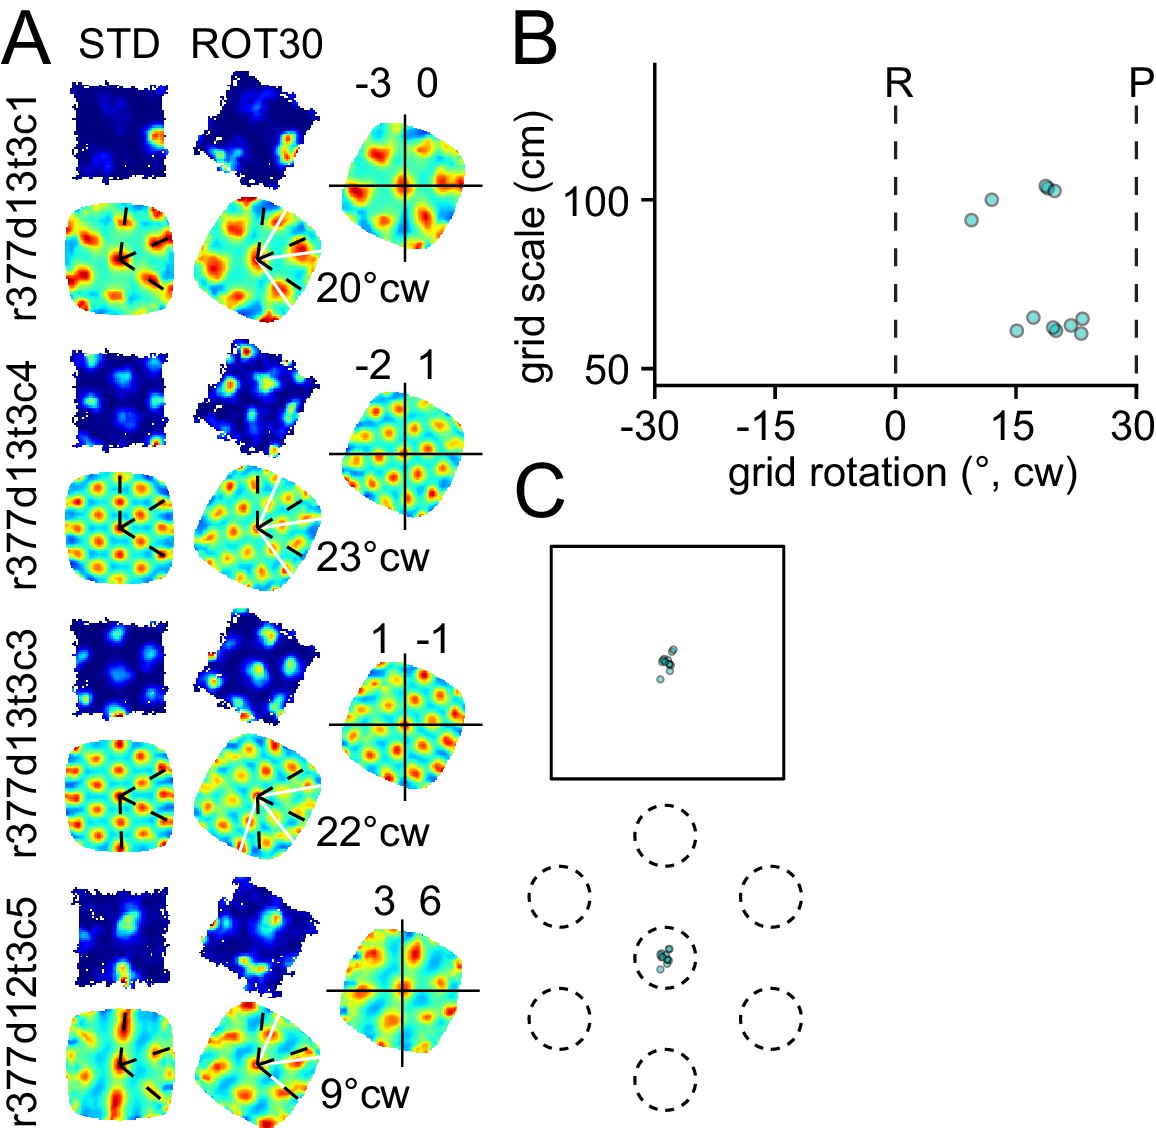
Response to platform rotation by 30° CW (ROT30) in one rat.
The response is qualitatively similar to the ROT20 data illustrated in Figure 2. (A, B) The grids tend to under-rotate compared to the rotation of the platform (30°). (A, C) the grids display a minimal phase shift. Illustration conventions are the same as Figure 2.
Figure 3 with 2 supplements

Bimodal response to platform rotation by 70° CW (ROT70).
(A) A CW rotation of 70° allows the dissociation of the influences of the platform (‘P’ at 10° CW, corresponding to a 70° CW grid rotation because of the 60° radial symmetry of the grid), the room (‘R’ at 0°), and the geometric frame of the platform (‘G’ at 20° CCW, the minimum angle yielding a congruent square configuration for ROT70). This manipulation resulted in a bimodal grid-rotation response (abscissa). The left mode represents grids that were controlled primarily by the geometric frame of reference. The right mode represents grids that were controlled primarily by the room frame of reference (see illustration in Figure 3—figure supplement 1). Offsets of the modes from the predicted orientations indicate the counterweighing influence of a competing frame of reference in most rats. The 50 units in the left mode include 35 units that were recorded in the ROT20 manipulation (Figure 2B) on the same day. The 69 units in the right mode include 42 units that were recorded in the ROT20 manipulation on the same day. (B) Examples from the left (geometry-controlled) mode of the rotation distribution in A, illustrated as in Figure 2A. (C) Phase shifts in the grids of the left mode in A, illustrated as in Figure 2C. (D) Examples of rate maps from the right (room-controlled) mode of the rotation distribution in A. (E) Demonstration of phase shift calculation relative to room and platform reference frames for the last example in D. The grid rotates 7° CW in the room reference frame. This is equivalent to a 3° CCW rotational error relative to the physical platform’s rotation of 70° CW (after the 60° rotational symmetry of the grid is subtracted from 70°). The phase shift relative to the platform is therefore computed from the crosscorrelogram between the STD rate map rotated by 70° CW +3° CCW = 67° CW and the ROT70 rate map. (F) Phase shifts calculated relative to the room and platform reference frames as in E for all grids in the right mode in A. Note how grid phase (i.e. the position of the grid) is poorly controlled by the platform, but tightly controlled by the room.
Figure 3—figure supplement 1
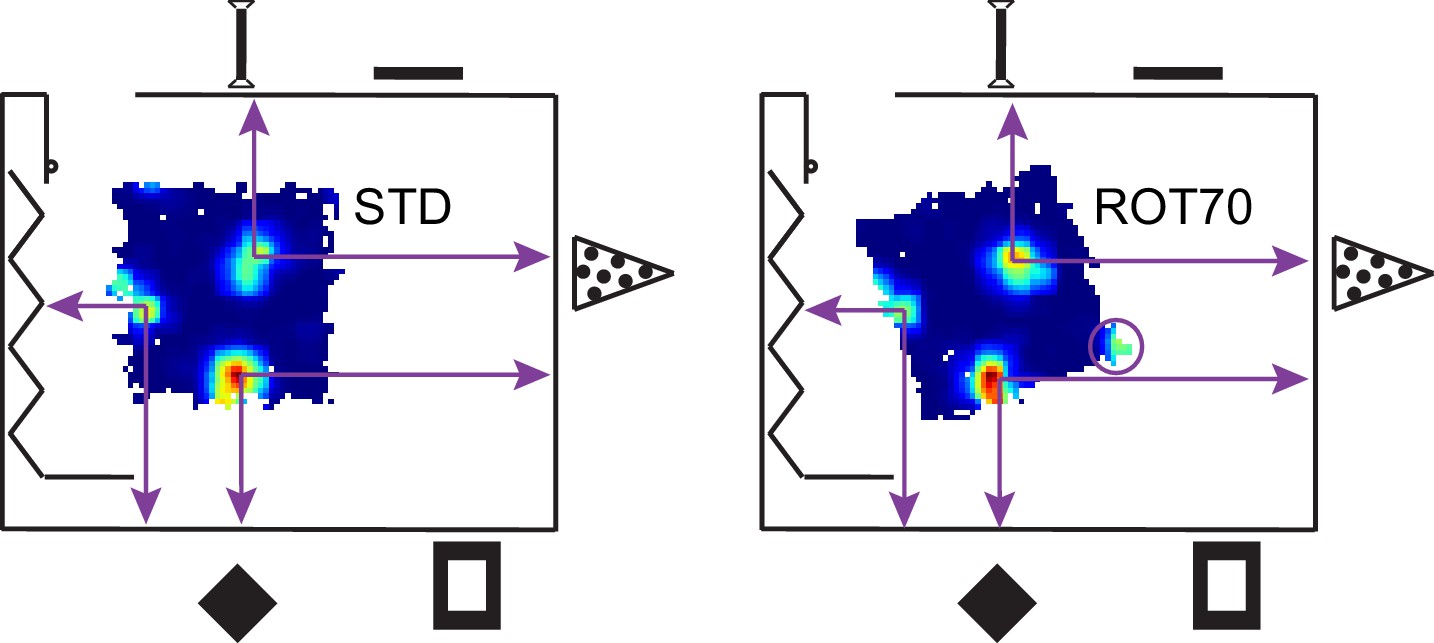
Illustration of a room-anchored grid.
The rate maps for the STD and ROT70 sessions of the same grid cell are shown within the room schematic (same as in Figure 1), approximately in scale and in position. Note how the position of the firing fields remain roughly stable relative to the room coordinate system. Note also how a fourth firing field (in circle) appears in ROT70 as the platform extends to the expected position of the vertex in room space. The grid thus appears embedded in the metric structure of the room, rather than the platform frame of reference. A large-scale grid was chosen here for ease of illustration. Grids of smaller scale exhibiting similar properties are reported in Figure 3D and Figure 3—figure supplement 2.
Figure 3—figure supplement 2
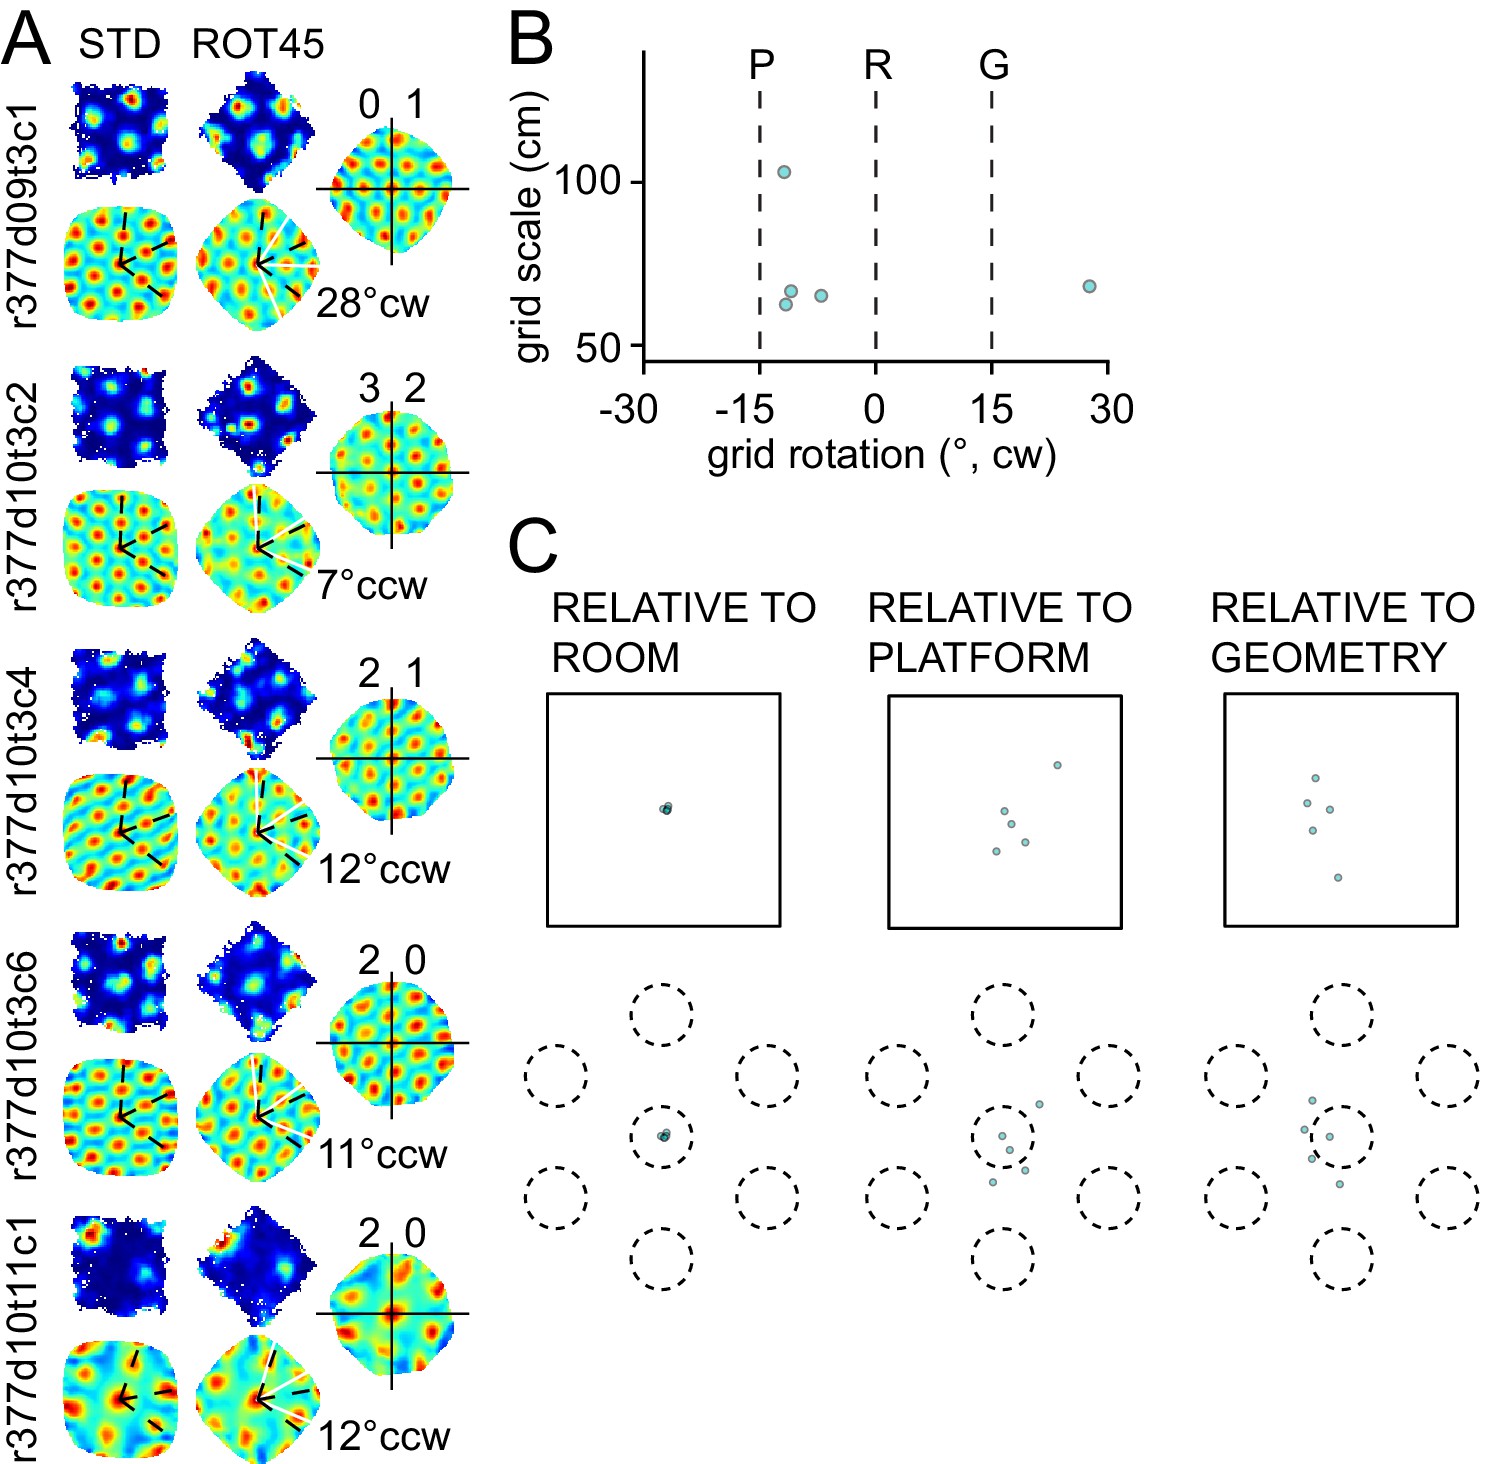
Response to platform rotation by 45° CW (ROT45) in one rat.
(A) A grid recorded on the first day of this manipulation (top left) rotated 28° CW, under-rotating the platform similarly to the ROT20 condition. On the next day, four grids were recorded, all of which rotated ~10° CCW. (B) Scatter plot shows that most grids appeared controlled more by the platform frame of reference than the room. However, as shown in (C), the phase shift measurements show clearly that the room was the dominant reference frame, similar to the right mode of the ROT70 data (Figure 3). Illustration conventions are the same as in Figure 3. Note, however, that for this manipulation, the P and G frames of reference are reversed in rotation direction compared to the ROT70 experiment, due to the 60° rotational symmetry of the grid (e.g., 70° CW rotation of the platform is equivalent to 70° − 60° = 10° CW grid rotation, whereas 45° CW rotation of the platform is equivalent to 45° − 60° = 15° CCW grid rotation).
Figure 4
Response to platform translations (SHIFT).
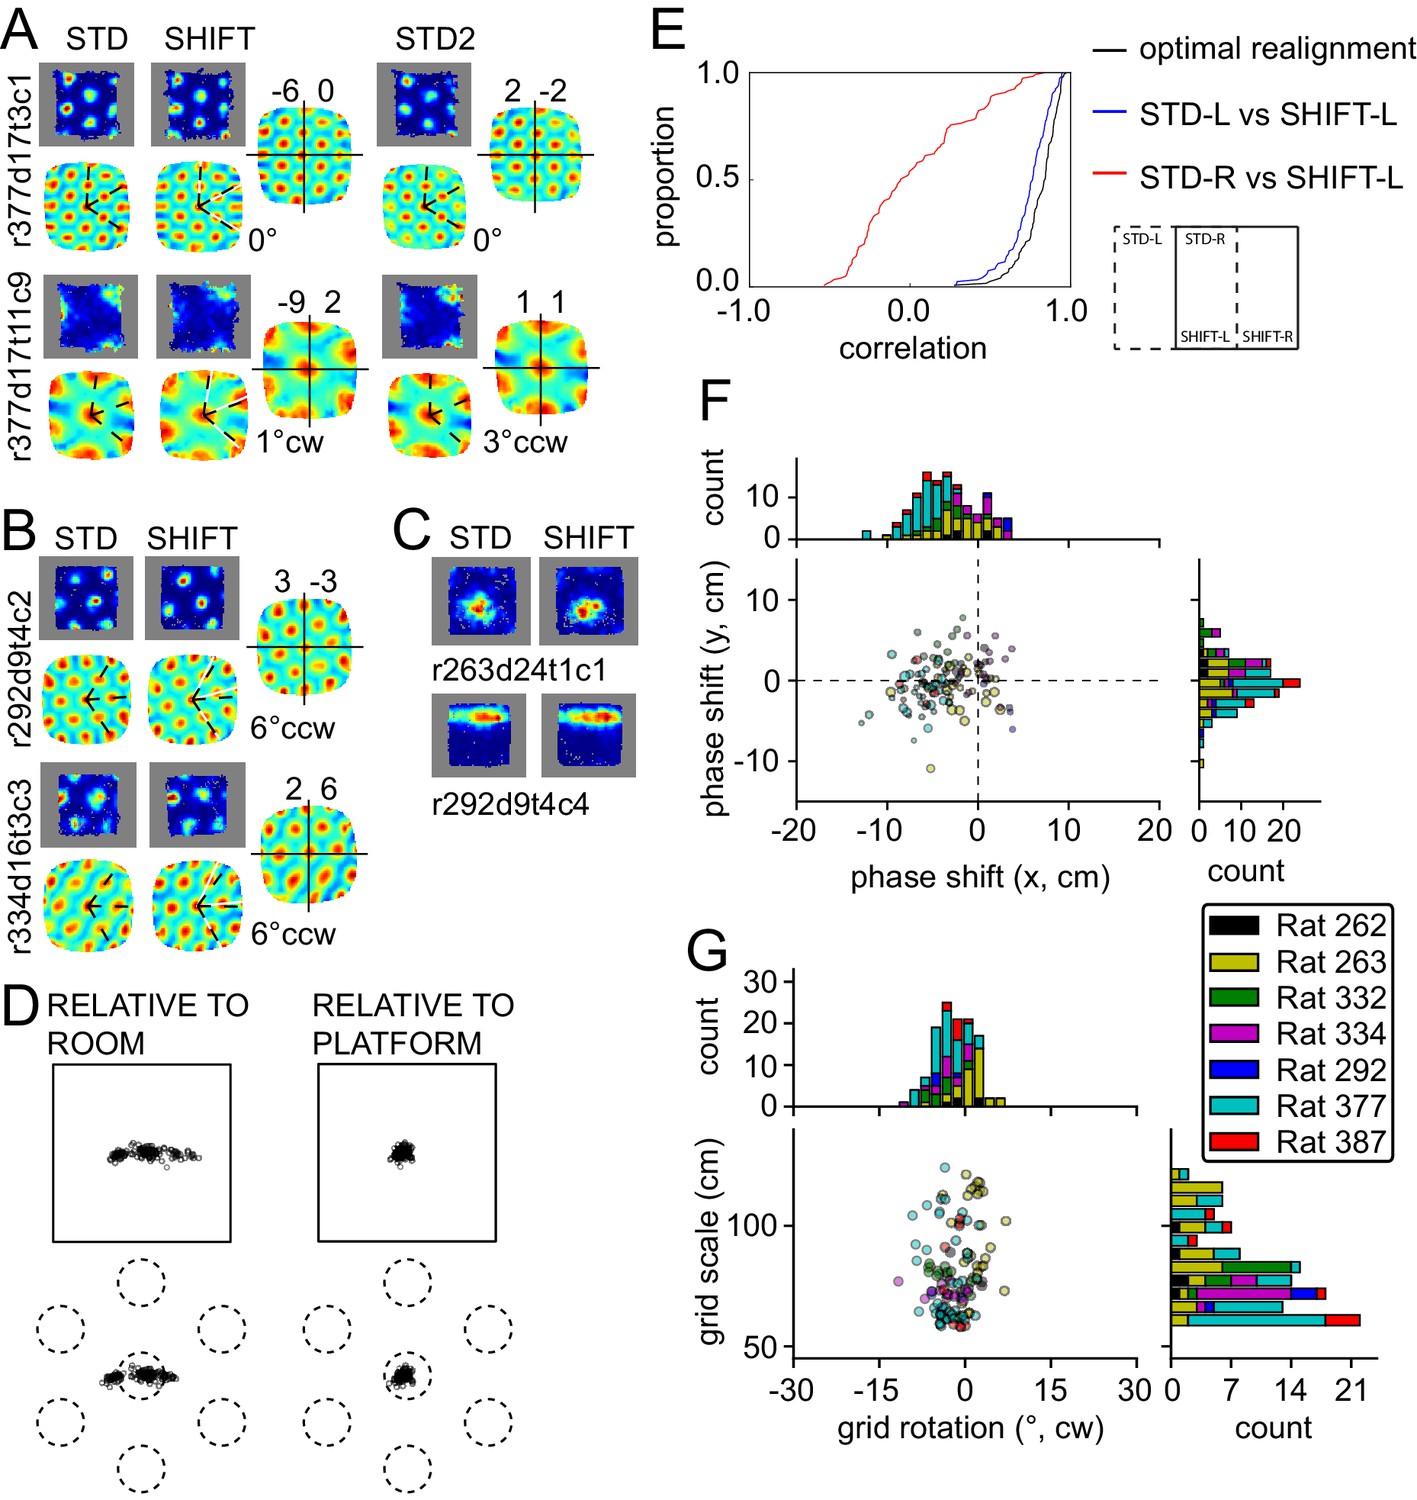
(A–C) Examples of rate maps illustrated as in Figure 2A. Grey areas outline identical subregions of the view frames of a camera positioned over the standard position of the platform and a separate camera positioned over the shifted position and aligned precisely with the first camera. (A) Examples of grids that shifted with the platform, with a small under-translation. (B) Examples of grids that shifted with the platform but that rotated slightly CCW. (C) Examples of additional spatial cells that shifted their firing fields with the platform. (D) Grid phase shifts relative to the platform or room, illustrated as in Figures 2C and 3F. The 119 units include 77 that were recorded in the ROT20 (Figure 2B) and/or ROT70 (Figure 3A) manipulations on the same day. Although overall the phase shifts relative to the platform were much smaller than shifts relative to the room, note that a proportion of the grids showed a very small phase shift relative to the room as well. These are grids with spatial periods that were similar to the magnitude of the shift itself. (E) Cumulative distributions of correlations of STD vs SHIFT rate maps from different sections of the platform. In the SHIFT condition, the left half of the platform (SHIFT-L) offers a strong, direct test of the competing hypotheses. If the grids were controlled strongly by the platform, then the SHIFT-L rate maps should be highly correlated with the STD-L rate maps. In contrast, if the grids were controlled strongly by the room, then the SHIFT-L rate maps should be highly correlated with the STD-R rate maps. The STD-L vs. SHIFT-L correlations (blue) are much higher than the STD-R vs. SHIFT-L correlations (red), demonstrating conclusively that the grids are primarily controlled by the platform frame of reference. Nonetheless, after the grids are realigned to correct for any rotational or phase adjustments, the correlations are even higher (black), demonstrating that the room still exerts a measurable influence on the grids. (F) Individual grid phase shifts in the platform frame of reference, showing a small but consistent translational offset in SHIFT, in the direction opposite to the direction of platform shift in most animals (same data as in Figure 4D). Dot size is proportional to the grid scale measured in the STD session. (G) Individual grid rotations showing a minor CCW rotation in SHIFT in most animals.
Figure 5 with 7 supplements
Systematic biases in frame prevalence and anchoring by rat and manipulation.
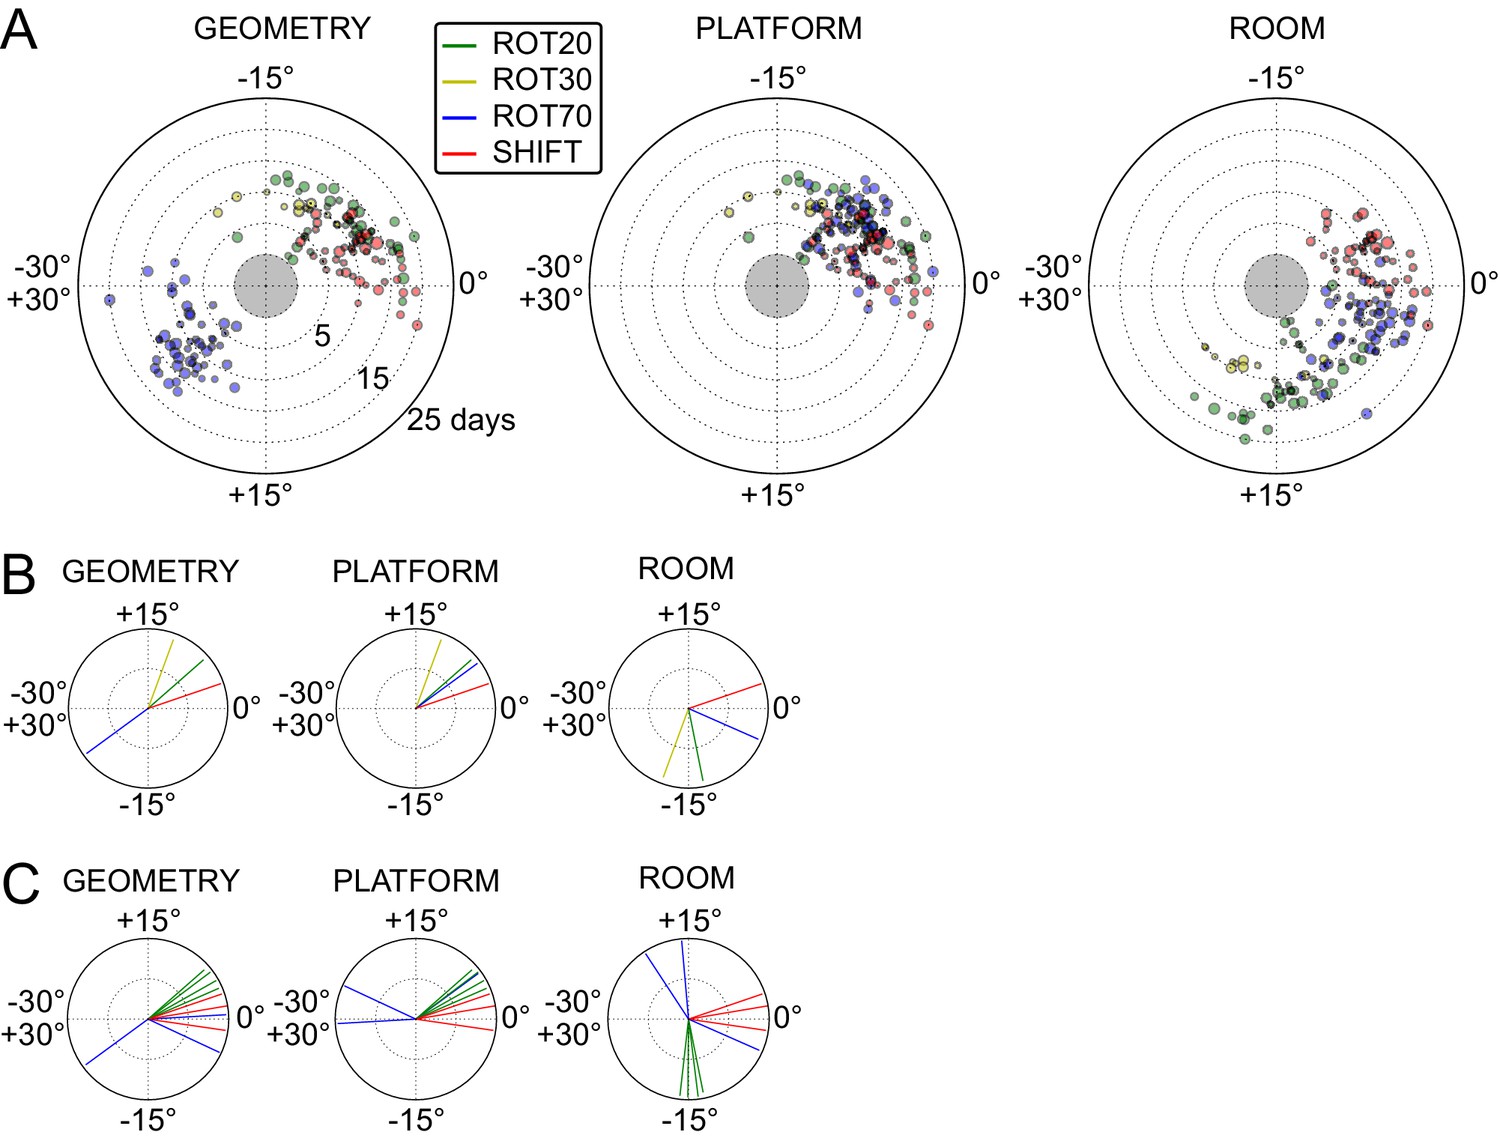
(A) Rotation of each grid recorded from rat 377, organized by manipulation type (color), relative to the platform geometric reference frame (left), actual platform (center), and room (right). Perfect control by a reference frame is indicated by a 0° angle, whereas positive angles correspond to a CW rotational dissociation from the frame (i.e. the direction of the experimental rotations of the platforms). The radial position indicates the number of recording days since the rat’s first experience of a non-STD session (external edge of the central gray circle). Dot size is proportional to the scale of the grid measured in STD. Note the general consistency of responses across days and the segregation of response angles by manipulation type (color). These plots ignore the phase component of the grid response, which dramatically reveals additional separation only in some animals/manipulations. Scatterplots for all seven rats are given in figure Figure 5—figure supplements 1–7, together with scatter plots for phase shift data. (B) Mean unit vectors of the rotation distributions calculated for each manipulation (color) from the data in A. Mean vector lengths are measures of circular variance. All mean vectors are close to 1 (maximum), consistent with the tight distributions of angles for each manipulation type. (C) Mean vectors from all rats and manipulations as in B, restricted to the rat-manipulation datasets that comprised at least seven distinct recoding days. As in (B), all mean vectors are close to the maximum value of 1, showing that the individual rats’ responses to each manipulation were reproducible and stable across multiple days of recordings. See figure supplements 1-7 for more details for each rat.
Figure 5—figure supplement 1
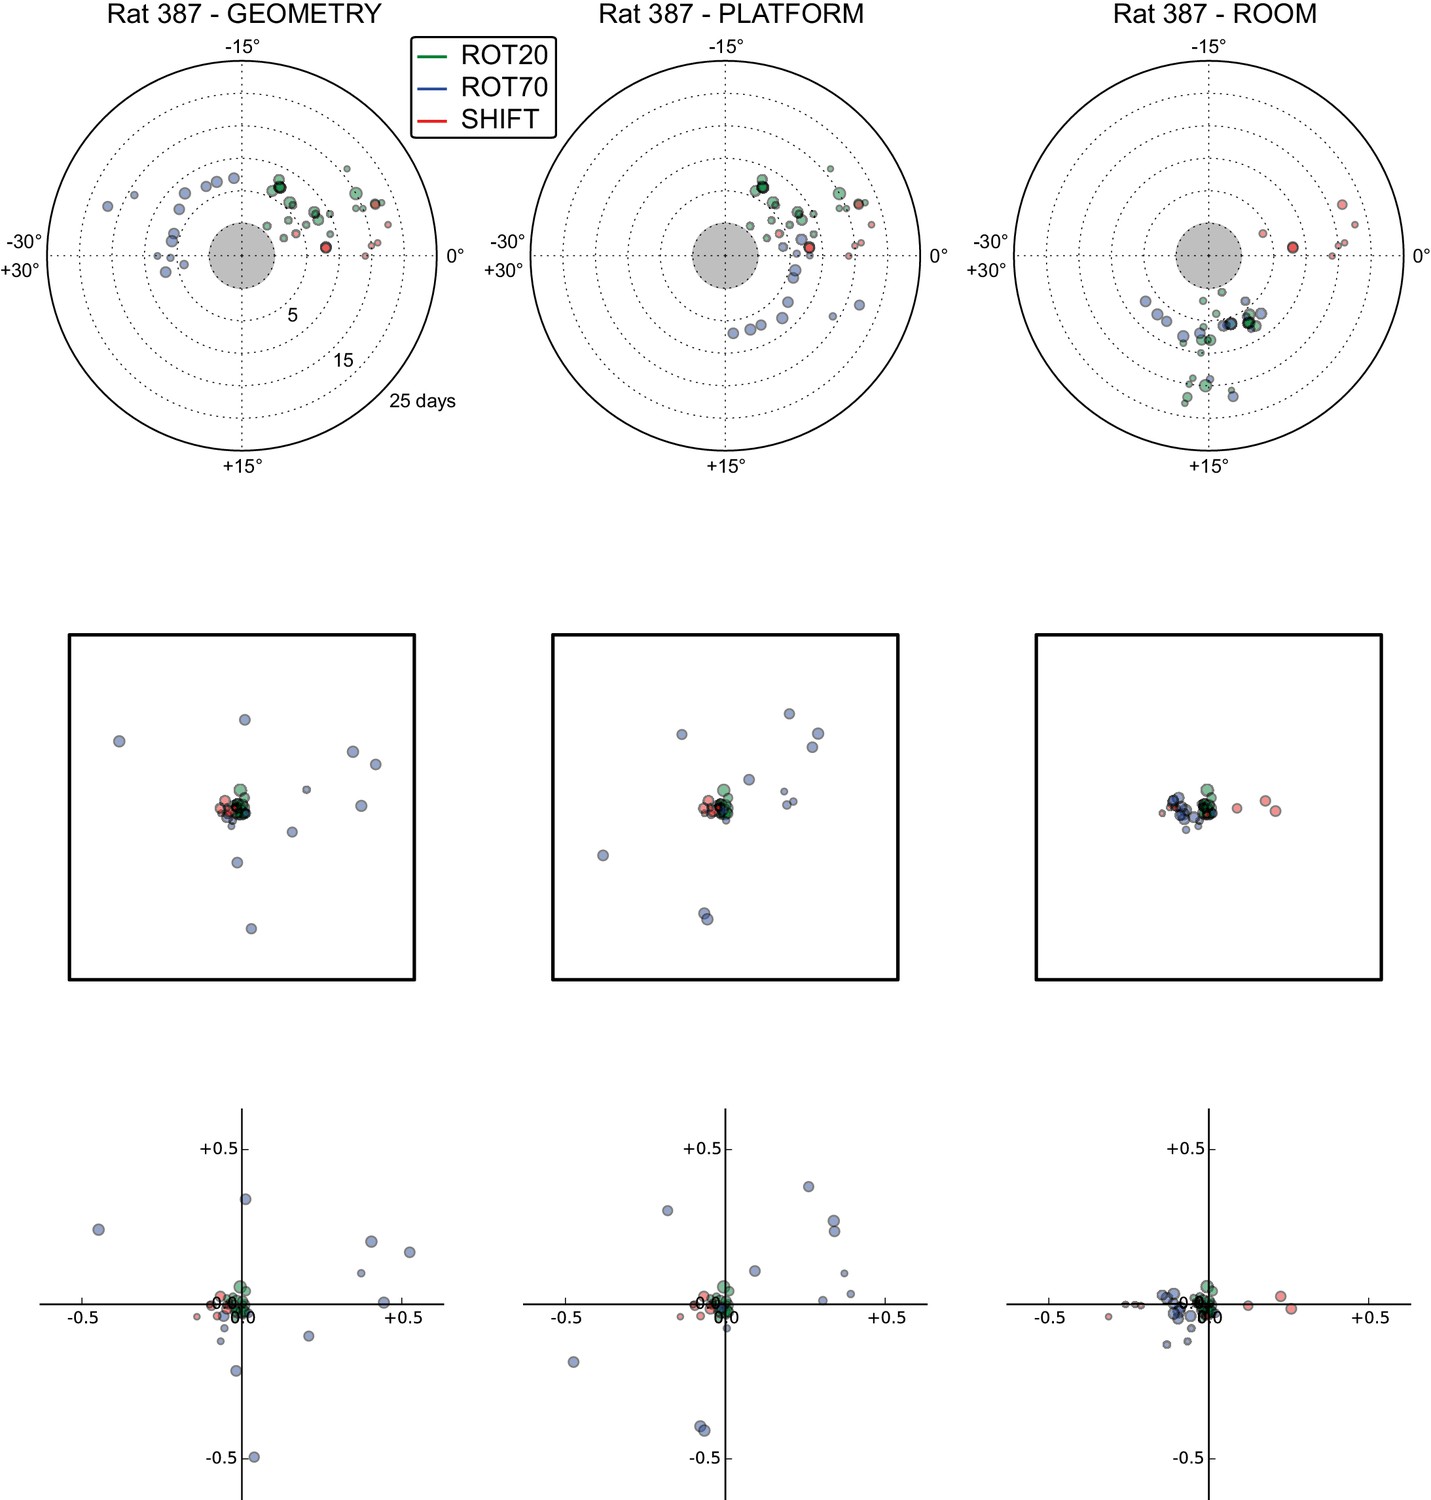
All grid rotations and phase shifts from rat 387.
These plots display daily rotations and phase shifts for each grid relative to the three reference frames: platform geometry (left column), physical platform (central column), or room (right column). Manipulation types are color-coded and dot size is proportional to the scale of the grid measured in STD. Non-null rotations and phase shifts relative to any reference frame represent rotational and positional dissociations of the grid from the reference frame, respectively. The dominant reference frame in each manipulation is the one producing smaller rotations and/or phase shifts. (Top row) Rotation of each grid relative to the last performed STD session, illustrated as in Figure 5A. Rotational dissociation from platform geometry is calculated relative to the minimal rotation of the square that is symmetrically congruent to the performed physical platform rotation; it differs from the platform's physical rotation only in ROT70. (Middle row) Phase shifts for the same grids as in the top row, calculated under the assumption of the grid following the respective reference frame (see Figure 3E, and Materials and methods). An in-scale schematic of the platform (arbitrarily oriented as in the STD condition) is provided to aid visual evaluation of the shift magnitude. (Bottom row) Same as in the middle row but shifts are reported as a proportion of the individual grid period.
Figure 5—figure supplement 2
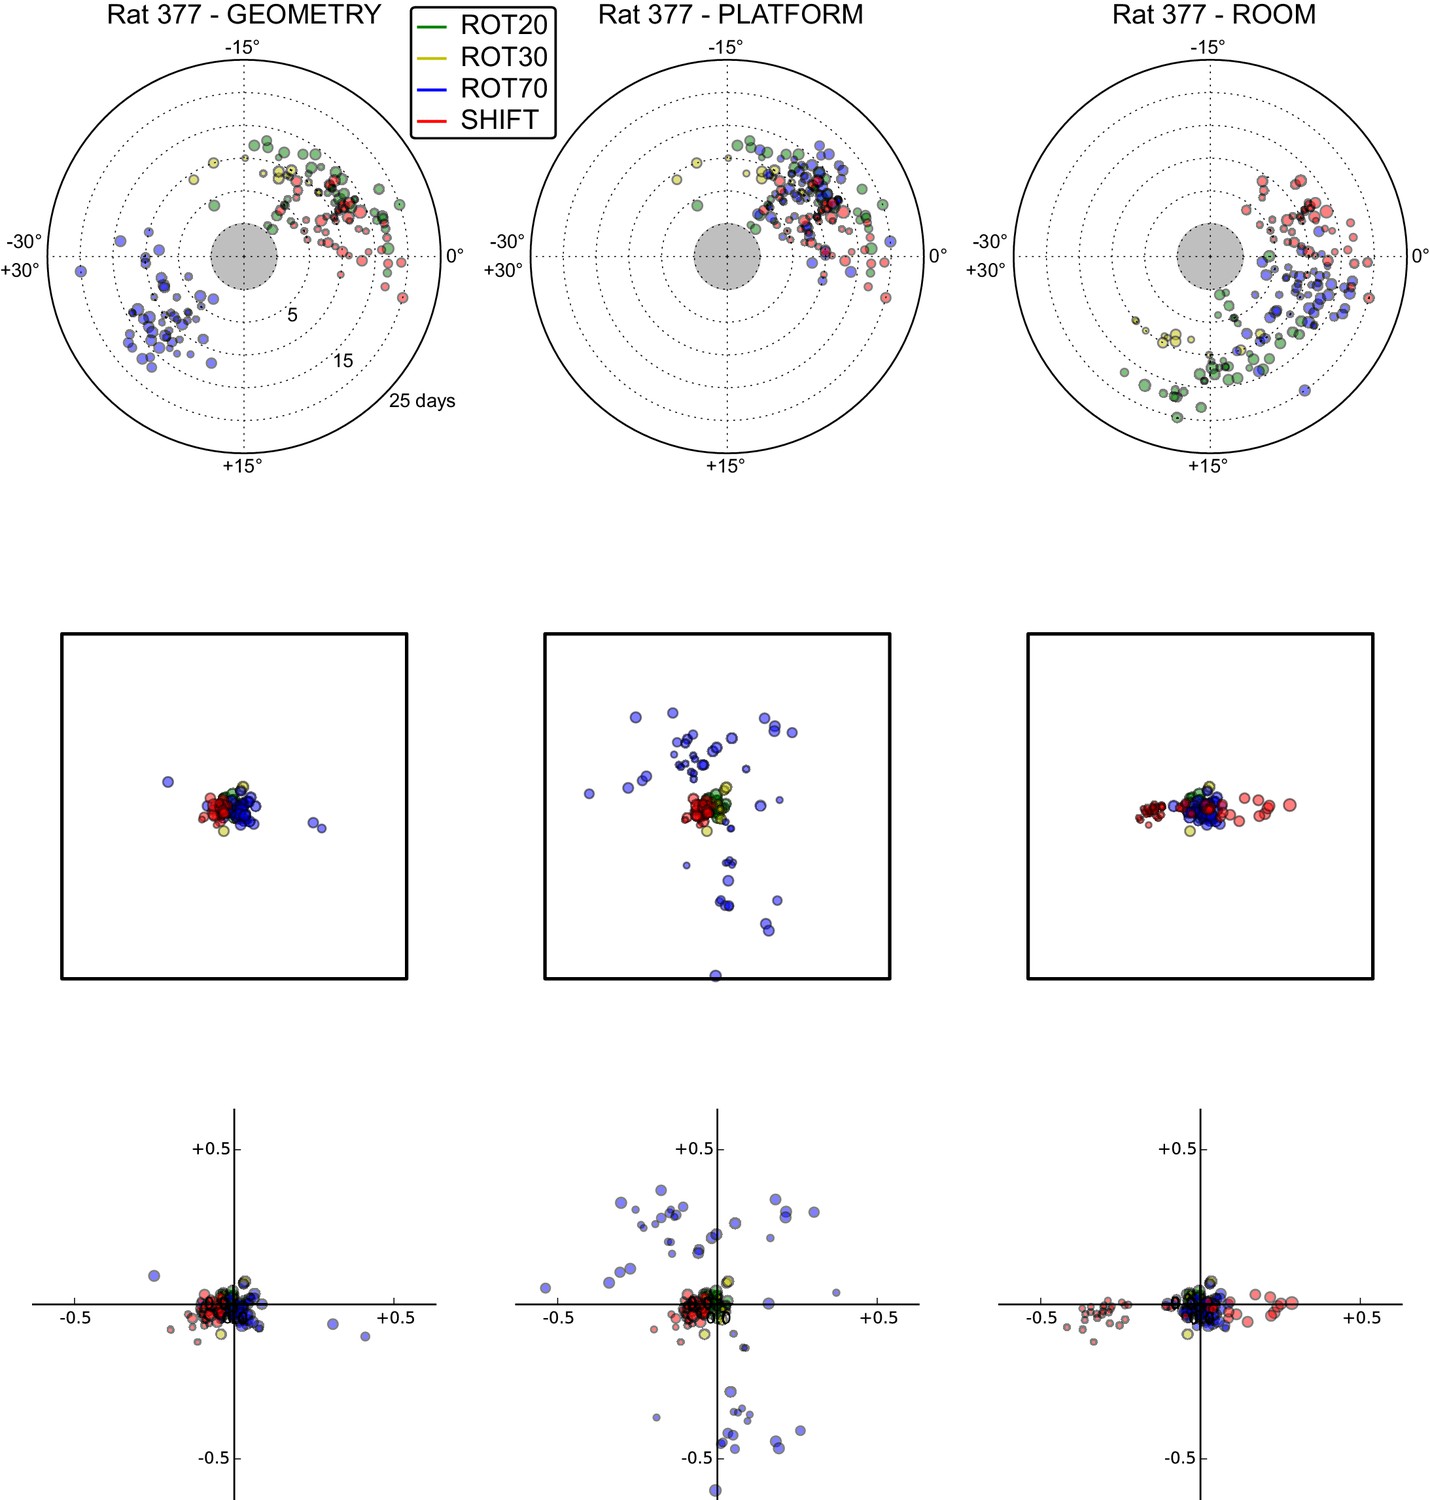
All grid rotations and phase shifts from rat 377.
Data are illustrated as in Figure 5—figure supplement 1. Scatter plots in the top row are replicated from Figure 5A. The five grid cells recorded in ROT45 (see Figure 3—figure supplement 2) are not reported in these plots.
Figure 5—figure supplement 3

All grid rotations and phase shifts from rat 334.
Data are illustrated as in Figure 5—figure supplement 1.
Figure 5—figure supplement 4
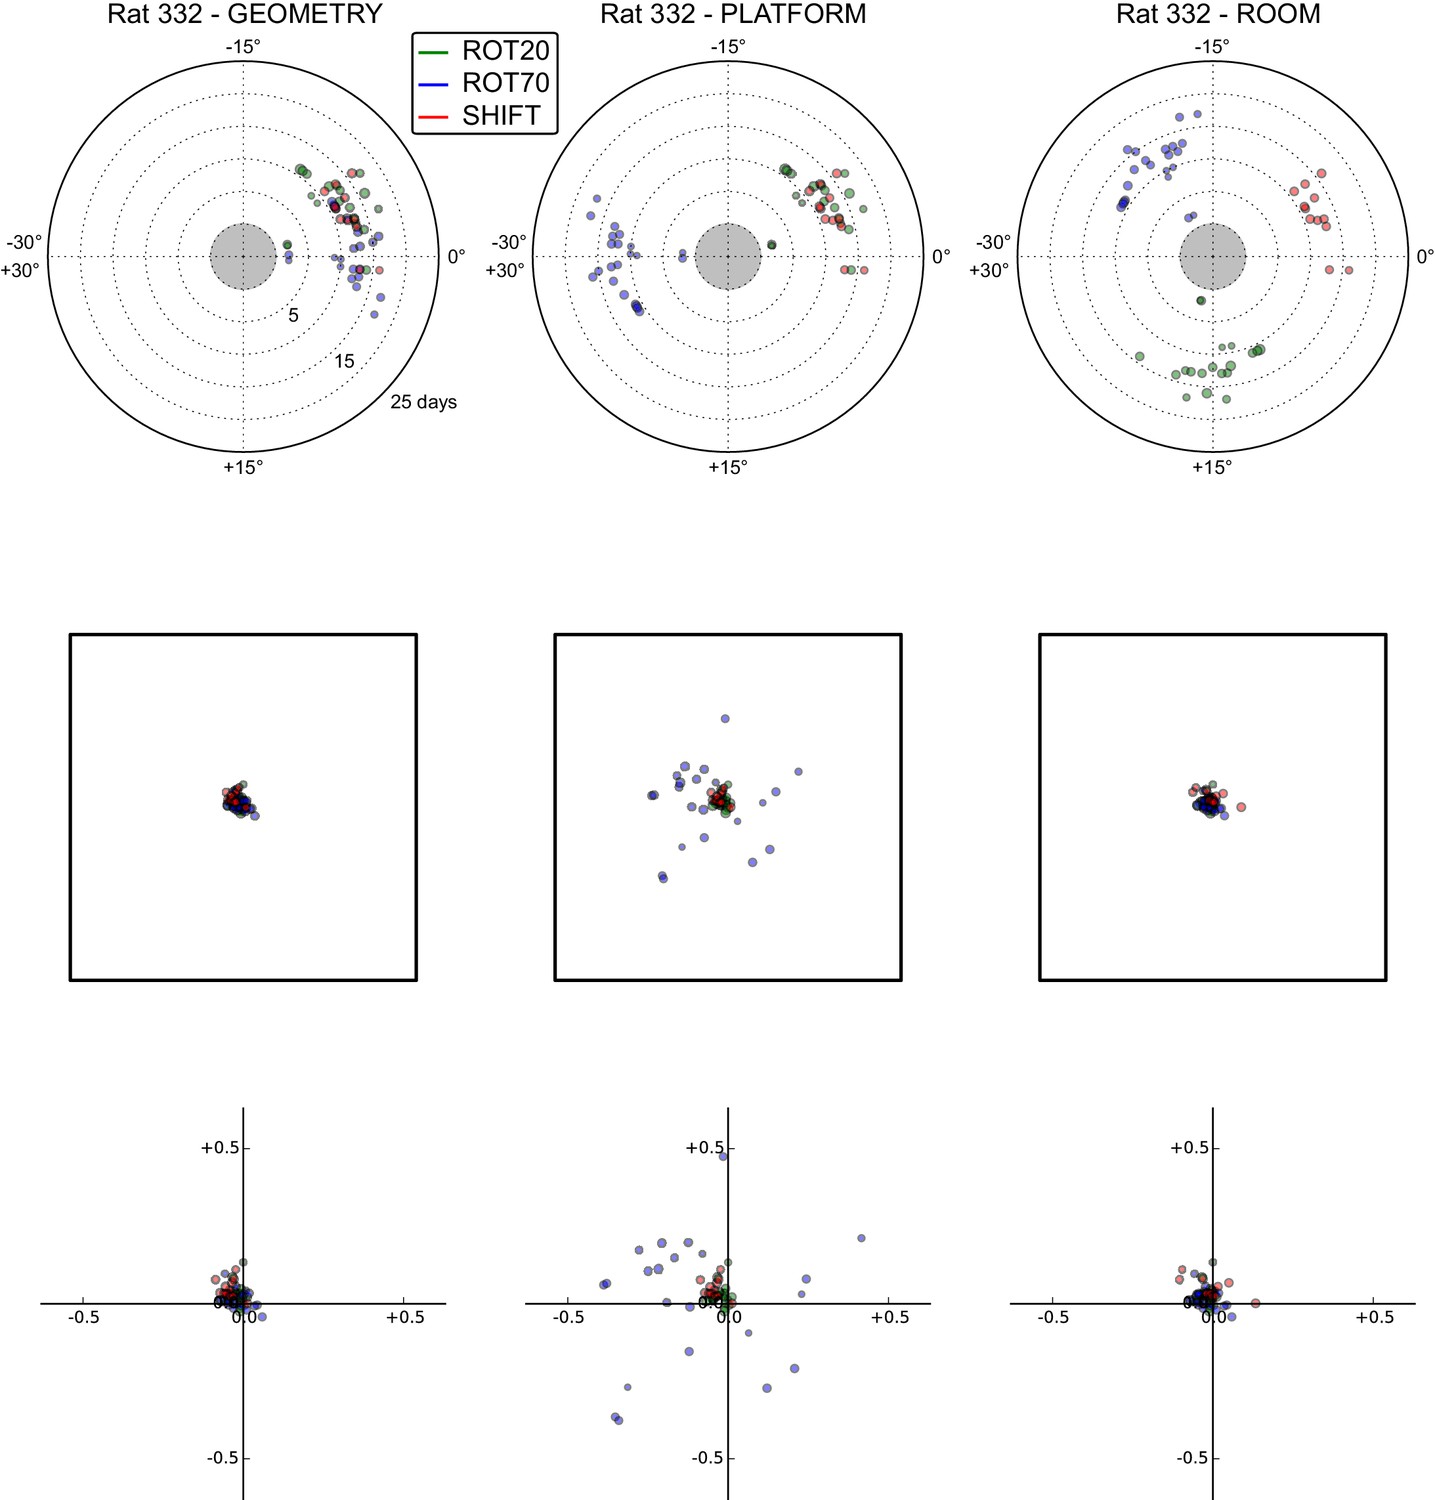
All grid rotations and phase shifts from rat 332.
Data are illustrated as in Figure 5—figure supplement 1.
Figure 5—figure supplement 5
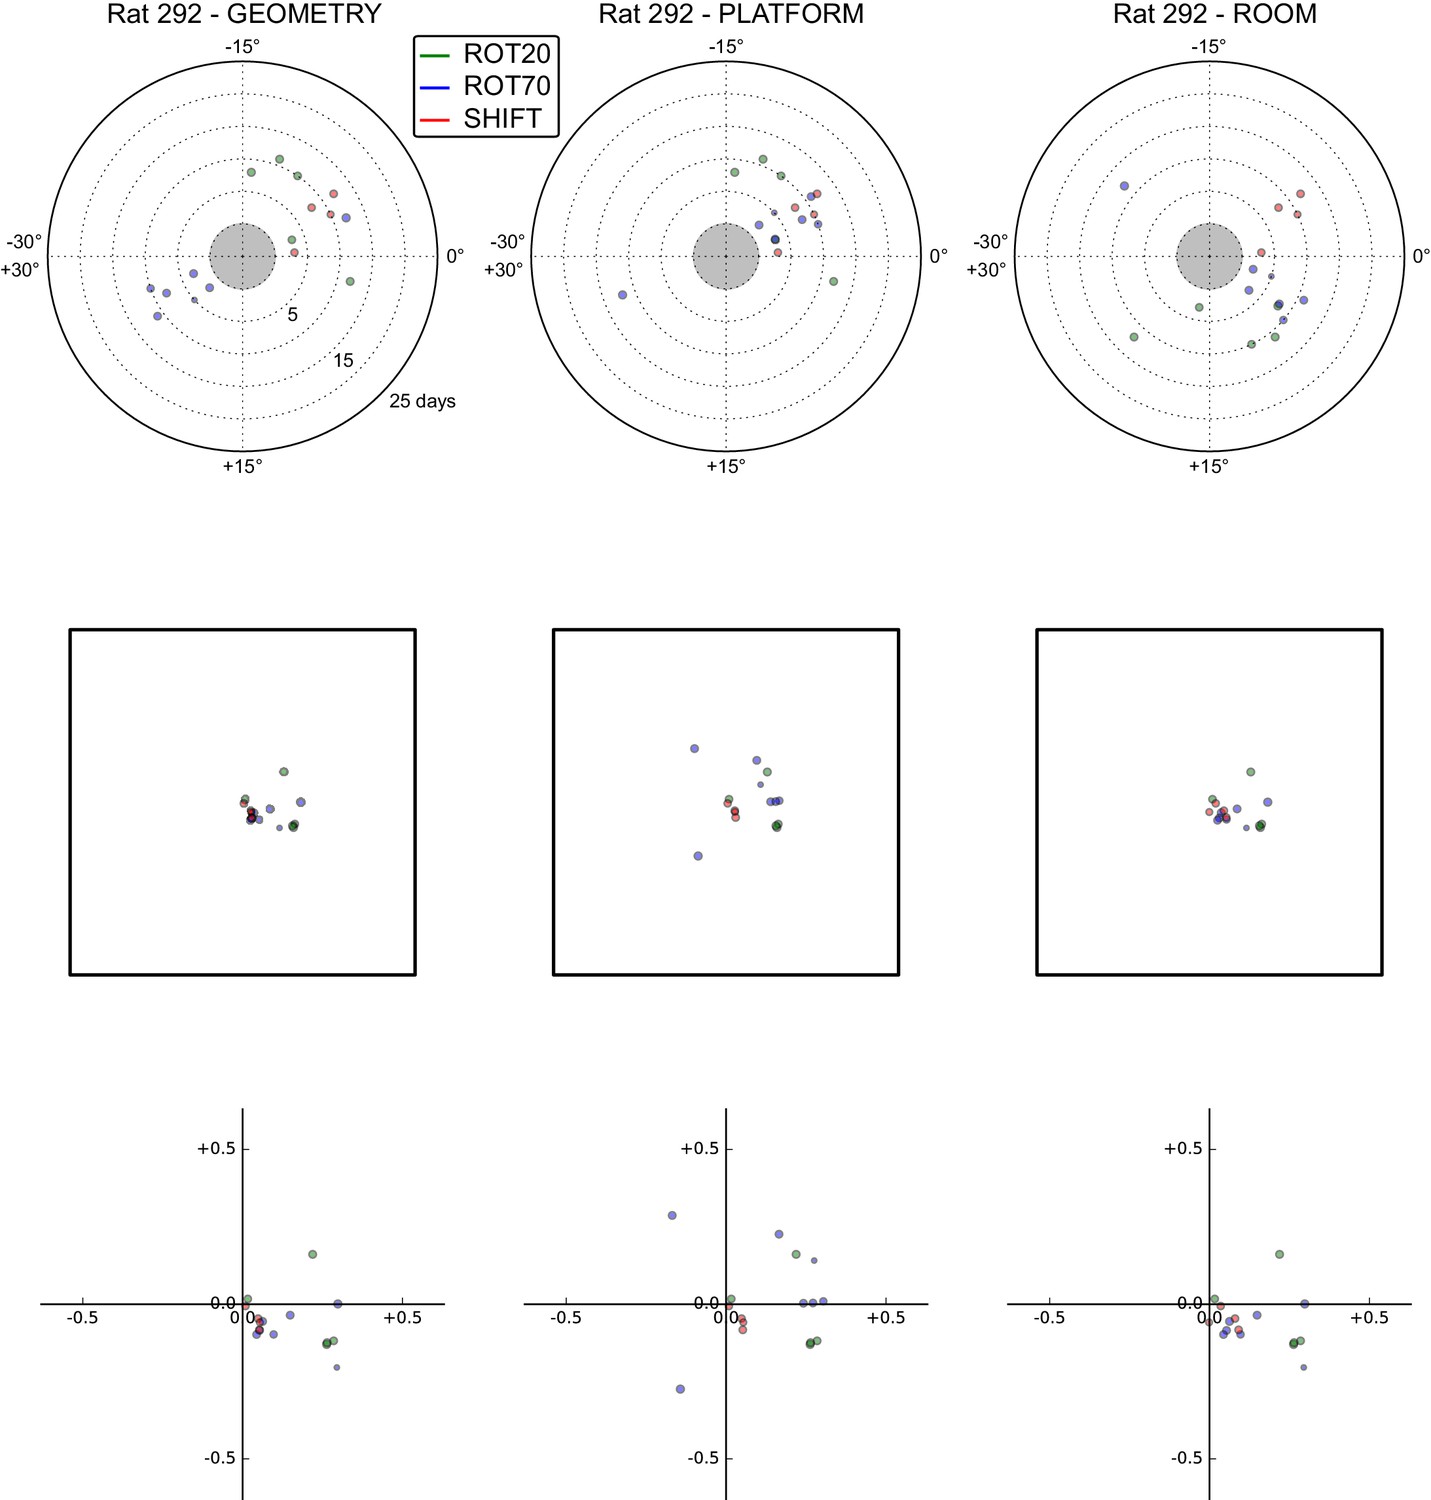
All grid rotations and phase shifts from rat 292.
Data are illustrated as in Figure 5—figure supplement 1.
Figure 5—figure supplement 6

All grid rotations and phase shifts from rat 263.
Data are illustrated as in Figure 5—figure supplement 1.
Figure 5—figure supplement 7
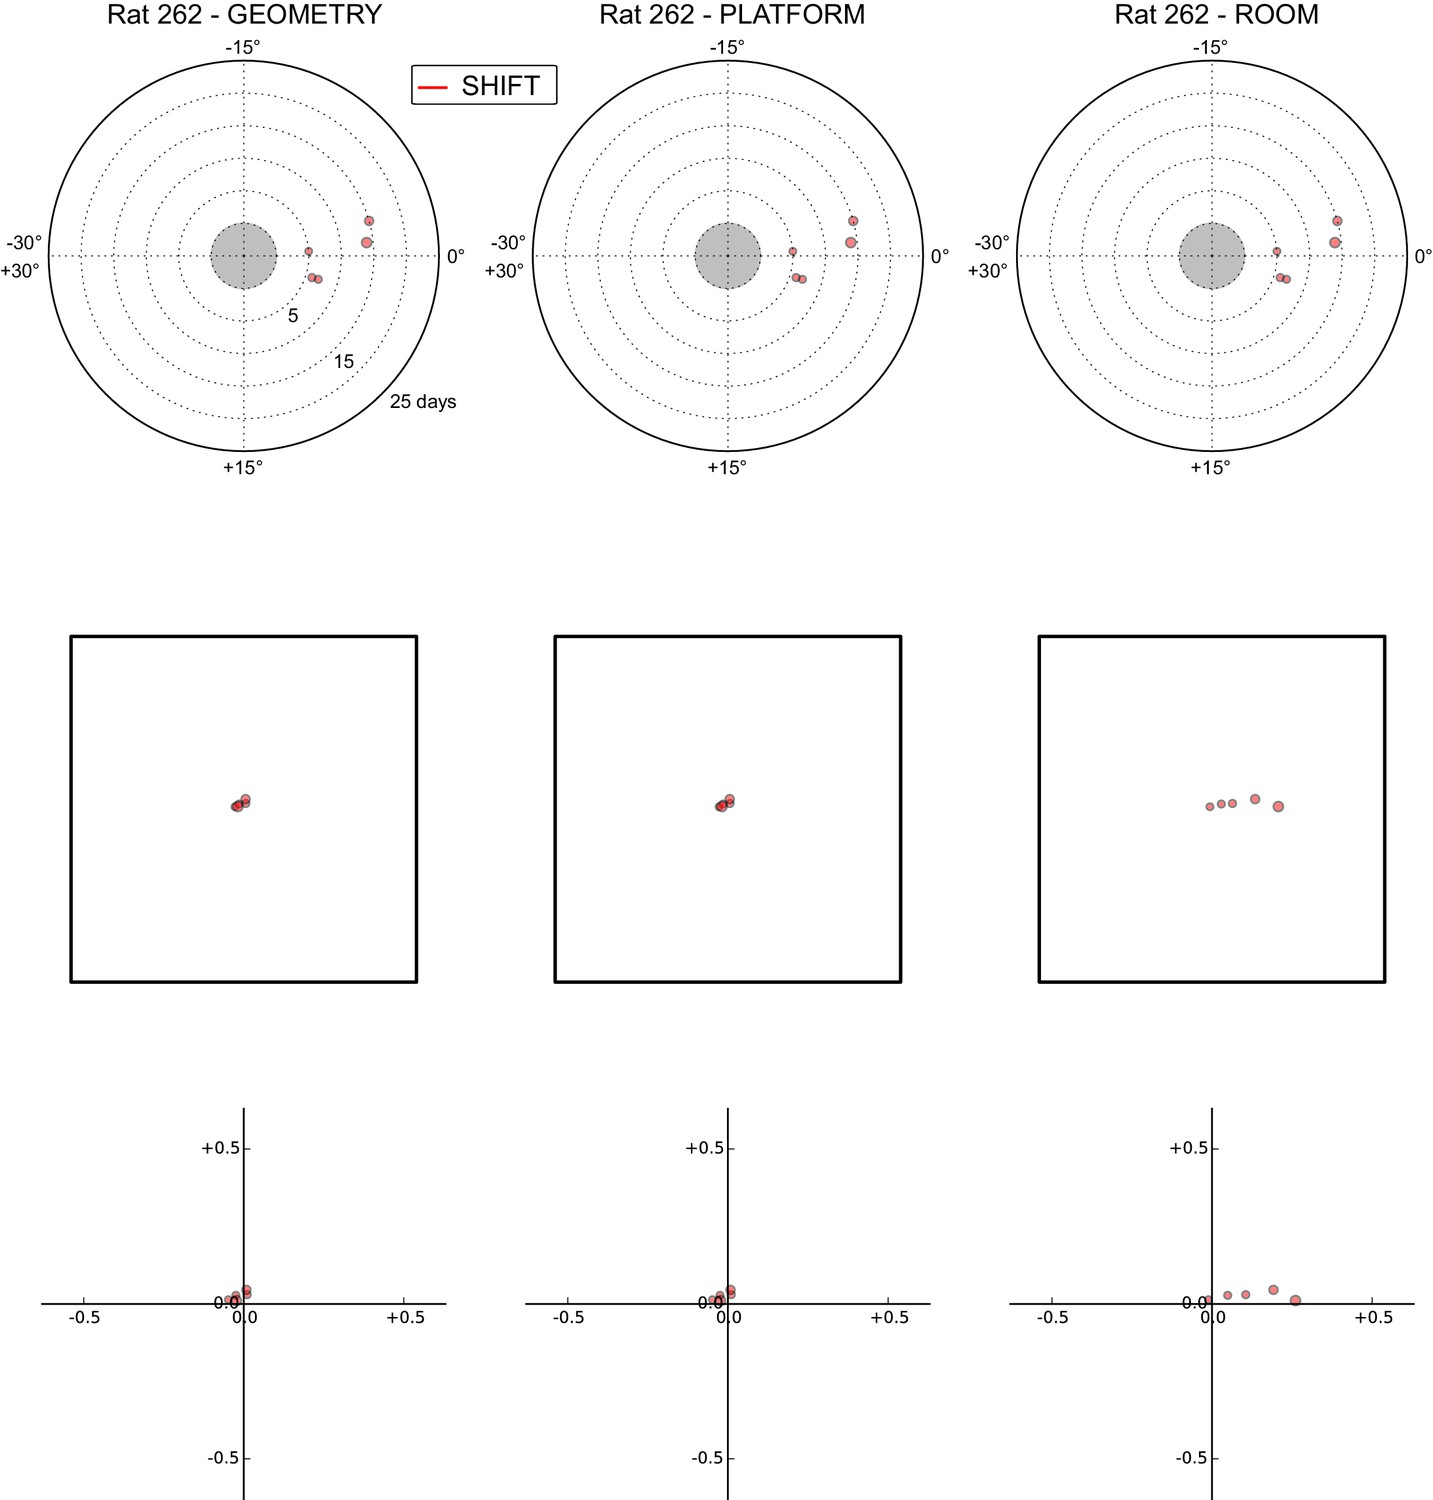
All grid rotations and phase shifts from rat 262.
Data are illustrated as in Figure 5—figure supplement 1.
Figure 6 with 2 supplements
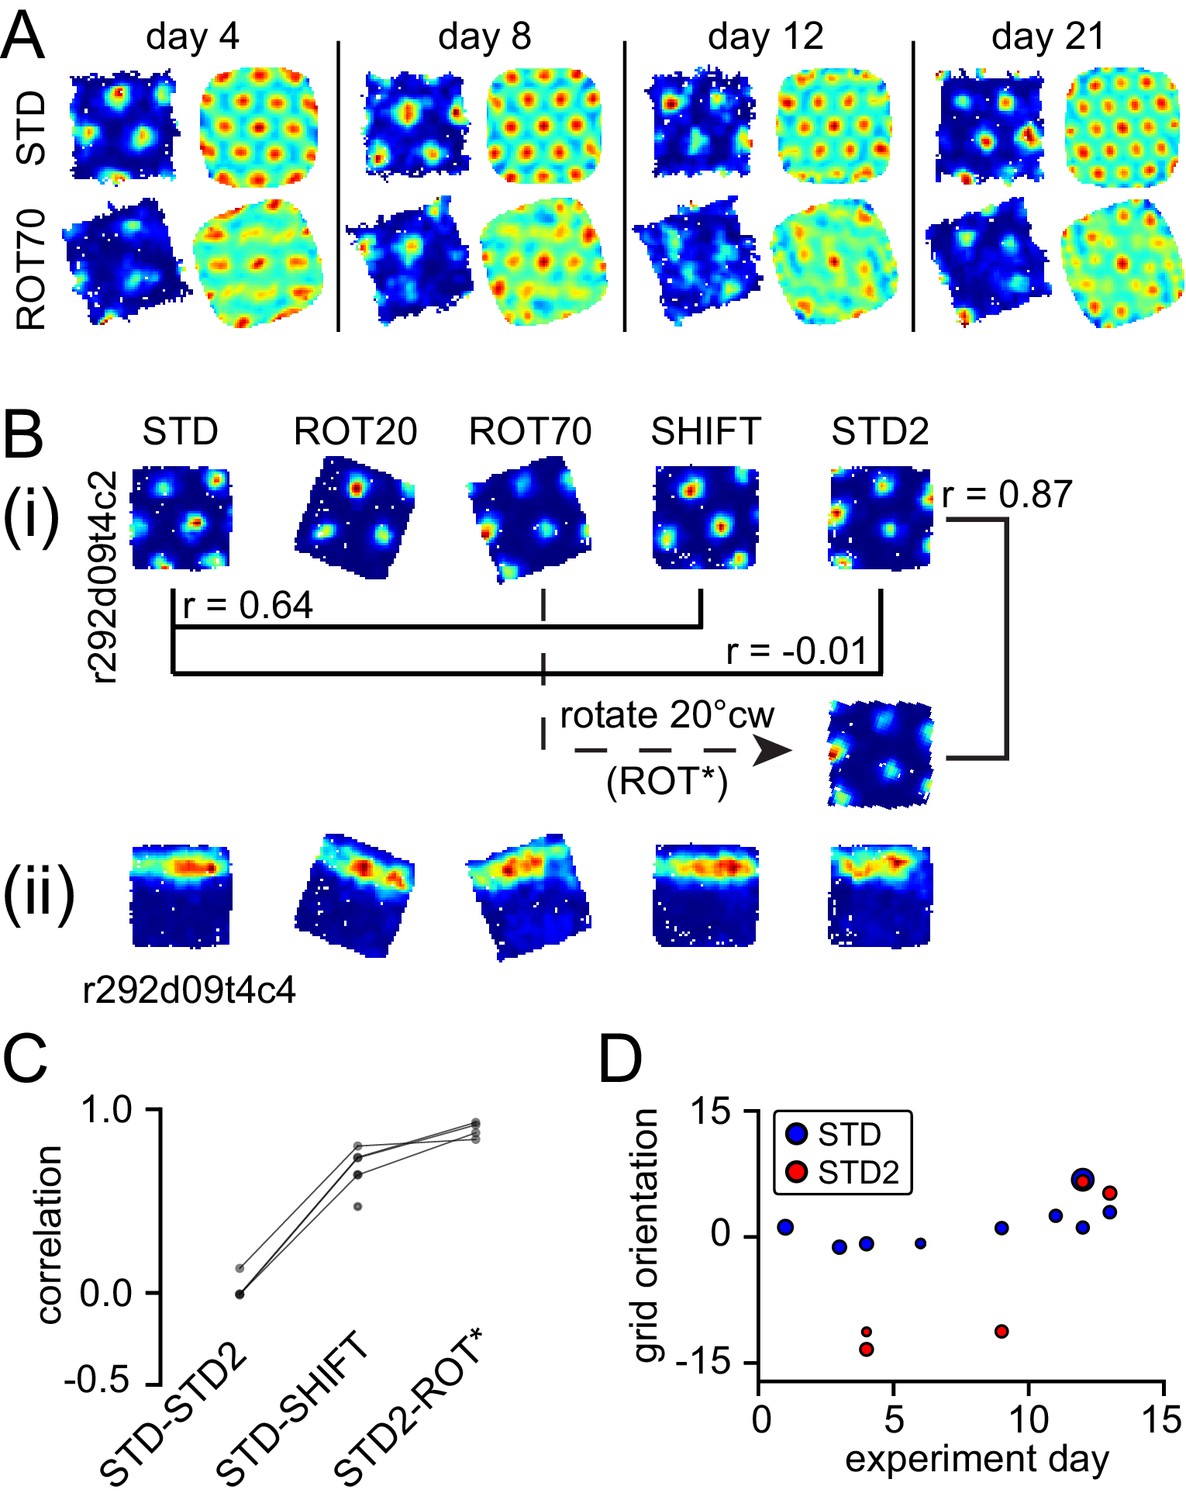
Neural correlates of cue conflict that are idiosyncratic but consistent within individual rats.
(A) Grid degradation. Rate maps and autocorrelograms of 4 grid cells recorded from four different tetrodes in rat 387 in both STD and ROT70 on four different days (including the first and last days in which grid cells were obtained in ROT70). The equilateral triangular structure, but not the multi-field nature, of the grid cells was dramatically reduced or entirely lost in ROT70. Rate maps for all sessions in which these cells were recorded and additional examples are given in figure supplement 1. (B) Grid realignment and dissociation from boundary cells. Rate maps for two units and all sessions of one experiment day, from rat 292. After varying amounts of realignment in the ROT20 and ROT70 conditions (i), the grid reverted back to its standard alignment relative to the platform boundaries in the SHIFT condition and shifted along with the platform (with a minor CCW rotation, as described in Figure 4B and G). However, in STD2, the grid did not maintain this standard alignment. Instead, the grid reverted to the same alignment relative to the platform boundaries that it had adopted in the ROT70 session. Pearson correlations between relevant maps quantify the poor overlap between STD and STD2 and the strong overlap between ROT70 and STD2 (after the ROT70 was rotated 20° CW). A simultaneously recorded boundary cell (ii) always fired along the upper platform boundary, dissociating from the realignment of the grid in ROT20, ROT70, and STD2 (re-illustrated as first example in Figure 7A). (Additional examples are given in Figure 6—figure supplement 2 and Figure 7A.) (C) Pearson correlations between rate maps from STD vs. STD2 (n = 4), STD vs. SHIFT (n = 6), and STD vs. the manipulation found to induce the new alignment in STD2 (n = 4), in a given day, for all grid cells and days in rat 292. Values referring to the same unit and day are linked. (D) Grid orientations in the standard sessions sampled over the course of 13 experiment days. Dot size is proportional to grid scale. Grid orientations in STD sessions (blue) are consistent across days in spite of the change of orientation experienced in STD2 sessions (red).
Figure 6—figure supplement 1
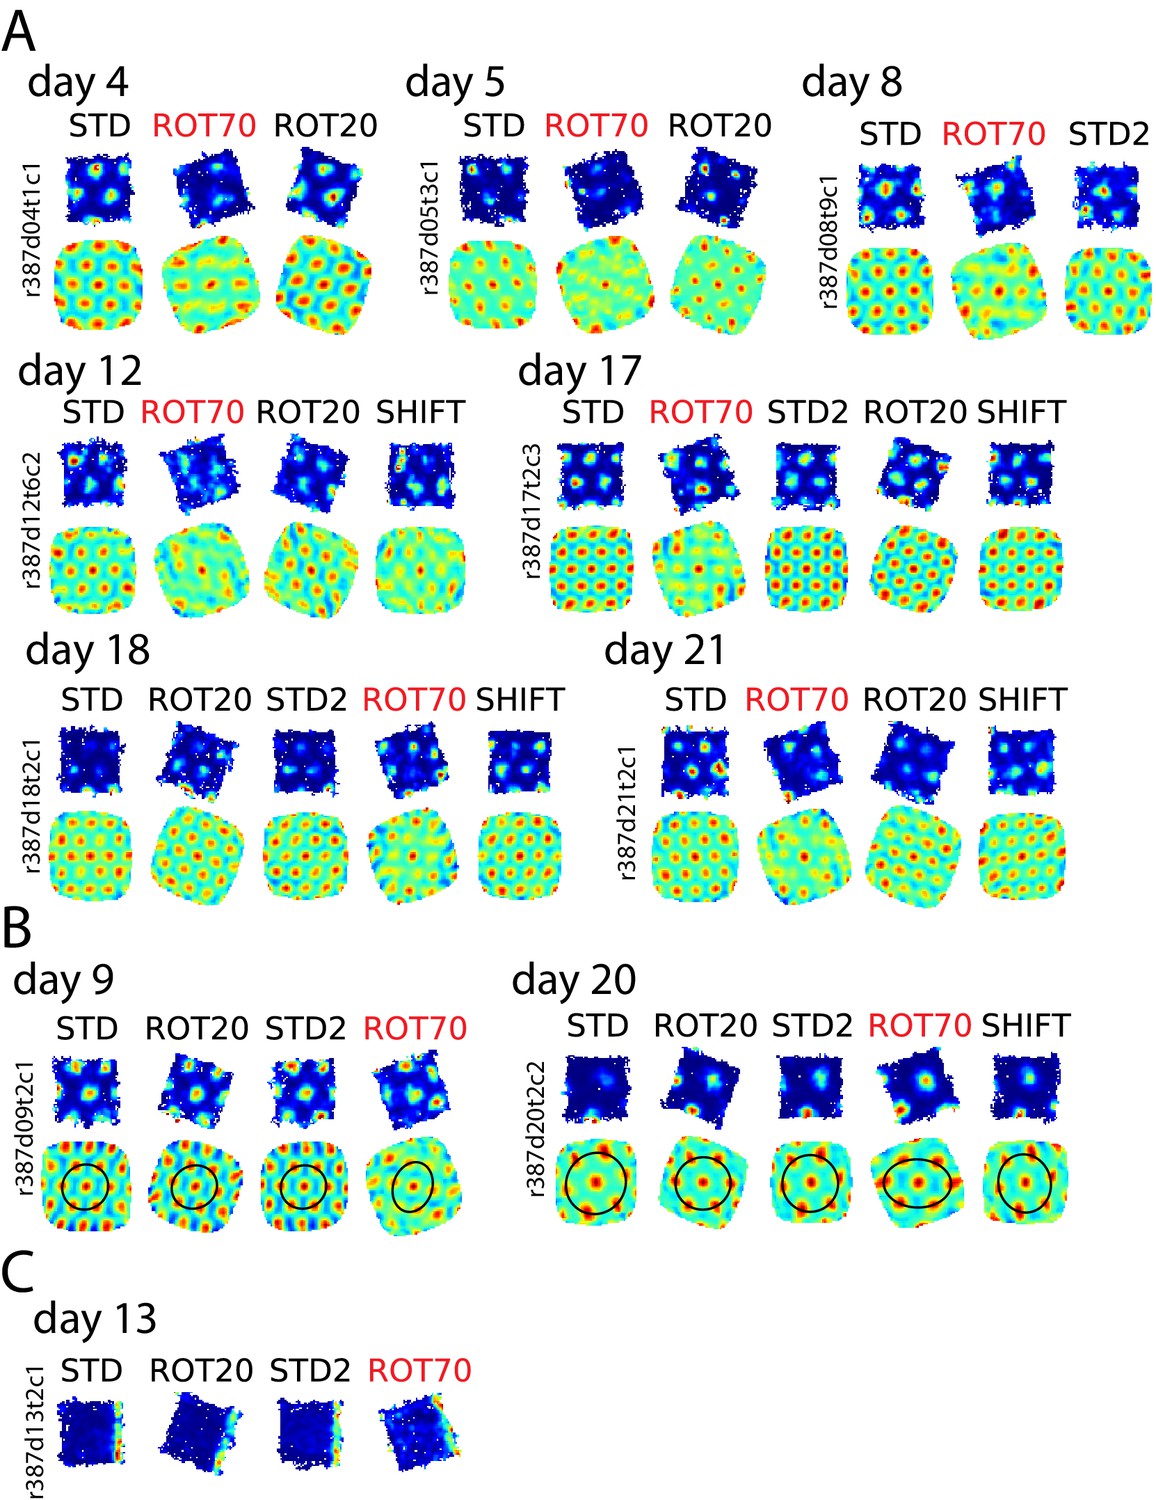
Selective loss of hexagonal grid structure in rat 387.
(A) Examples of grid cells that selectively lost or weakened the characteristic hexagonal structure in ROT70, including rate maps and autocorrelograms for all sessions recorded. (B) Examples of grid cells that passed the gridness test in the ROT70 manipulation but were subject to strong distortion. This distortion manifested itself in the autocorrelogram as an elliptical compression of the hexagonal pattern. (C) Example of boundary cell recorded in this animal. This cell functioned normally and tracked the same geometric boundary in all sessions, including ROT70. While a simultaneous recording of a grid cell lasting into this session was not available, in this rat grids dissociated from the platform boundaries in ROT70 (B, and Figure 3A), when they were not utterly disrupted (A, and Figure 6A). It is thus likely that a dissociation between grid and boundary receptive fields occurred in this animal, similar to rats 292 and 377 in Figure 7A,B.
Figure 6—figure supplement 2

Bistable anchoring of grids across reference frames and experimental sessions in rat 292.
All sessions are illustrated for grid cells recorded on the days when STD2 was run, in addition to the two cells in Figure 6B. Illustration and notations follow Figure 6B. In all examples, the alignment of the grid relative to the platform boundaries in STD2 differed from the alignment in STD but was the same as in a previous manipulation. The manipulation inducing the realignment affecting STD2 always preceded the SHIFT condition, regardless of the type of manipulation and the manipulation sequence. The STD2 session always inherited this orientation, even as markedly different orientations were experienced over the 1–2 intervening sessions. On Days 12, and 13, boundary cells were recorded simultaneously with the grid cells, similar to Figure 6B.
Figure 7 with 1 supplement

More examples of grid and boundary cells recorded simultaneously from rats 292 (A) and 377 (B).
Each simultaneously recorded set is in a separate bounding box. The rate maps for sessions labeled in parentheses were rotated to aid visual comparison of the changing firing patterns of grid cells vs. the repeating patterns of boundary cells. Rate maps for all sessions in which these cells were recorded are given in Figure 6, Figure 6—figure supplement 2 (rat 292) and Figure 7—figure supplement 1 (rat 377).
Figure 7—figure supplement 1
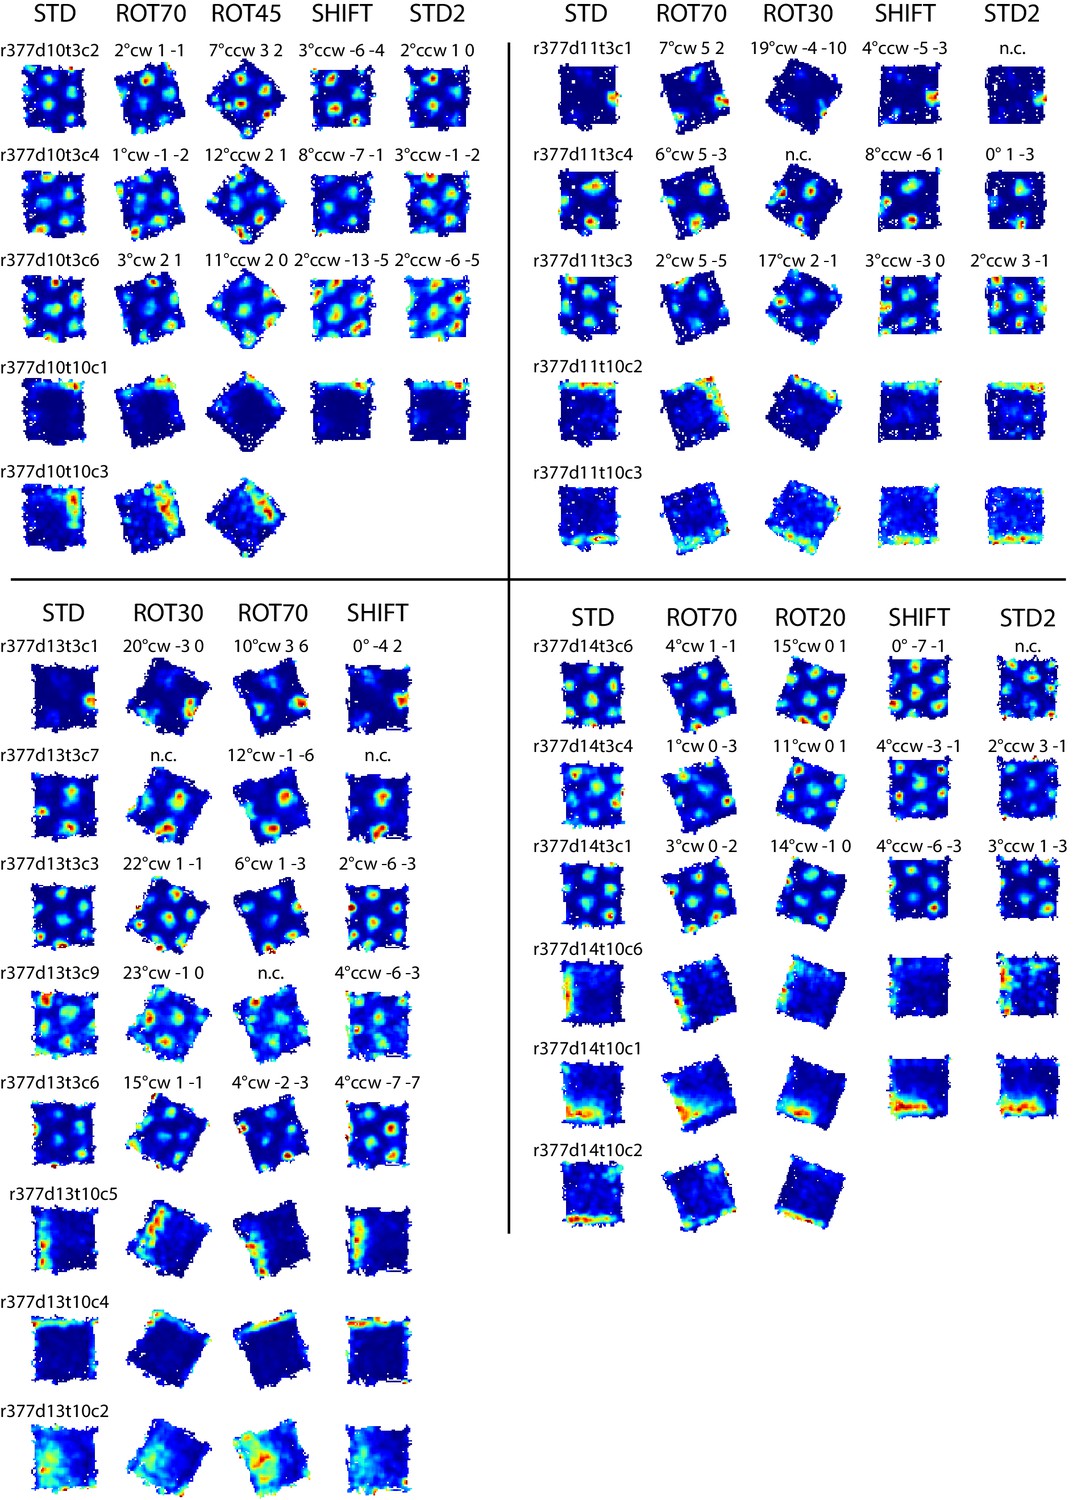
Examples of grid and boundary cells recorded simultaneously from rat 377.
Rate maps for all sessions in which the cells shown in Figure 7B were recorded, and other simultaneously recorded grid and boundary cells. Rate maps are grouped by day of recording as in Figure 7B (day 10, 11, 13, 14). Rate maps from manipulated conditions are annotated with the grid rotation and x, y components of the phase shifts measured in cm as elsewhere (see Figure 2). In ROT70 and ROT45 the firing patterns of several boundary cells tracked the same geometric boundary, whereas grids remained more strongly anchored to the room (see Figure 3A,D and Figure 3—figure supplements 1 and 2), generating the grid-boundary dissociations highlighted in Figure 7B. However, a number of exceptions were observed (e.g., r377d10t10c1, r377d11t10c2, r377d14t10c1) in which the firing pattern of the boundary cell seems to have spread across two walls in ROT70, perhaps consistently with the orientation concurrently expressed by the grids in accordance with the Boundary Vector Cell model (Hartley et al., 2000; Barry et al., 2006).
Figure 8 with 2 supplements
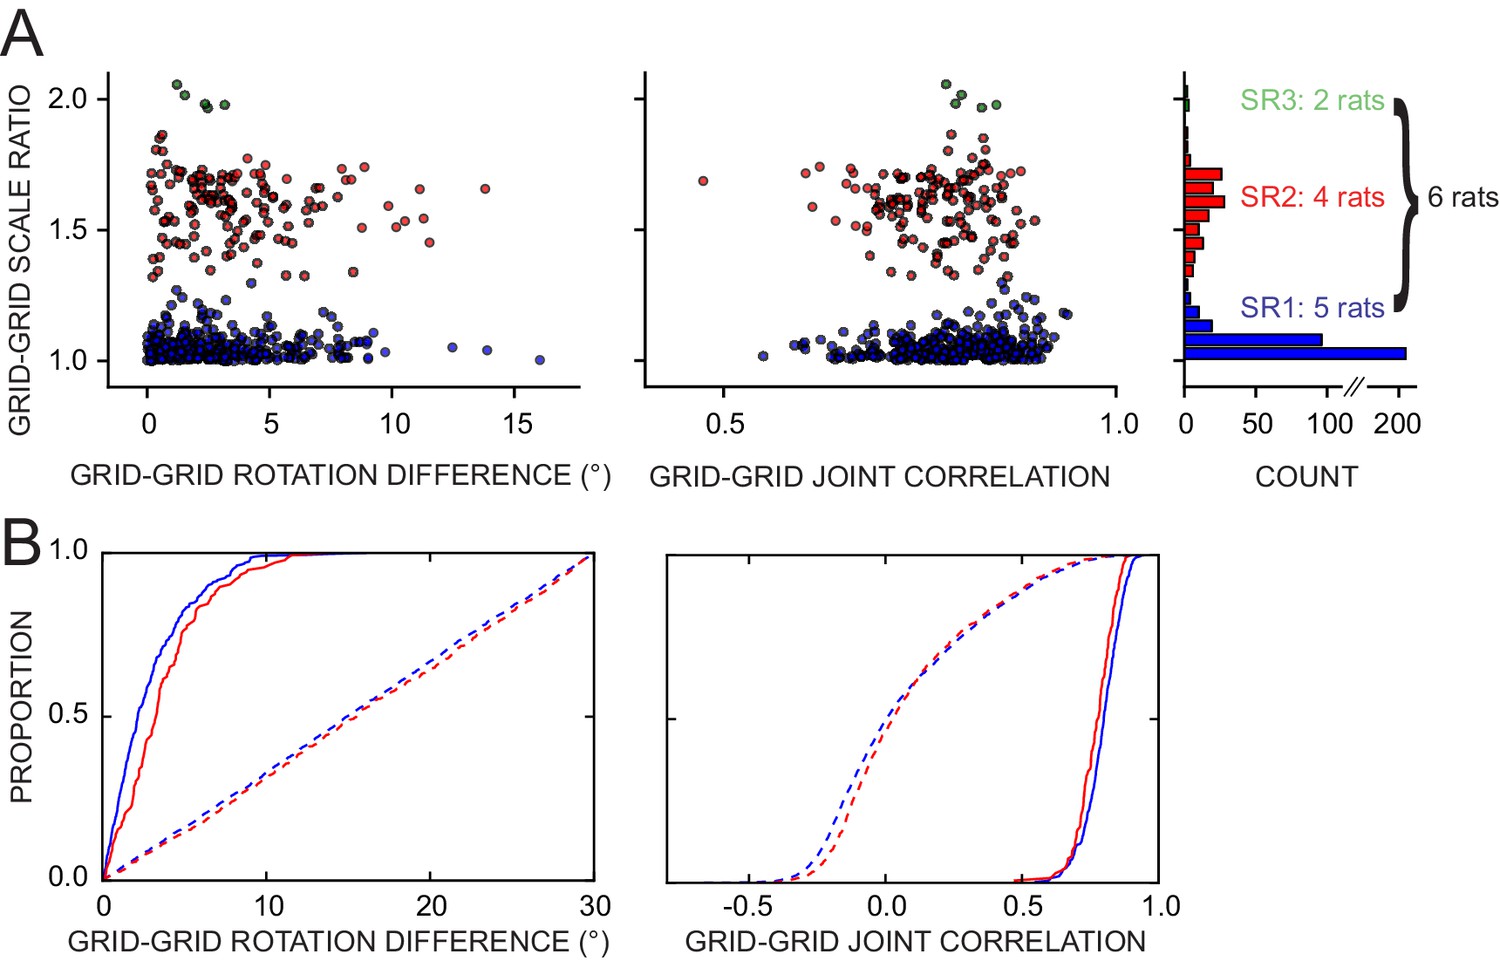
Response of simultaneously recorded grid cells.
(A) Difference in rotations and joint correlations for pairs of grid cells from six rats in all manipulations, by the pair’s grid scale ratio (SR): blue SR ≤ 1.3 (SR1); red: 1.3 < SR ≤ 1.9 (SR2); green: SR > 1.9 (SR3). Note that the scale-ratio clusters do not correspond to the absolute scales; rather, a scale ratio ~1.0 (blue dots) indicates two grids of the same scale (regardless of the absolute scale size) and a scale ratio ~1.6 indicates two grids from presumably adjacent modules (as defined by Stensola et al., 2012). The outliers in each scatterplot (rotation difference >10° on left, joint correlation <0.5 on right) were caused by six large-scale grids that participated in 11 pairs. Visual inspection of the rate maps of these six grids determined that poor spatial sampling of the peripheral vertices made these measurements ambiguous. (B) Cumulative density distributions for the SR1 and SR2 data in A (solid lines). For both measures, the two distributions were only slightly different from each other, indicating that grids across scales (SR2) were almost as coherent with each other as grids of the same scale (SR1). Dashed lines represent the control distributions generated by assigning a random phase and orientation response to each grid.
Figure 8—figure supplement 1
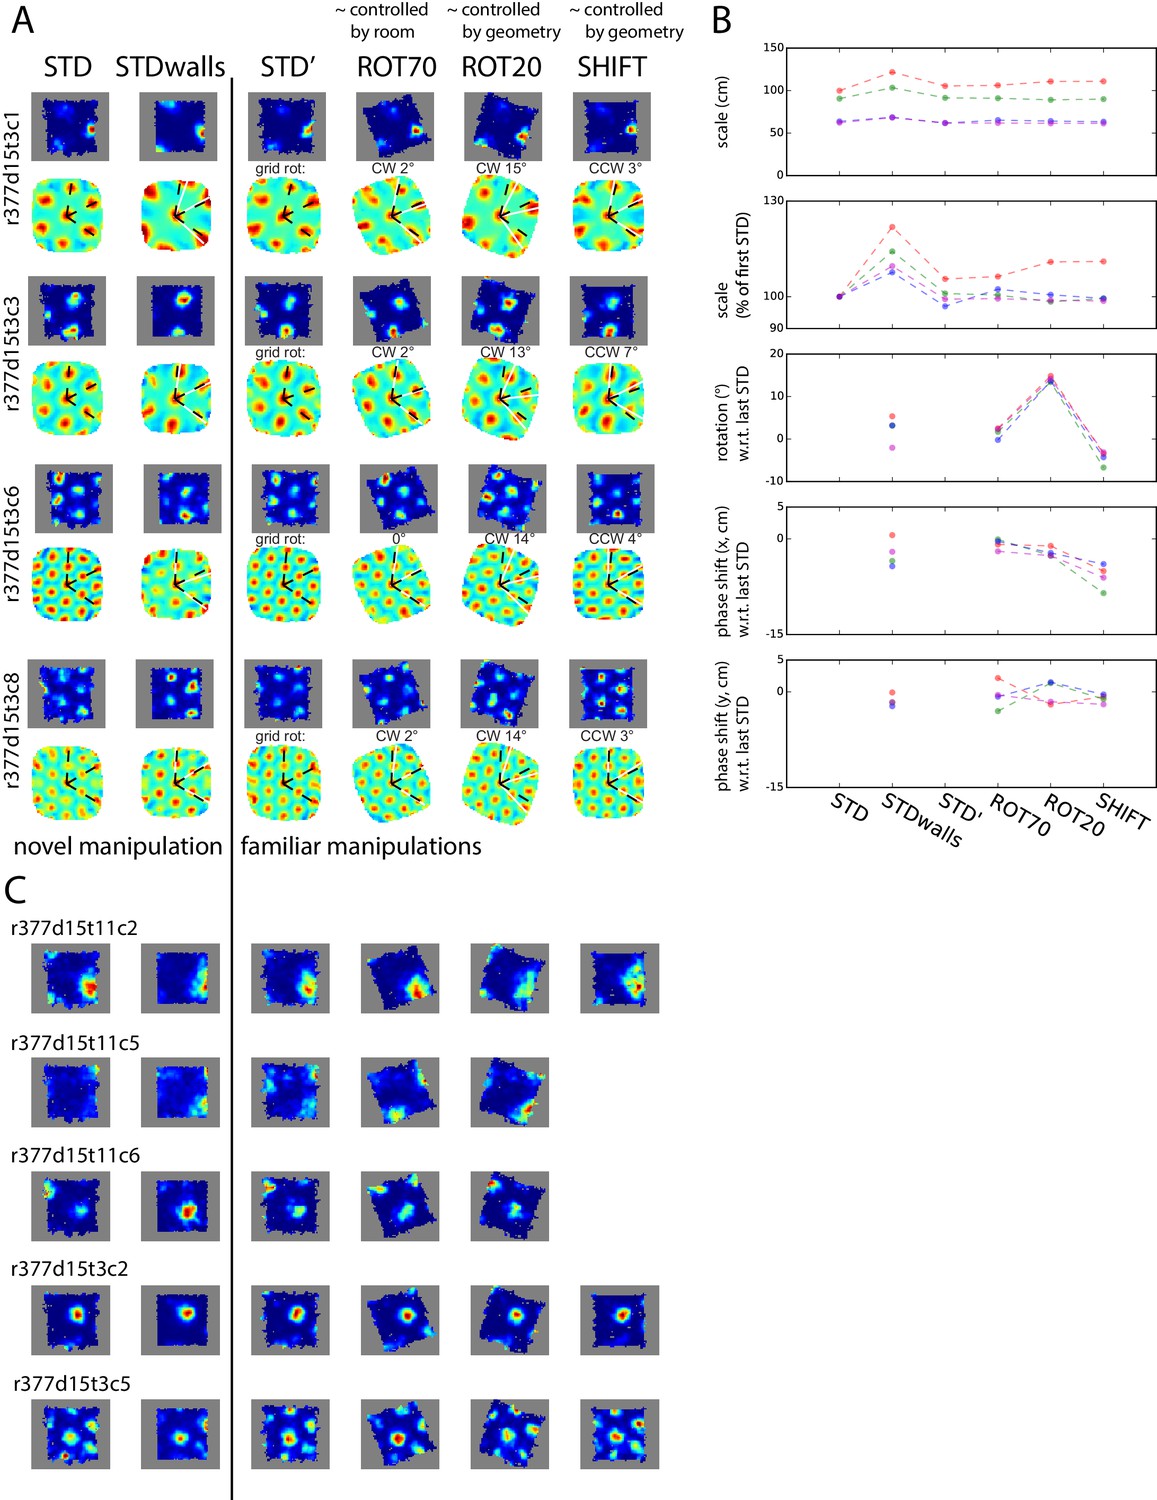
Simultaneously recorded grid cells from one day during novel and familiar manipulations.
In this particular day and rat only, the lips of the platform were replaced by tall walls in a second STD session (STDwalls) before a third STD session (STD’) was run to commence the usual manipulations. STDwalls elicited varying degrees of rescaling of the autocorrelogram’s grid pattern (Barry et al., 2012). In the following sessions, all cells showed tight geometric coupling whether they were controlled by the room (in ROT70) or by the platform (in ROT20 and SHIFT). (A) Rate maps and autocorrelograms of 4 grid cells: in the sessions following STD’, all possible pairwise cell combinations for any manipulation have rotational dissociation < 4° and joint correlation > 0.7. (B) Quantification and evolution of grid features of the cells in A, each cell in different color. Note the tight coordination of orientation and phase in the last four sessions, but a mildly divergent rescaling in the novel condition (STDwalls). (C) Additional cells that passed the grid test in at least one but not all sessions. Visual inspection (and quantification where possible – not shown) of these cells indicate that their response was consistent with A, B.
Figure 8—figure supplement 2
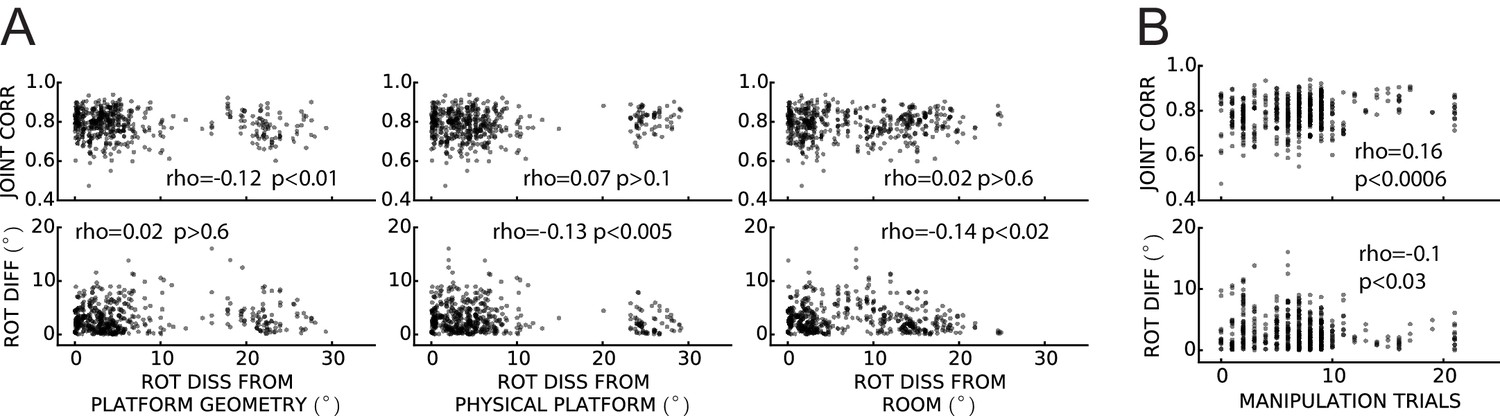
Weak or no relationship between grid coordination and (A) magnitude of dissociation of grids from any reference frame and (B) amount of experience.
Same data and measures as in Figure 8, replotted as a function of: (A) the grid angular drift from different reference frames elicited by the manipulation (minimum drift by either grid in the pair); and (B) previous experience with the manipulation (number of trials since the first experiment day). Spearman’s rank correlations (rho) are annotated. Note that while some of the correlations are statistically significant, all of the correlation coefficients are very small.
Tables
Table 1
Anatomical distribution of the grid cells recorded in ROT70. All 119 units reported in Figure 3A and the tetrodes from which they were recorded are here counted by mode of the response, brain area, and rat. Note that the same brain areas are represented in both modes, sometimes in multiple rats and by multiple tetrodes in the same rat. The different response accounted by the two modes is therefore unlikely to depend on a functional differentiation across brain areas or within the same area. Differences in the animal’s individual experiences and/or apparatus types appear more likely explanations. (MEC: medial entorhinal cortex; L2, L3, L2/3: respective layers of MEC; ParaS: parasubiculum.)
Rot70 mode | Brain area | Rat id (APPARATUS) | UNITS # | TETRODES # |
|---|---|---|---|---|
Left Mode | L2 | 332 (w/ walls) | 22 | 3 |
334 (w/ walls) | 2 | 1 | ||
L2/3 | 334 (w/ walls) | 7 | 1 | |
MEC/ParaS | 334 (w/ walls) | 2 | 2 | |
ParaS | 334 (w/ walls) | 16 | 2 | |
ParaS? | 292 (w/ walls) | 1 | 1 | |
Right Mode | L2 | 377 (w/ lips) | 6 | 1 |
387 (w/ lips) | 10 | 2 | ||
L3 | 377 (w/ lips) | 2 | 1 | |
MEC/ParaS | 377 (w/ lips) | 41 | 1 | |
ParaS | 377 (w/ lips) | 1 | 1 | |
387 (w/ lips) | 3 | 1 | ||
ParaS? | 292 (w/ lips) | 6 | 1 |
Download links
A two-part list of links to download the article, or parts of the article, in various formats.
Downloads (link to download the article as PDF)
Open citations (links to open the citations from this article in various online reference manager services)
Cite this article (links to download the citations from this article in formats compatible with various reference manager tools)
Framing of grid cells within and beyond navigation boundaries
eLife 6:e21354.
https://doi.org/10.7554/eLife.21354


