Hypoxic mitophagy regulates mitochondrial quality and platelet activation and determines severity of I/R heart injury
- Institute of Zoology, Chinese Academy of Sciences, China
- Peking University, China
- Peking University School of Basic Medical Sciences, Peking University, China
- Beijing Children’s Hospital, Capital Medical University, China
- Beijing Pediatric Research Institute, China
- MOE Key Laboratory of Major Diseases in Children, China
- Shanghai Jiaotong University, China
- Nankai University, China
Figures
Figure 1 with 5 supplements
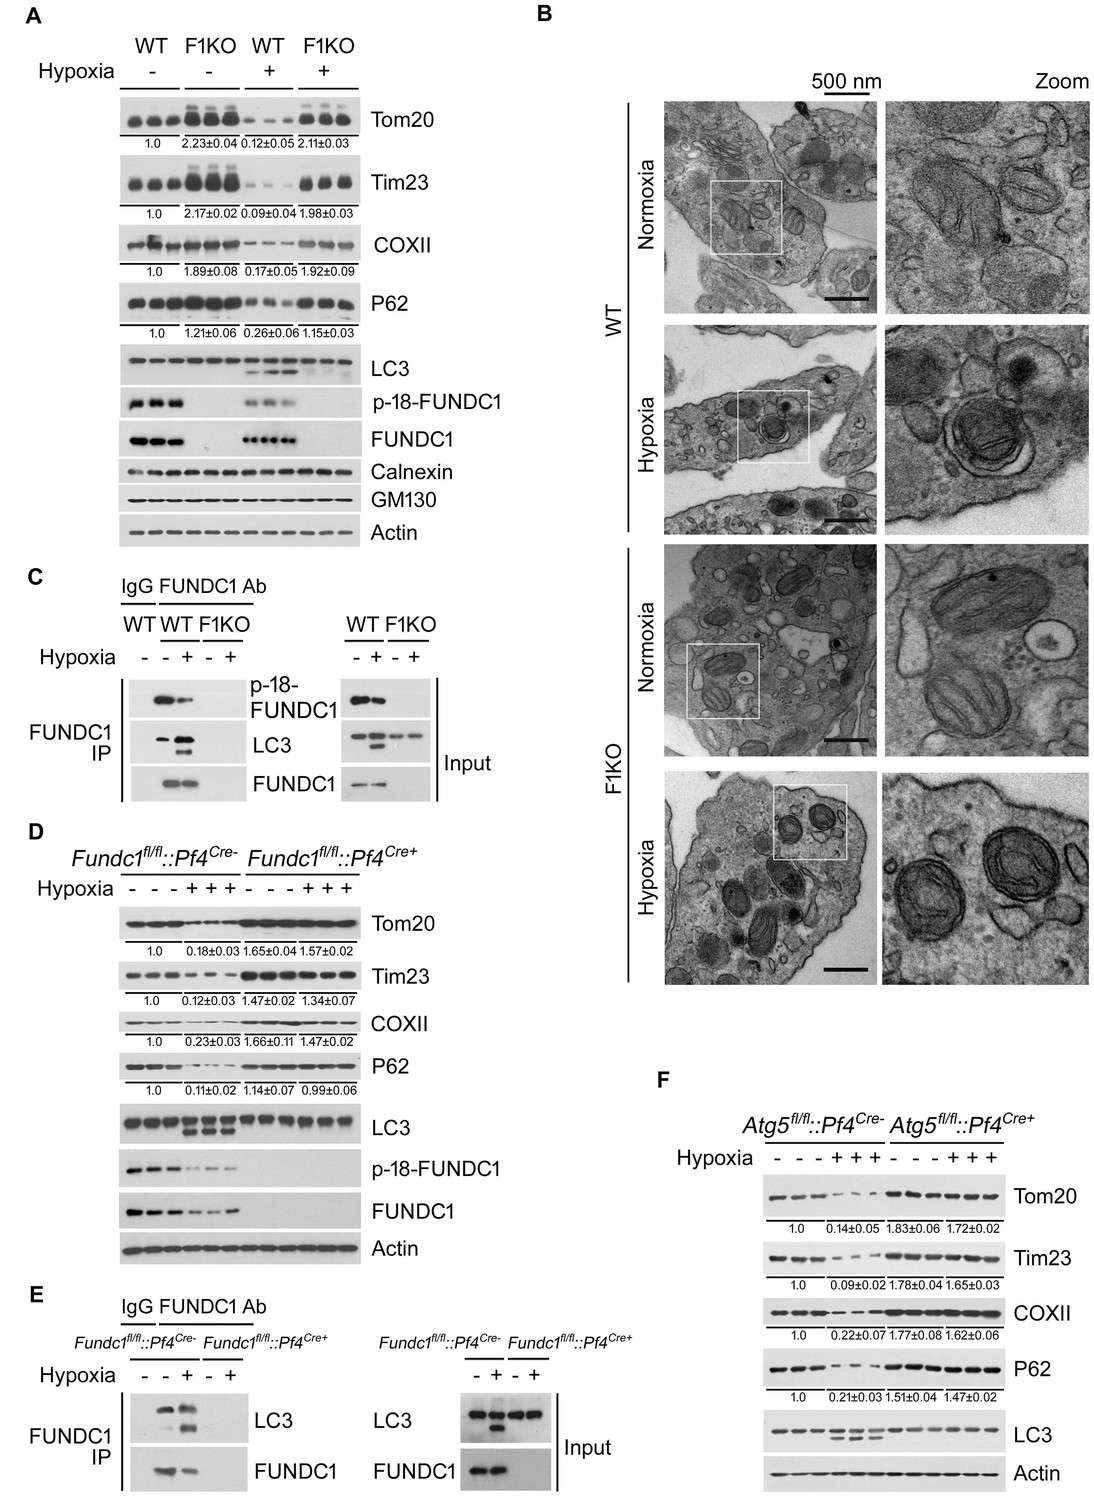
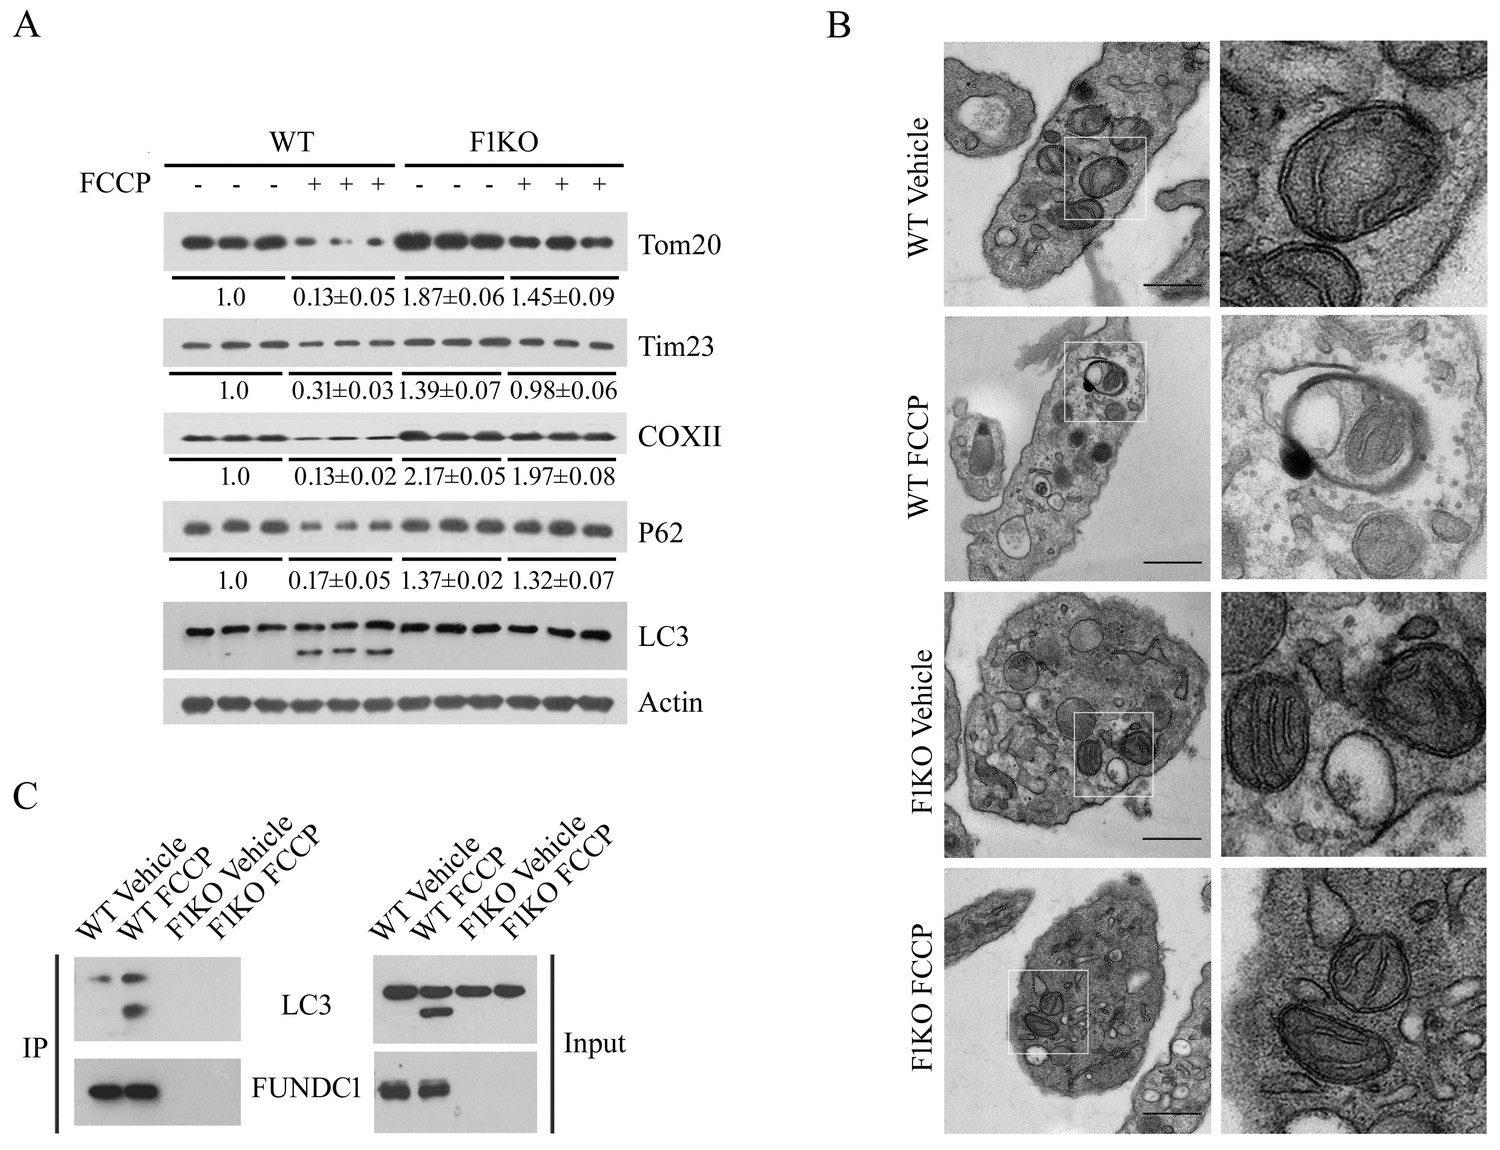
Hypoxia activates FUNDC1-dependent mitophagy in platelets in vivo.
(A) F1KO mice and wild-type (WT) mice were exposed to hypoxia (8%) for 72 hr. Platelets were prepared from the treated mice and were then subjected to western blot analysis using antibodies as indicated to detect the expression levels of mitochondrial proteins and P62 (n = 28). The grayscale values of the bands were analyzed with ImageJ software and are presented below the corresponding bands to show the band intensities. (B) Mitophagy was detected by transmission electron microscopy. Scale bar, 500 nm. Quantification of mitochondria enclosed in autophagosomes was performed, and 6 out of 485 mitochondria were observed within autophagosomes in 97 platelets from WT mice exposed to hypoxia (8% O2) for 72 hr. No mitochondria were detected in autophagosomes in the other groups. (C) Co-immunoprecipitation of FUNDC1 with LC3 was conducted in platelets isolated from mice treated with or without hypoxia. (D, E) Platelets were prepared from platelet-specific Fundc1 knockout (Fundc1fl/fl::Pf4Cre+) mice and (Fundc1fl/fl::Pf4Cre-) littermates as described in (A). Mitophagy was analyzed by western blotting (D) and statistical analysis of the band intensities was performed as in (A) (n = 9). The interaction of FUNDC1 with LC3 was investigated by CO-IP (E) (n = 15). (F) Platelet-specific Atg5 knockout (Atg5fl/fl::Pf4Cre+) mice and wild-type littermates (Atg5fl/fl::Pf4Cre-) were exposed to hypoxia and platelets were prepared from the treated mice as described in (A). Mitophagy was analyzed by western blot (n = 9).
Figure 1—figure supplement 1
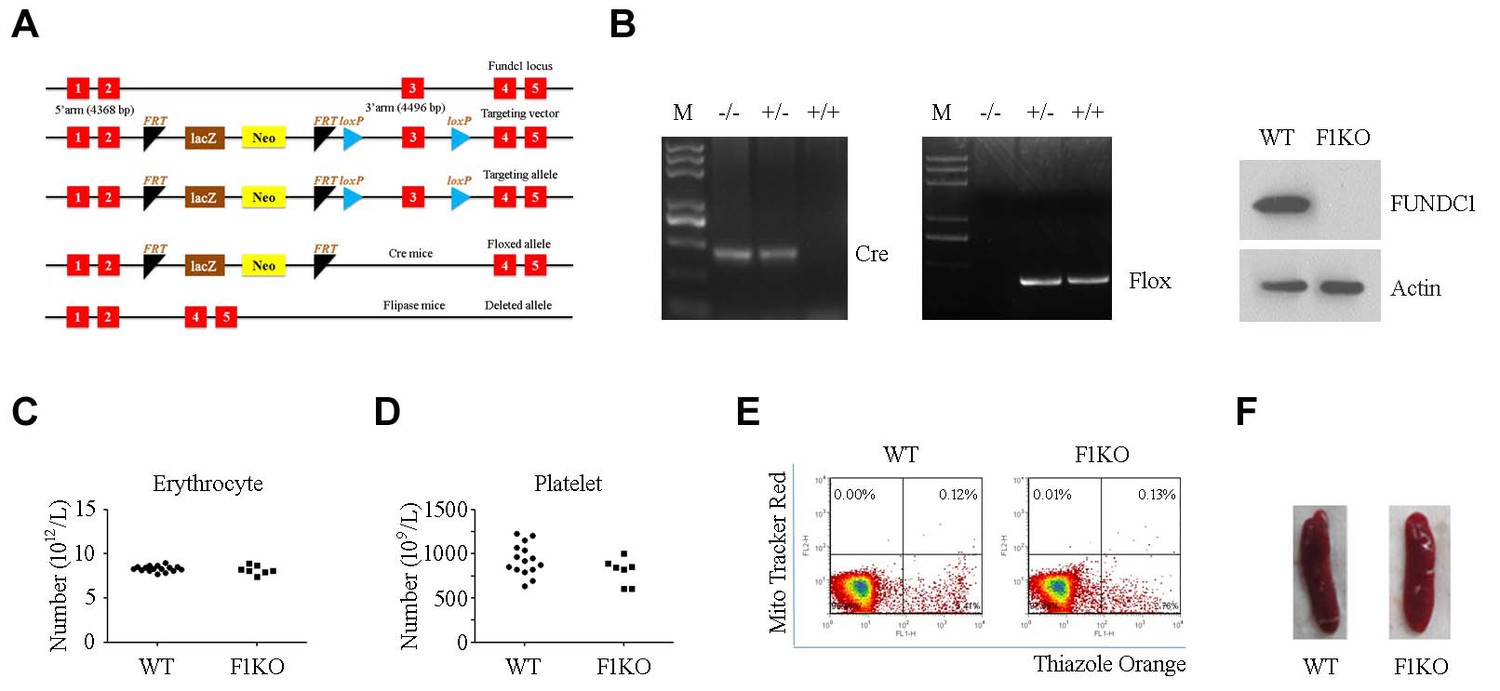
Construction and identification of F1KO mice.
(A) Scheme showing generation of F1KO mice. (B) Identification of F1KO mice by PCR and western blot. (C, D) Erythrocytes and platelets were counted by routine blood analysis. (E) Reticulocytes were analyzed by flow cytometry using Thiazole Orange. (F) Morphology of the spleen.
Figure 1—figure supplement 2
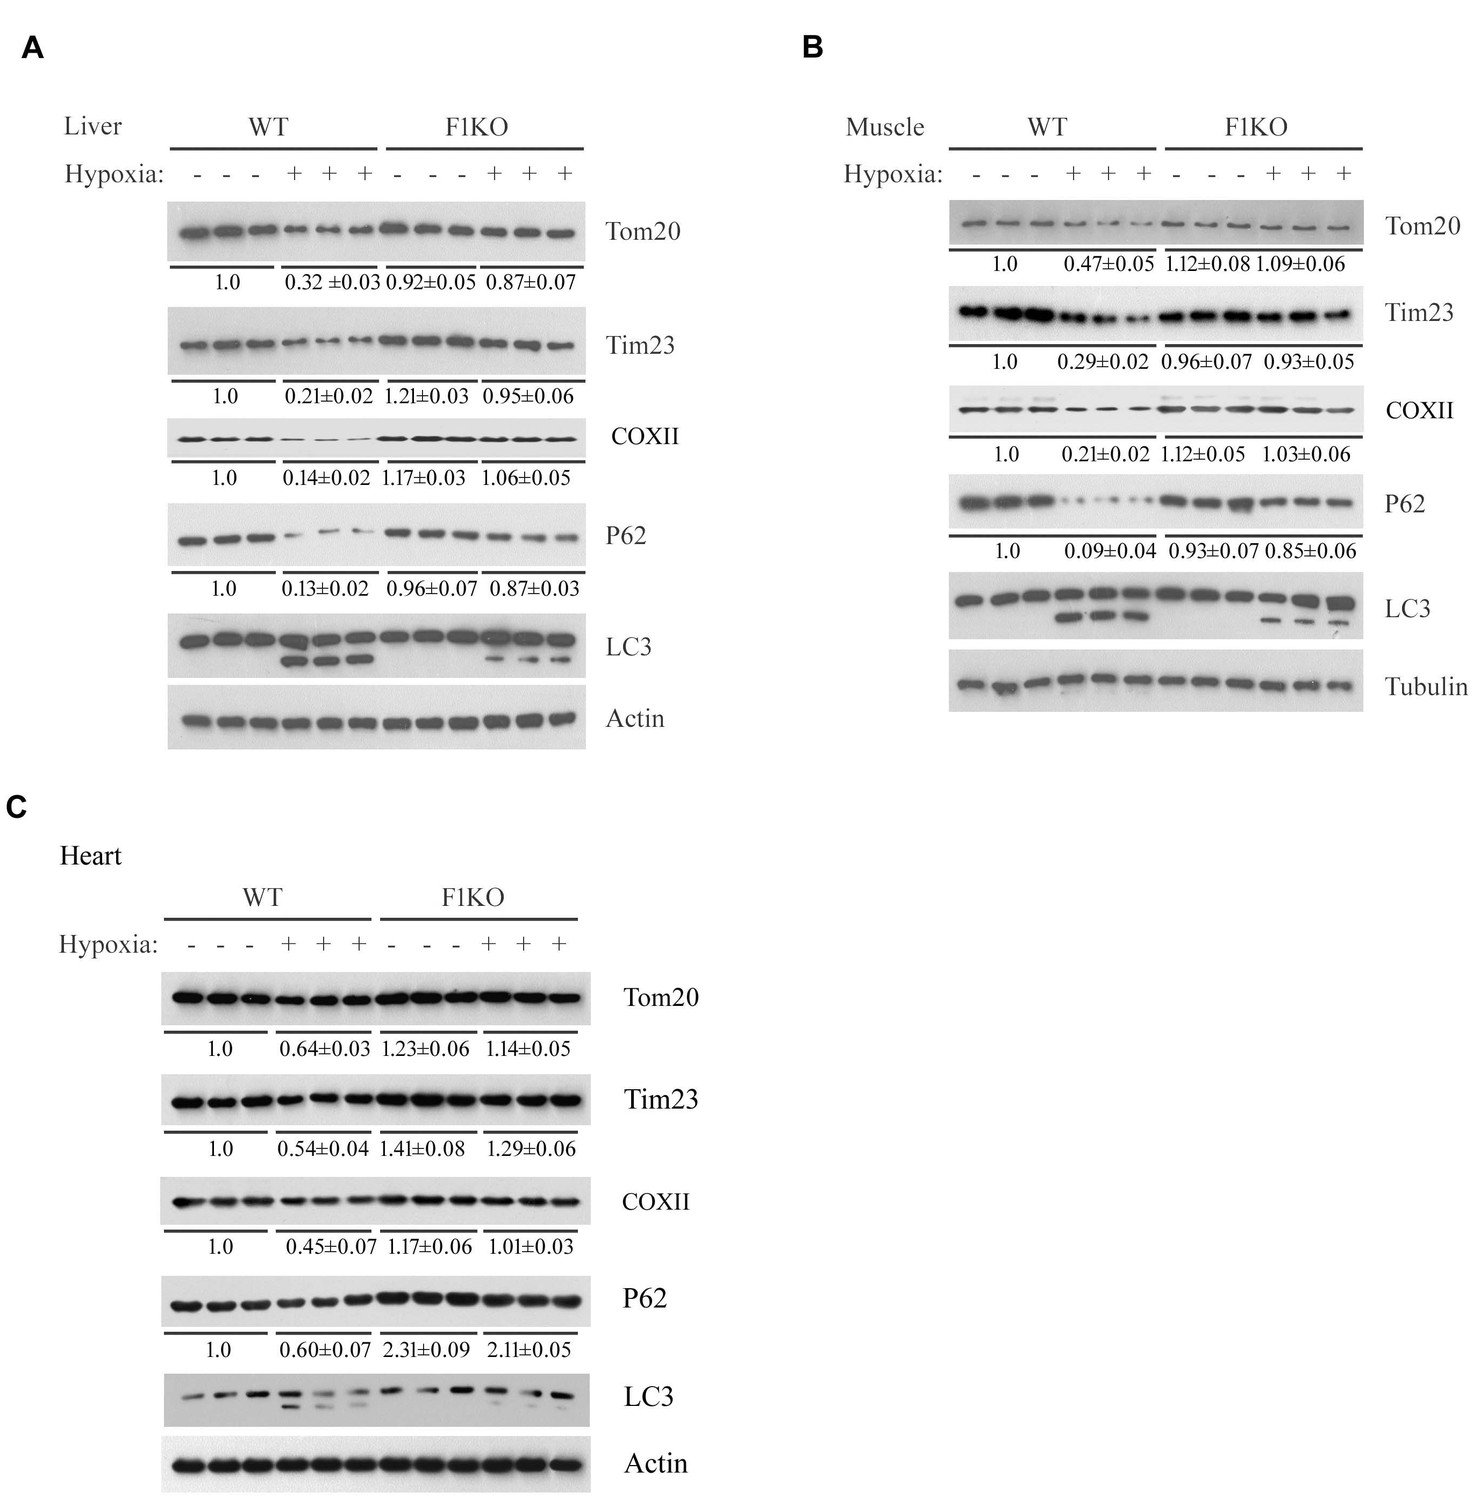
Detection of mitophagy in heart, liver and skeletal muscle from F1KO mice and WT mice exposed to hypoxia.
F1KO mice and wild-type (WT) mice were exposed to hypoxia (8% oxygen) for 72 hr. Mitophagy marker proteins in liver (A), skeletal muscle (B) and heart (C) from treated and untreated mice were detected by western blot using the indicated antibodies. The expression levels of mitochondrial proteins and P62 were detected and the grayscale values of the bands were analyzed with ImageJ software. The values are presented below the corresponding bands to show the intensities.
Figure 1—figure supplement 3
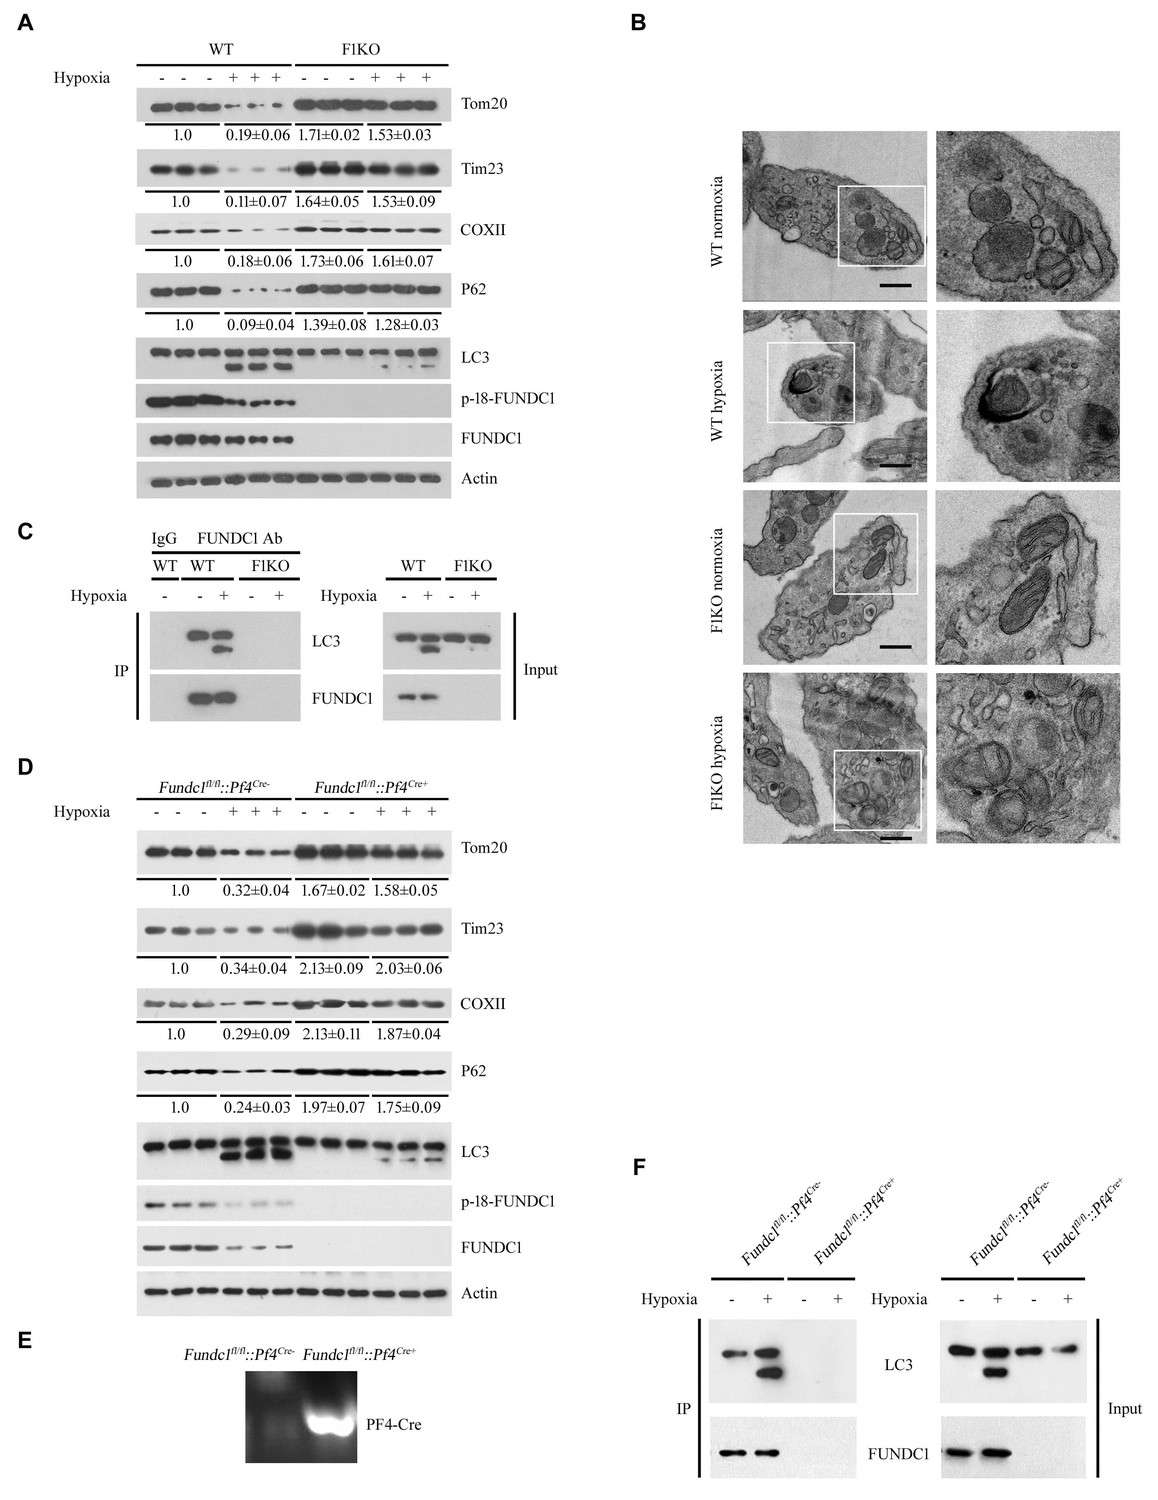
Ex vivo analysis of platelet mitophagy induced by hypoxia.
(A, B) Platelets from F1KO mice were exposed to hypoxia (2% O2) for 2 hr ex vivo, and then mitophagy was detected by western blot using the indicated antibodies (A) and by EM (B). Boxed areas in the EM images are shown enlarged in the right panels. Scale bar, 500 nm. Quantification of mitochondria enclosed in autophagosomes was performed, and 5 out of 413 mitochondria were observed within autophagosomes in 89 platelets from WT mice exposed to hypoxia (2% O2) for 2 hr. No mitochondria were detected within autophagosomes in the other groups. (C) The interaction of FUNDC1 with LC3 was examined by CO-IP. (D) Platelets from platelet-specific Fundc1 KO (Fundc1fl/fl::Pf4Cre+) mice and their littermates (Fundc1fl/fl::Pf4Cre-) were exposed to hypoxia (2% O2) for 2 hr ex vivo, and then mitophagy was detected by western blot (D) using the indicated antibodies. (E) Identification of platelet-specific knockout of Fundc1 by PCR of genomic DNA. (F) The interaction of FUNDC1 with LC3 in platelets from (Fundc1fl/fl::Pf4Cre+) mice and their littermates (Fundc1fl/fl::Pf4Cre-) was examined by CO-IP. In (D), the expression levels of mitochondrial proteins and P62 were detected and the grayscale values of the bands were analyzed with ImageJ software. The values are presented below the corresponding bands to show the band intensities.
Figure 1—figure supplement 4
The mitochondrial toxin FCCP induces platelet mitophagy.
(A, B) Platelets were pre-treated with FCCP (10 μM) at room temperature for 2 hr, and then platelet mitophagy was detected by western blot using the indicated antibodies (A) and by electron microscopy (B). The panels on the right show magnified areas of the panels on the left. Scale bar, 500 nm. Quantification of mitochondria enclosed in autophagosomes was performed, and 5 out of 437 mitochondria were observed within autophagosomes in 100 platelets from WT mice exposed to hypoxia (2% O2) for 2 hr. No mitochondria were enclosed in autophagosomes in the other groups. (C) The interaction of FUNDC1 with LC3 was examined by CO-IP. The expression levels of mitochondrial proteins and P62 were detected and the grayscale values of the bands were analyzed with ImageJ software. The values are presented below the corresponding bands to show the band intensities.
Figure 1—figure supplement 5
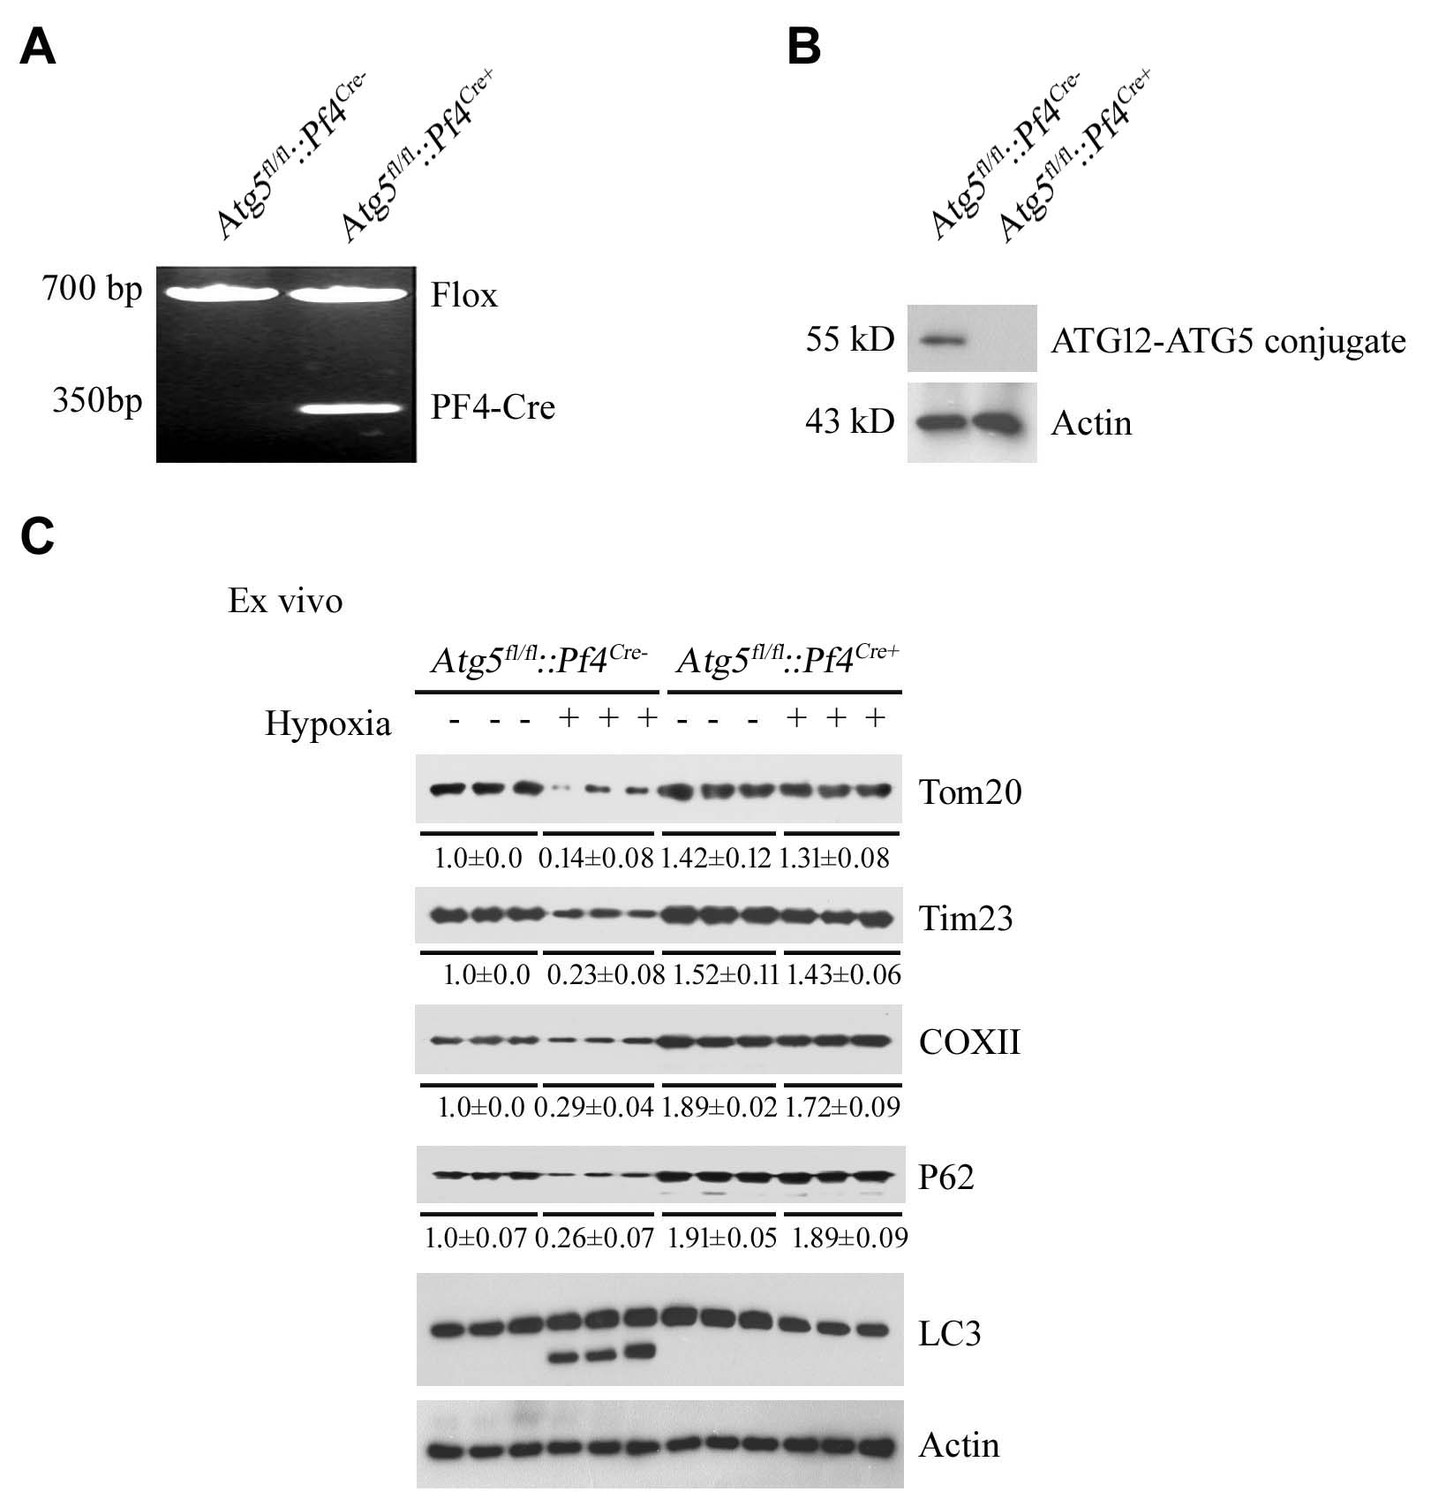
Analysis of mitophagy in platelets with platelet-specific knockout of Atg5.
(A, B) Mice with platelet-specific knockout of Atg5 (Atg5fl/fl::Pf4Cre+) were analyzed by PCR of genomic DNA (A) and western blot (B). (C) Mitophagy induced by hypoxia ex vivo was analyzed in platelets isolated from Atg5fl/fl::Pf4Cre- and Atg5fl/fl::Pf4Cre+ mice. In (B), the expression levels of mitochondrial proteins and P62 were detected and the grayscale values of the bands were determined with ImageJ software. The values are presented below the corresponding bands to show the band intensities.
Figure 2 with 2 supplements
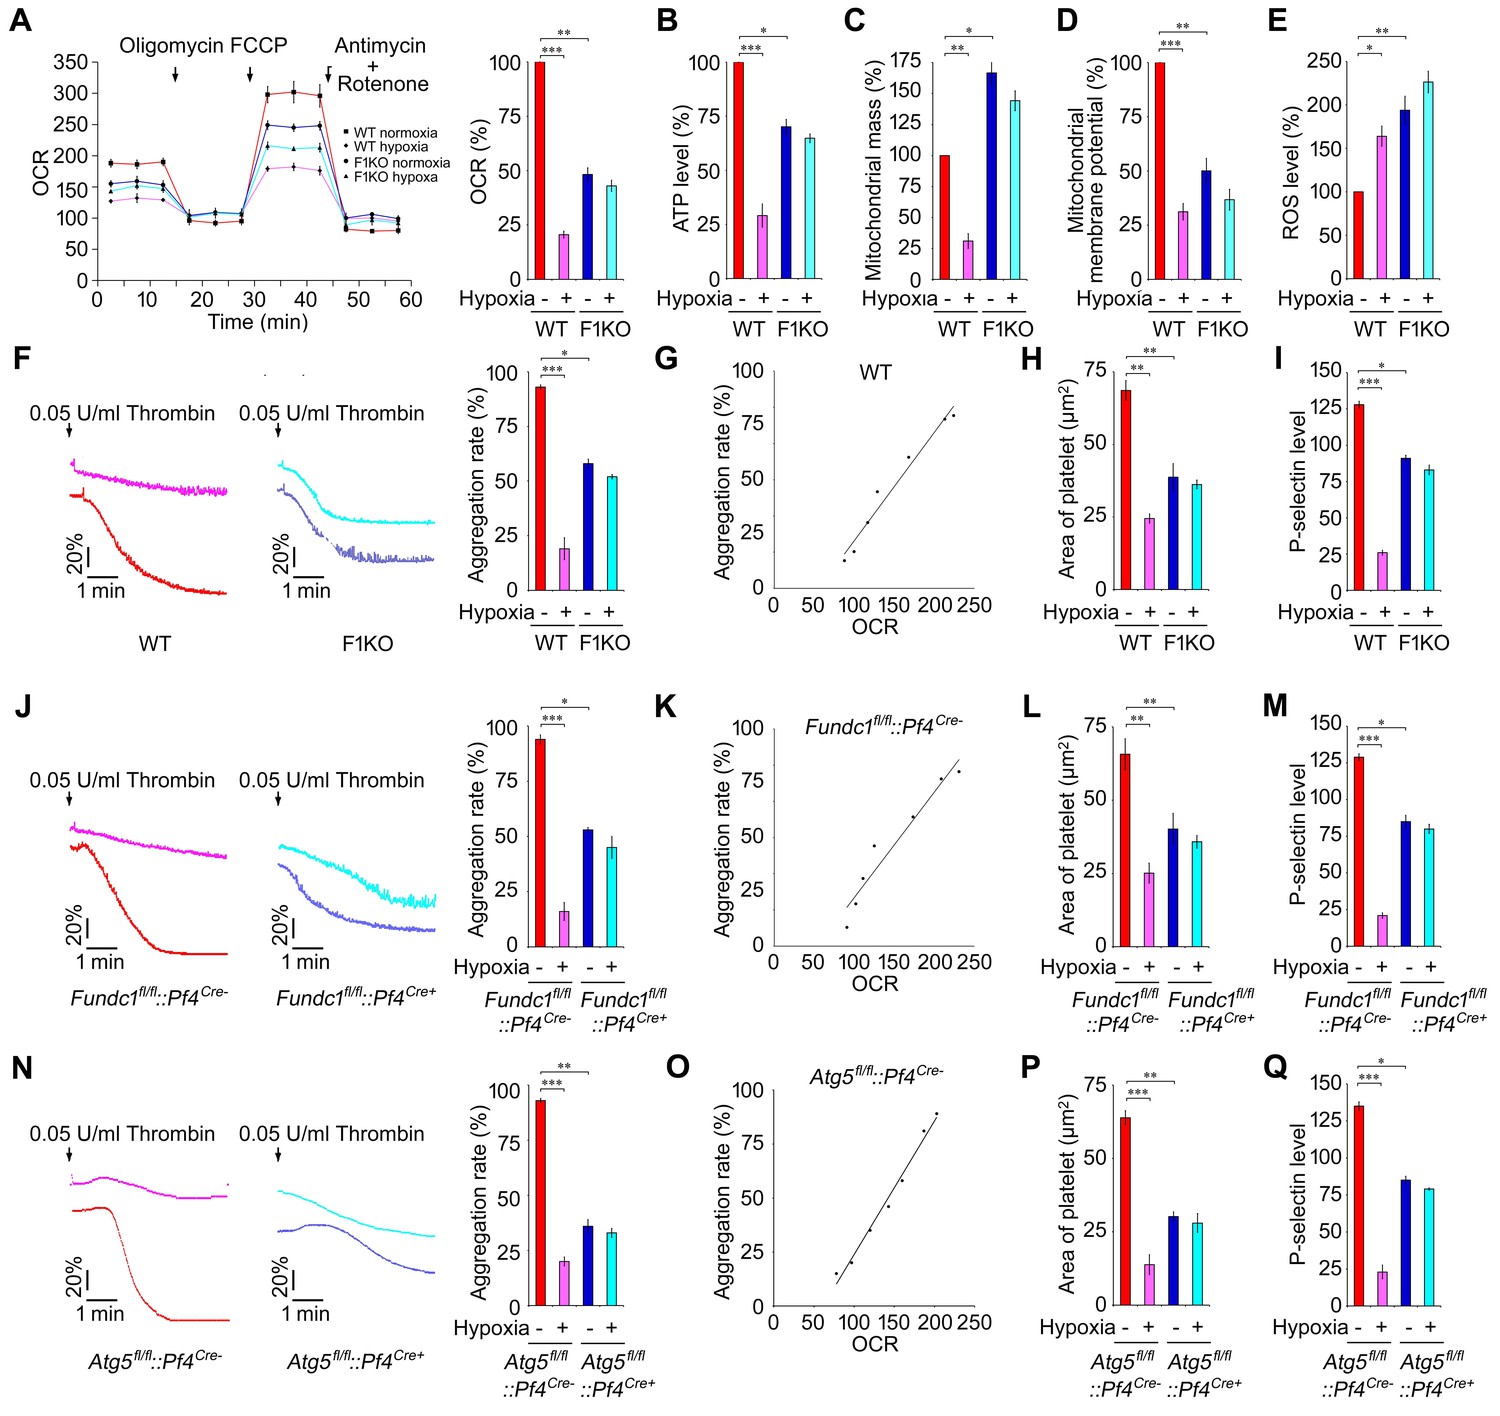
Hypoxic mitophagy determines mitochondrial quality and platelet activation in vivo.
F1KO mice and wild-type (WT) mice (A–I), Fundc1fl/fl::Pf4Cre- and Fundc1fl/fl::Pf4Cre+ mice (J–M) and Atg5fl/fl::Pf4Cre- and Atg5fl/fl::Pf4Cre+ mice (N–Q) were treated for 72 hr under 8% hypoxia. (A). The oxygen consumption rate (OCR) of platelets was measured by Seahorse (A, left) and was normalized to the level in normoxic WT platelets (A, right). (B) ATP level was detected and normalized to the percentage in normoxic WT platelets. (C) Mitochondrial mass was measured by flow cytometry after staining with NAO (20 nM) and was normalized to the percentage in normoxic WT platelets. (D) Mitochondrial membrane potential was analyzed by flow cytometry and normalized to the percentage in normoxic WT platelets. (E) ROS levels were detected by flow cytometry. DCF fluorescence intensity was quantified using BD FACS Calibur and CellQuest software. ROS levels were normalized to the percentage in normoxic WT platelets. (F, J, N) Platelet aggregation was analyzed (n = 16) using a turbidometric aggregometer. (G, K, O) The correlation between mitochondrial OCR and aggregation was analyzed in platelets treated with different concentrations of thrombin (0.00625, 0.0125, 0.025, 0.05, 0.10, 0.20, 0.40 U/mL). (H, L, P) Platelet spreading was analyzed after treatment with 0.05 U/ml thrombin. At least 96 platelets were analyzed in each group. (I, M, Q) P-selectin expression on platelets after activation with 0.05 U/ml thrombin was analyzed by flow cytometry. Data from three separate experiments are presented as mean ± s.e.m. *p<0.05. **p<0.01. ***p<0.001.
Figure 2—figure supplement 1
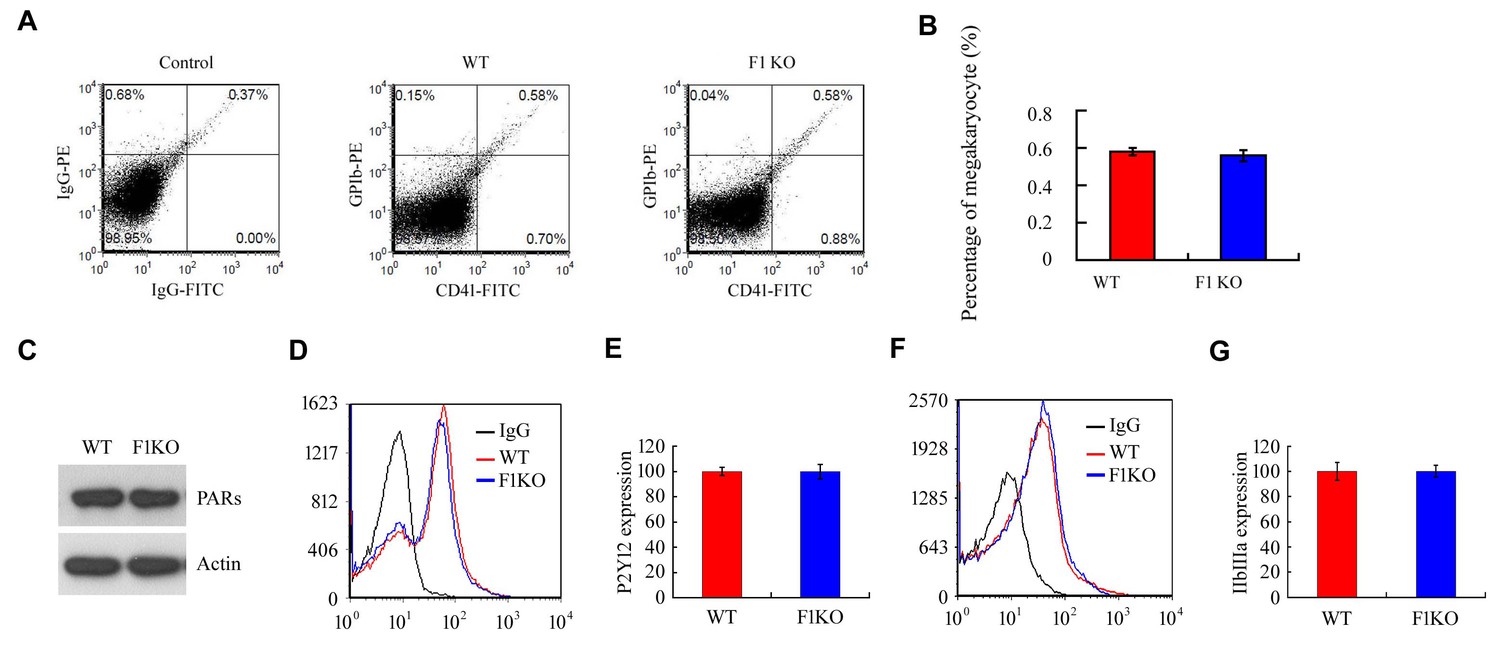
FUNDC1 deficiency has no effect on megakaryocyte production or the expression of platelet membrane receptors.
(A, B) Bone marrow from the indicated mice was analyzed by flow cytometry using antibodies against CD41-FITC and GBIb PE. Statistical analysis of the data is shown in (B). (C) The thrombin receptors (PARs) were detected on mouse platelets by western blot using a specific antibody against PARs. (D, E) The ADP receptor P2Y12 was detected on mouse platelets by flow cytometry using a P2Y12-specific antibody. (F, G) The integrin receptor IIbIIIa was detected on mouse platelets by flow cytometry using a IIbIIIa-specific antibody.
Figure 2—figure supplement 2
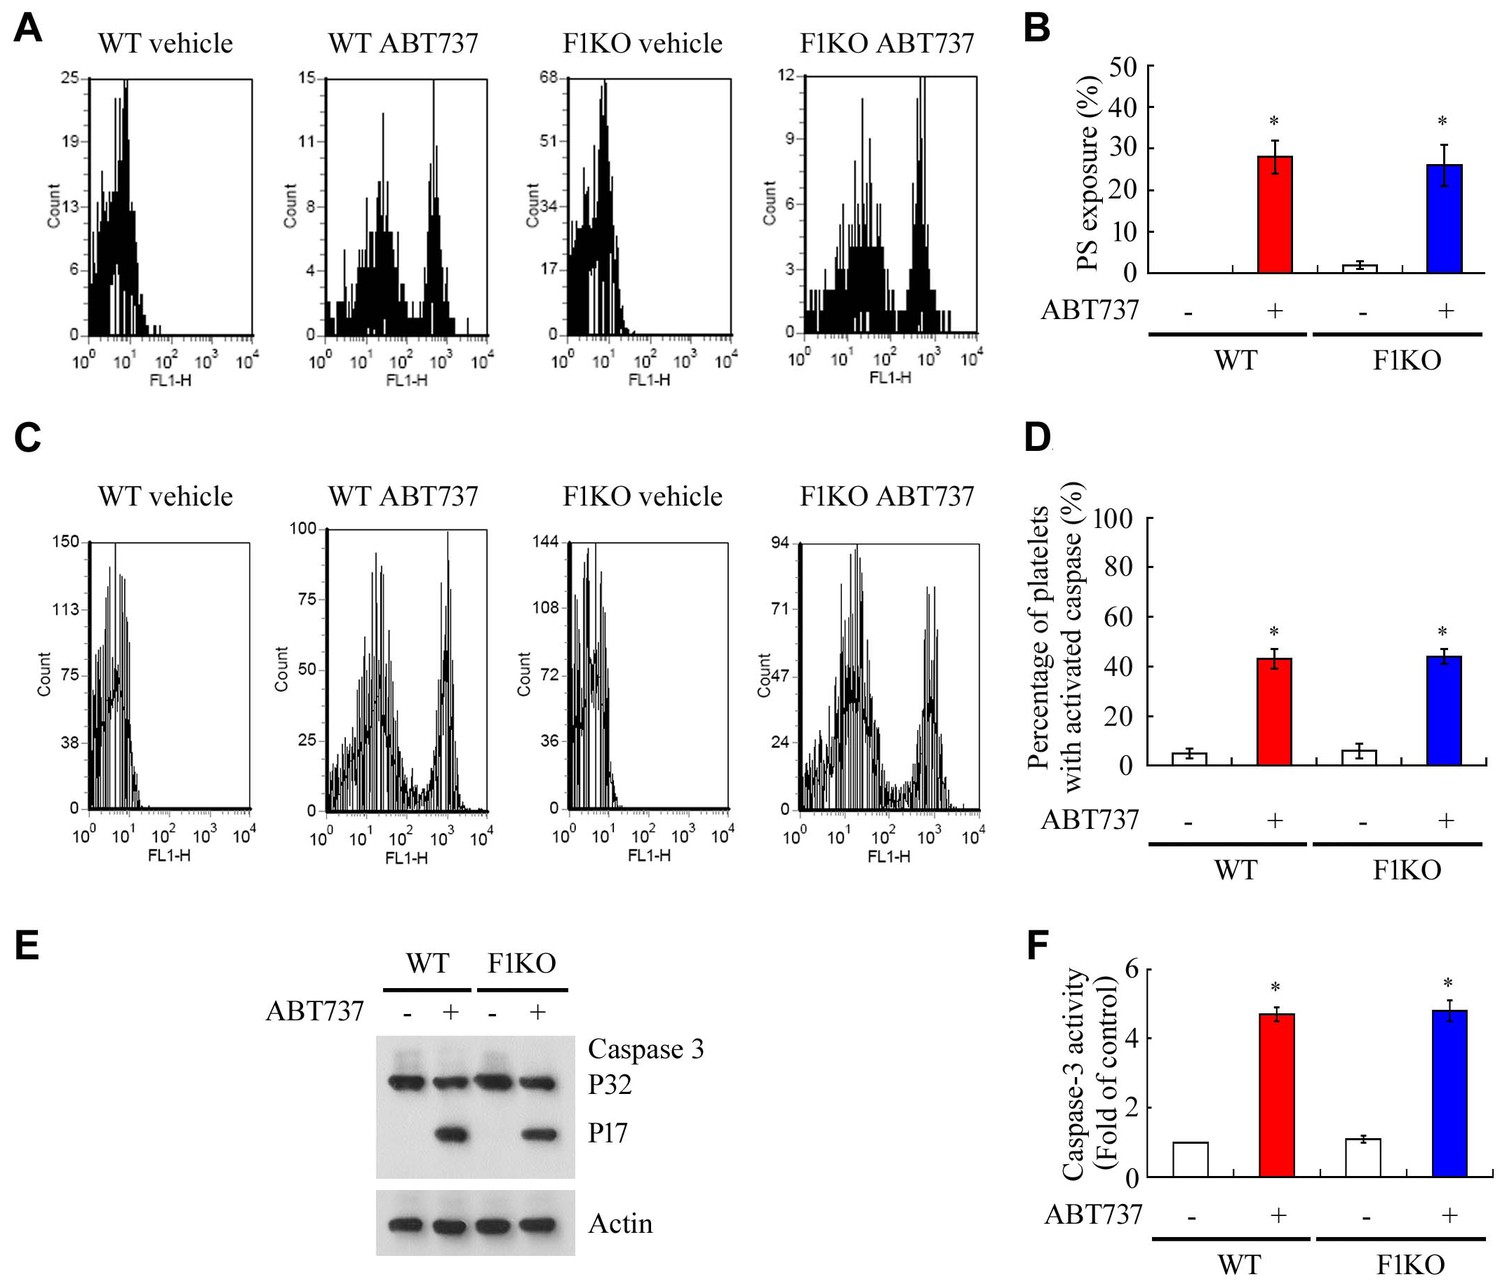
FUNDC1 deficiency does not affect platelet apoptosis induced by ABT737.
(A, B) WT and F1KO platelets were incubated with vehicle control or ABT737 ((10 μM) at 37°C for 60 min. Phosphatidylserine exposure on the pre-treated platelets was analyzed by flow cytometry using Annexin V-FITC (A). Statistical comparison of the data is presented in (B). (C, D, E, F) Caspase-3 activation was examined by flow cytometry (C, D), western blot (E) and analysis of caspase-3 activity using a caspase-3 activity kit (F). *p<0.05.
Figure 3 with 1 supplement
A cell-penetrating peptide prevents hypoxia-induced mitochondrial dysfunctions and platelet inactivation.
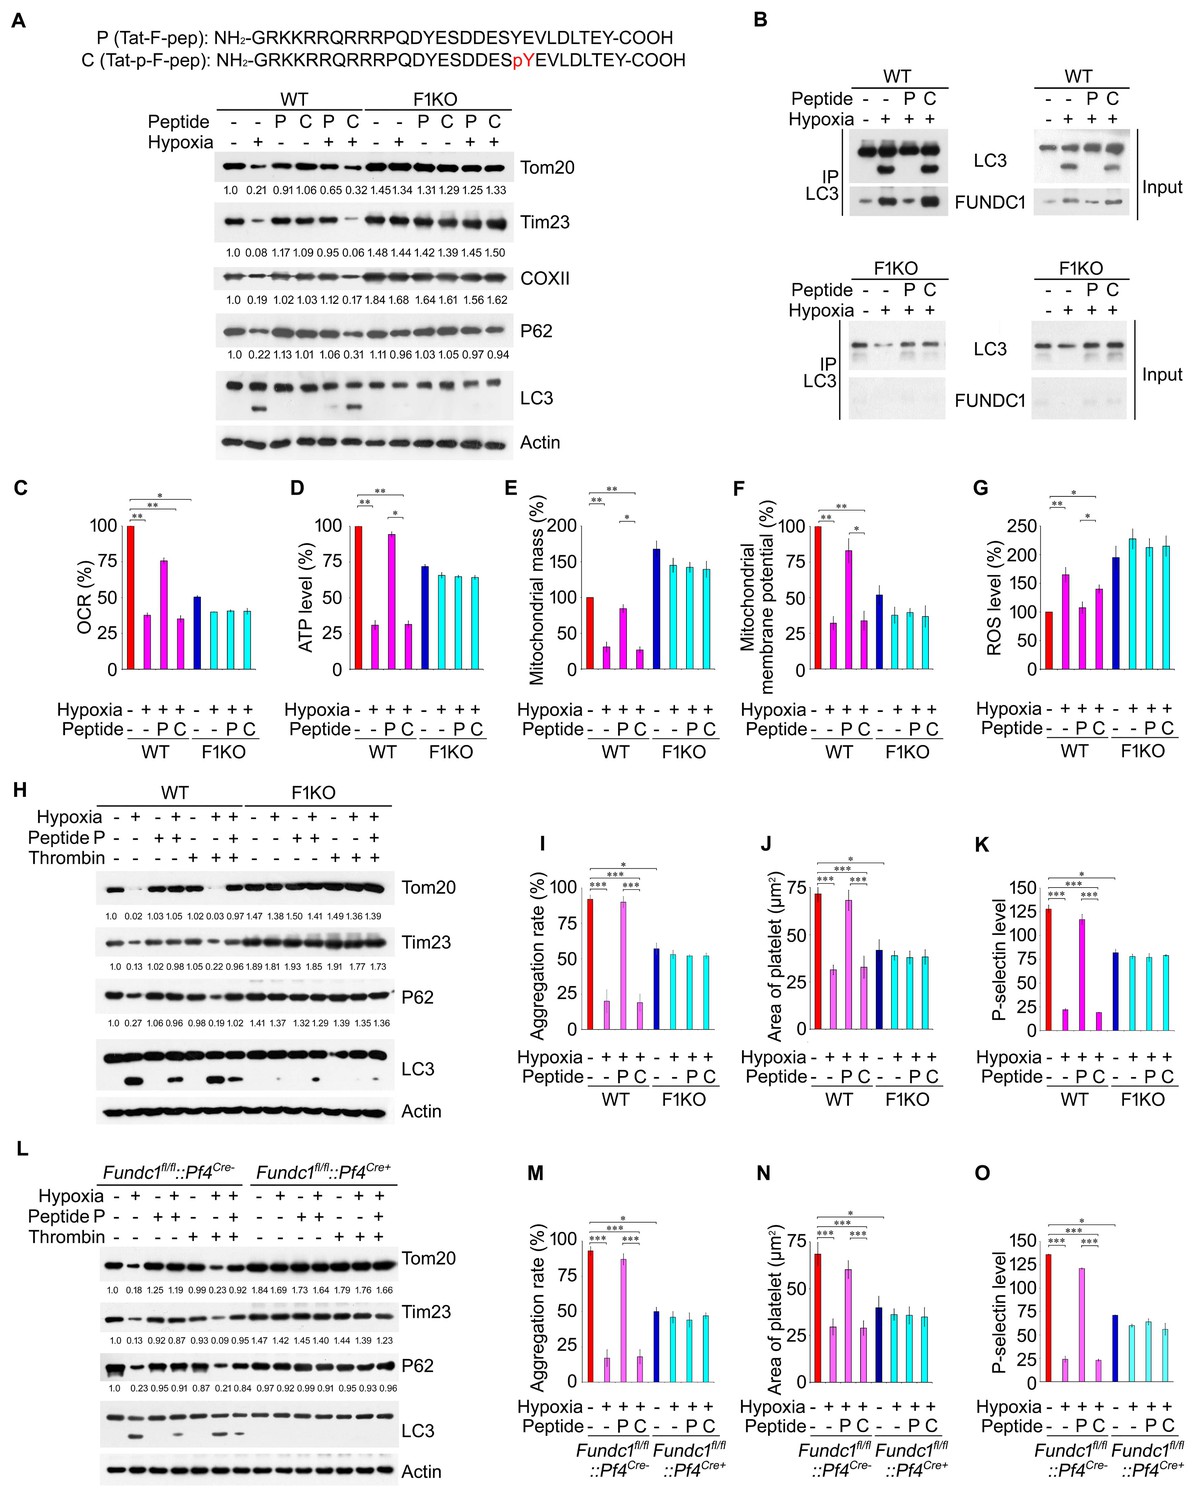
F1KO mice and wild-type (WT) mice (A–K), and Fundc1fl/fl::Pf4Cre- and Fundc1fl/fl::Pf4Cre+ (L–O) were treated with a cell-penetrating peptide mimicking the dephosphorylated (P) and phosphorylated (C) LIR domain of FUNDC1 every 24 hr at 1 mg/kg for 72 hr under 8% hypoxia. Platelet mitophagy was analyzed by western blot using antibodies against mitochondrial proteins and P62 (A). The grayscale values of the bands were analyzed with ImageJ software and are presented below the corresponding bands to show the band intensities. The FUNDC1/LC3 interaction was examined by CO-IP (B). Platelet OCR (C), ATP level (D), mitochondrial mass (E), mitochondrial membrane potential (F) and ROS levels (G) were measured as described in Figure 2. (H, L) Platelet mitophagy was examined by western blot and statistical analysis was performed as in (A). Platelet aggregation (I, M), platelet spreading (J, N) and P-selectin expression (K, O) were analyzed (n = 16) as described in Figure 2. Data from three separate experiments are presented as mean ± s.e.m. *p<0.05. **p<0.01. ***p<0.001.
Figure 3—figure supplement 1
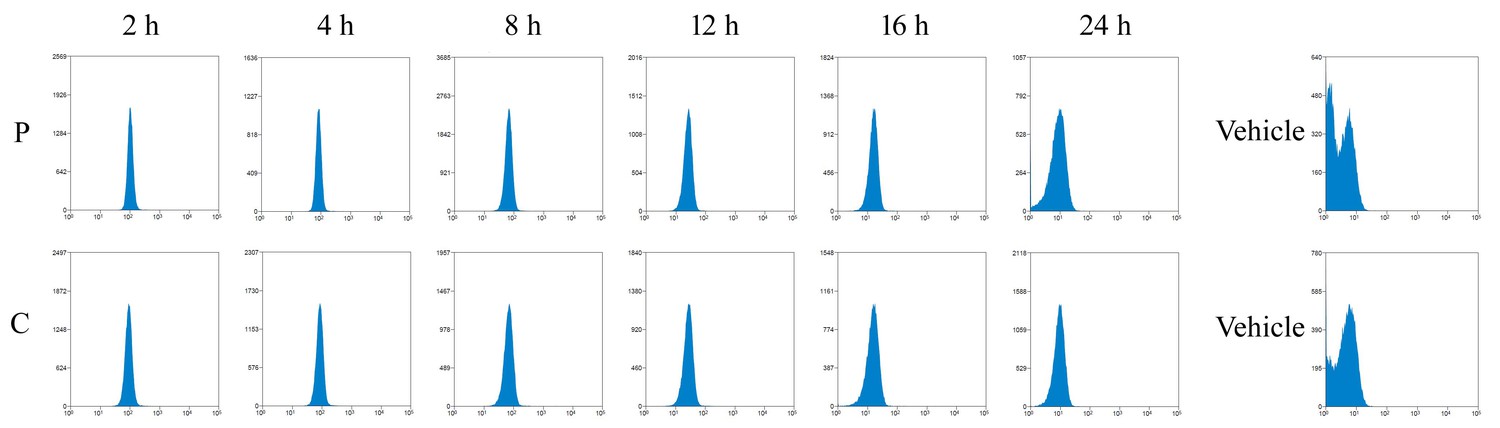
Detection of FITC-labeled peptides by flow cytometry.
Mice were intraperitoneally injected with FITC-labeled cell-penetrating peptides (FITC-P and FITC-C) mimicking the dephosphorylated (P) and phosphorylated (C) LIR domain of FUNDC1. Platelets were isolated and the fluorescence intensity of FITC was determined by flow cytometry.
Figure 4 with 1 supplement
Mitophagy in platelets protects the heart from excessive ischemic/reperfusion (I/R) injury.
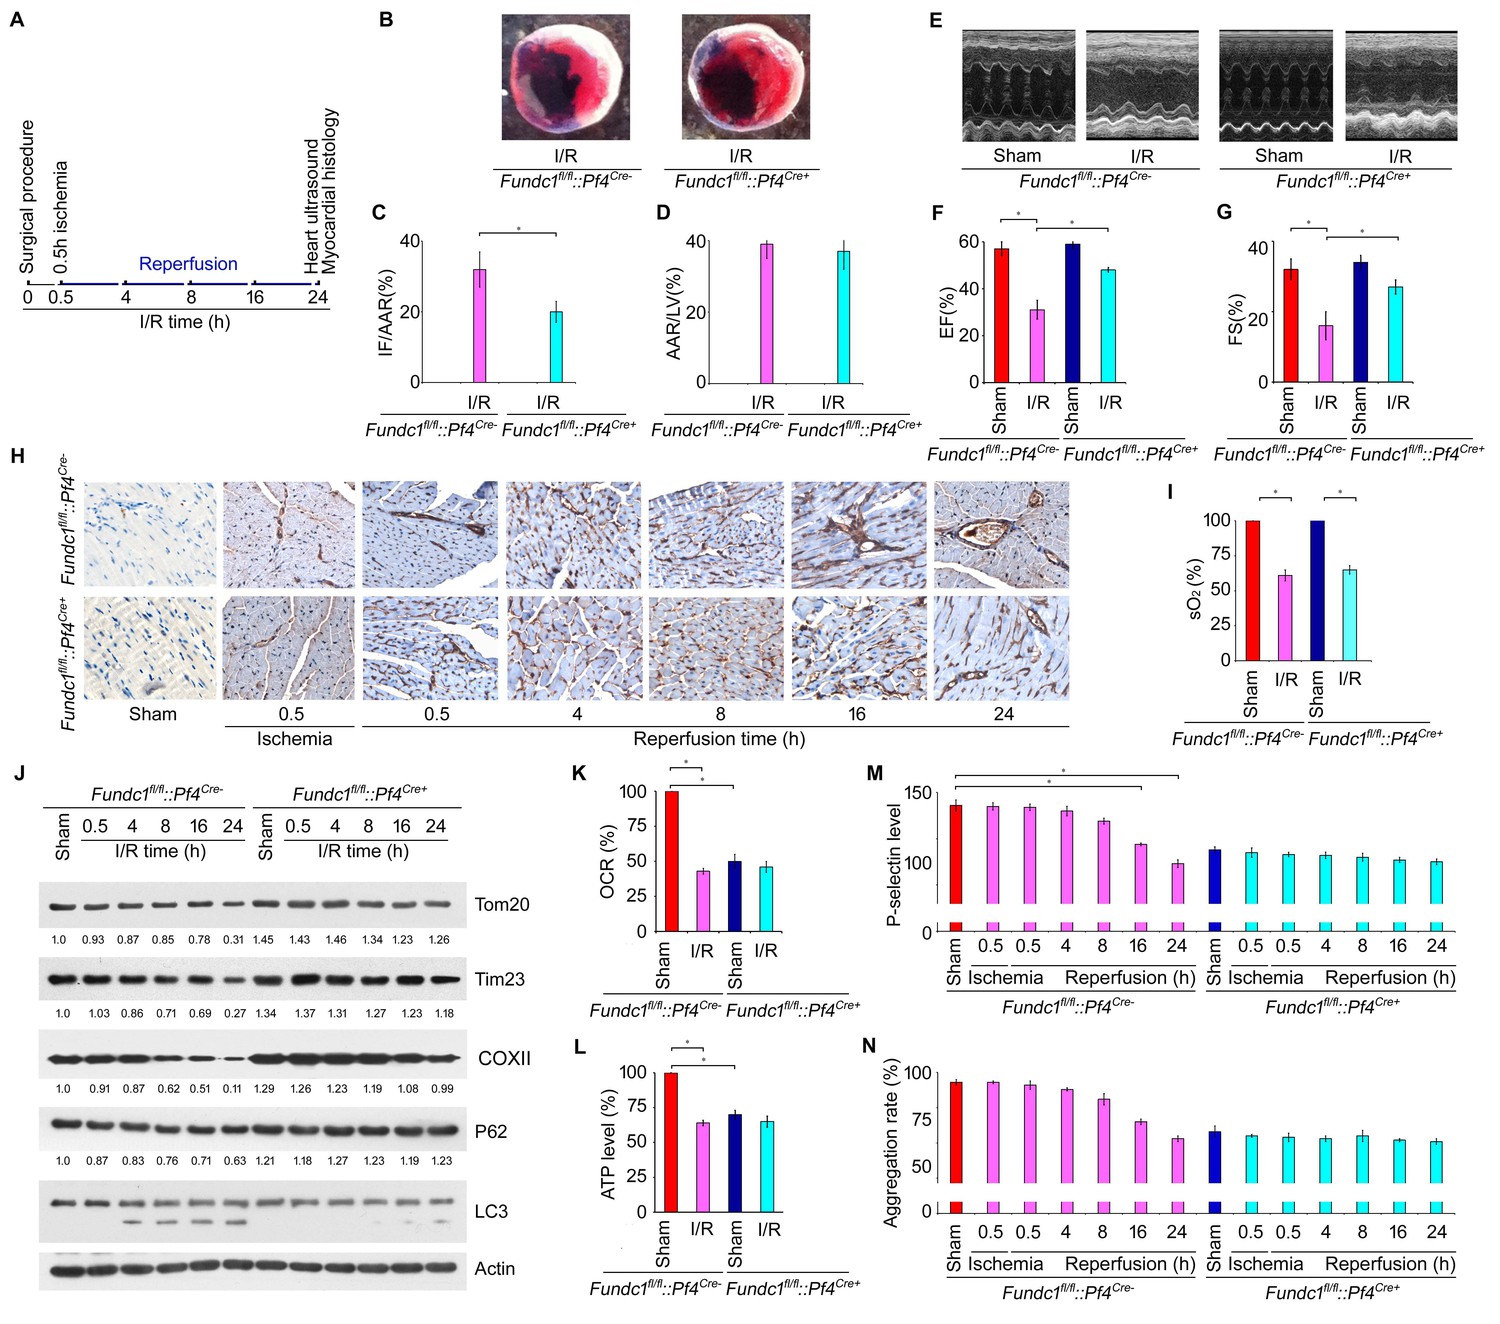
(A) Timetable and procedure of ischemia/reperfusion (I/R) experiments. (B–D) Representative sections and quantitative analysis of the area at risk (AAR) and infarct size (IF) of hearts from Fundc1fl/fl::Pf4Cre- and Fundc1fl/fl::Pf4Cre+ I/R mice (0.5 hr ischemia/24 hr reperfusion). Representative images of hearts (B) and quantitative data for infarct size (IF) and area at risk (AAR) are shown (C, D). n = 13 mice in each group. Left ventricle: LV. (E–G) Fractional shortening (FS) and ejection fraction (EF) were analyzed by echocardiography in Fundc1fl/fl::Pf4Cre- and Fundc1fl/fl::Pf4Cre+ I/R mice (0.5 hr ischemia/24 hr reperfusion). n = 13 mice in each group. (H) P-selectin surface expression was analyzed by immunohistochemistry at the indicated time points. (I) Oxygen saturation measurements of blood from the LV reveal that I/R treatment significantly reduced the blood oxygen saturation (0.5 hr ischemia/24 hr reperfusion). (J) Western blot analysis of mitophagy in platelets from I/R mice at different time points of reperfusion. Typical western blot bands are shown. The expression levels of mitochondrial proteins and P62 were detected and the grayscale values of the bands were analyzed with ImageJ software. The values are presented below the corresponding bands to show the intensities. (K) Oxygen consumption rate (OCR) of platelets from mice treated as in (A) was measured by the standard Seahorse protocol (0.5 hr ischemia/24 hr reperfusion). Mitochondrial OCR was quantitatively analyzed following the manufacturer’s instructions and normalized to platelet number. (L) ATP production was detected with an ATP determination kit from Life Technologies according to the manufacturer’s instructions, then normalized to the percentage in sham-treated Fundc1fl/fl::Pf4Cre- platelets (0.5 hr ischemia/24 hr reperfusion). (M) P-selectin surface expression was analyzed by flow cytometry (0.5 hr ischemia/24 hr reperfusion). (N) Aggregation of platelets from mice treated as in (A) was induced by α-thrombin (0.05 U/ml) (0.5 hr ischemia/24 hr reperfusion). Quantitative data from three separate experiments are shown as mean ± s.e.m. *p<0.05.
Figure 4—figure supplement 1
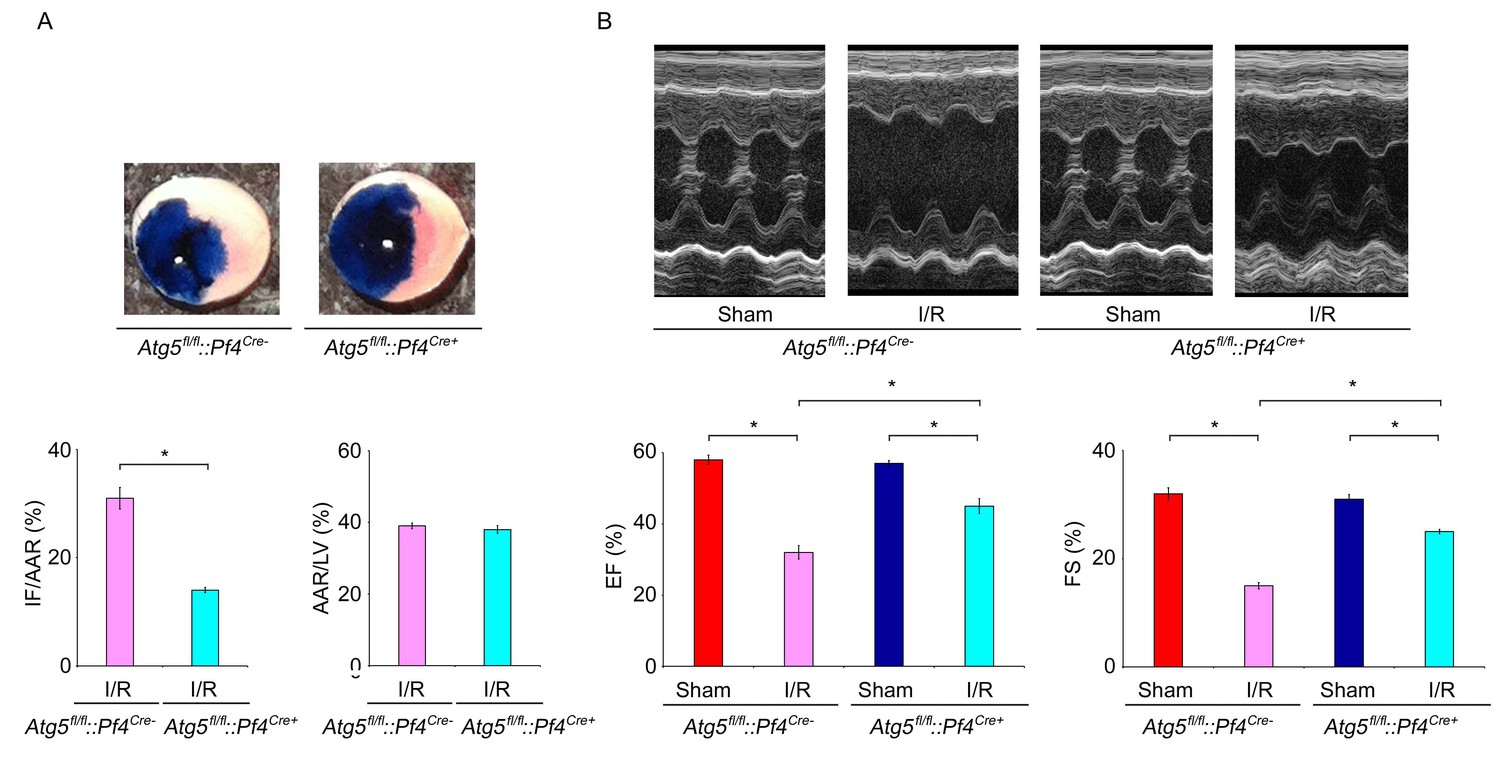
Conditional knockout of Atg5 in platelets reduces I/R injury.
(A) Representative sections and quantitative analysis of the area at risk (AAR) and infarct size (IF) of hearts from Atg5fl/fl::Pf4Cre- and Atg5fl/fl::Pf4Cre+ I/R mice (0.5 hr ischemia/24 hr reperfusion). Representative images of hearts and quantitative data for infarct size (IF) and area at risk (AAR) are shown. n = 9 mice in each group. Left ventricle: LV. (B) Fractional shortening (FS) and ejection fraction (EF) were analyzed by echocardiography in Atg5fl/fl::Pf4Cre- and Atg5fl/fl::Pf4Cre+ I/R mice (0.5 hr ischemia/24 hr reperfusion). n = 9 mice in each group. *p<0.05.
Figure 5
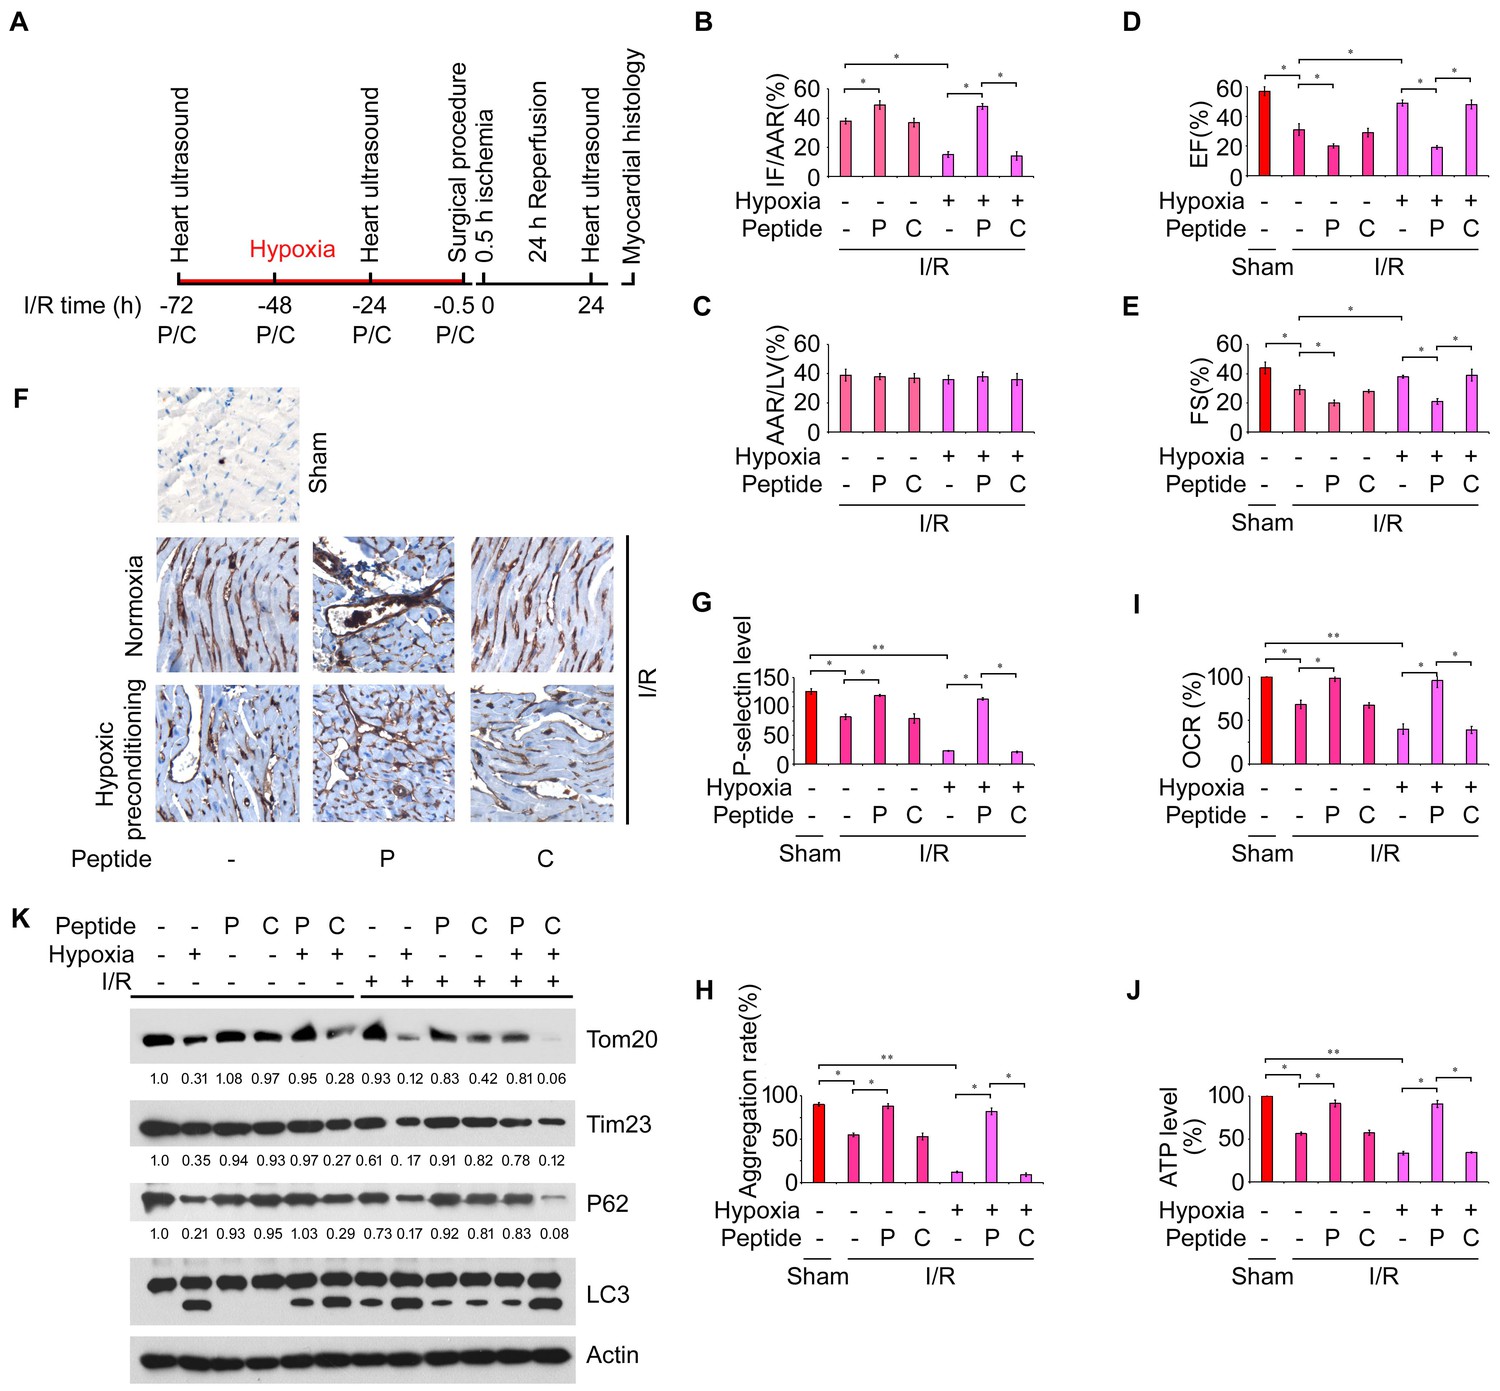
Hypoxic mitophagy in platelets preconditions mice against I/R-induced myocardial infarction and heart failure.
(A) Timetable and procedure of I/R experiments with hypoxic preconditioning. Fundc1fl/fl::Pf4Cre- mice were pre-treated with hypoxia (8%) for 72 hr, and then subjected to I/R. (B–C) Quantitative results for area at risk (AAR) and infarct size (IF) of hearts from treated mice. n = 15 mice in each group. Left ventricle: LV. (D–E) Fractional shortening (FS) and ejection fraction (EF) were analyzed by echocardiography. n = 15 mice in each group. (F, G) P-selectin surface expression was analyzed by immunohistochemistry (F) and flow cytometry (G). Aggregation of platelets (H), OCR (I), ATP level (J) and platelet mitophagy (K) were analyzed as above. In (K), the expression levels of mitochondrial proteins and P62 were detected and the grayscale values of the bands were analyzed with ImageJ software. The values are presented below the corresponding bands to show the intensities. Quantitative data from at least three separate experiments are shown as mean ± s.e.m. *p<0.05. **p<0.01.
Download links
A two-part list of links to download the article, or parts of the article, in various formats.
Downloads (link to download the article as PDF)
Open citations (links to open the citations from this article in various online reference manager services)
Cite this article (links to download the citations from this article in formats compatible with various reference manager tools)
Hypoxic mitophagy regulates mitochondrial quality and platelet activation and determines severity of I/R heart injury
eLife 5:e21407.
https://doi.org/10.7554/eLife.21407


