Distributing tasks via multiple input pathways increases cellular survival in stress
- University of Edinburgh, United Kingdom
- Imperial College London, United Kingdom
- University of Exeter, United Kingdom
Figures
Figure 1
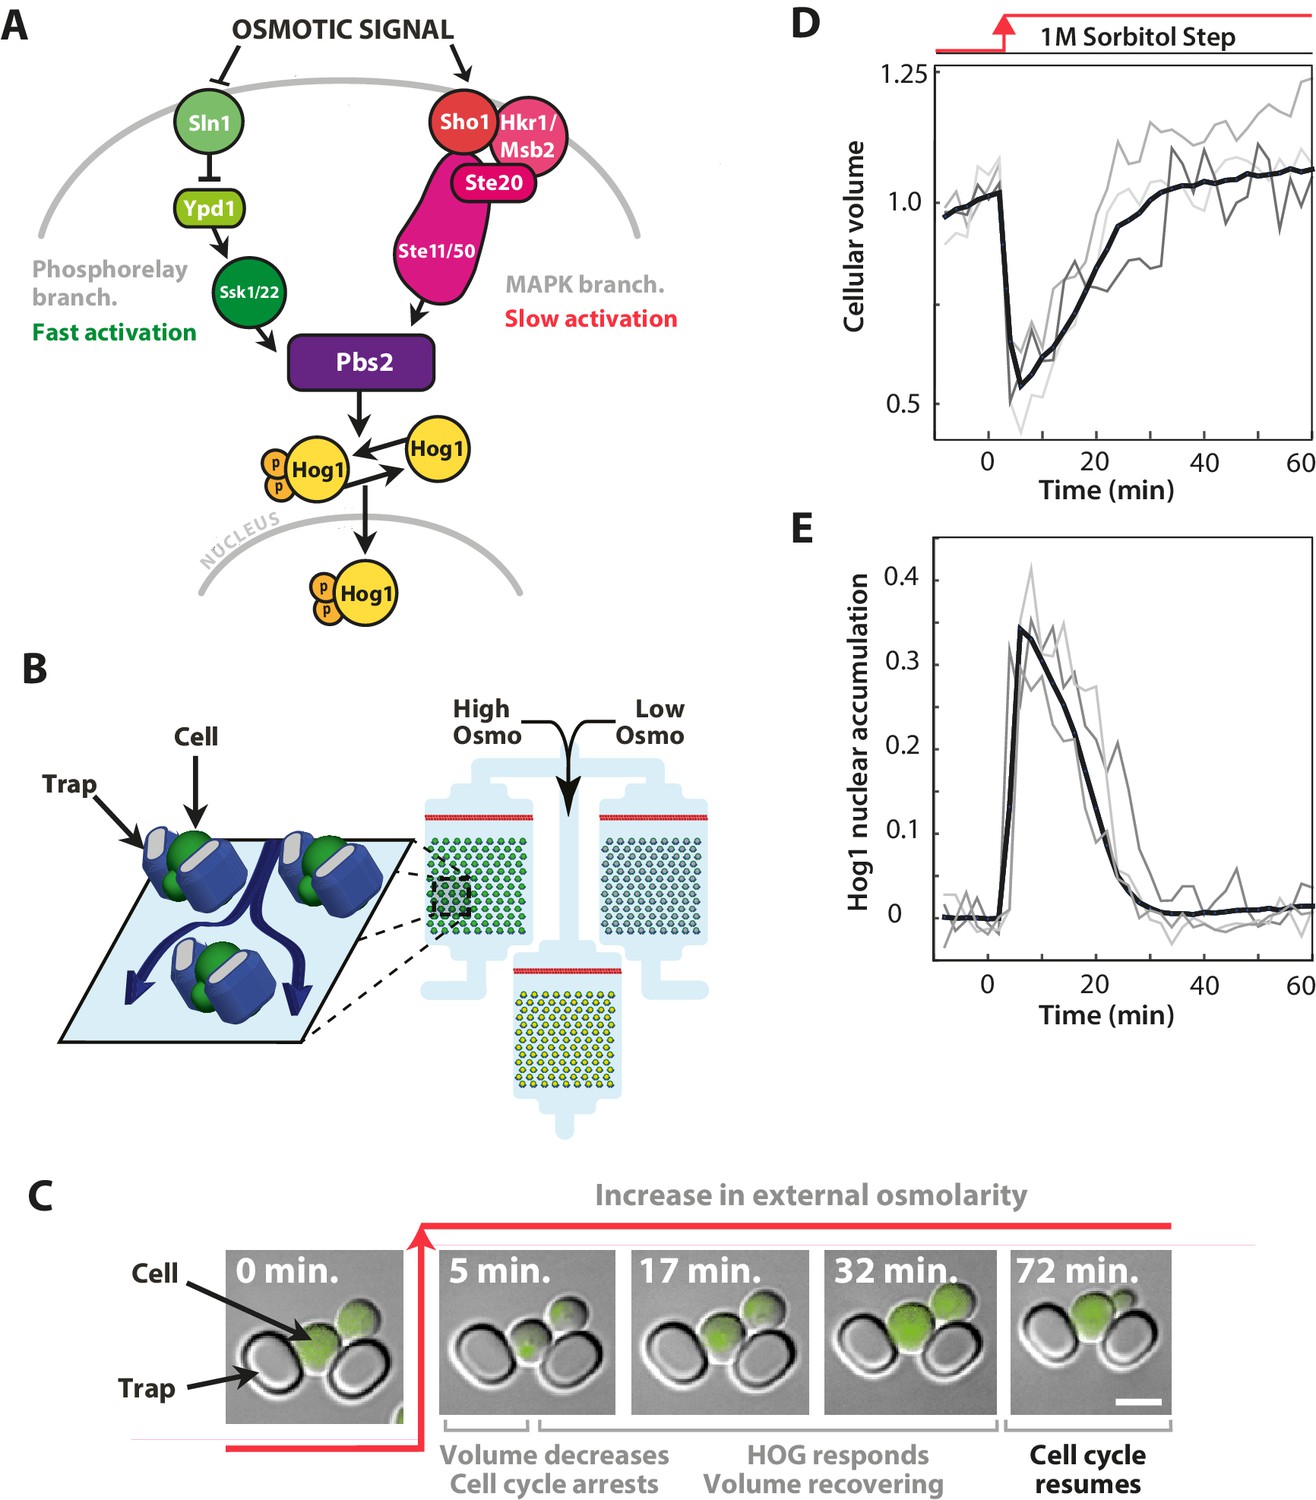
The signalling network in budding yeast that responds to hyperosmotic stress has two input pathways, both activating Pbs2 and Hog1, and its response can be quantified in single cells using the nuclear localisation of Hog1.
(A) Two input branches regulate the activity of the Hog1 kinase. The Sln1 (green) branch is a bacterial-like phosphorelay. The Sho1 (red) branch is a MAP kinase cascade, which is tethered to the membrane by the sensors Sho1 and Msb2. (B) A schematic showing the operation of the ALCATRAS microfluidic device (Crane et al., 2014). Single cells are confined between PDMS traps (blue) and exposed to changes in osmolarity. To ensure all strains experience identical environments, they are loaded into separate chambers of the same device. (C) When exposed to hyperosmotic stress, cellular volume shrinks, Hog1 undergoes nuclear translocation, and cells arrest. Growth typically resumes once the volume has recovered. (D,E) A reduction in volume causes Hog1 to translocate within minutes and the recovery of the volume correlates with levels of nuclear Hog1. The average of the cell population () and three single-cell traces selected at random are shown.
Figure 2 with 2 supplements
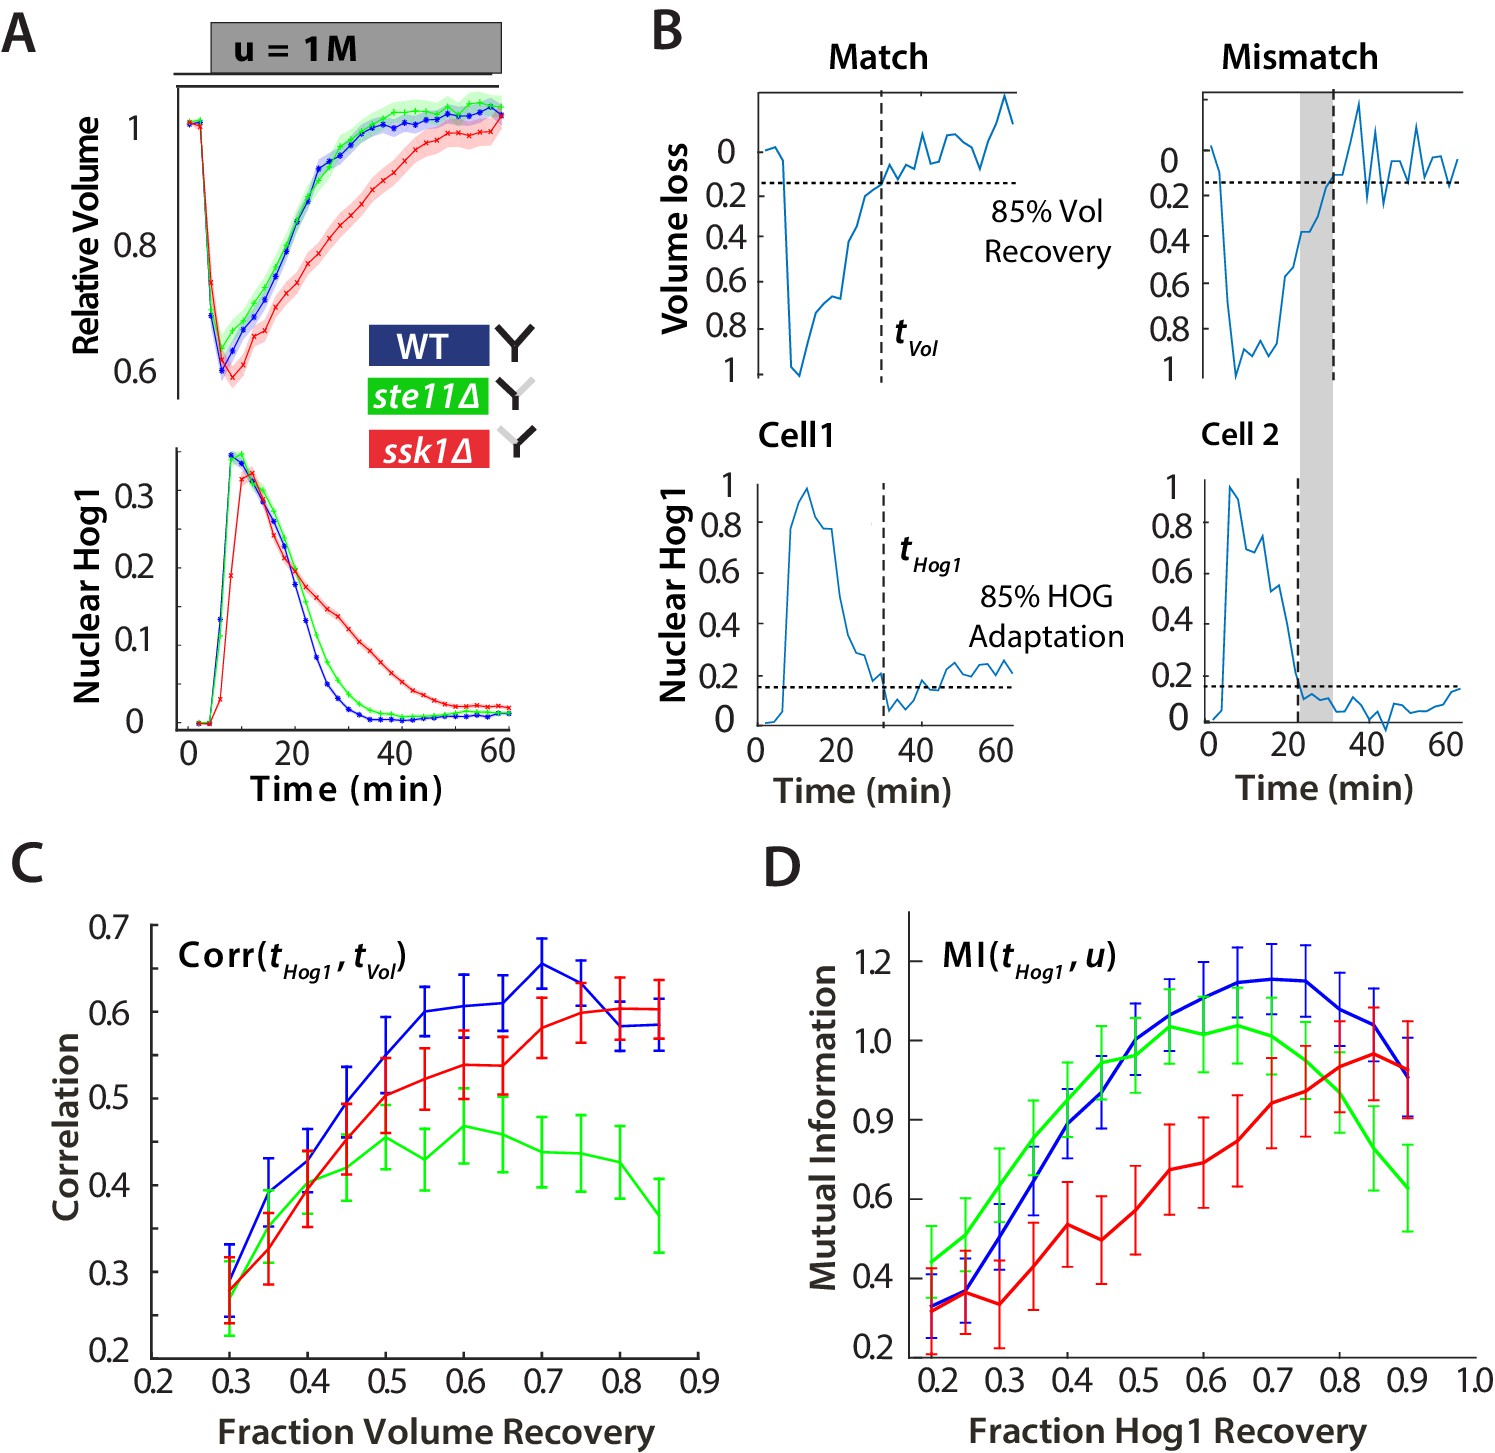
For hyperosmotic stress, accuracy can be quantified as the statistical dependency between the dynamics of Hog1 and the dynamics of volume recovery.
(A) Characterization of the wild-type (WT) and mutant strains in response to a 1 M sorbitol step. Colours here and in all following figures: blue (WT); green (fast mutant—ssk1); red (slow mutant—ste11). Mean responses are shown and error bars are SEM. See also Video 1. (B) Normalized response from wild-type cells to illustrate the degree of matching between the time of adaptation of Hog1 (the time for nuclear Hog1 to undergo a 85% decrease from its maximum) and the time of volume recovery (the time for the volume to undergo a 85% increase from its minimum). (C) Accuracy is the correlation between the adaptation times and is lowest for the fast mutant in late stages of the volume recovery (data from six experiments with at least 500 cells per strain; Figure 2—figure supplement 1). Error bars are 95% confidence intervals for the mean calculated by bootstrapping. (D) Adaptation of Hog1 in single cells becomes less sensitive to the magnitude of the stress in the fast mutant. The mutual information between the distributions of adaptation times of Hog1 and the magnitude of the steps from four experiments shows that the fast mutant becomes the least informative late in adaptation explaining the drop in correlation in C. Error bars are 95% credible intervals for the mean calculated by bootstrapping. Differences between strains are therefore at a 5% significance level when the error bars do not overlap.
Figure 2—figure supplement 1
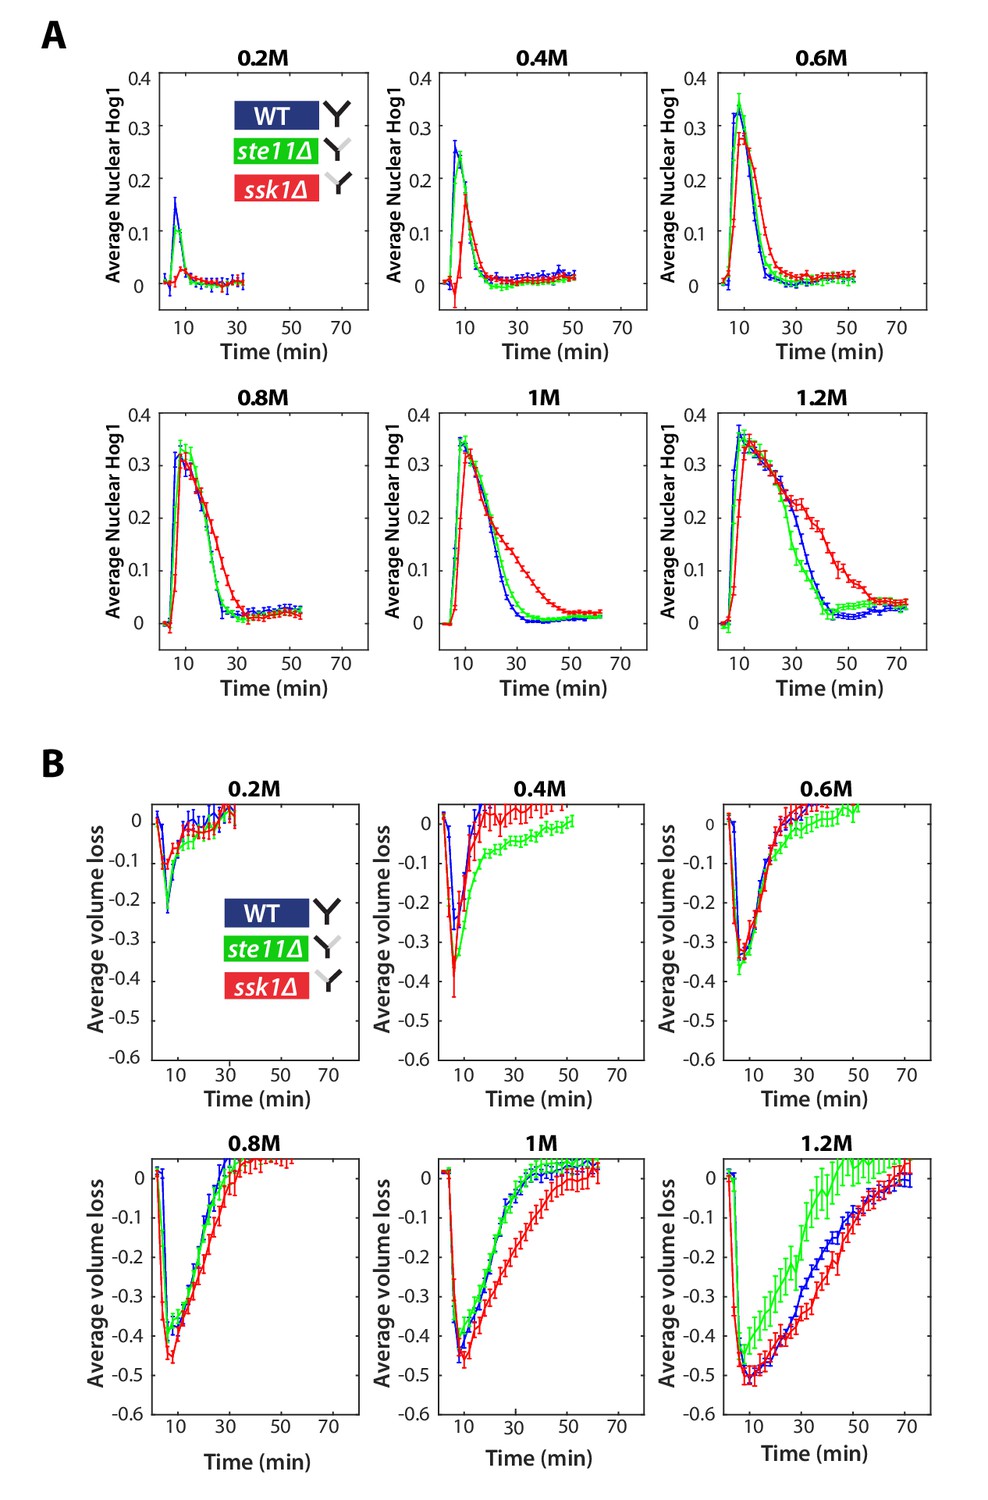
The Hog1 and volume response for wild-type and mutants in steps.
(A) Step data used in Figure 2C with the sorbitol concentrations given above each panel. Average and SEM error bars are shown. Numbers of cells are listed in order of wild-type, ste11∆, ssk1∆ for each experiment (n = 78, 112, 94 for 0.2 M; n = 116, 140, 87 for 0.4 M; n = 105, 123, 113 for 0.6 M ; n = 82, 81, 87 for 0.8 M; n = 192, 148, 125 for 1.0 M; n = 133, 89, 94 for 1.2 M). (B) Average volume traces for the experiments shown in A. Error bars are SEM.
Figure 2—figure supplement 2
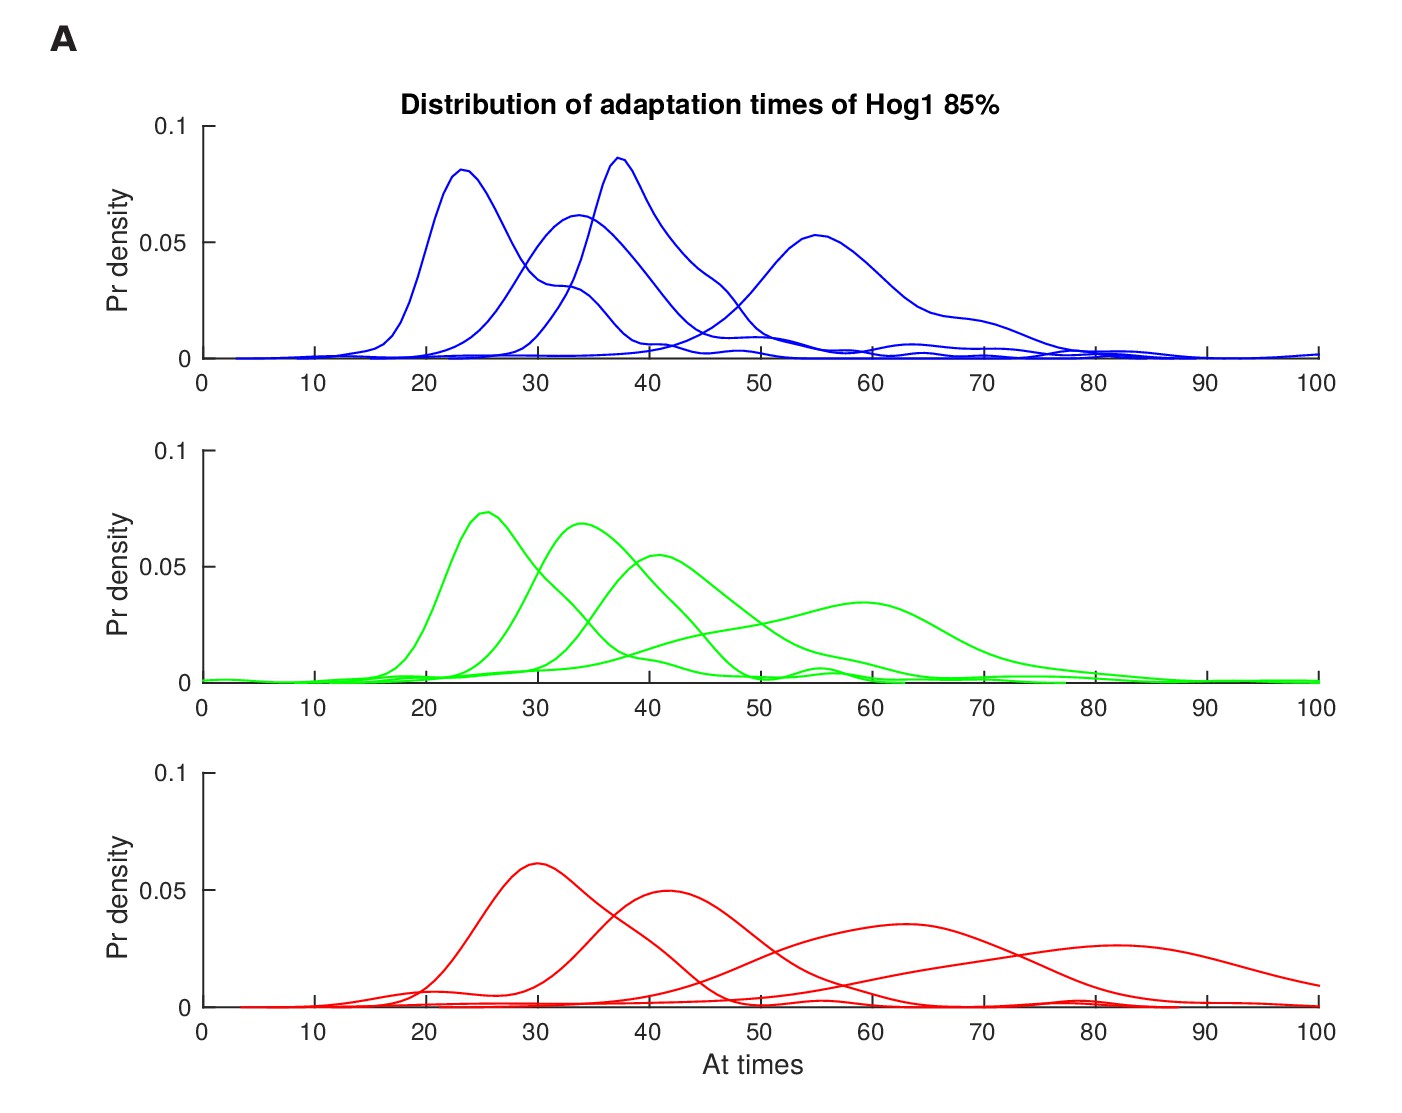
Distributions of the adaptation time of Hog1 for different step inputs.
Single-cell distributions of the adaptation time of Hog1 (time to adapt to 85% of the maximum value) for step inputs of 0.6, 0.8, 1 and 1.2 M sorbitol. Adaptation times were found from the experiments of Figure 2—figure supplement 1 and the distributions used to calculate the mutual information in Figure 2D.
Figure 3 with 1 supplement
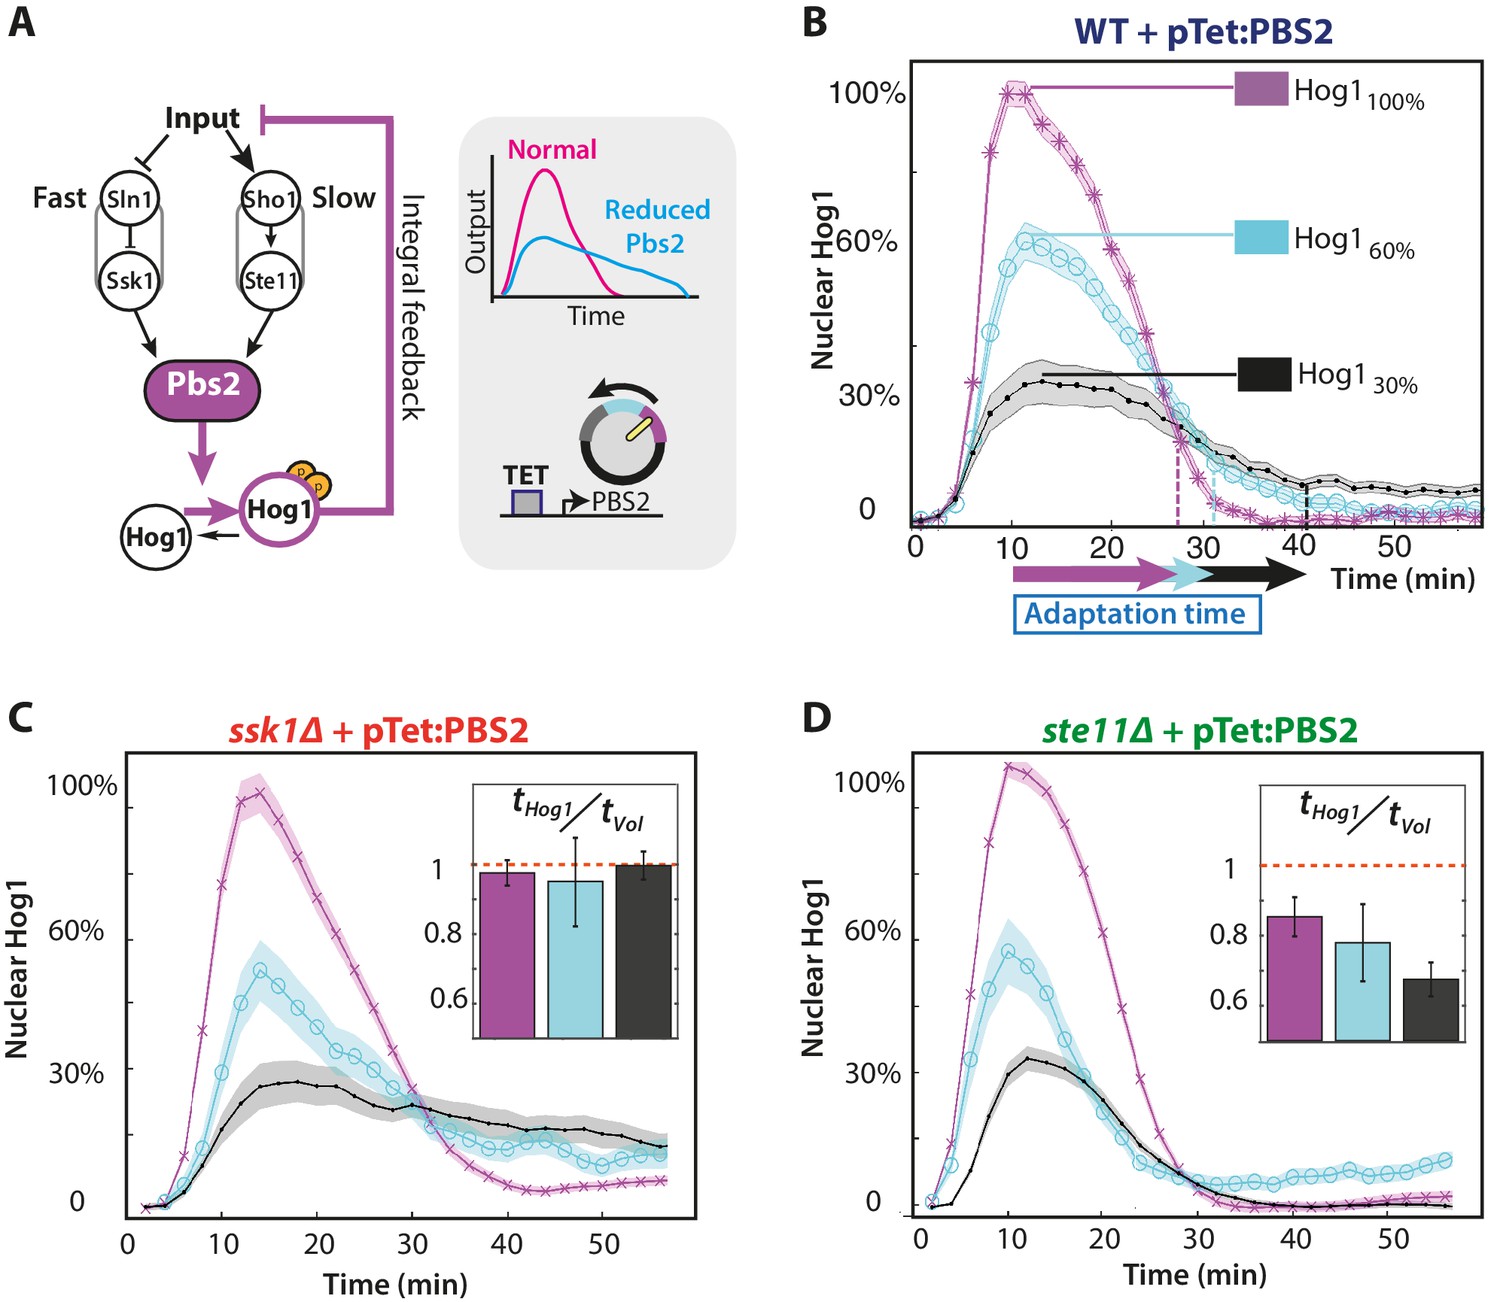
The slow pathway specializes in matching Hog1 dynamics to volume recovery by being most sensitive to the network’s integral feedback.
(A) Before reaching Hog1, the signals from each pathway are transduced through Pbs2, and we perturb the HOG network by controlling PBS2 expression through a TET inducible promoter. Reduced induction of PBS2 compromises the network and decreases the maximum activity of Hog1. This reduction in activity should be compensated by the system’s integral feedback lengthening the nuclear residence of Hog1 (box inset). (B) Measuring relative to unperturbed Pbs2, under-expression of Pbs2 reduces the amplitude of mean Hog1 nuclear localization, but increases its adaptation time on average in wild-type cells (1 M step; arrows indicate time for 85% adaptation). (C,D) Mean Hog1 dynamics for the slow and fast mutants show that only the slow mutant extends the adaptation time of Hog1 like the WT. Insets: Mean ratio for three experiments of the adaptation time of Hog1 to the adaptation time of the volume in single cells. Error bars are SEM.
Figure 3—figure supplement 1
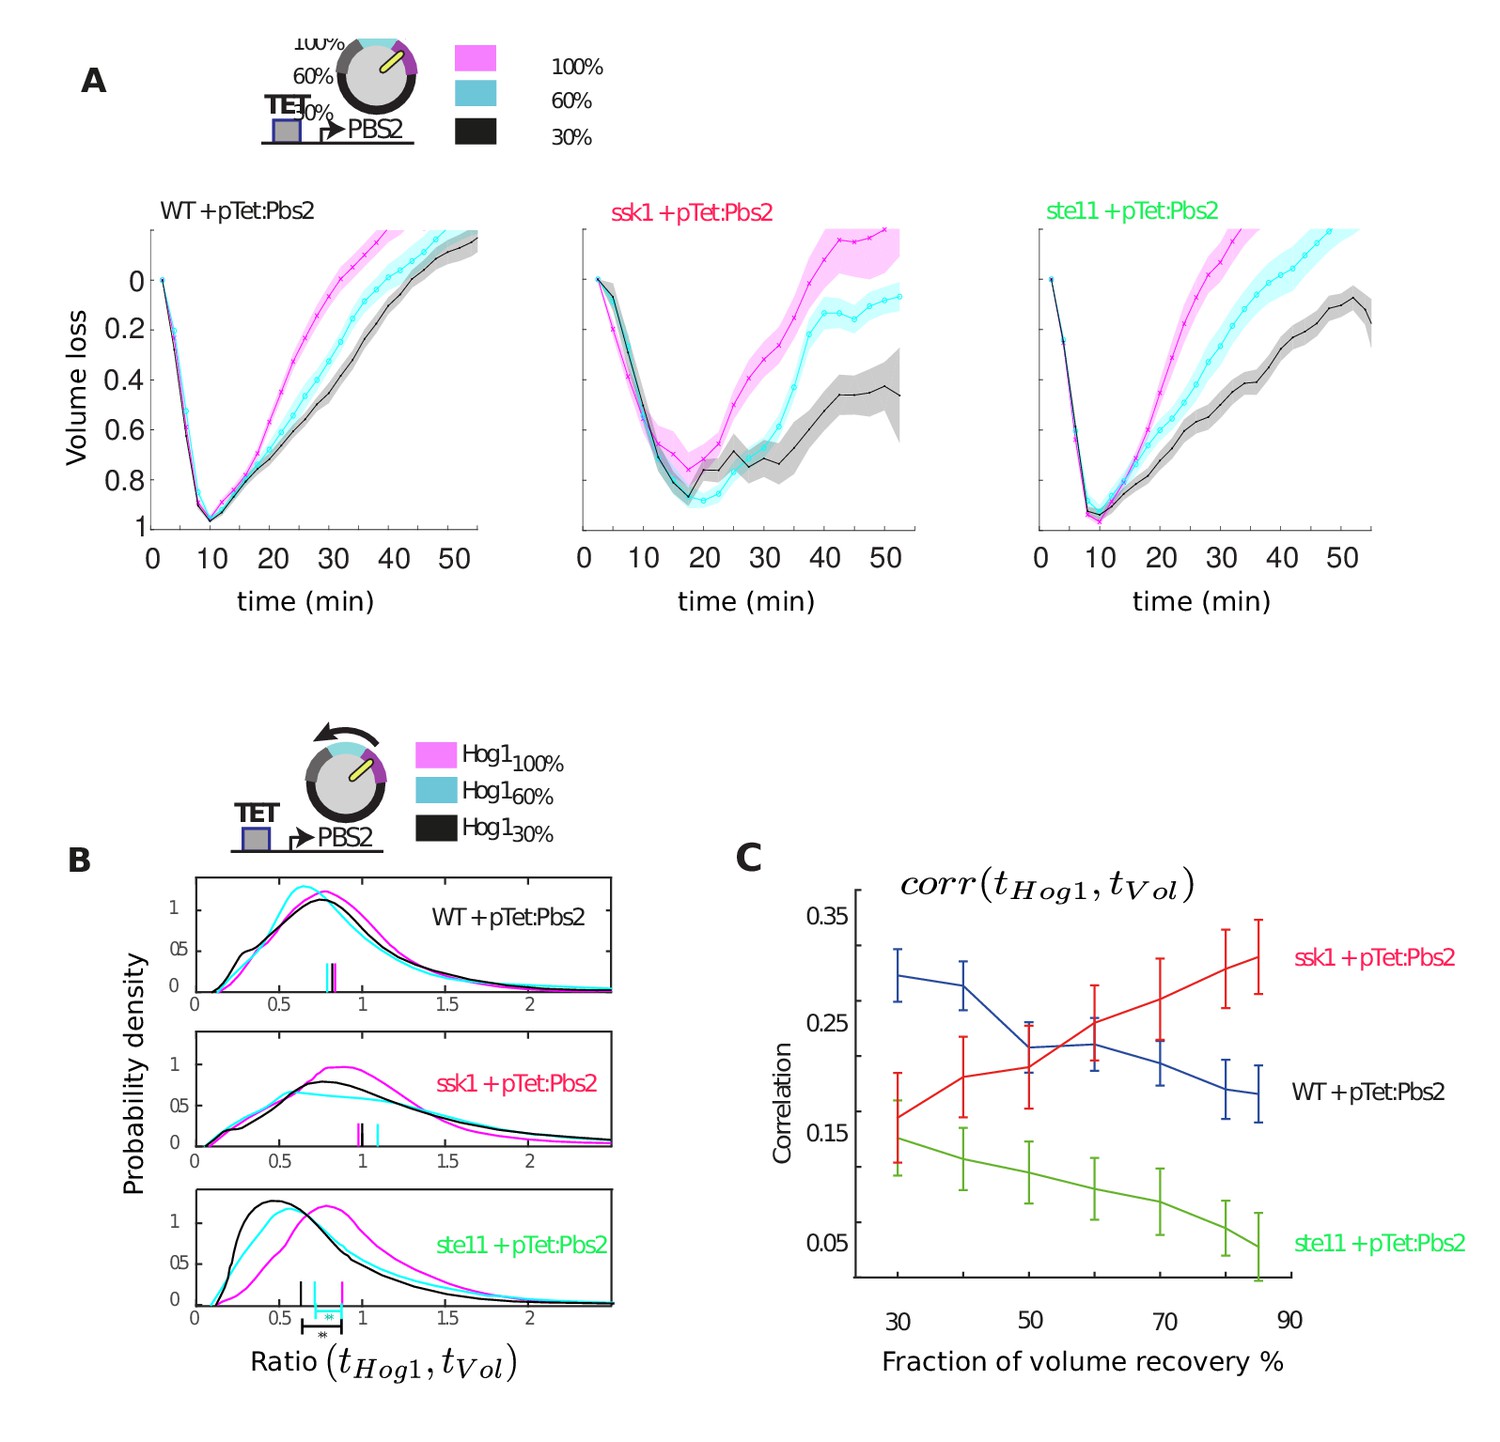
Only the wild-type and slow mutant can compensate when Pbs2 levels are reduced by increasing the adaptation time of Hog1.
(A) Average volume as a function of time in the three strains for different levels of Pbs2 repression. The time to recover the volume is extended in all strains for reduced levels of Pbs2. (B) Distributions of the ratio between the adaptation time of Hog1 and the adaptation time of the volume in single cells for different levels of Pbs2. Each distribution comprises at least 200 cells from three independent experiments (27 experiments in total). The median is indicated by a coloured line on the x-axis. For the fast mutant, reduced levels of Pbs2 result in premature adaptation of Hog1 relative to the volume recovery (p<10−6: two-sided Wilcoxon rank sum test for equal medians and indicated by asterisks). For wild-type and the slow mutant, the ratio of the time of adaptation of Hog1 adaptation to the time of adaptation of the volume is not significantly affected by reduced Pbs2 levels (p>0.1). (C) The correlation between adaptation time of Hog1 and the time for volume recovery as a percentage of volume recovery calculated by pooling together the data from B (cf. Figure 2C).
Figure 4 with 1 supplement
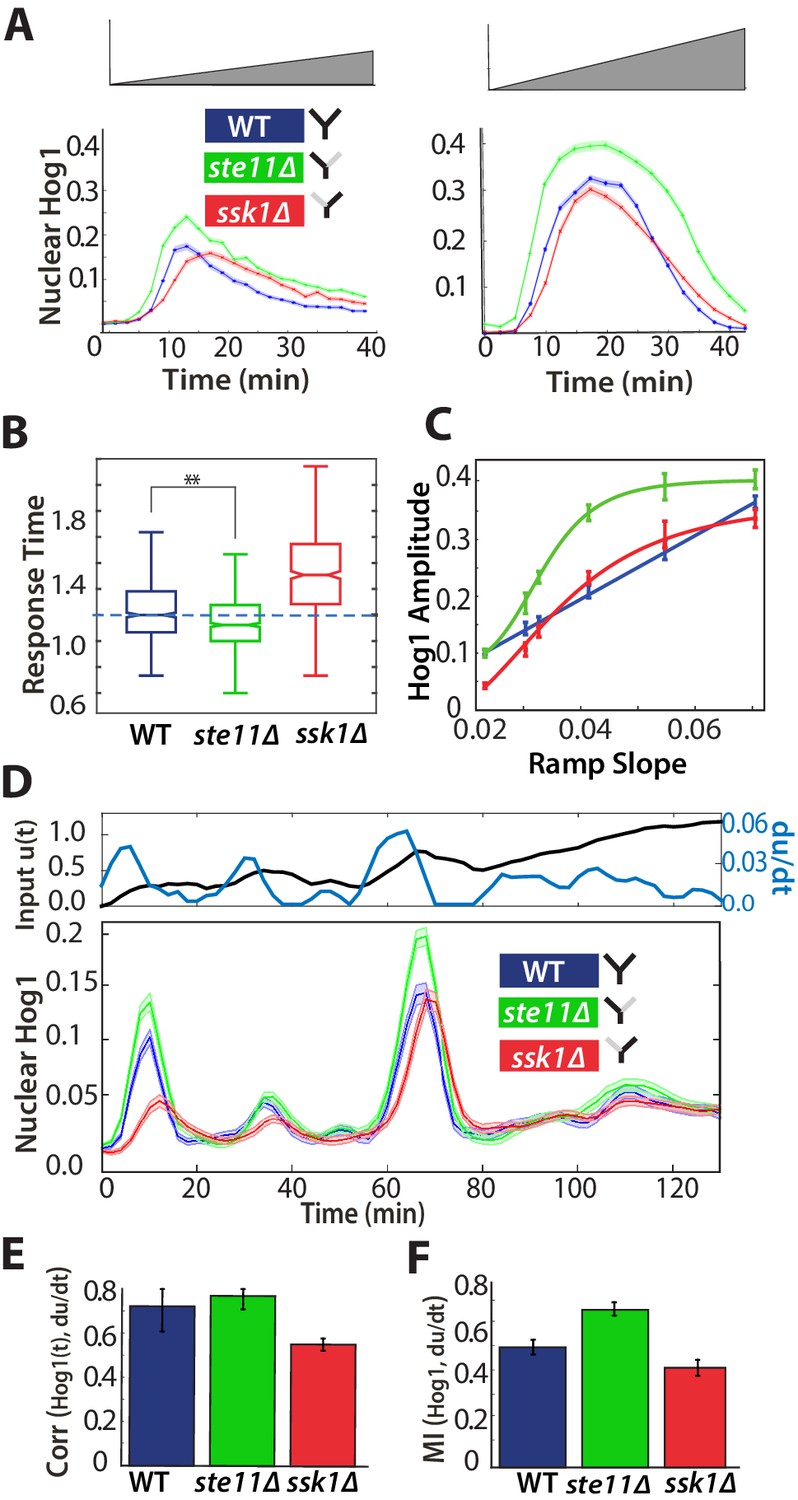
A component of the fast pathway that responds to the time-derivative of the input enables its high speed.
(A) The Hog1 trajectory in the fast mutant overshoots the Hog1 trajectories of both the wild-type and the slow mutant in ramp inputs (two examples with different slopes of approximately 0.03 M min and 0.06 M min). The mean response is shown and error bars are SEM. (B) Distributions of response times relative to the wild-type for six different ramps (Figure 4—figure supplement 1) shows that the fast mutant is even quicker than the wild-type on average (-value using a t-test for distributions with at least 600 cells per strain). (C) The average amplitude of the Hog1 response for the fast mutant consistently overshoots the wild-type for ramp inputs, which responds linearly to the slope of the ramp. (D) An input with a fluctuating time-derivative shows the average Hog1 response of the fast mutant consistently over-shooting the wild-type. Errors are SEM. (E) The average of the single-cell cross-correlations of the trajectories of Hog1 with the trajectory of the (smoothed) time-derivative of the input shows that the high correlation of the wild-type comes from the fast and not the slow pathway (average of three independent experiments with fluctuating ramps and error bars as SD; -value using a t-test on pooled single-cell data from the three experiments). (F) The mutual information between the time-derivative of the input in D and the level of Hog1 at each time point shows that the fast mutant best predicts the time-derivative (at 5% significance level calculated using credible intervals of the median).
Figure 4—figure supplement 1

The Hog1 response of the fast mutant in ramps of stress indicates derivative action.
(A) Ramp data from Figure 2D showing the consistent overshoot of the wild-type Hog1 by the fast mutant. The sorbitol concentration was calculated from the fluorescent signal of the cy5 dye (black dotted lines and right y-axis) and a linear approximation is shown by the orange lines. Numbers of cells are listed in order of wild-type, ste11∆, ssk1∆ for each experiment (n = 201, 195, 192 for 0.026 M/min; n = 112, 198, 97 for 0.03 M/min; n = 193, 226, 200 for 0.035 M/min; n = 175, 164, 144 for 0.041 M/min; n = 134, 86, 60 for 0.055 M/min; n = 148, 187, 186 for 0.071 M/min). (B) The cross-correlation between the single-cell trajectories of Hog1 and the time-derivative of the input in the fluctuating ramp of Figure 4D. The derivative was smoothed using a first order filter and the correlation is plotted as a function of the smoothing parameter α. Cross-correlation for three experiments were calculated in total and the average is shown in Figure 4E.
Figure 5 with 1 supplement

A mathematical model with interactions between the pathways can describe the behaviours of the wild-type and mutants.
(A) A block diagram of a modular model of the HOG network. The slow pathway responds to the error, the difference between the intracellular and extracellular osmolarity; the fast pathway responds to both the error and the time-derivative of the input (the extracellular osmolarity). These pathways mutually inhibit each other and then activate Hog1. The rate of change of glycerol is determined by both the time-integral of Hog1 and by the level of activation of a Hog1-independent pathway that responds proportionally to the error. The accumulation of glycerol determines the intracellular osmolarity and the network’s negative feedback. (B,C) Predictions of the wild-type and the two mutants in steps (0.6 M) and ramps (0.03 M min−1) of stress. The inset shows the contributions of the fast and slow pathways (dotted) to the wild-type response. Mutations remove cross-inhibition between the pathways causing the behaviour of the mutants to be different from the behaviour of the corresponding pathway in the wild-type. (D,E) Predictions of glycerol show that all strains initially over- or under-shoot the long-term behaviour (dotted black line). The fast mutants overshoots in both cases.
-
Figure 5—source data 1
Parameters for the mathematical model of the HOG network.
Values for the zero-order gain and time-constants of the different components of the block diagram shown in Figure 5—figure supplement 1.
- https://doi.org/10.7554/eLife.21415.013
Figure 5—figure supplement 1
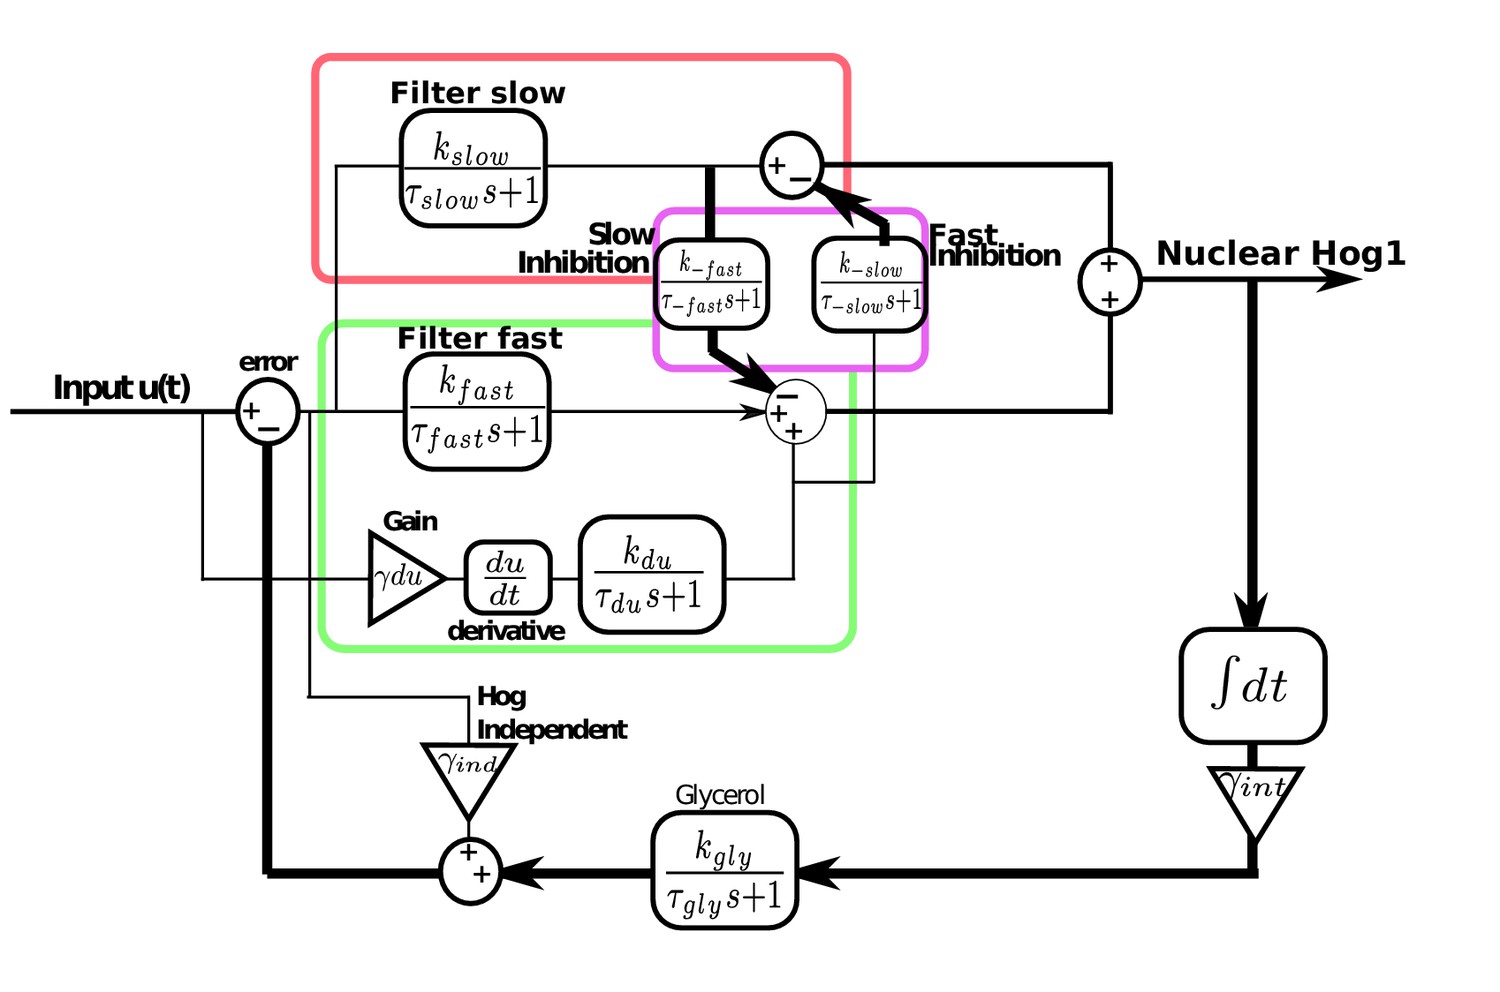
Modular model of the HOG network including derivative action in the fast pathway and the interactions between the fast and slow pathways.
The slow pathway is modelled as a first-order filter of the error. The fast pathway also has a first-order filter of the error and derivative action: an amplified and filtered time-derivative of the input. Cross-inhibition between the two pathways consists of negative feedback of the filtered output of the slow pathway on the fast pathway and negative feedback of the filtered derivative action of the fast pathway on the slow pathway. Hog1 is the sum of the outputs of both pathways after the cross-inhibition and feeds into an integrator that is amplified and filtered before feeding into glycerol. The Hog1-independent pathway responds proportional to the error and directly feeds into glycerol. Glycerol negatively feeds back on the input to give the error. All parameter values are Figure 5—figure supplement 1.
Figure 6
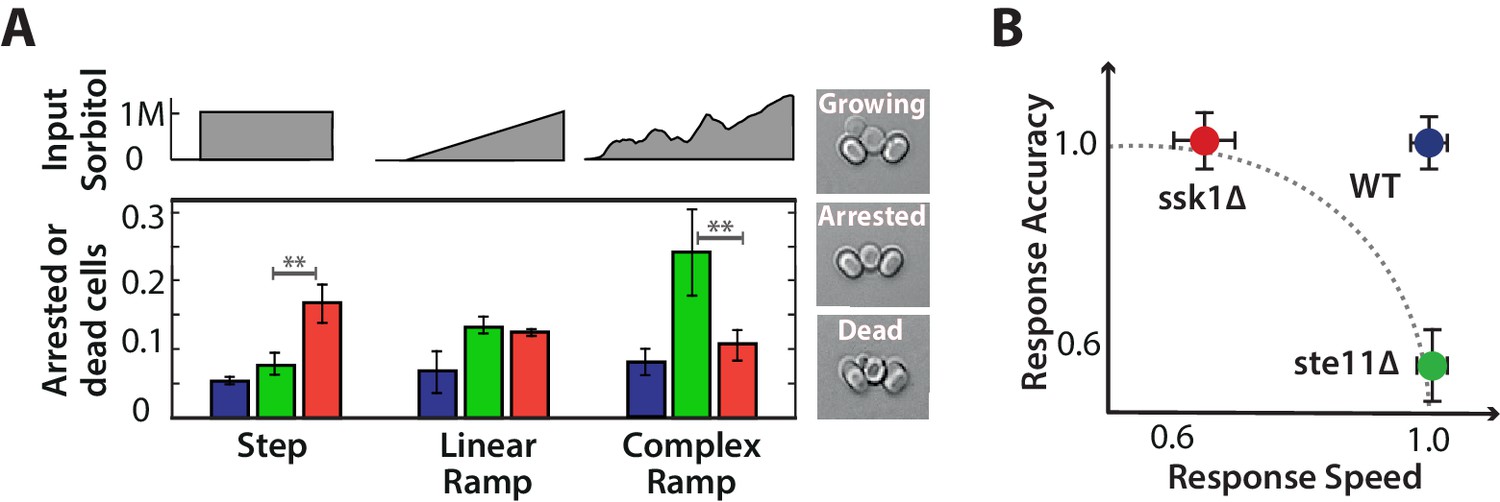
Each input pathway increases survival in specific environments, but the wild-type is the most fit in all environments being both fast and accurate.
A We measure failure to grow (inset) by the number of cells that either did not resume the cell cycle (arrested) or die over the 5 hr after the stress has stabilized for three different environments: a 1M step, a 0.03 M min linear ramp (of 40 min length), and 2 hr of a fluctuating ramp. Mean and SD of 2 experiments each comprising at least 300 cells per strain. The asterisks denote significance with a -value calculated using a t-test and bootstrapping. See also Videos 2 and 3. B Together our results imply that a network with only one input pathway is subject to a speed-accuracy trade-off, which the two mutants satisfy in contrasting ways and we illustrate by showing the mutants lying on the extremes of a hypothetical Pareto front (dotted line). The wild-type by having two interacting pathways, each specializing to one aspect of the trade-off, escapes this constraint. Mean and 95% confidence intervals for response time and accuracy using data from Figure 2. .
Videos
Video 1
Nuclear localization of Hog1-GFP in a step of 1M sorbitol for the wild-type and two mutants (related to Figure 2).
Overlay of DIC and fluorescence microscopy images showing cells trapped between two pillars in the ALCATRAS microfluidics device.
Video 2
Survival of wild-type and mutant cells following a step of 1 M sorbitol (related to Figure 6).
A representative field of view (DIC channel) showing cells trapped in the ALCATRAS microfluidics device. White arrows indicate cells that are either arrested or dead.
Video 3
Survival of wild-type and mutant cells following a fluctuating ramp of sorbitol from 0 to 1.2 M over approximately 2 hr (related to Figure 6).
A representative field of view (DIC channel) showing cells trapped in the ALCATRAS microfluidics device. White arrows indicate cells that are either arrested or dead.
Tables
Table 1
Saccharomyces cerevisiae strains used. All strains are in the S288C background.
| Strain | Genotype | Source |
|---|---|---|
| BY4741 | MATa his31 leu20 met150 ura30 | EUROSCARF |
| BY4742 | MAT his31 leu20 lys20 ura30 | EUROSCARF |
| SL364 | MATa, leu20, lys20, HOG1-GFP::HIS3, HTB2-mCherry::URA3 | gift - P. Hersen |
| SL373 | MATa, met150, HOG1-GFP-HIS3, HTB2-mCherry::URA3, ste11::LEU2 | gift - P. Hersen |
| SL268 | MATa, leu20, lys20, HOG1-GFP-HIS3, HTB2-mCherry::URA3, ssk1::KANMX6 | This study |
| SL395 | MATa, leu20, lys20, HOG1-GFP::HIS3, HTB2-mCherry::URA3, P PBS2::KANMX4-tTA-P tetO7 | This study |
| SL396 | MATa, met150, HOG1-GFP::HIS3, HTB2-mCherry::URA3, P PBS2::KANMX4-tTA-P tetO7, ste11::LEU2 | This study |
| SL442 | MATa, lys20, HOG1-GFP-HIS3, HTB2-mCherry-URA3, P PBS2::kanMX4-tTA-P tetO7, ssk1::Hph | This study |
Download links
A two-part list of links to download the article, or parts of the article, in various formats.
Downloads (link to download the article as PDF)
Open citations (links to open the citations from this article in various online reference manager services)
Cite this article (links to download the citations from this article in formats compatible with various reference manager tools)
Distributing tasks via multiple input pathways increases cellular survival in stress
eLife 6:e21415.
https://doi.org/10.7554/eLife.21415


