Regulatory changes in two chemoreceptor genes contribute to a Caenorhabditis elegans QTL for foraging behavior
- The Rockefeller University, United States
- University of Florida, United States
- Georgia Institute of Technology, United States
Figures
Figure 1
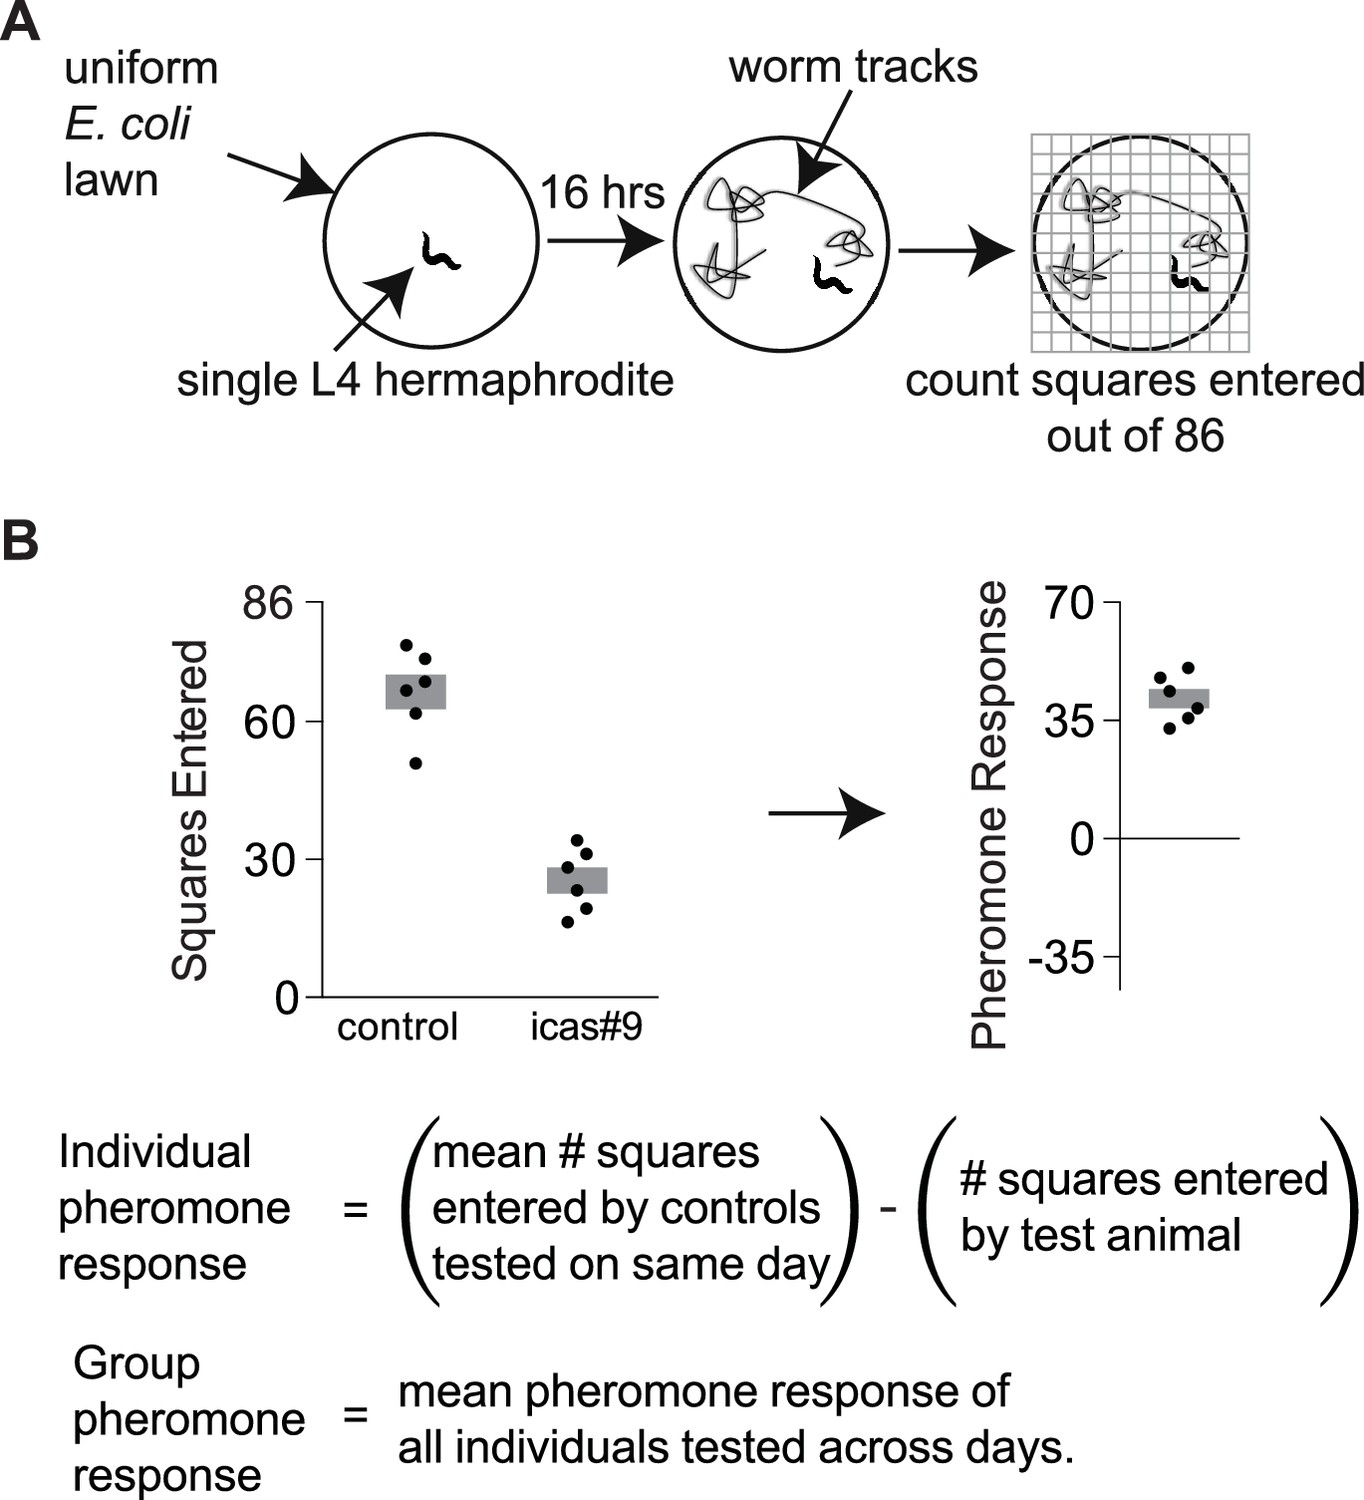
Exploration assays.
(A) Individual animals are allowed to explore a thinly seeded 3.5 cm plate for 16 hr, after which exploration is scored by placing the plate on a grid and counting squares with tracks (Flavell et al., 2013). Diagram from Greene et al., 2016. (B) A pheromone response for each animal on an ascaroside plate was determined with respect to the behavior of control animals that were tested on ascaroside-free plates on the same day. Data are representative values for one day of testing; boxes indicate the mean ± SEM. Below, calculating individual and group pheromone response.
-
Figure 1—source data 1
Individual exploration assays in Figure 1B.
- https://doi.org/10.7554/eLife.21454.003
Figure 2
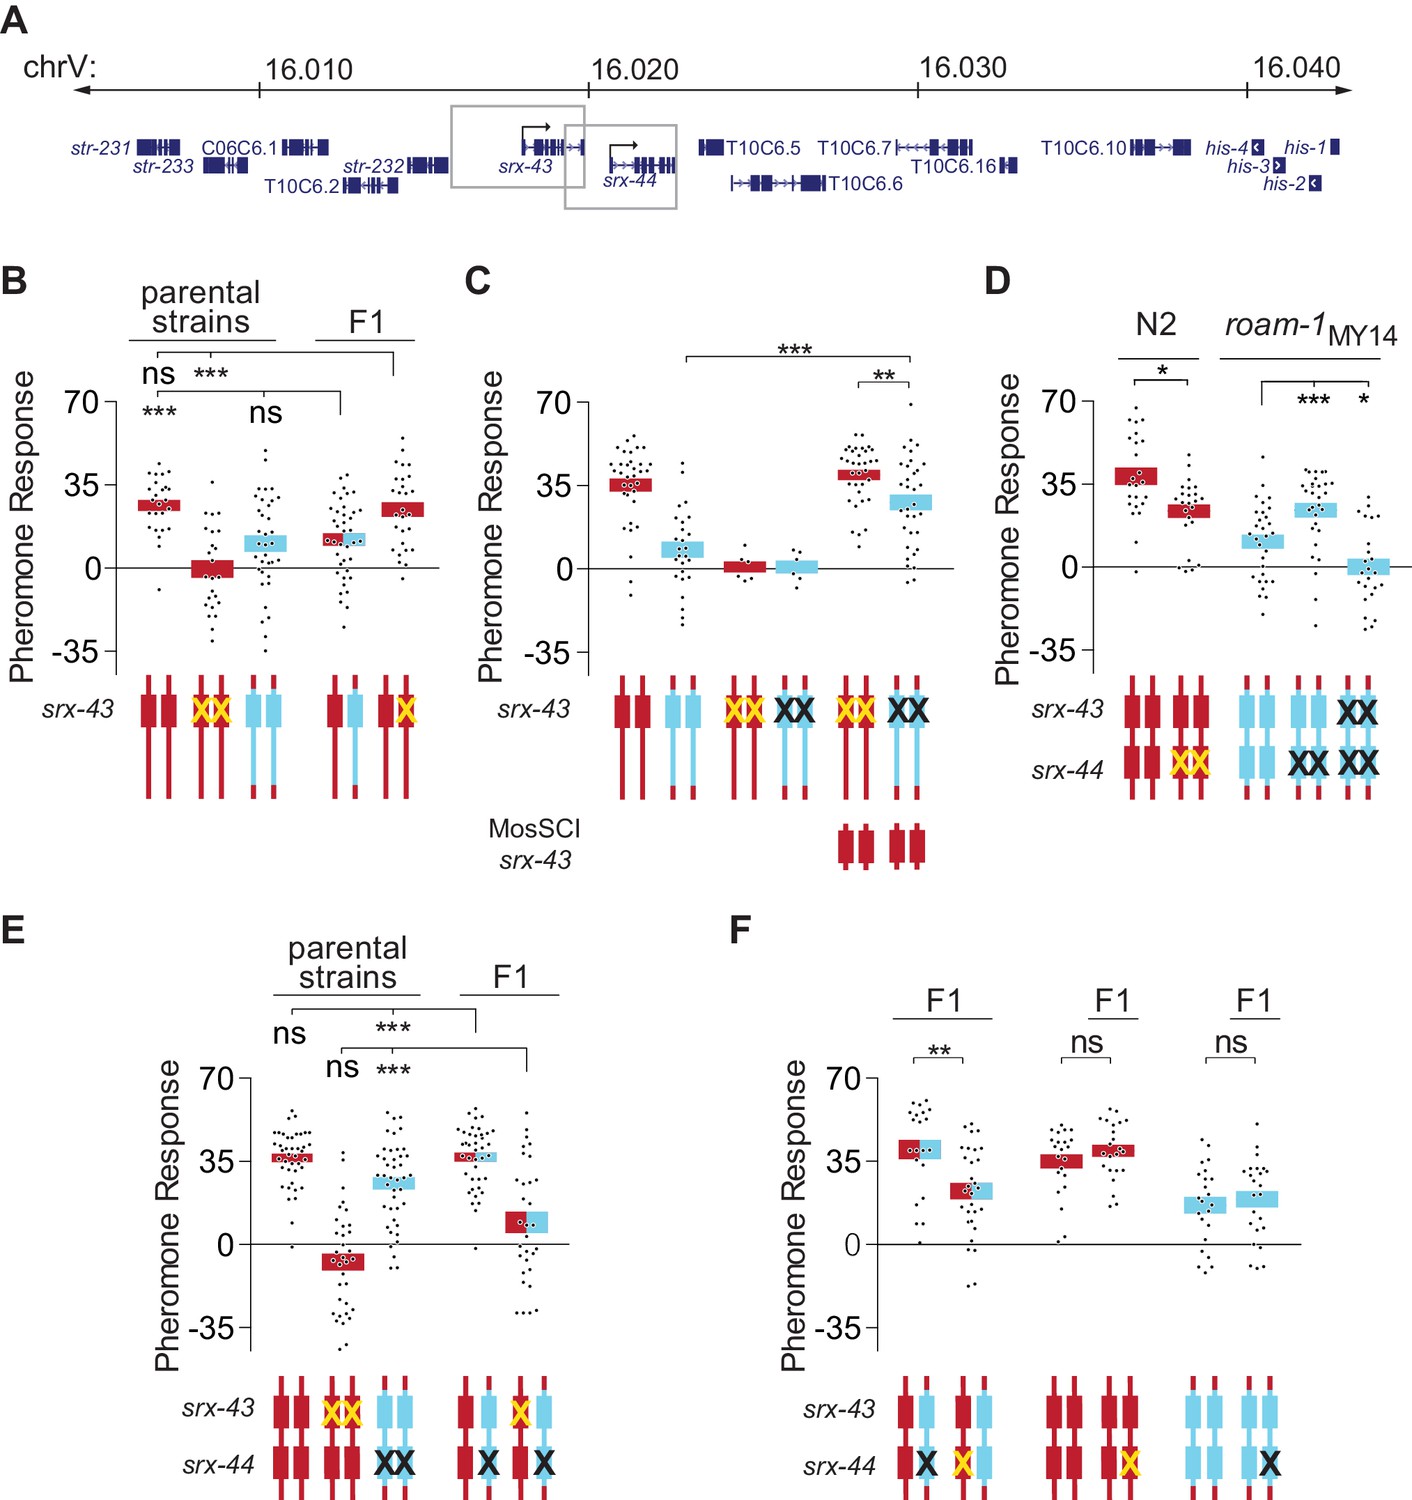
srx-43 and srx-44 both influence icas#9 sensitivity.
(A) The roam-1 locus. Boxes indicate genomic regions used for srx-43 and srx-44 transgenes. (B) Dominance tests. Pheromone response of parental strains and of the F1 progeny from crosses between N2 and roam-1MY14 or between N2 and N2 srx-43(lf). (C) srx-43 variation is insufficient to explain the roam-1 QTL. (D) Pheromone response of srx-44 loss-of-function mutants. (E) Complementation test between srx-43 and roam-1MY14. Pheromone response of parental strains and of F1 progeny from crosses between roam-1MY14 srx-44(lf) and N2 or N2 srx-43(lf). (F) Reciprocal hemizygosity test for srx-44. Left, pheromone response of the F1 progeny from crosses between N2 and roam-1MY14 srx-44(lf) and between N2 srx-44(lf) and roam-1. Center and right, hemizygosity for srx-44 in the parental strains did not affect behavior. For Figure B–F, boxes indicate the mean pheromone response ± SEM. Box color indicates genotype at the roam-1 locus (Red = N2; Blue = MY14; red and blue = heterozygous). Cartoons of the roam-1 locus show endogenous srx-43 (B–F) and srx-44 (D–F) with the same color code. X indicates null allele. In C, ‘MosSCI srx-43’ indicates strains with a chromosome II Mos1 Single Copy Inserted srx-43 allele from N2.. ***p<0.001,**p<0.01, *p<0.05; ns, not significant by ANOVA with Dunnett correction (A, D- roam-1MY14, E) or t-test (C, D- N2, F).
-
Figure 2—source data 1
Individual exploration assays in Figure 2B–F.
- https://doi.org/10.7554/eLife.21454.005
Figure 3
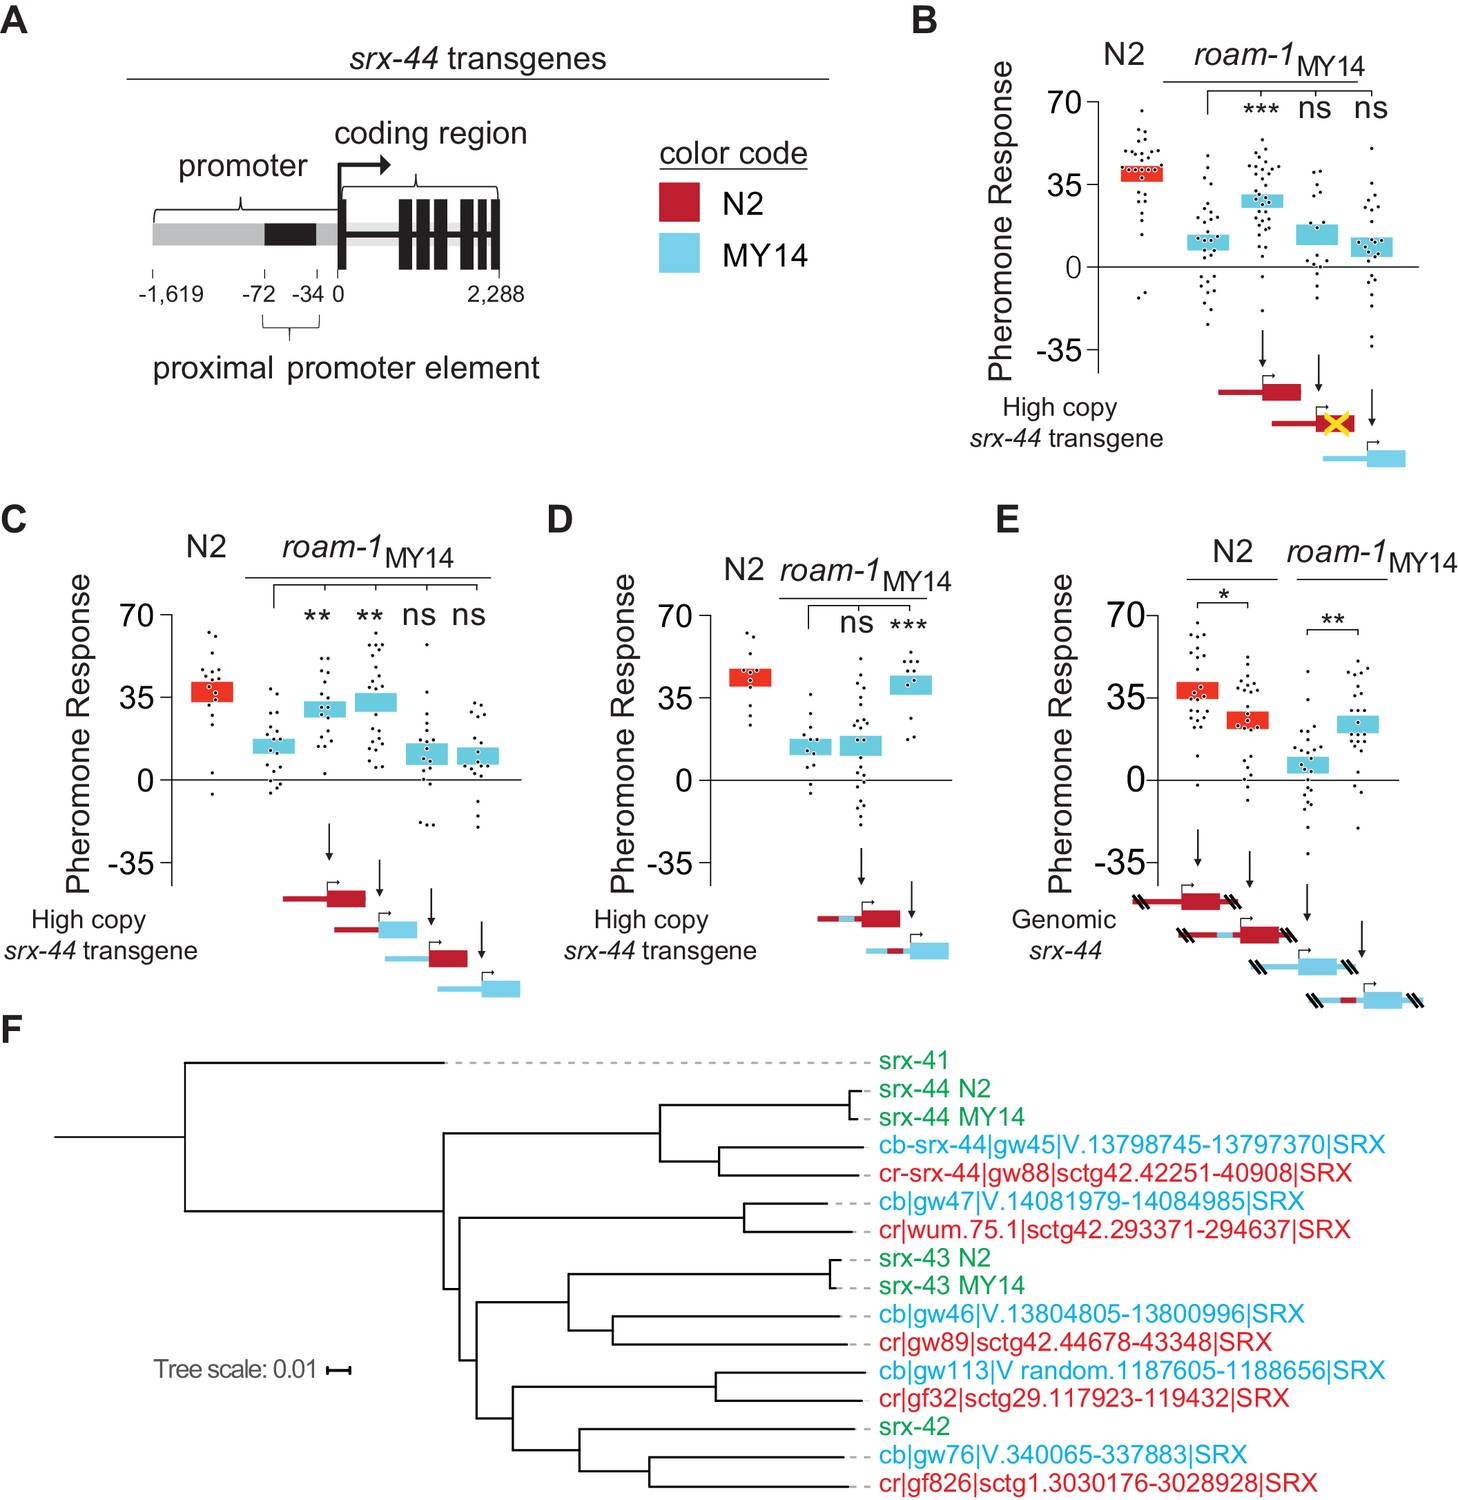
The proximal promoter sequence underlies altered srx-44 activity in MY14.
(A) Cartoon of srx-44 transgenes (corresponds to grey box in Figure 2A). (B) N2 srx-44 transgenes confer icas#9 sensitivity on roam-1MY14. Similar transgenes bearing a frameshift in the coding region do not, nor do MY14 srx-44 transgenes. (C) srx-44 transgenes with a N2 promoter confer icas#9 sensitivity on roam-1MY14, whereas srx-44 transgenes with a MY14 promoter do not. (D) The proximal promoter element accounts for N2 srx-44 activity in the transgene assay. (E) icas#9 responses of Allele Replacement Lines for the srx-44 proximal promoter element, generated by homologous recombination in the endogenous genomic locus with CRISPR/Cas9, localize activity to the proximal promotor element. (F) Phylogeny constructed for the coding sequence of srx-43, srx-44 and related genes in C. elegans, C. briggsae, and C. remanei. The srx-44 alleles in N2 and MY14 are closely related, confirming they are alleles of a single gene. Genes are color coded by species (green = C. elegans, blue = C. briggsae, orange = C. remanei). Protein sequences and gene names are from Thomas and Robertson (2008). For B-E, boxes indicate the mean pheromone response ± SEM. Box color in the data panels indicates genotype at the genomic roam-1 locus (Red = N2; Blue = MY14). Transgenes and allele replacements are indicated in cartoons with the same color code. ***p<0.001,**p<0.01,* p<0.05, ns = not significant by ANOVA with Dunnett correction (B, C, D) or by t test (E).
-
Figure 3—source data 1
Individual exploration assays in Figure 3B–E.
- https://doi.org/10.7554/eLife.21454.007
Figure 4
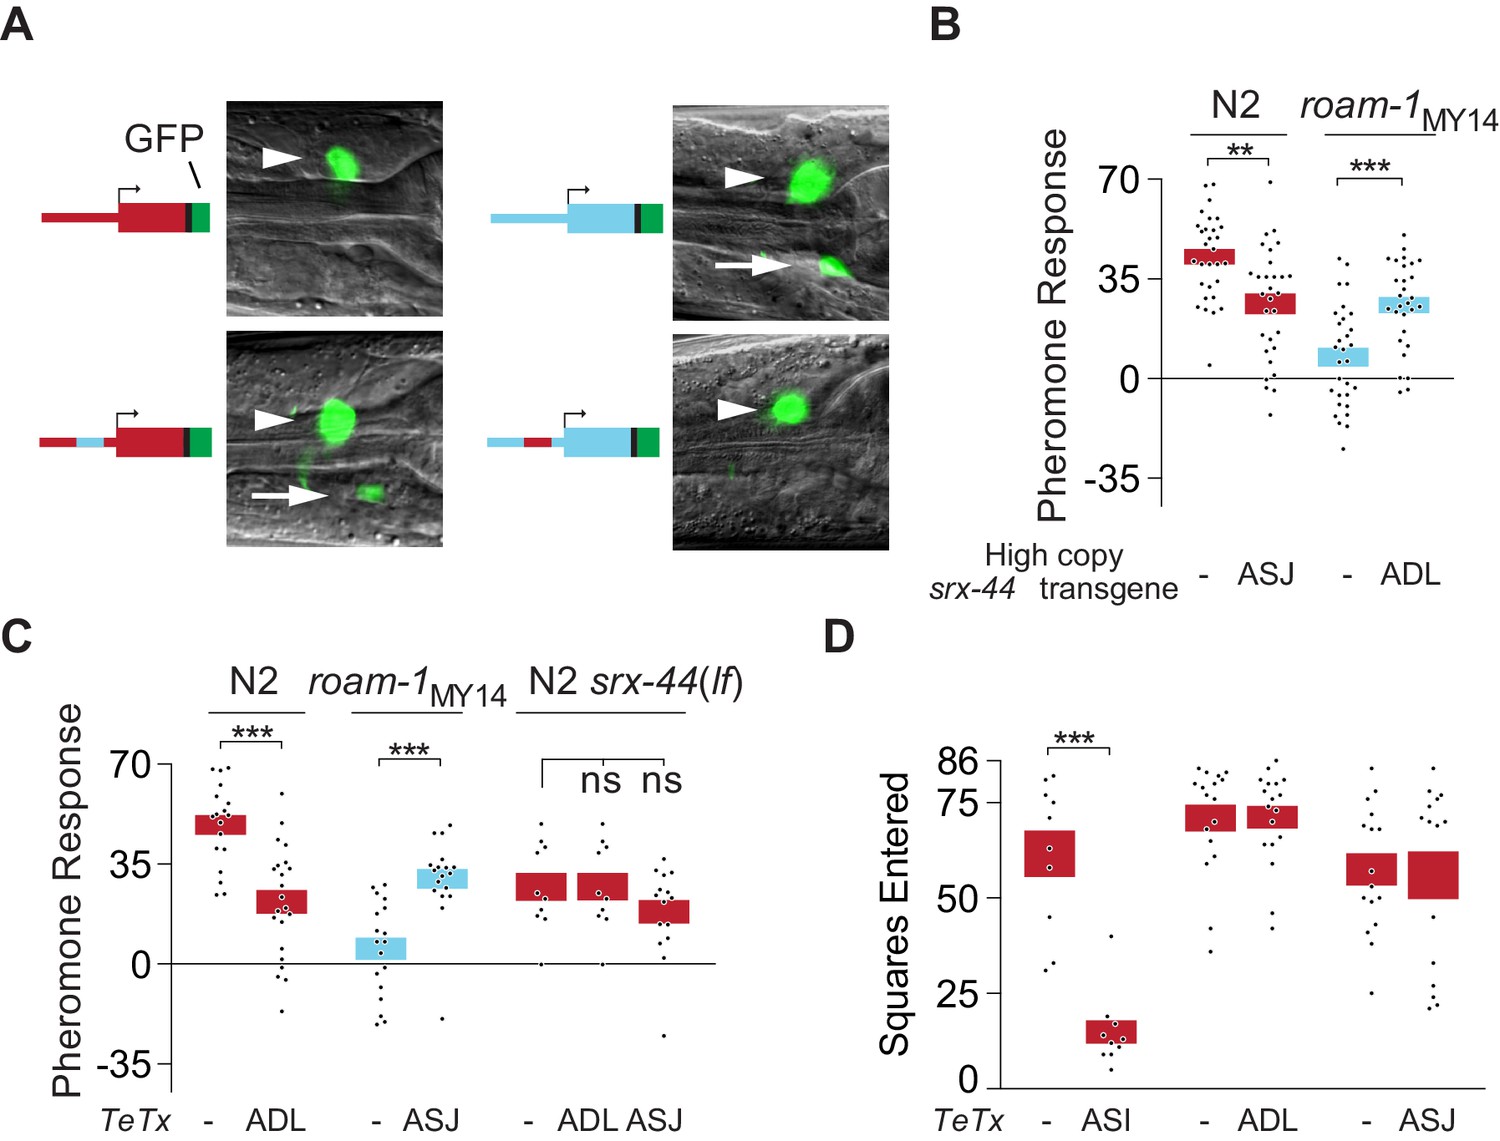
srx-44 site of expression determines whether it potentiates (ADL) or suppresses (ASJ) behavioral response to icas#9.
(A) Expression of GFP from srx-44 reporter genes. Images show overlaid fluorescence and differential interference contrast images of the anterior ganglion, with anterior at the left and dorsal up. Arrowheads indicate ADL, arrows indicate ASJ. Cartoons show transgenes tested in each image. Top left = Psrx-44(N2)::GFP; Top right = Psrx-44(MY14)::GFP. Bottom left = Psrx-44(N2 distal promoter/MY14proximal promoter)::GFP; Bottom right = Psrx-44(MY14 distal promoter/N2 proximal promoter)::GFP. (B) Transgenes expressing srx-44 under ASJ- or ADL-specific promoters oppositely affect pheromone responses. (C) Tetanus toxin light chain (TeTx) inhibition of neurotransmitter and neuropeptide release from ASJ or ADL affects icas#9 sensitivity in an srx-44 dependent manner. (D) TeTx inhibition of ASI, but not ADL or ASJ, reduces exploration on pheromone-free control plates, expressed as mean squares entered ± SEM. Boxes indicate the mean ± SEM. Box color indicates genotype at the roam-1 locus (Red = N2; Blue = MY14). All data presented as mean ± SEM. ***p<0.001,**p<0.01, ns = not significant by t test (B, C- N2 and roam-1MY14, D) or by ANOVA with Dunnett correction (C- N2 srx-44(lf)).
-
Figure 4—source data 1
Individual exploration assays in Figure 4B–D.
- https://doi.org/10.7554/eLife.21454.009
Figure 5 with 1 supplement
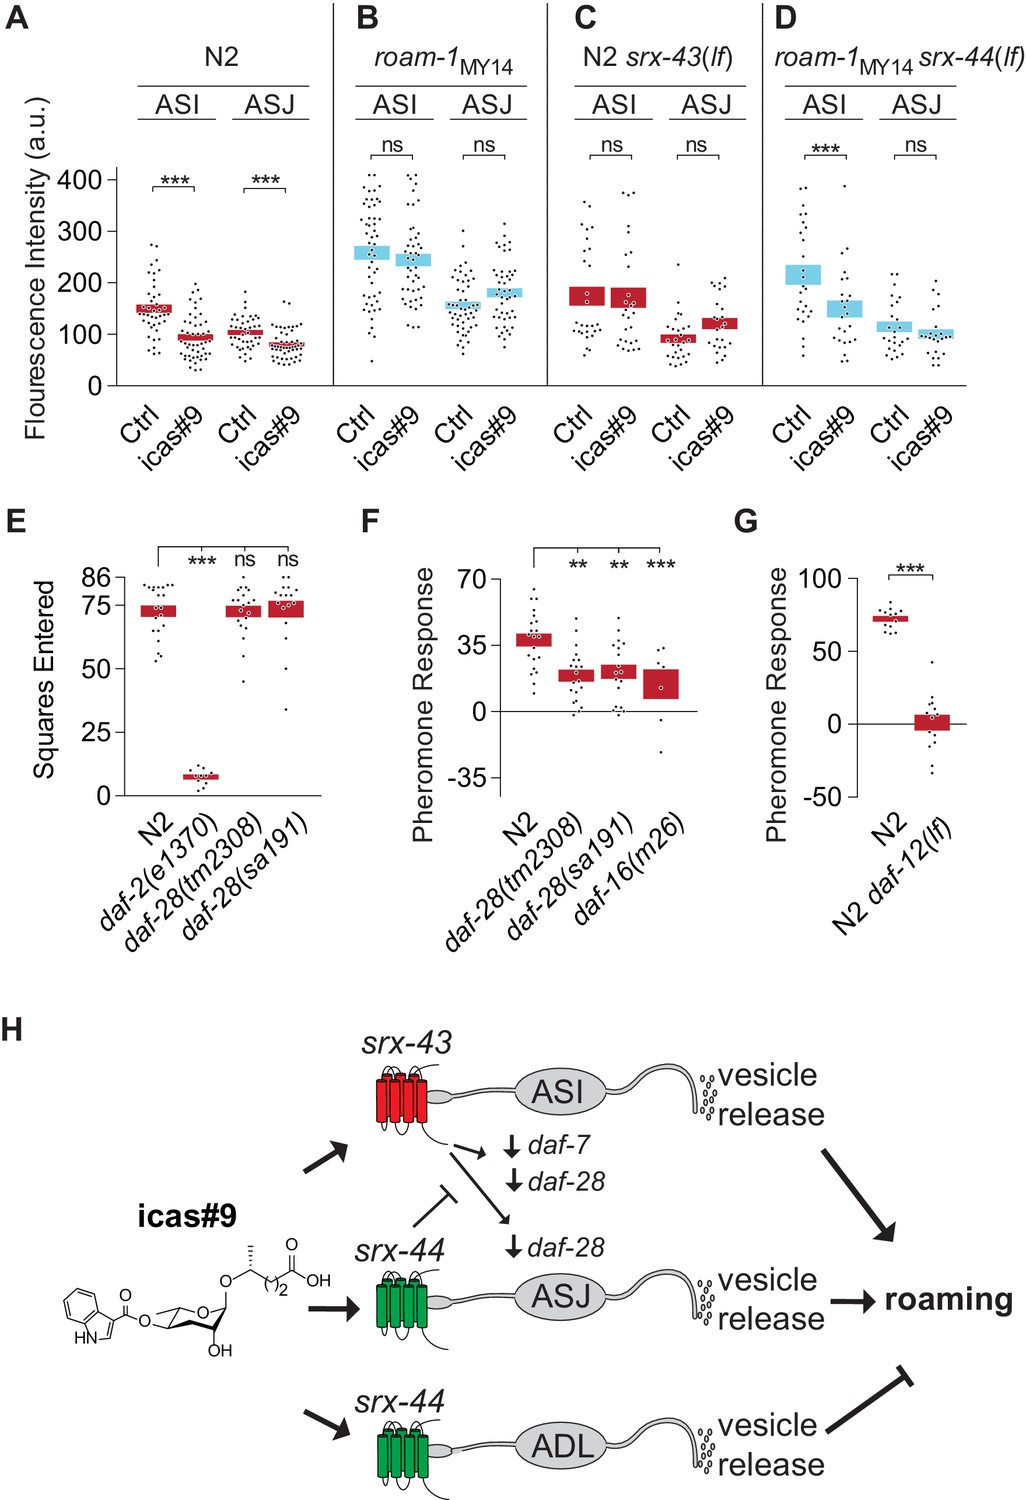
srx-43 and srx-44 regulate insulin and TGF-β endocrine signaling pathways.
(A–D) Effect of icas#9 on ASI and ASJ daf-28::GFP expression in N2, roam-1MY14, N2 srx-43(lf), and roam-1MY14 srx-44(lf) animals. Bars indicate mean fluorescence intensity ± SEM. (E) Exploration in the absence of pheromones in insulin pathway mutants, expressed as mean squares entered ± SEM. ***p<0.001, ns = not significant by ANOVA with Dunnett correction. (F) Pheromone response of insulin pathway mutants expressed as mean ± SEM. (G) daf-12, a convergence point of daf-7 (TGF-beta) and daf-28 (insulin) signaling in development, is necessary for icas#9 modulation of foraging behavior. Bars indicate icas#9 response expressed as mean ± SEM. (H) Schematic of the proposed relationships between icas#9, the chemoreceptors srx-43 or srx-44, the sensory neurons ASI, ASJ or ADL, alterations in insulin and TGF-beta gene expression, vesicle release, and roaming behavior. SRX-43 and SRX-44 confer sensitivity to icas#9, which leads to changes in gene expression both within the sensing cell and within other sensory neurons. Activation of SRX-43 in ASI reduces the expression of daf-7 (TGF-beta) and daf-28 (insulin) genes as shown in Figure 5A and C and in Greene et al. (2016). The activity of SRX-44 can antagonize this effect as shown in Figure 5B and D. Vesicle release from the sensory neurons, potentially releasing DAF-7, DAF-28, or other neurotransmitters or neuropeptides, can stimulate roaming at baseline (ASI; shown in Figure 4D), stimulate roaming in the presence of icas#9 (ASJ; Figure 4C), or inhibit roaming in the presence of icas#9 (ADL; Figure 4C). Boxes indicate the mean ± SEM, color indicates genotype at roam-1 locus (red = N2, blue = MY14). ***p<0.001,**p<0.01, ns = not significant by t test (A, D) or by ANOVA with Dunnett correction (B, C).
-
Figure 5—source data 1
GFP quantification in ADL and ASJ neurons for Figure 5A–D.
- https://doi.org/10.7554/eLife.21454.011
-
Figure 5—source data 2
Individual exploration assay results for Figure 5E–G.
- https://doi.org/10.7554/eLife.21454.012
Figure 5—figure supplement 1
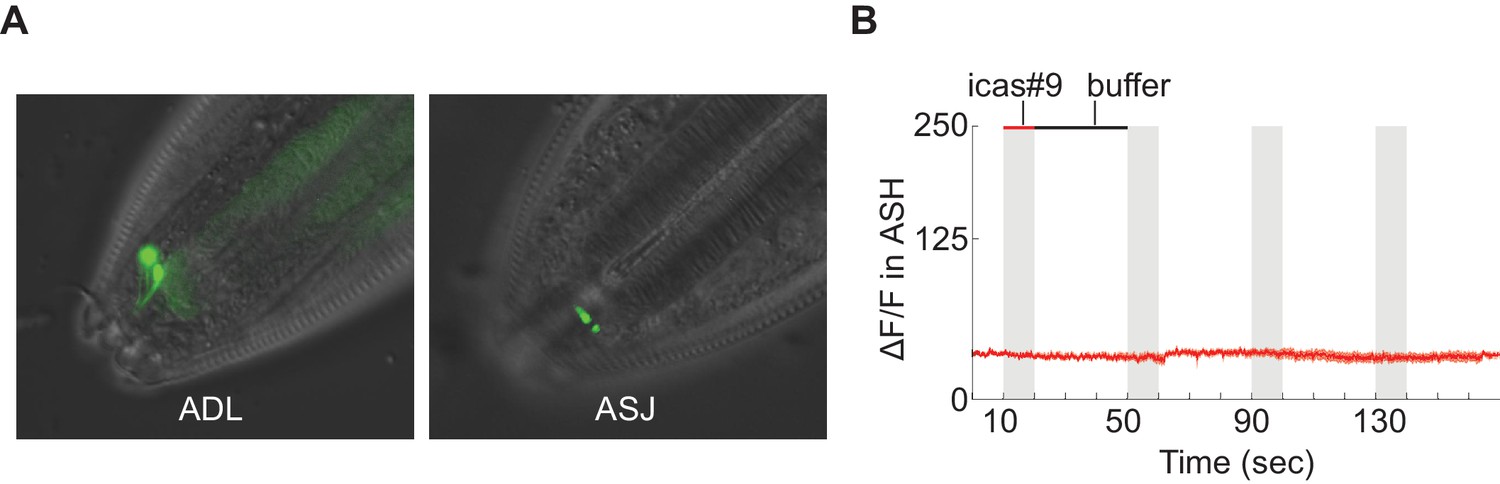
Tests of srx-44 chemosensory activity.
(A) Full length SRX-44::GFP translational fusion proteins are enriched in the sensory cilia of ADL (top) and ASJ (bottom) (B) Expression of the srx-44 coding region in ASH neurons did not confer sensitivity to 10 nM icas#9 in functional calcium imaging assays. srx-43 expression from the same promoter conferred sensitivity to icas#9 in the same assay. n = 7 animals.
-
Figure 5—figure supplement 1—source data 1
ASH fluorescence (a.u.) values for buffer or icas#9 pulses.
- https://doi.org/10.7554/eLife.21454.014
Figure 6
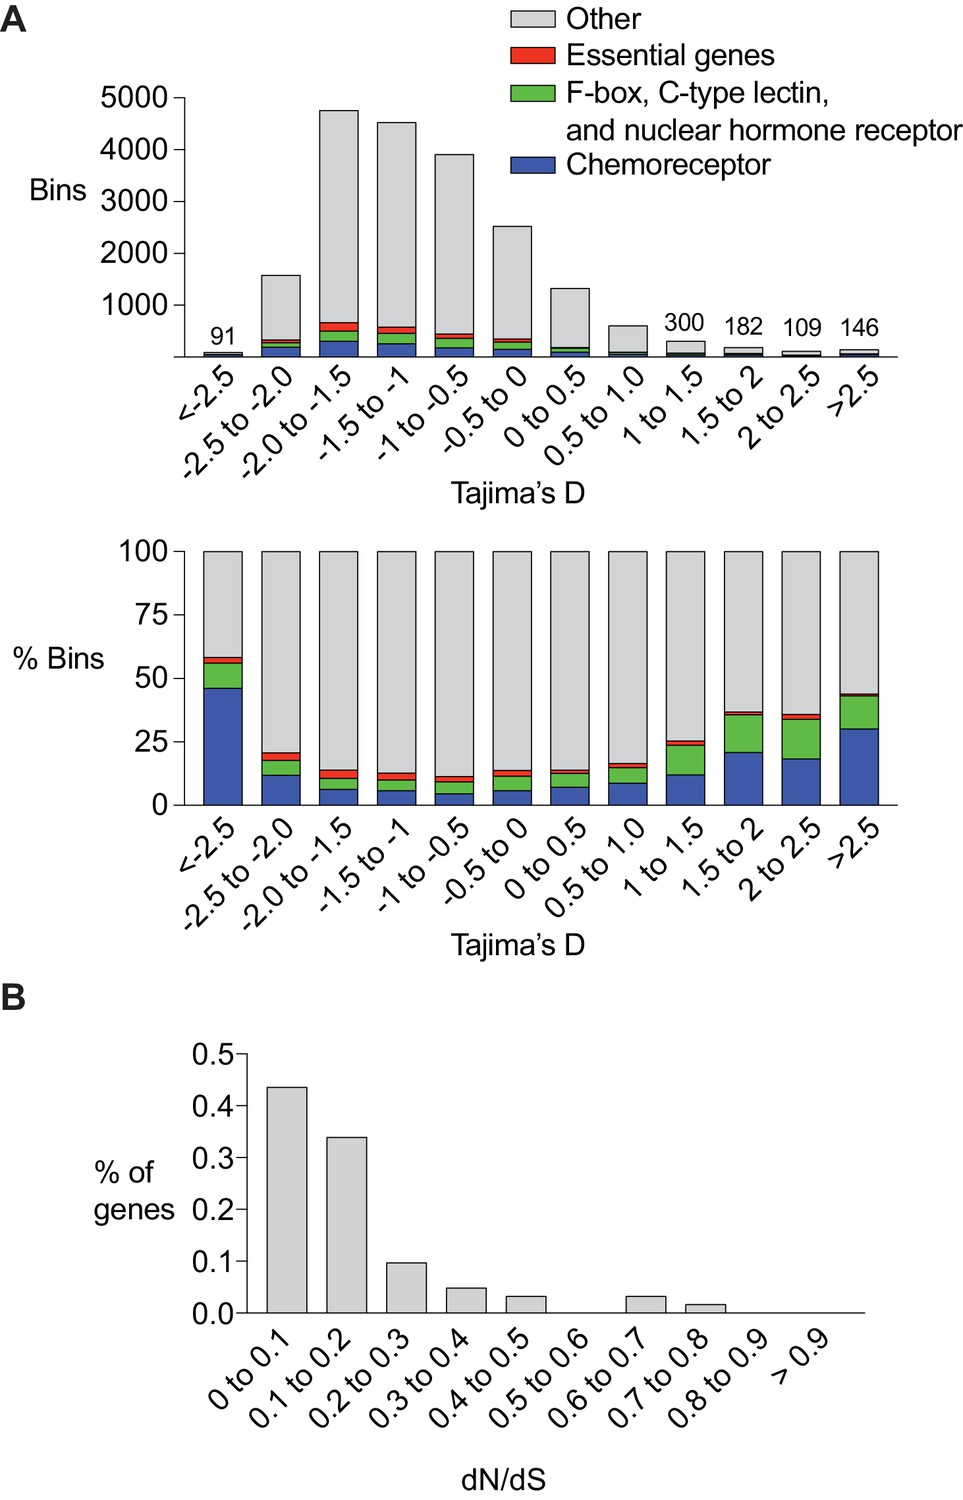
Chemoreceptor genes are targets of positive selection and balancing selection in C. elegans.
(A) Enrichment of chemoreceptors among regions of the genome with low or high Tajima’s D score. Top, total number of bins containing genes of different classes. For the highest and lowest Tajima’s D (<5% of total), the numbers above bars indicate the total number of bins at that value. Bottom, percent of bins with a chemoreceptor. The srx-43/srx-44 region within the roam-1 locus has a Tajima’s D of ~ 1. Bars are color coded, red = essential genes (let, unc, dpy, bli, rol and egl gene families), green = F-box, C-type lectin, and nuclear hormone receptors, blue = chemoreceptors, grey = other gene classes and bins with no genes. (B) dN/dS analysis of chemoreceptor genes in bins with a Tajima’s D score above 1 (n = 62).
-
Figure 6—source data 1
Analysis of 5 kb bins spanning the genome for Figure 6A.
- https://doi.org/10.7554/eLife.21454.016
-
Figure 6—source data 2
dN/dS values of chemoreceptor genes for Figure 6B.
- https://doi.org/10.7554/eLife.21454.017
Download links
A two-part list of links to download the article, or parts of the article, in various formats.
Downloads (link to download the article as PDF)
Open citations (links to open the citations from this article in various online reference manager services)
Cite this article (links to download the citations from this article in formats compatible with various reference manager tools)
Regulatory changes in two chemoreceptor genes contribute to a Caenorhabditis elegans QTL for foraging behavior
eLife 5:e21454.
https://doi.org/10.7554/eLife.21454


