Chlamydia trachomatis-containing vacuole serves as deubiquitination platform to stabilize Mcl-1 and to interfere with host defense
- University of Würzburg, Germany
- University of Kansas, United States
Figures
Figure 1 with 2 supplements
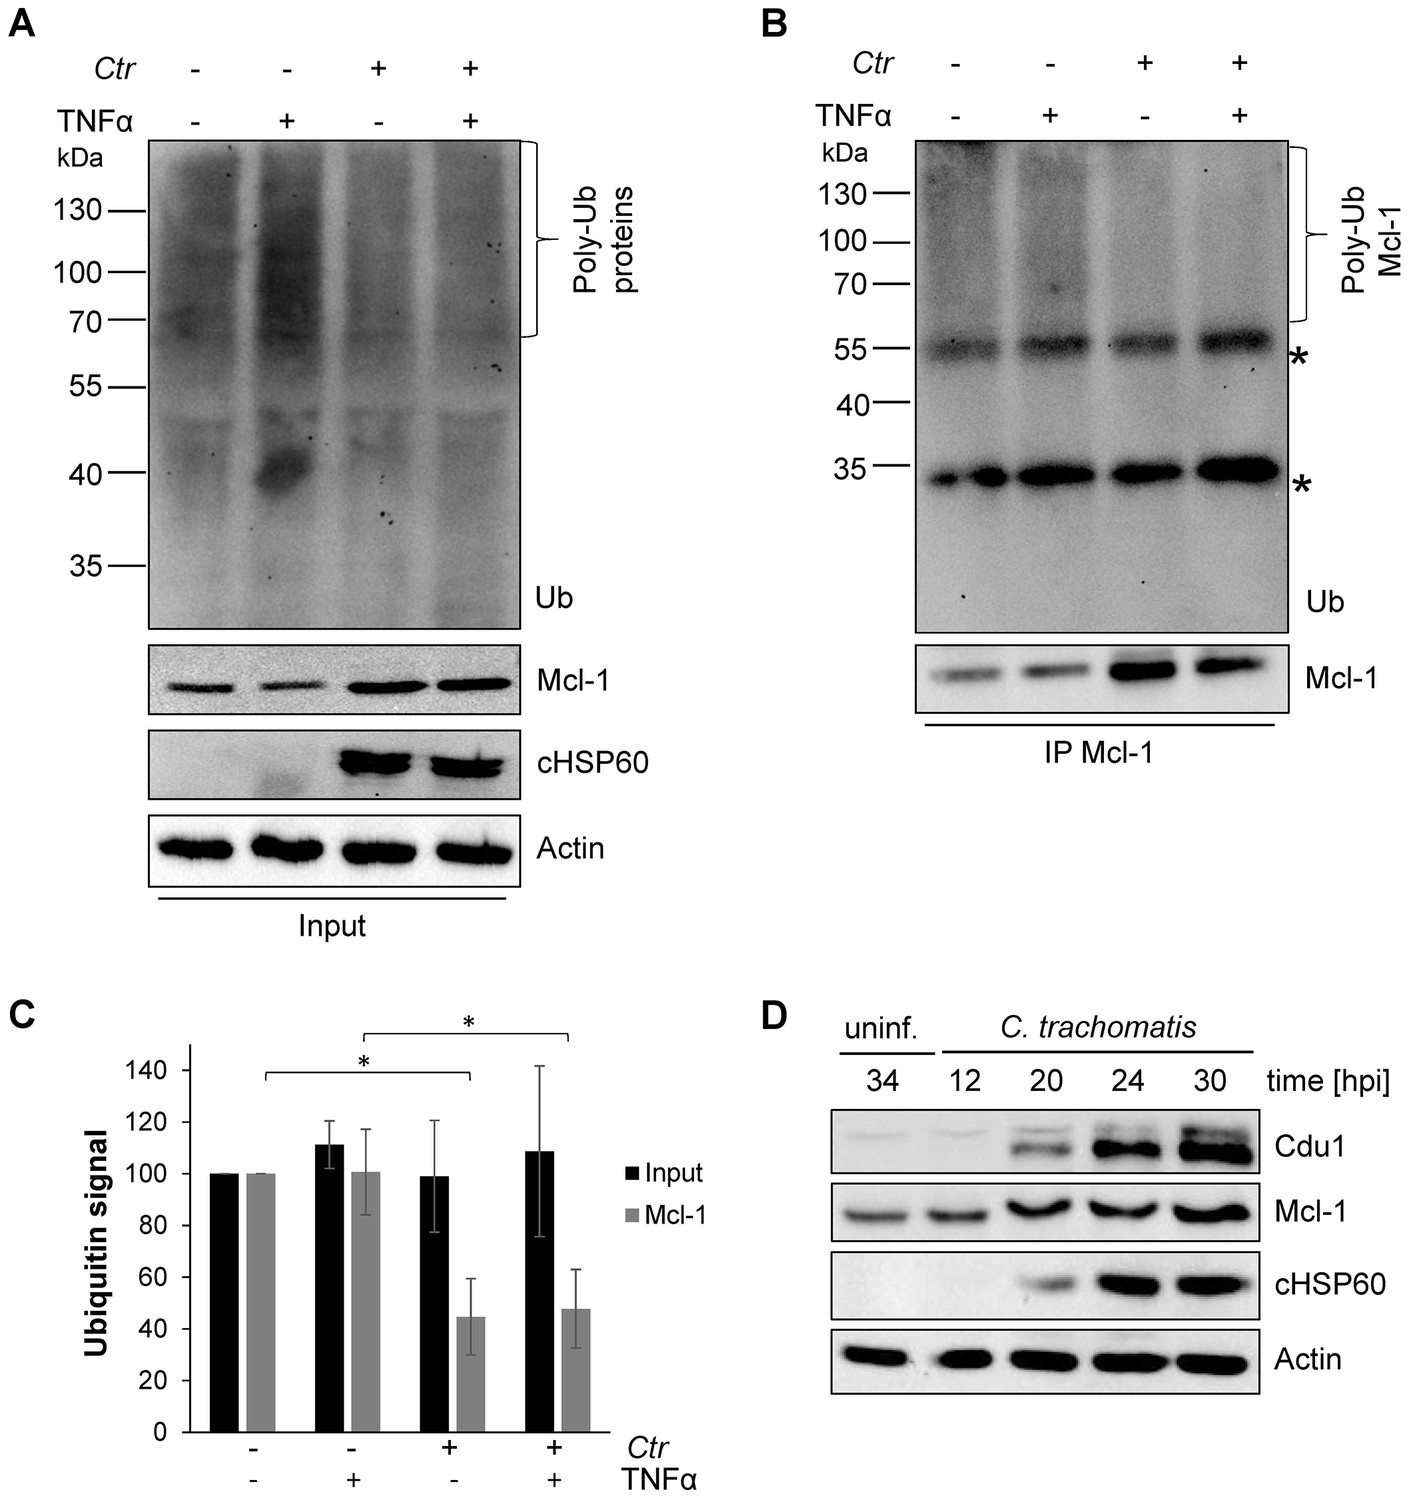
Mcl-1 is deubiquitinated during C. trachomatis infection.
(A) HeLa cells were infected with C. trachomatis (Ctr) (MOI 1) and 20 hpi the proteasome inhibitor MG132 (20 µM) was added and apoptosis was induced by treatment with TNFα/CHX for 2.5 hr. Cells were lysed in RIPA-buffer under stringent conditions and the global ubiquitination status of proteins was tested by immunoblot analysis. Immunoblots for Actin, chlamydial HSP60 (cHSP60) and Mcl-1 function as input controls. Depicted are representative immunoblots. (B) Mcl-1 was immunoprecipitated under stringent conditions using a monoclonal anti-Mcl-1 antibody and the ubiquitination pattern was visualized by immunoblotting. Shown are representative immunoblots. The asterisks mark the signal from the heavy and light chains of the IgG antibody. (C) Quantification of ubiquitination of whole cell lysates or immunoprecipitated Mcl-1 (A and B). The graph shows mean values from three individual experiments ± SD. The significance was calculated with the student’s T-test *p<0.05; **p<0.01. (D) Infection time course experiment with C. trachomatis-infected HeLa cells. Time of Cdu1 expression and Mcl-1 stabilization was analyzed by immunoblot. The second band visible in the Cdu1 blot may originate from a so far unknown post translational modification of Cdu1 or an unrelated protein. Decoration with chlamydial HSP60 and Actin antibodies serves as a control for infection and loading, respectively. See also Figure 1—source data 1.
-
Figure 1—source data 1
Raw data for quantitative analysis of Mcl-1 ubiquitination level shown in Figure 1.
- https://doi.org/10.7554/eLife.21465.003
Figure 1—figure supplement 1
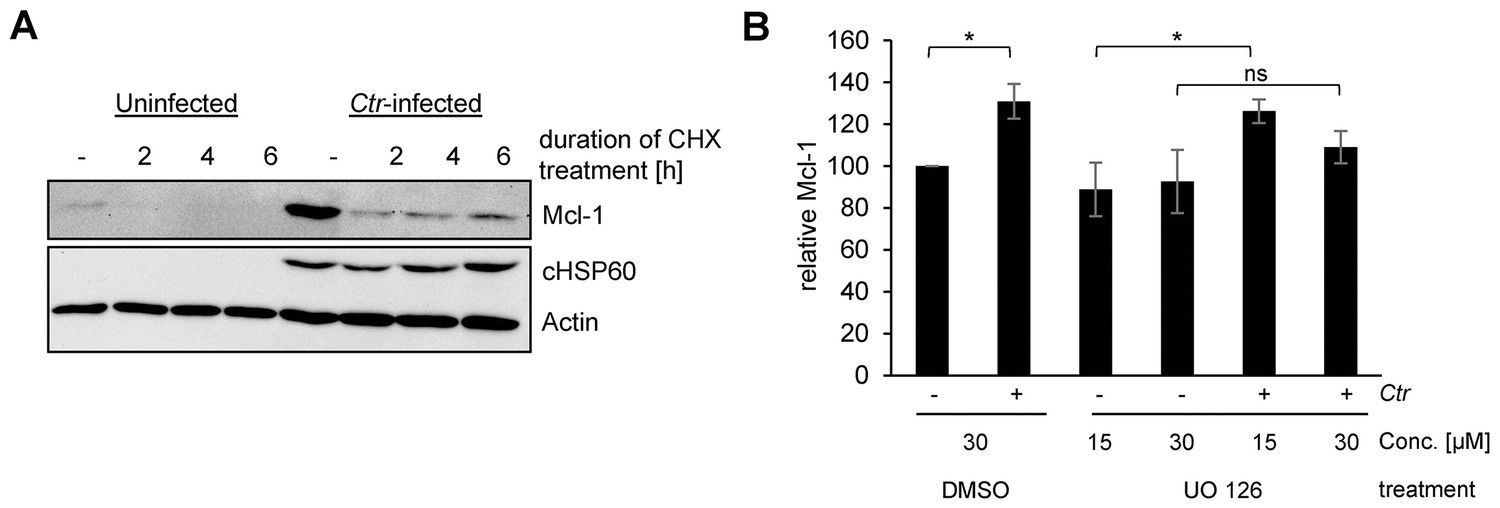
Mcl-1 is stabilized during chlamydial infection.
(A) HeLa cells were infected with C. trachomatis (Ctr) (MOI 1) and at 24, 26 and 28 hpi 10 µg/ml CHX was added to uninfected and Ctr-infected cells. Cells were lysed 30 hpi and the protein level of Mcl-1 upon CHX treatment was analyzed by immunoblot. Actin and cHSP60 serve as loading and infection control, respectively. (B) HeLa cells were infected with Ctr (MOI1) and the MEK inhibitor UO126 or DMSO as a control was added 12 hpi to the cells in the indicated concentration. Cells were lysed 24 hpi and Chlamydia-mediated Mcl-1 stabilization was analyzed by immunoblot. Shown are mean values of Mcl-1 protein levels calculated from three individual experiments ± SD. The significance was calculated with the student’s T-test *p<0.05. See also Figure 1—figure supplement 1—source data 1.
-
Figure 1—figure supplement 1—source data 1
Raw data for quantitative analysis of Mcl-1 level in UO126-treated HeLa cells infected with C. trachomatis shown in Figure 1—figure supplement 1.
- https://doi.org/10.7554/eLife.21465.005
Figure 1—figure supplement 2
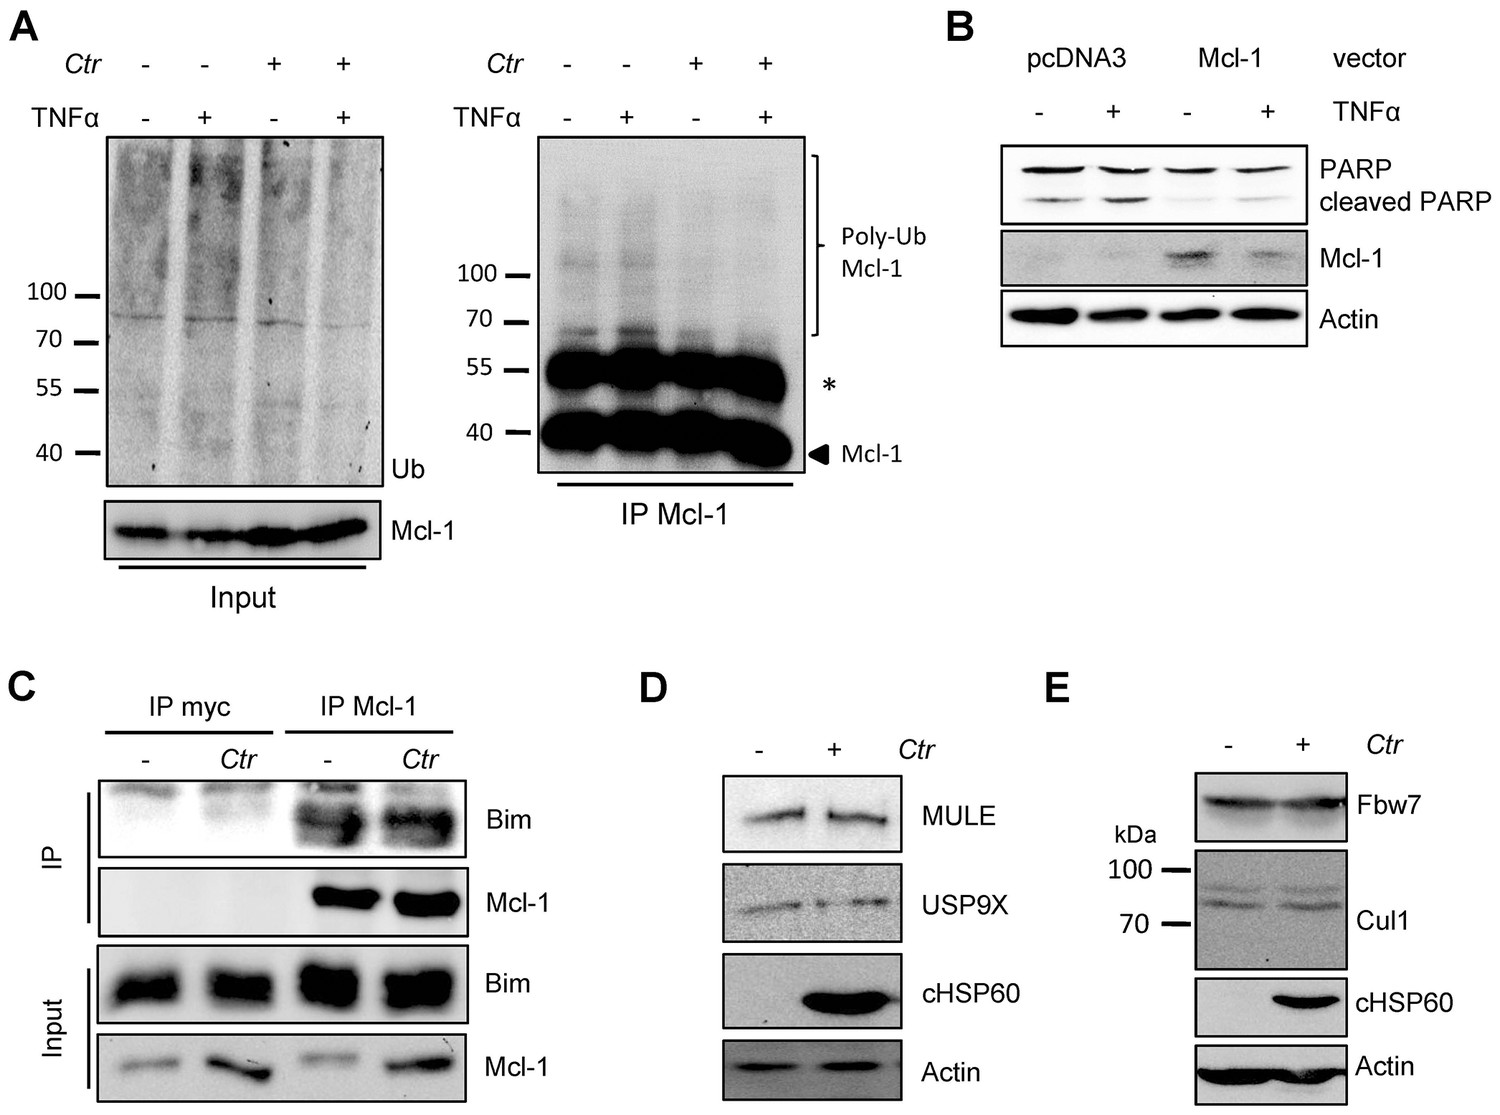
Cellular components of the UPS play minor role in Chlamydia-mediated Mcl-1 stabilization.
(A) HeLa cells were infected with C. trachomatis (Ctr) (MOI 1) and 20 hpi the proteasome inhibitor MG132 (20 µM) was added and apoptosis was induced by treatment with TNFα/CHX for 2.5 hr. Cells were lysed in RIPA-buffer under stringent conditions and the global ubiquitination status of proteins was tested by immunoblot analysis (left panel). Mcl-1 was immunoprecipitated under stringent conditions using a monoclonal anti-Mcl-1 antibody (Epitomics) and ubiquitination of Mcl-1 was visualized by immunoblotting using a polyclonal anti-Mcl-1 antibody (Santa Cruz) (right panel). The asterisk marks the signal from the heavy chain of the IgG antibody. (B) HeLa cells were transfected with the Mcl-1 expression plasmid or empty vector control and 24 hr post transfection apoptosis was induced by TNFα/CHX. Cells were lysed and Mcl-1 overexpression and apoptosis induction was analyzed in an immunoblot by PARP cleavage. Actin serves as loading control. (C) HeLa cells were infected with Ctr (MOI 1) for 24 hr. One hour prior to lysis in co-IP lysis buffer cells were incubated with 10 µM of the proteasome inhibitor MG132. Mcl-1 and co-precipitated Bim were visualized by immunoblot. An unrelated anti-myc tag antibody was used as a control. (D+E) HeLa cells were infected with Ctr (MOI 1) for 24 hr and whole cell lysates were analyzed by immunoblot. Protein amounts of MULE and USP9X (D) as well as components of the SCFFbw7 E3 ligase complex (E) were visualized by immunoblot.
Figure 2 with 1 supplement
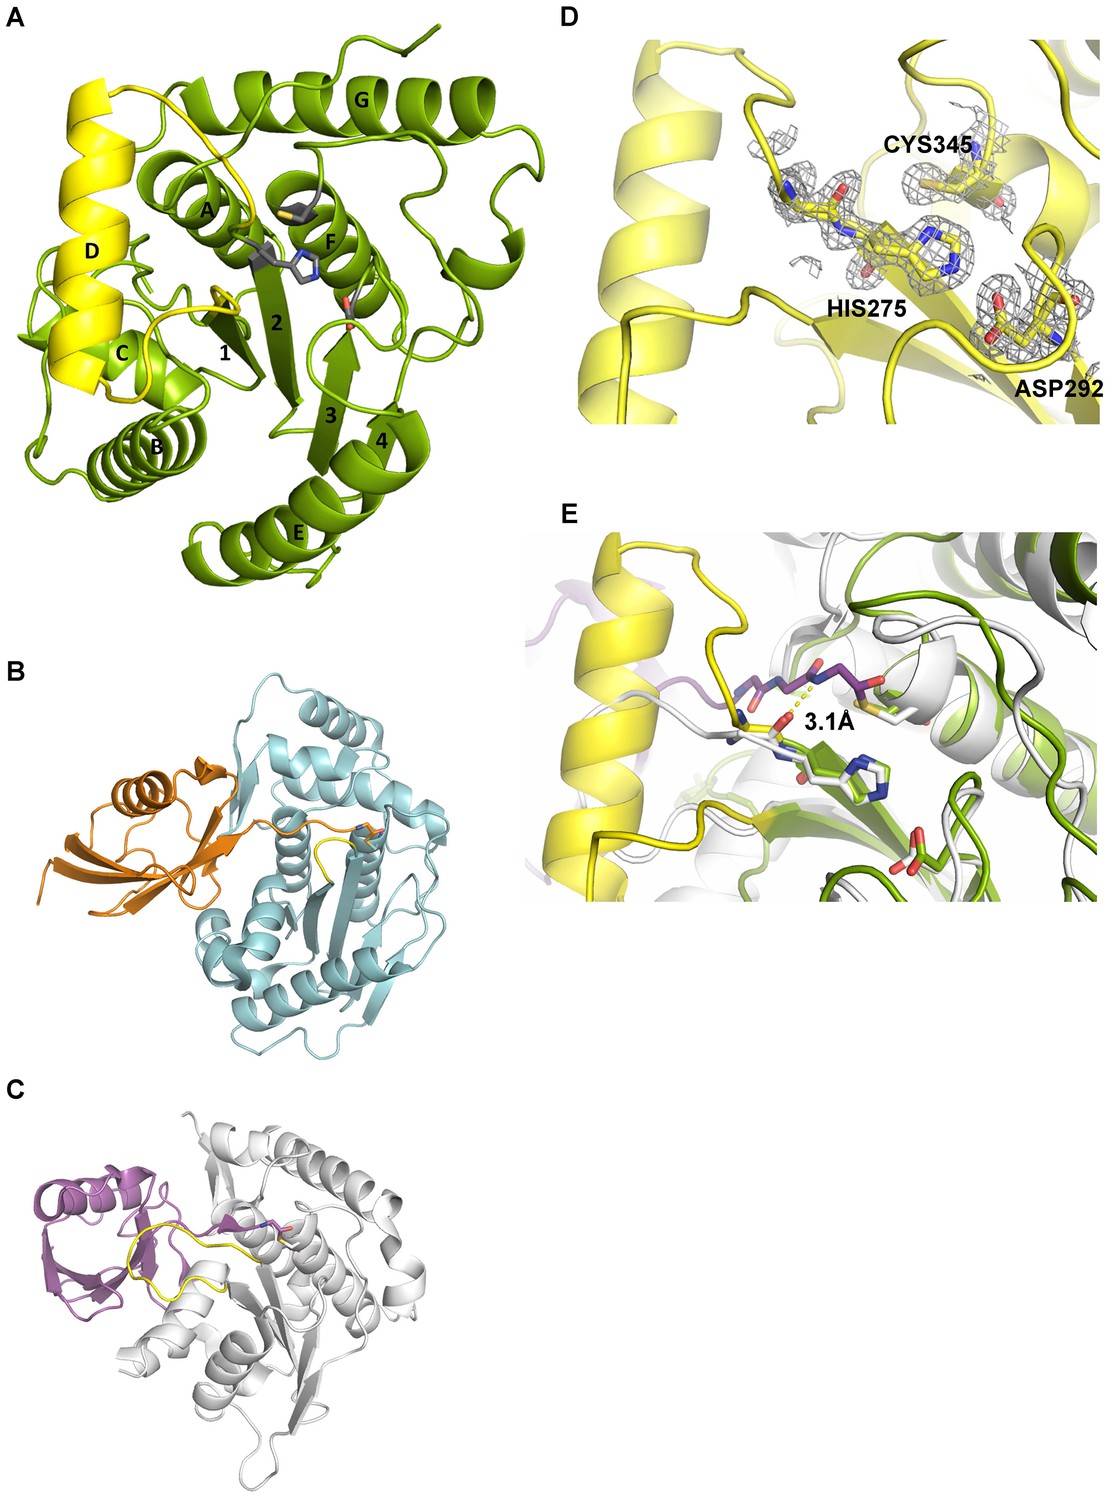
Structural features of Cdu1.
(A) Overall structure of Cdu1 showing the catalytic triad (in stick representation) and the lid-helix motif between β-strands 1 and 2 (yellow). (B) Structure of the Ulp1 (cyan)-SMT3 (orange) complex (PDB 1EUV). The loop between β-strands 1 and 2 is shown in yellow. (C) Structure of the SENP8 (gray) – Nedd8 (purple) complex (PDB 1XT9). The loop between β-strands 1 and 2 is shown in yellow. (D) 2Fo – Fc omit maps for the catalytic triad of Cdu1 is contoured at an rmsd level of 1.0. The backbone carbonyl of Ser 274 next to the active site histidine points to the binding site of the terminal Gly of Ub/Nedd8. (E) Superimposition of the Cdu1 active site (green) with the SENP8-Nedd8 complex.
Figure 2—figure supplement 1
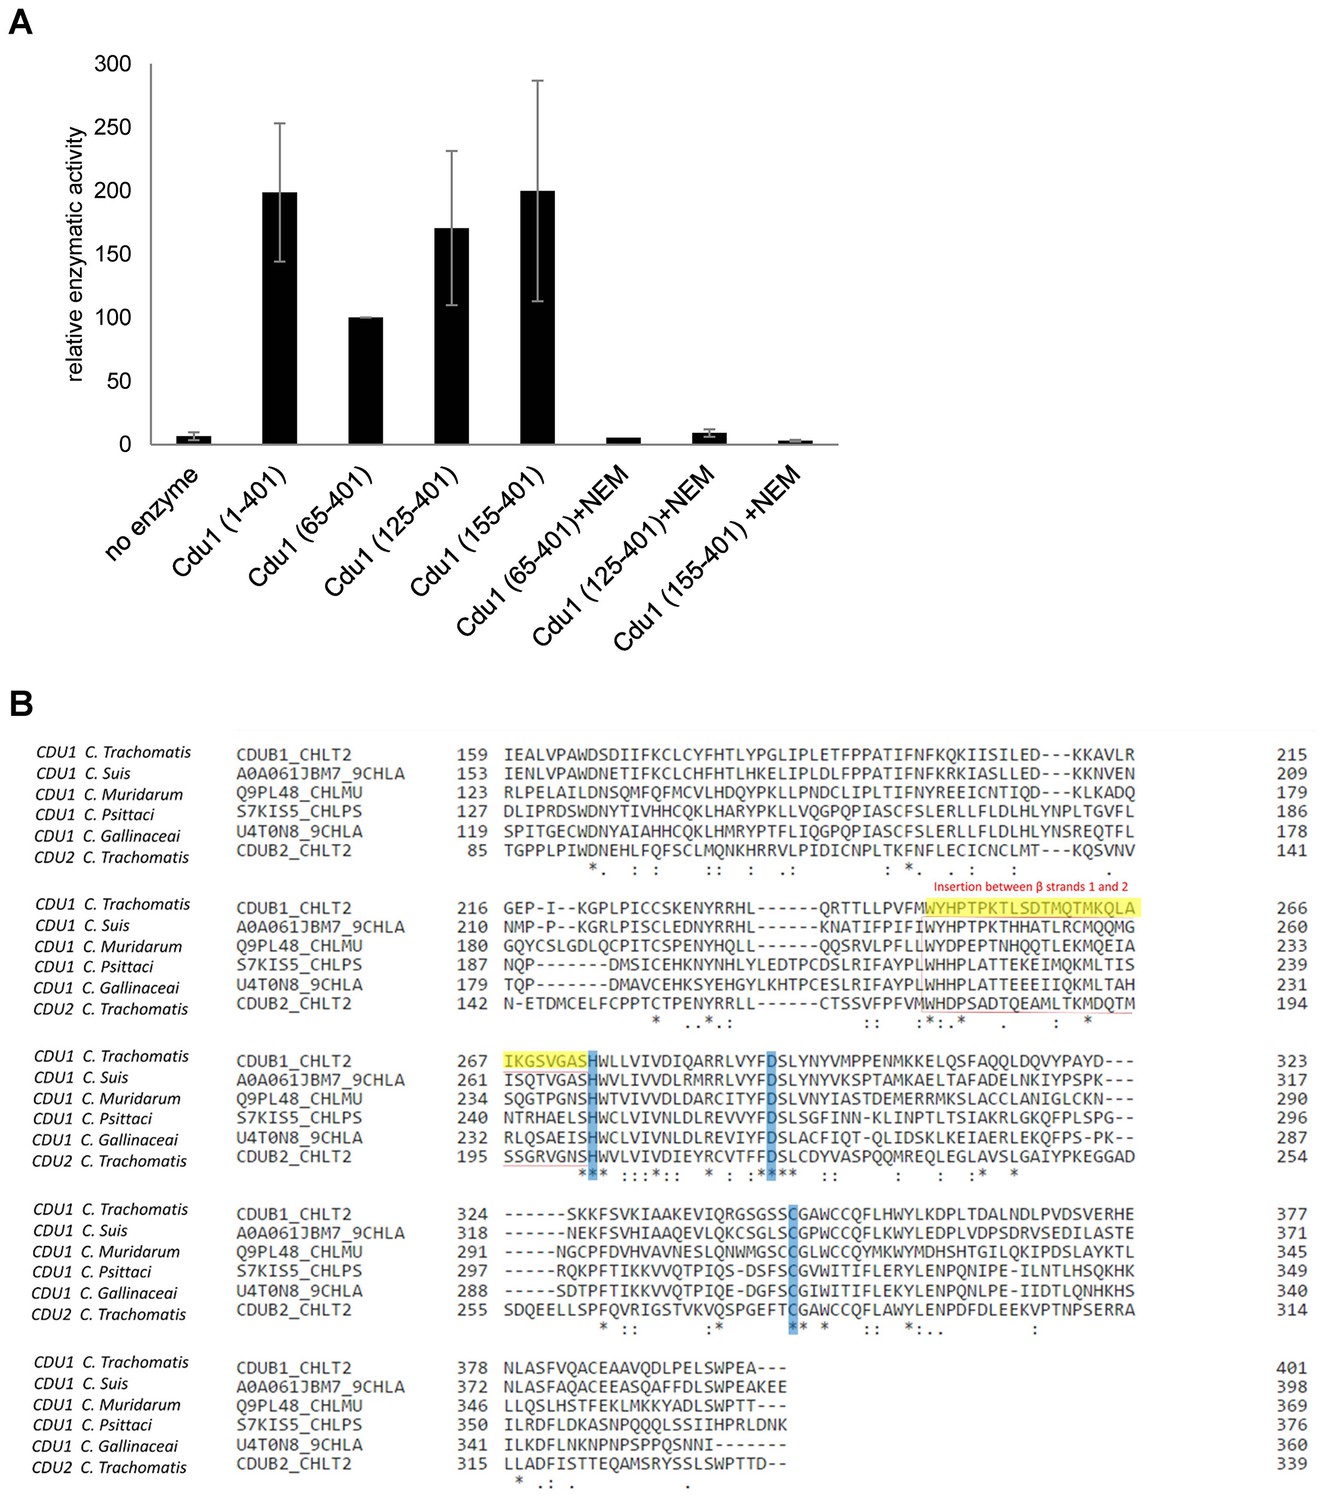
Enzymatic activity of Cdu1 used for crystallization and sequence alignment of the conserved protease domain.
(A) Relative enzymatic activity of Cdu1 constructs used for crystallization analyzed in an Ub-AMC assay. Enzymatic activity was blocked with the cysteine-protease inhibitor N-ethylmaleimide (NEM). Shown are mean values of Cdu1 enzymatic activity calculated from two individual experiments ± SD. (B) Sequence alignment of the protease domain of C. trachomatis Cdu1 with related proteases. The segment connecting β-strands 1 and 2 (highlighted in yellow) in the catalytic domain of Cdu1 is present in several Chlamydia species. The catalytic triad is marked in blue. See also Figure 2—figure supplement 1—source data 1.
-
Figure 2—figure supplement 1—source data 1
Raw data for analysis of relative enzymatic activity of Cdu1 in Ub-AMC hydrolysis assay shown in Figure 2—figure supplement 1.
- https://doi.org/10.7554/eLife.21465.009
Figure 3 with 4 supplements
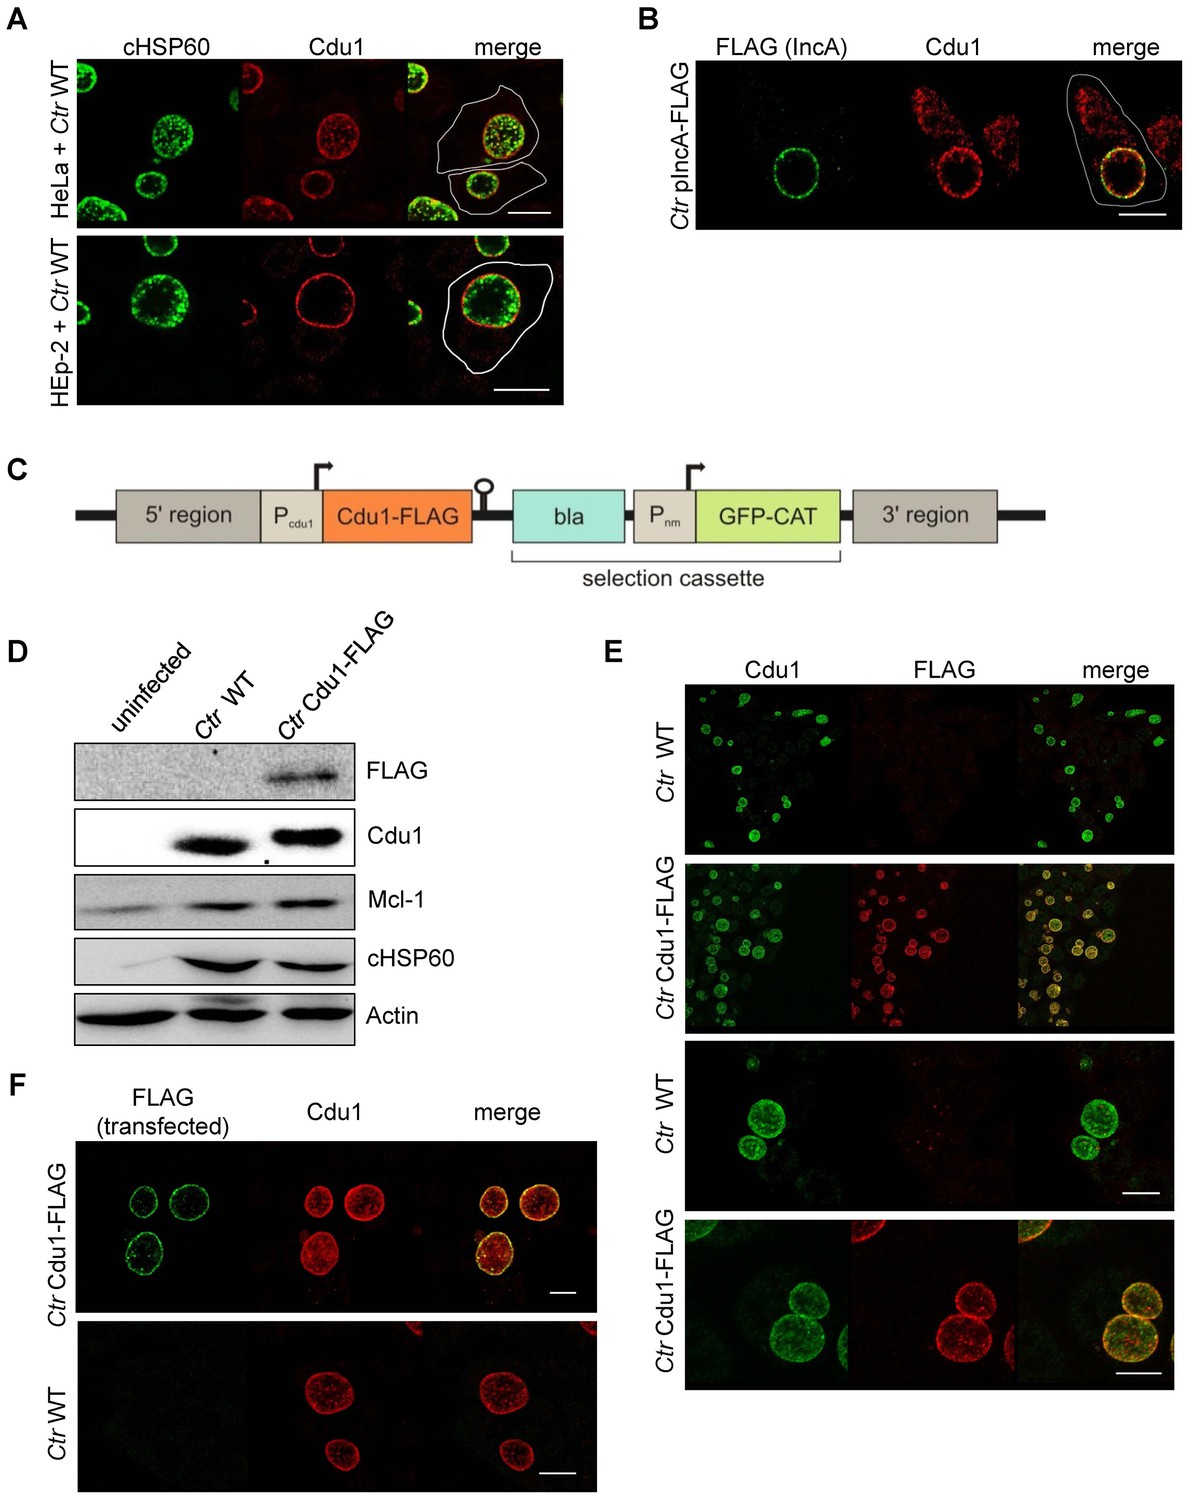
Subcellular localization of Cdu1 during infection.
(A) HeLa (upper panel) and HEp-2 (lower panel) cells were infected with C. trachomatis (Ctr) at a MOI 1 for 24 hr and fixed with 4% PFA/Sucrose, followed by the indirect immunofluorescence staining against chlamydial HSP60 (green channel) and Cdu1 (red channel). Contours of cells are marked in white. Scale bar, 10 µm. (B) HeLa cells were infected for 24 hr with Ctr expressing an IncA-FLAG fusion protein. Cells were fixed with 4% PFA/Sucrose and indirect immunofluorescence staining against FLAG (IncA; green channel) and Cdu1 (red channel) was performed. The contour of the cell is marked in white. The bar represents 10 µm. (C) Genomic region of the cdu1 locus after recombination in the Ctr Cdu1-FLAG strain. (D) HeLa cells were infected with Ctr wild-type (WT) or Ctr Cdu1-FLAG for 24 hr at a MOI of 1. Whole cell lysates were prepared and immunoblot analysis of Cdu1 and indicated proteins was performed. (E) Immunofluorescence staining of HeLa cells infected with Ctr WT or Ctr Cdu1-FLAG. Staining was performed with an anti-Cdu1 (green channel) and an anti-FLAG (red channel) antibody. Scale bar, 10 µm. (F) HEK-293T cells grown on cover slips were infected with Ctr WT or Ctr Cdu1-FLAG. 20 hpi, cells were transfected with an anti-FLAG monoclonal antibody using the Chariot protein delivery reagent and fixed 4 hr post transfection. Transfected FLAG antibody was detected by indirect immunofluorescence with a Cy5-coupled anti-mouse secondary antibody (green channel) and Cdu1 was detected using the anti-Cdu1 antibody (red channel). Scale bar, 10 µm.
Figure 3—figure supplement 1
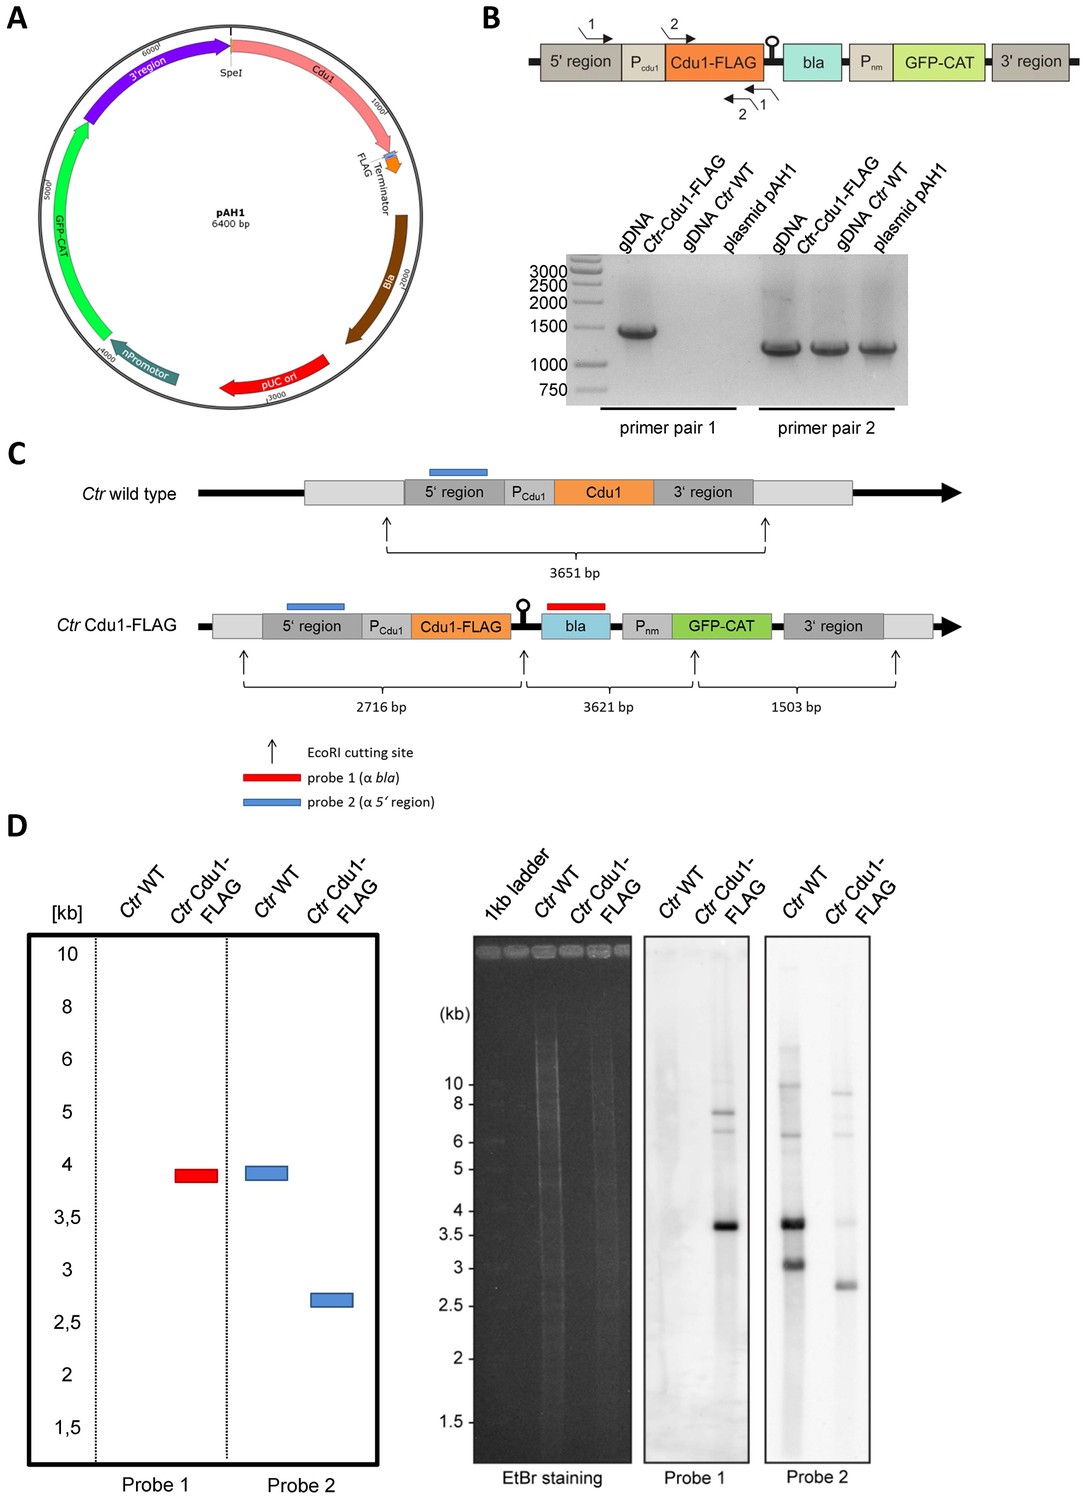
Generation and validation of the C.
trachomatis Cdu1-FLAG strain. (A) Composition of the recombination plasmid pAH1 used for transformation of C. trachomatis (Ctr) to generate Ctr Cdu1-FLAG. (B) Proof for recombination of the Cdu1-FLAG fusion protein into the chlamydial genome. PCR was performed with primer pair 1 (Seq. pAH1 frw and P2 pAH1) and primer pair 2 (Cdu1 frw and Cdu1 rev). The amplified PCR product was send for sequencing. (C) Cutting scheme of EcoRI of the cdu1 genomic region in Ctr wild-type (WT) and Ctr Cdu1-FLAG and hybridization positions of probe 1 (α-bla of selection cassette) and probe 2 (α-5’ region). (D) Theoretical results of the Southern hybridization with probe 1 and probe 2 for Ctr WT and Ctr Cdu1-FLAG. Southern hybridization with probe 1 (α-bla of selection cassette) and probe 2 (α-5’ region) in Ctr WT and Ctr Cdu1-FLAG.
Figure 3—figure supplement 2
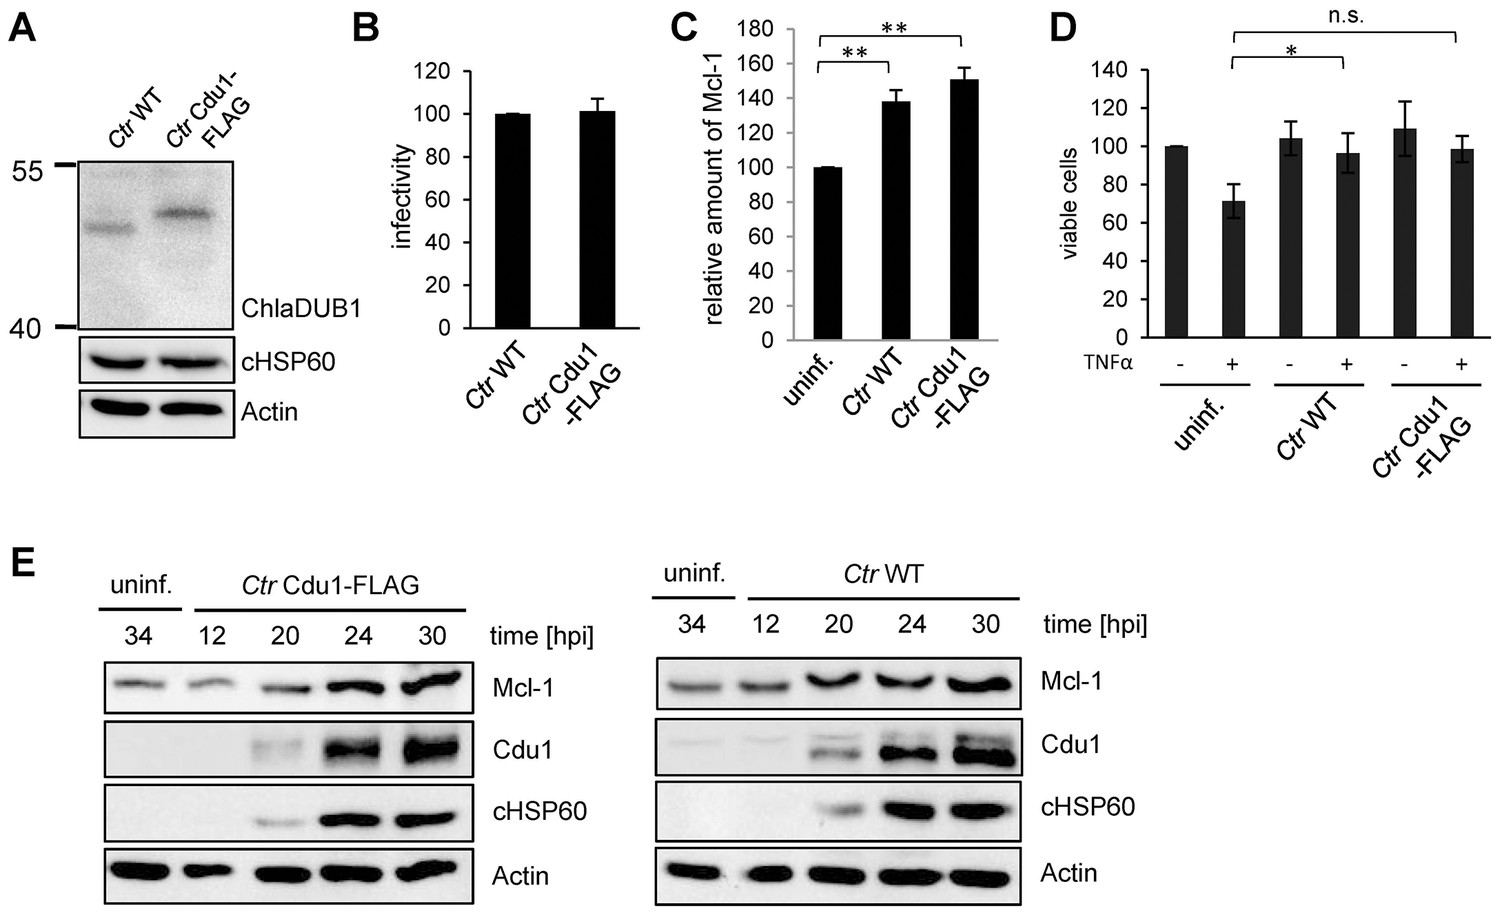
Characterization of C. trachomatis Cdu1-FLAG.
(A) HeLa cells were infected with C. trachomatis (Ctr) wild-type (WT) or Ctr Cdu1-FLAG for 24 hr. Expression and size of Cdu1 and Cdu1-FLAG was analyzed by immunoblot. (B) Infectivity assay with Ctr WT and Ctr Cdu1-FLAG in HeLa cells. Chlamydial growth was measured by the cHSP60 signal. Relative values were calculated from three individual experiments ± SD. (C) HeLa cells were infected with Ctr WT or Ctr Cdu1-FLAG and lysed 24 hpi. The Mcl-1 level was measured by immunoblot and cHSP60 and Actin were used as controls. The relative amount of Mcl-1 was calculated from three individual experiments ± SD. Significance was calculated with the student’s T-test. *p<0.05. (D) HeLa cells were infected with Ctr WT or Ctr Cdu1-FLAG for 20 hr and apoptosis was induced by addition of TNFα/CHX. Cells were lysed and cell viability was measured by PARP-cleavage by immunoblot analysis. Actin and cHSP60 were used as controls. Relative values were calculated from three individual experiments ± SD. Significance was calculated with the student’s T-test. *p<0.05. (E) Infection time course experiment with HeLa cells infected with Ctr WT or Ctr Cdu1-FLAG. Time of Cdu1 expression and Mcl-1 stabilization was analyzed by immunoblot. Chlamydial HSP60 and Actin antibodies served as loading controls. See also Figure 3—figure supplement 2—source data 1.
-
Figure 3—figure supplement 2—source data 1
Raw data for quantitative analysis of C. trachomatis Cdu1-FLAG infectivity, Mcl-1 stabilization and apoptosis inhibition shown in Figure 3—figure supplement 2.
- https://doi.org/10.7554/eLife.21465.013
Figure 3—figure supplement 3
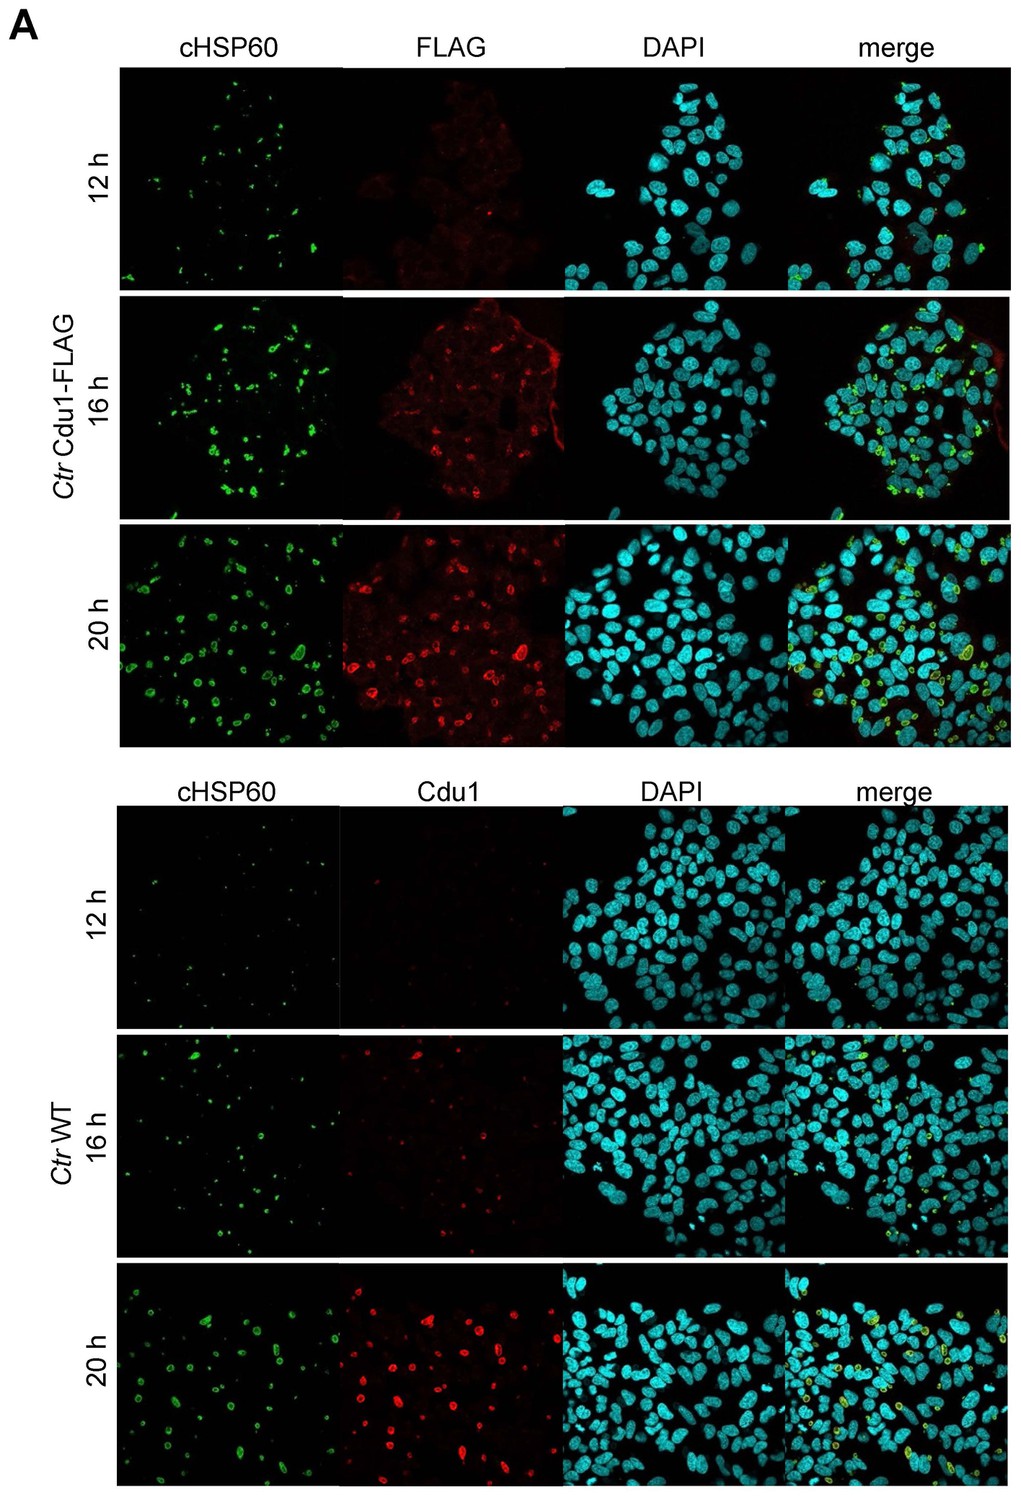
Cdu1 expression in C.
trachomatis Cdu1-FLAG. (A) Immunofluorescence staining of HeLa cells infected with C. trachomatis (Ctr) Cdu1-FLAG or Ctr wild-type (WT) for the indicated time points. Ctr Cdu1-FLAG-infected cells were stained against chlamydial HSP60 (green channel) and FLAG (red channel). Cells infected with Ctr WT were stained against chlamydial HSP60 (green channel) and Cdu1 (red channel). DNA was visualized by DAPI-staining.
Figure 3—figure supplement 4
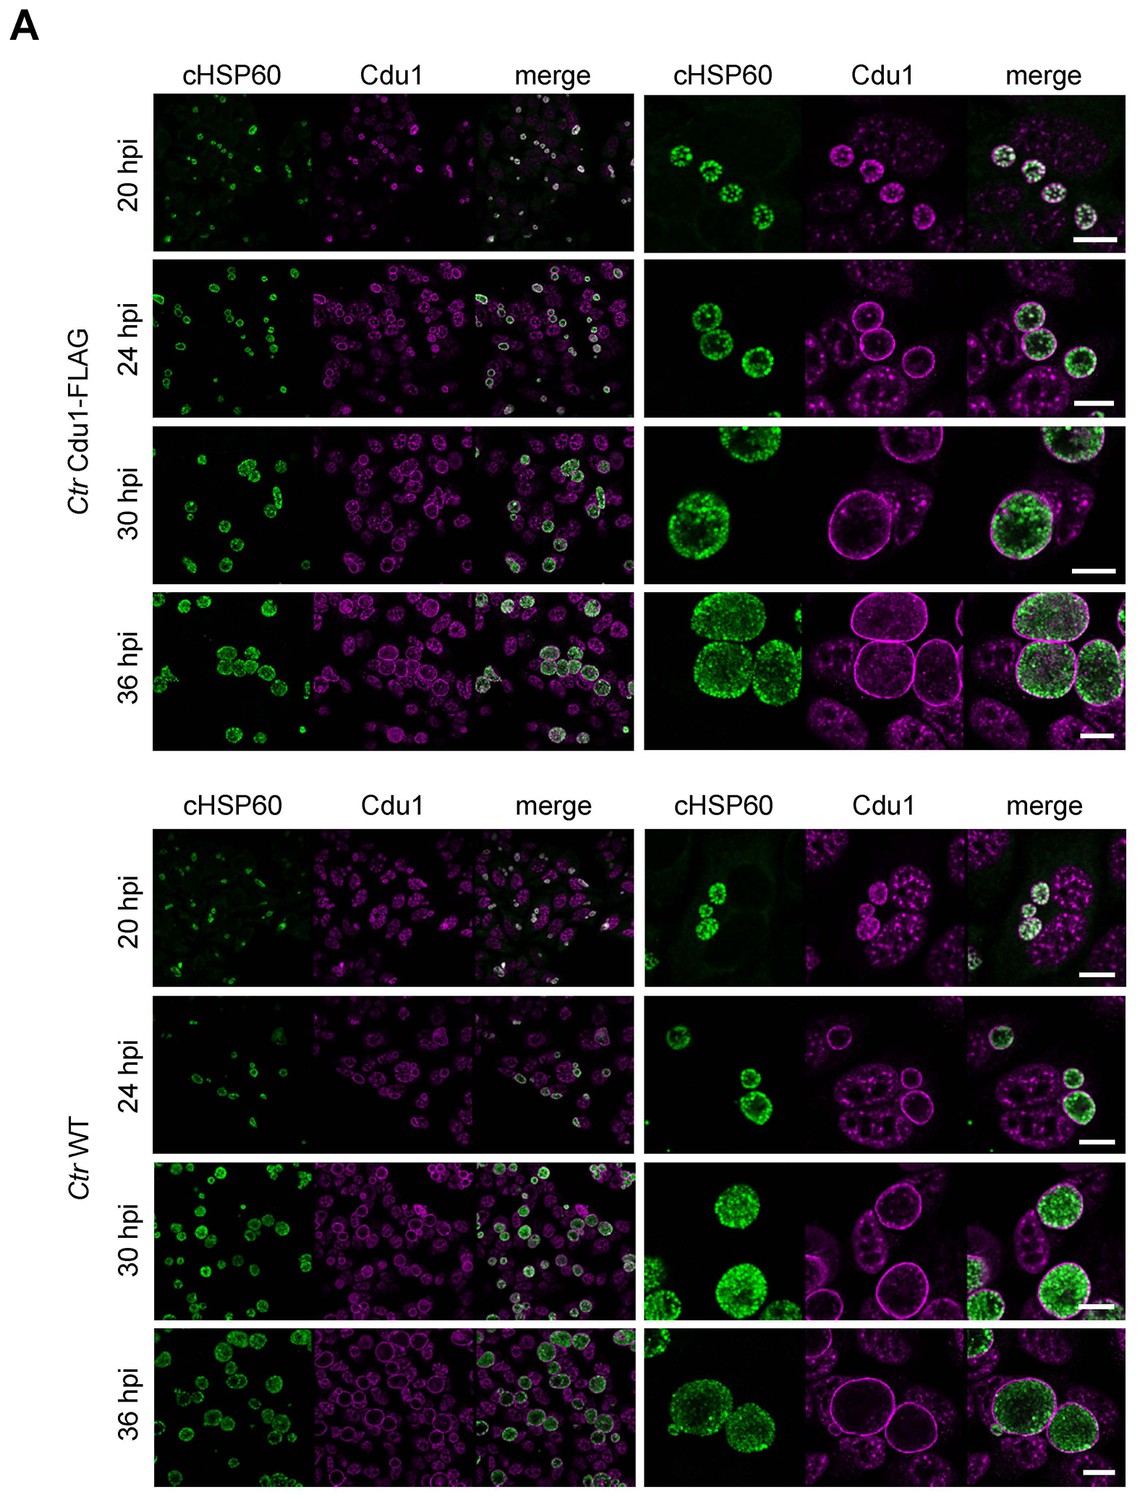
Cdu1 secretion in C. trachomatis Cdu1-FLAG.
(A) Immunofluorescences staining for Cdu1 secretion in HeLa cells infected with C. trachomatis (Ctr) Cdu1-FLAG or Ctr wild-type for the indicated time points. Staining was performed against cHSP60 (green channel) and Cdu1 (magenta channel). Depicted are representative overview and zoom-in pictures. Scale bar, 10 µm.
Figure 4 with 1 supplement
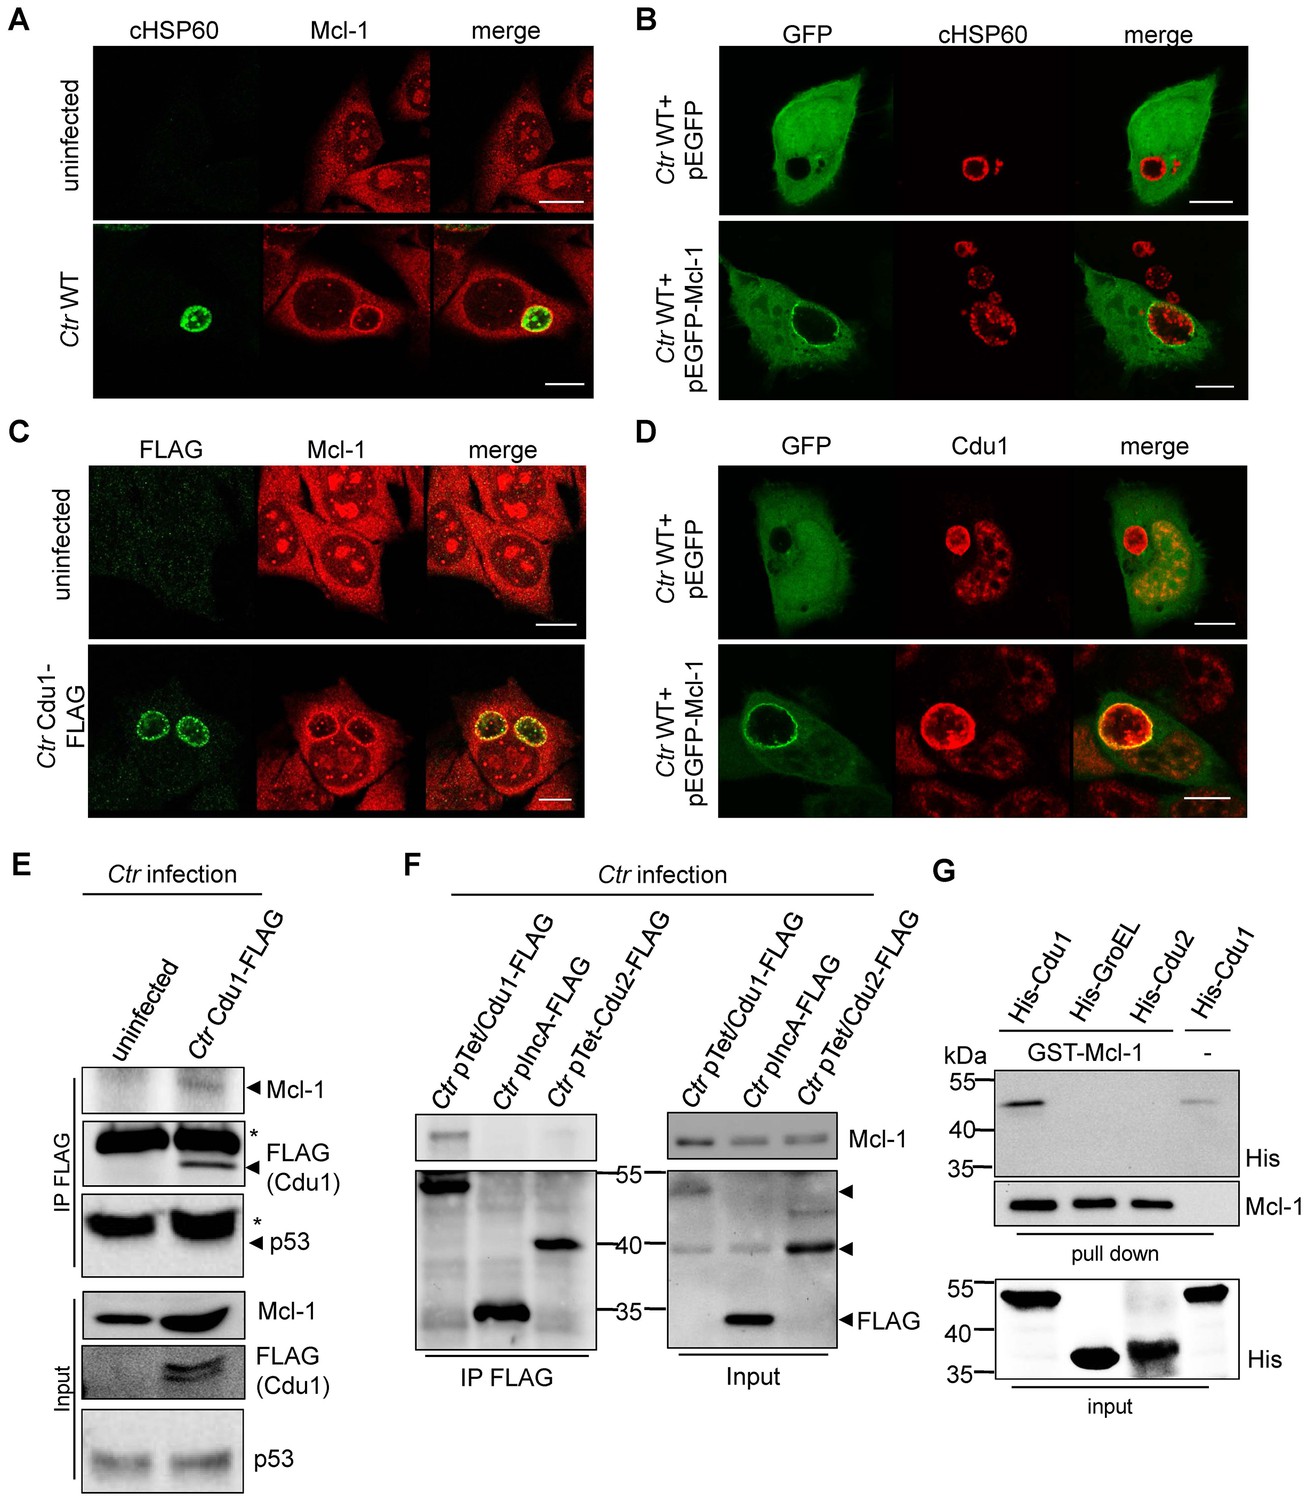
Cdu1 and Mcl-1 interact with each other.
(A) Immunofluorescence staining of cellular Mcl-1 in uninfected and C. trachomatis (Ctr)-infected HeLa cells. Cells were stained with antibodies against chlamydial HSP60 (green channel) and Mcl-1 (red channel). Scale bars, 10 µm. (B) HeLa cells expressing EGFP or the EGFP-Mcl-1 fusion protein were infected with Ctr wild-type (WT) and fixed with 4% PFA/Sucrose 24 hpi. Chlamydial particles were stained with a cHSP60 antibody (red channel). Association of EGFP-Mcl-1 but not of EGFP with the chlamydial inclusion was visualized by confocal microscopy. Scale bar represents 10 µm. (C) HeLa cells were infected with Ctr WT or Ctr Cdu1-FLAG for 24 hr. Subcellular localization of Cdu1-FLAG (green channel) and Mcl-1 (red channel) was visualized. Bars represent 10 µm. (D) HeLa cells expressing EGFP or EGFP-Mcl-1 were infected with Ctr WT and fixed 24 hpi with 4% PFA/Sucrose. Cdu1 was marked by indirect immunofluorescence staining (red channel) and co-localization of EGFP or Mcl-1-EGFP (green channel) with Cdu1 was analyzed by confocal microscopy. Scale bar 10 µM. (E) Cdu1-FLAG was immunoprecipitated out of Ctr Cdu1-FLAG-infected HeLa and uninfected control cells using FLAG-tag directed antibodies. Co-precipitation of Mcl-1 and Cdu1-FLAG was shown by immunoblot. Probing with p53 antibody serves as specificity control. The asterisk marks the signal from the heavy chain of the IgG antibody. (F) Immunoprecipitation of Cdu1-FLAG out of HeLa cells infected with Ctr pTet/Cdu1-FLAG, Ctr pIncA-FLAG or Ctr pTet/Cdu2-FLAG. Co-precipitation of Mcl-1 and Cdu1-FLAG was visualized by immunoblot. (G) In vitro binding assay of recombinant purified GST-Mcl-1 and His-Cdu1. GST-Mcl-1 was bound to glutathione-sepharose beads and incubated with equal amounts of His-Cdu1 or control proteins His-Cdu2 and truncated His-GroEL. After washing, the interaction of the proteins was analyzed by immunoblot with antibodies detecting the His-tag or Mcl-1.
Figure 4—figure supplement 1
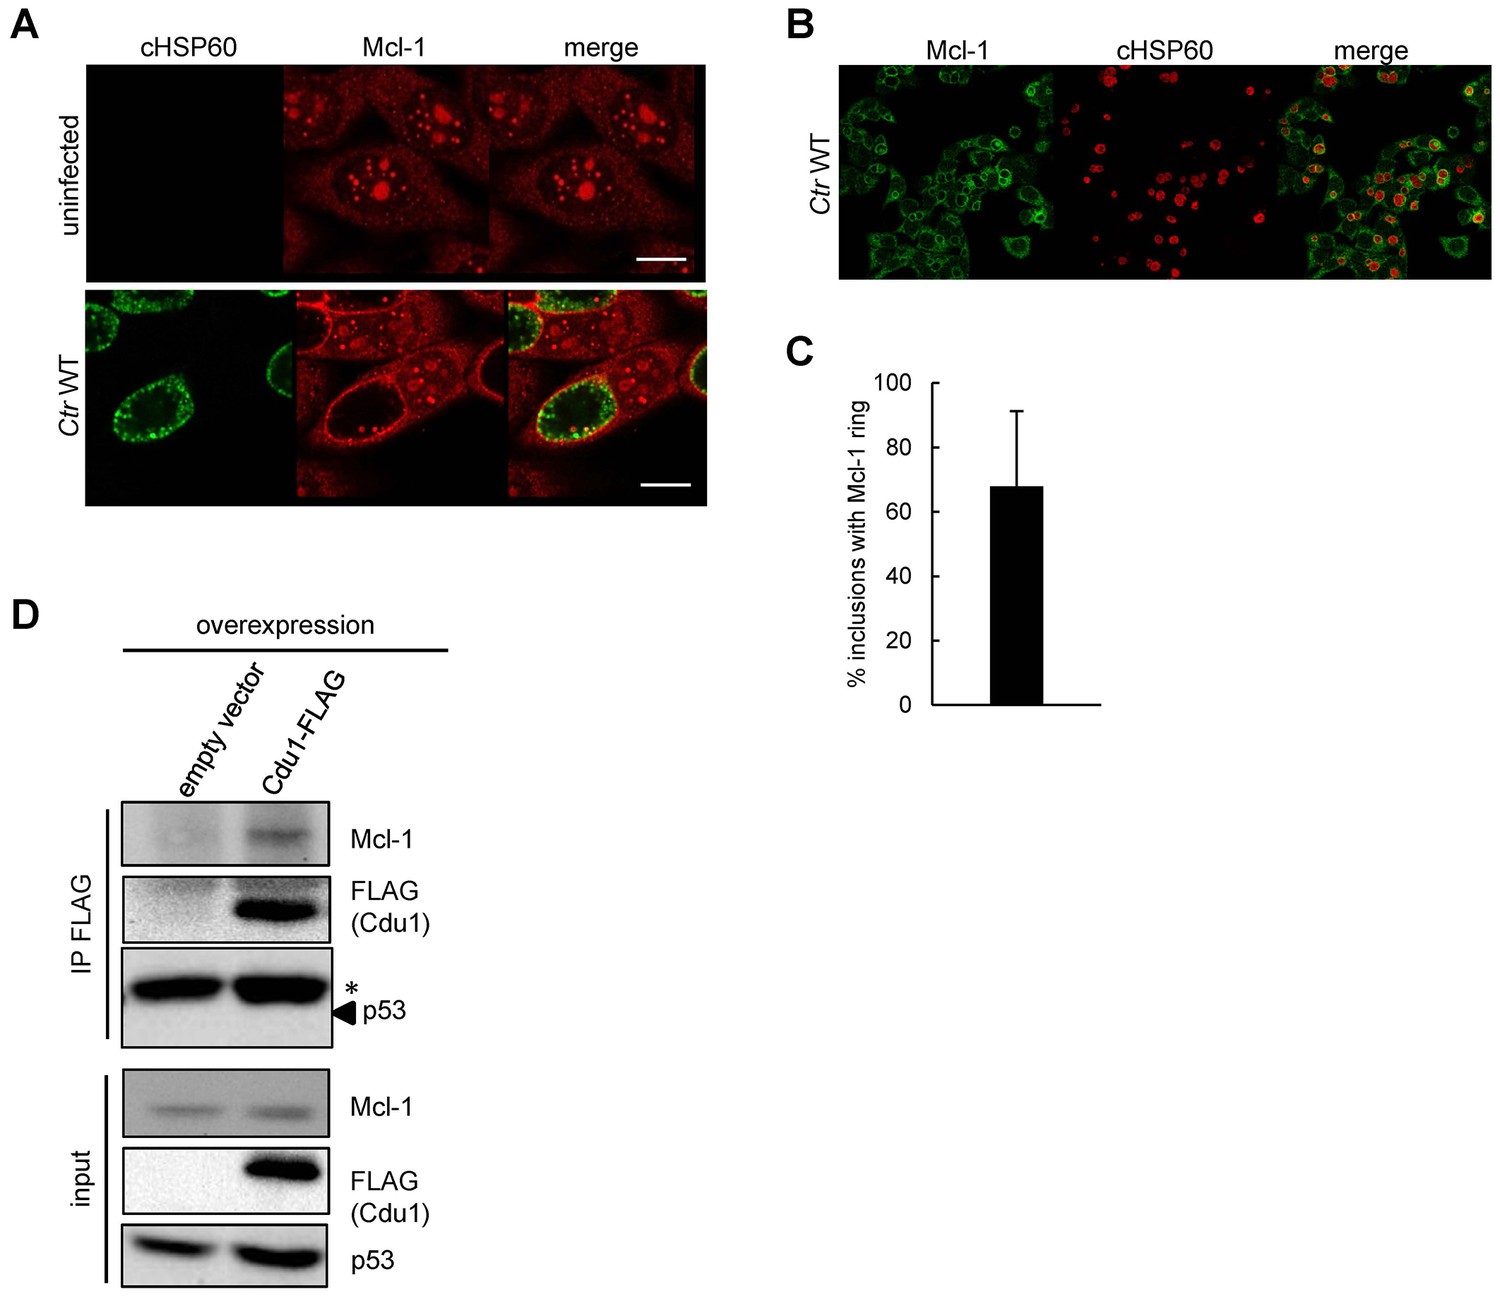
Cellular Mcl-1 interacts with Cdu1.
(A) HEp-2 cells were infected with C. trachomatis wild-type (WT) for 24 hr and fixed with 4% PFA/Sucrose. Indirect immunofluorescence staining against chlamydial HSP60 (green channel) and Mcl-1 (red channel) was performed and analyzed by confocal microscopy. Scale bar represents 10 µm. (B+C) Association of Mcl-1 with the chlamydial inclusion at 24 hpi was analyzed by immunostaining and confocal microscopy. Representative pictures of HeLa cells infected with Ctr WT and fixed 24 hpi. Immunostaining was performed against Mcl-1 (green channel) and cHSP60 (red channel) (B). Quantification of Mcl-1-decorated Ctr WT inclusions calculated from three individual experiments ± SD (C). (D) Co-precipitation of Cdu1 and Mcl-1 in non-infected cells. Cdu1-FLAG was expressed in non-infected HEK-293T cells and precipitated by its FLAG-tag. Co-precipitated endogenous Mcl-1 was visualized by immunoblot. Immunoblot against p53 serves as control. The asterisk marks the signal from the heavy chain of the IgG antibody.
Figure 5 with 1 supplement
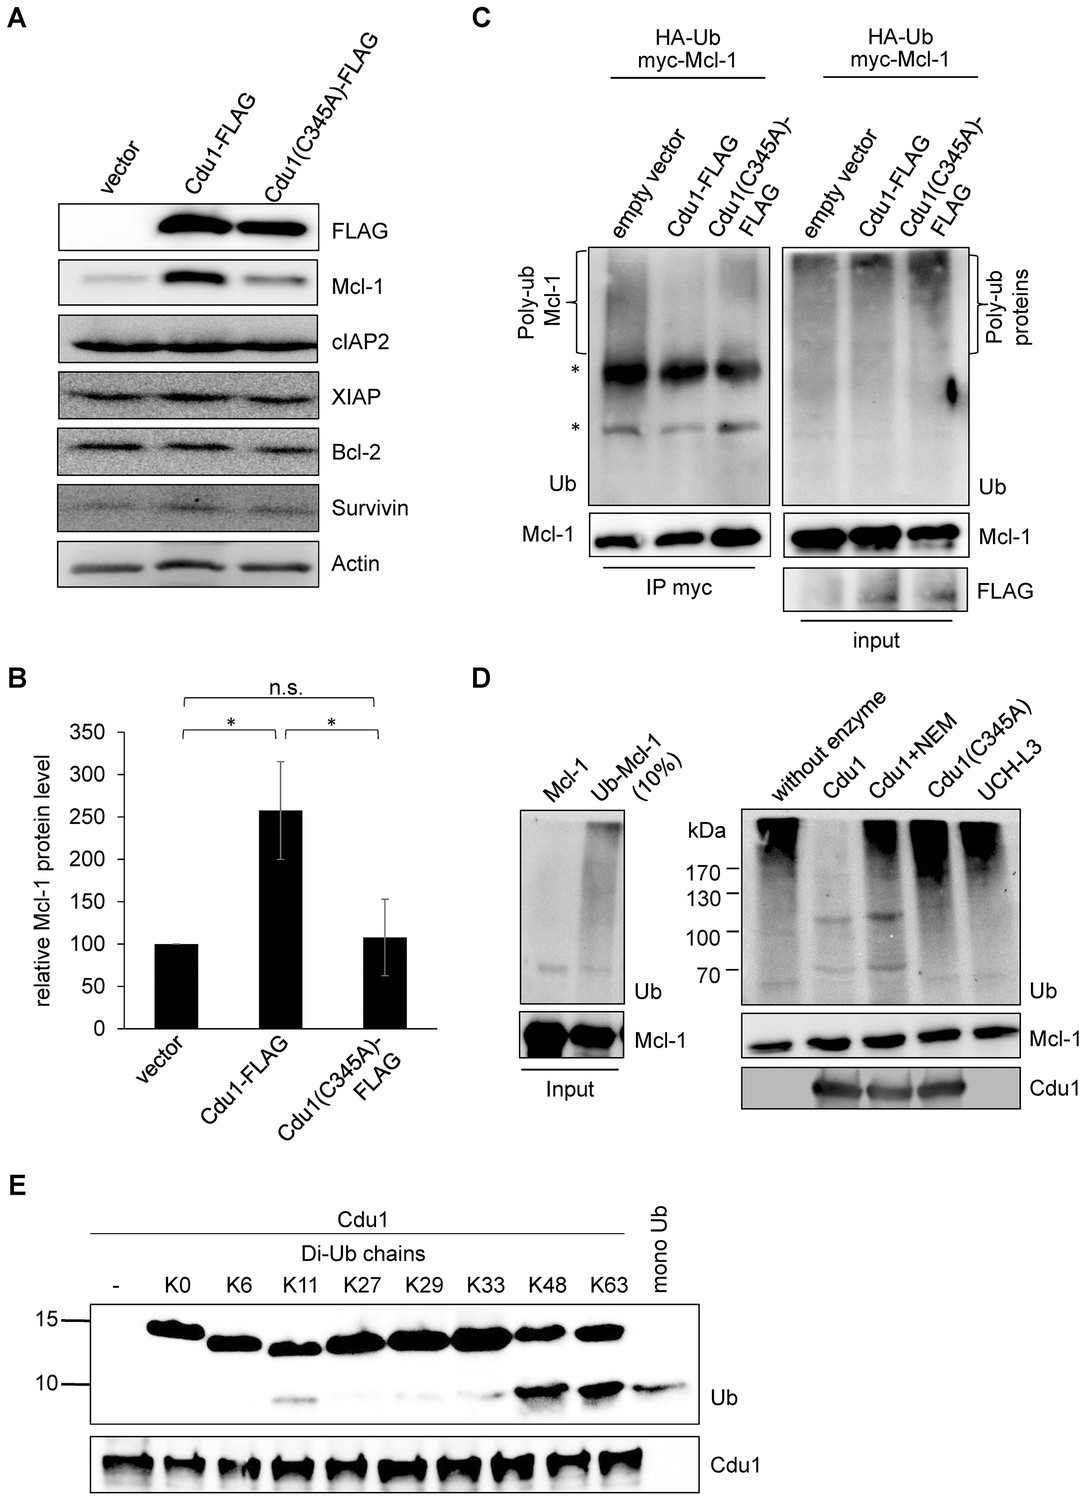
Cdu1 deubiquitinates Mcl-1 in vivo and in vitro.
(A) HEK-293T cells were transfected with Cdu1-FLAG, Cdu1(C345A)-FLAG or pcDNA3 empty vector for 24 hr. Cells were lysed in SDS-sample buffer and protein expression as well as the effect on Mcl-1 or other anti-apoptotic proteins was analyzed by immunoblot. (B) Relative amount of Mcl-1 in HEK-293T cells expressing Cdu1, Cdu1(C345A) mutant or empty vector 24 hr after transfection calculated from experiment (A). Normalization was performed against an actin loading control. The graph shows mean values from three individual experiments ± SD. The significance was calculated with the student’s T-test *p<0.05. (C) HEK-293T cells were transfected with HA-ubiquitin, myc-Mcl-1 and either empty vector control, Cdu1-FLAG or Cdu1(C345A)-FLAG for 24 hr. Transfected cells were treated with 10 µM MG132 over night to block proteasome activity and to enrich ubiquitinated proteins. Cells were lysed under denaturing conditions and Mcl-1 was immunoprecipitated by its myc-tag under stringent conditions. Ubiquitination status of all cellular proteins (input) and precipitated Mcl-1 was visualized by immunoblot using an anti-ubiquitin antibody. (D) Purified recombinant Mcl-1 was ubiquitinated in vitro (left panel). Poly-ubiquitinated Mcl-1 served as a substrate in an in vitro DUB-assay for the purified recombinant enzymes Cdu1, inactive Cdu1 or an unrelated control deubiquitinase UCH-L3. The ubiquitination status of Mcl-1 was analyzed by immunoblot using an anti-ubiquitin antibody. (E) Ubiquitin chain specificity of Cdu1. 0.5 µg di-ubiquitin chains were incubated with 20 nM Cdu1 for 2 hr at 37°C, and chain cleavage was analyzed by immunoblot using an anti-ubiquitin antibody. See also Figure 5—source data 1.
-
Figure 5—source data 1
Raw data for quantitative analysis of Mcl-1 stabilization in Cdu1-expressing HEK 293T cells shown in Figure 5.
- https://doi.org/10.7554/eLife.21465.019
Figure 5—figure supplement 1
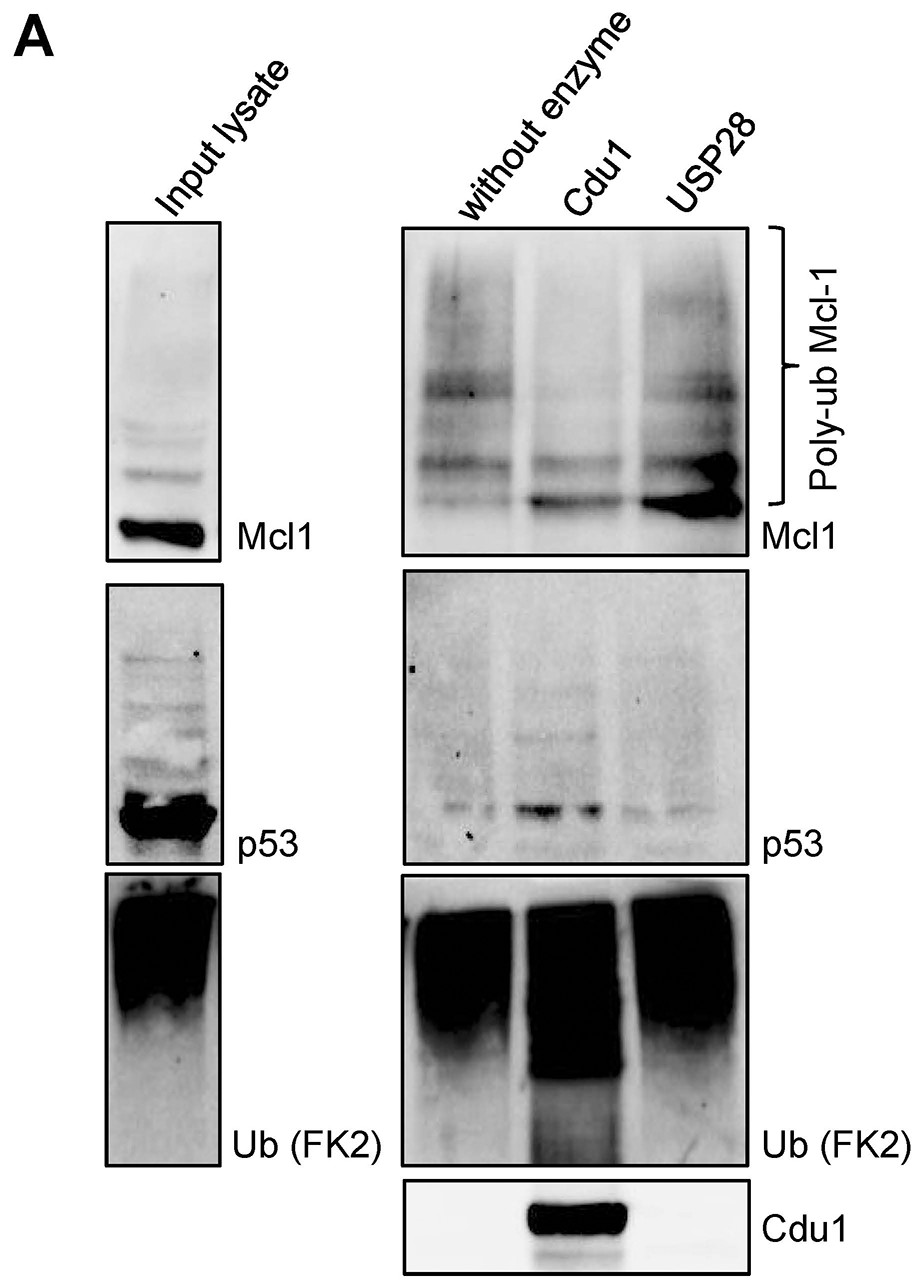
Cdu1 deubiquitinates Mcl-1 in vitro.
(A) HeLa cells were incubated with 20 µM MG132 for 4 hr, lysed and ubiquitinated proteins were precipitated by TUBE pull down. Eluted proteins were incubated with 20 nM Cdu1 or 50 nM USP28 and deubiquitination of Mcl-1 was analyzed by immunoblot. Probing with anti-p53 antibody serves as control.
Figure 6 with 2 supplements

The Cdu1 truncated mutant affects Mcl-1 stabilization.
(A) Scheme of the Cdu1 protein in wild-type (WT) Chlamydia and the transposon mutant (Tn-cdu1) lacking the catalytically active cysteine 345. (B) Immunoblot analysis of HeLa cells infected for 24 hr with WT or Tn-cdu1 mutant C. trachomatis (Ctr) with the indicated antibodies. Decoration with cHSP60 and Actin serves as infection and loading control. (C) HeLa cells were infected with Ctr WT and Tn-cdu1 mutant and fixed 24 hpi with 4% PFA/Sucrose. Indirect immunofluorescence staining for cHSP60 (green channel) and Cdu1 (red channel) was performed. The Cdu1 antibody shows unspecific staining of nuclear structures. Scale bar 10 µm. (D) Relative amount of Mcl-1 in HeLa cells infected with Ctr WT and Tn-cdu1 mutant for 24 or 30 hr. Normalization was performed against an Actin loading control. The graph shows mean values from three individual experiments ± SD. The significance was calculated with the student’s T-test *p<0.05, **p<0.01. (E) Indirect immunofluorescence staining for Mcl-1 (red channel) of HeLa cells infected with Ctr WT or the Tn-cdu1 mutant for 24 hr. Chlamydial particles were marked with cHSP60 antibody (green channel). Scale bar represents 10 µm. (F+G) Analysis of inclusion-associated Mcl-1 in HeLa cells infected with Ctr WT or Tn-cdu1. Infected HeLa cells were fixed 24 hpi and immunostaining against Mcl-1 and cHSP60 was performed. Relative number of Mcl-1-decorated inclusions of WT or Tn-cdu1 Chlamydia were calculated. The graph shows mean values from three individual experiments ± SD. The significance was calculated with the student’s T-test ***p<0.001. The source data for number of Mcl-1 decorated Ctr WT inclusions matches with source data from Figure 4—figure supplement 1C (F). Quantification of inclusion-associated Mcl-1 in Ctr WT or Tn-cdu1-infected cells. The graph shows mean values from three individual experiments ± SD. The significance was calculated with the Kolmogorov-Smirnov test; **p<0.01 (G). See also Figure 6—source data 1.
-
Figure 6—source data 1
Raw data for quantitative analysis of Mcl-1 stabilization, Mcl-1-ringed inclusion count and calculation of Mcl-1 ring intensity of HeLa cells infected with C. trachomatis wild type and Tn-cdu1 shown in Figure 6.
- https://doi.org/10.7554/eLife.21465.022
Figure 6—figure supplement 1
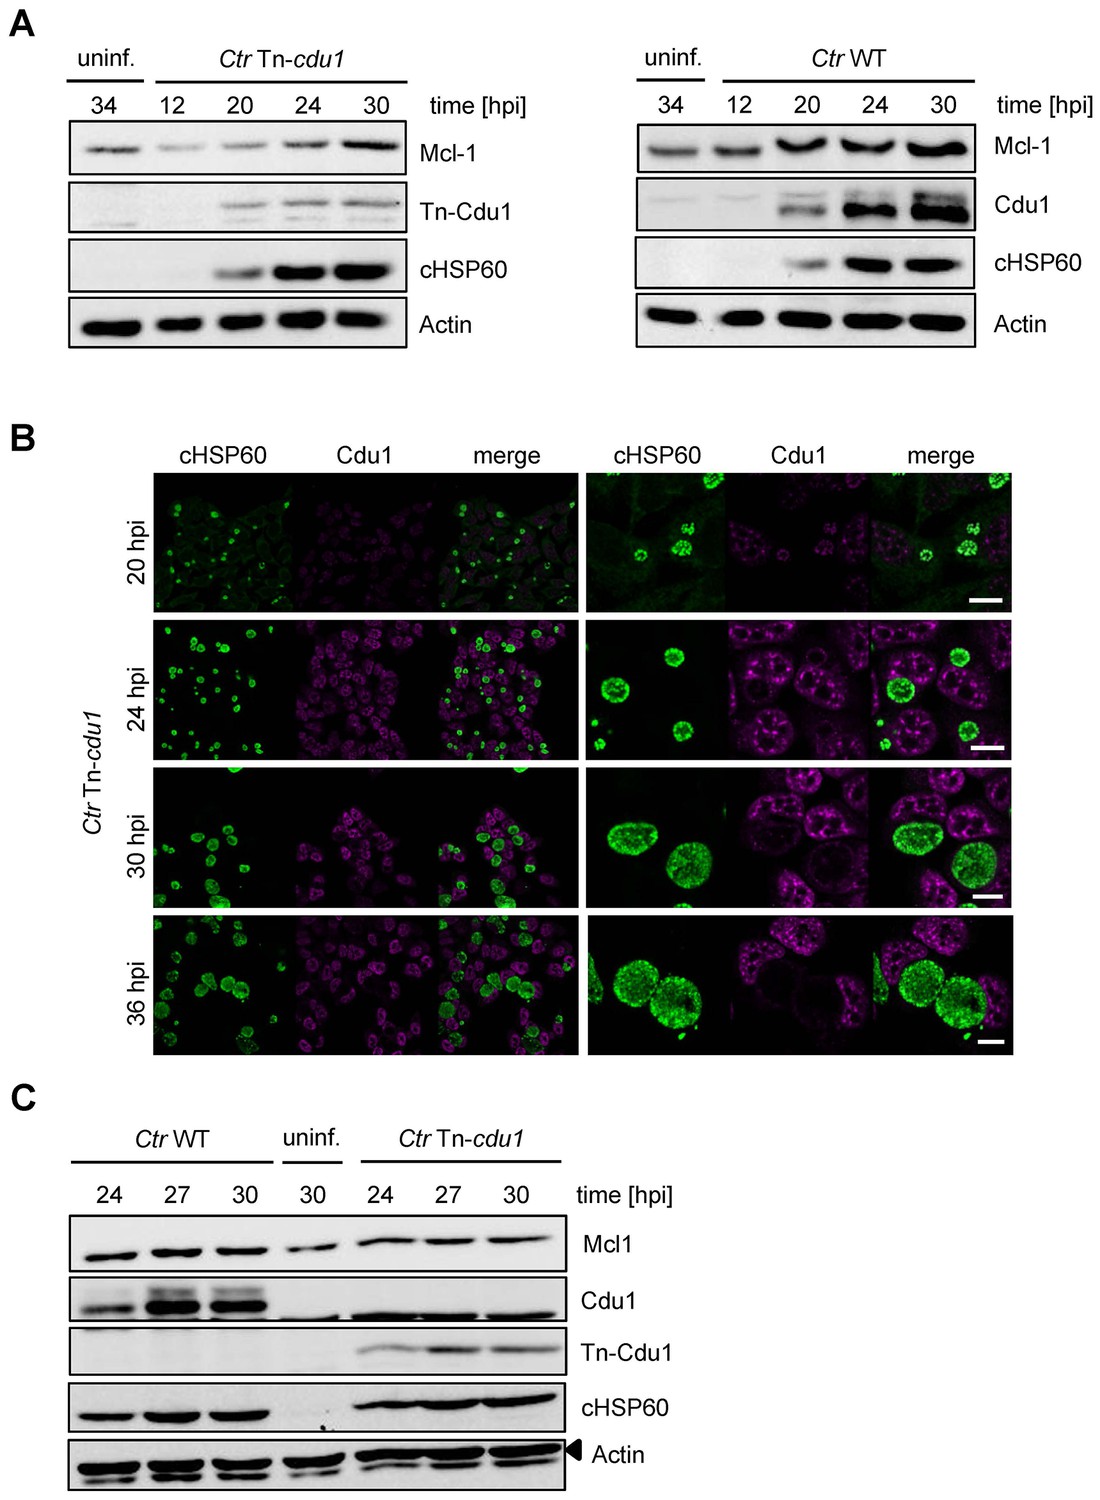
Characterization of C. trachomatis Tn-cdu1 mutant.
(A) Time course experiment of HeLa cells infected with C. trachomatis (Ctr) wild-type (WT) or Tn-cdu1. Expression of Cdu1 or Tn-Cdu1 as well as Mcl-1 stabilization during the infection cycle was analyzed by immunoblot. Actin and cHSP60 serve as loading controls. (B) Immunofluorescence analysis of Tn-Cdu1 expression and secretion in a time course experiment. Staining was performed against Cdu1 (magenta channel) and chlamydial HSP60 (green channel). Depicted are representative overview and zoom-in pictures. Scale bar 10 µm. (C) Representative immunoblot of quantification of Mcl-1 stabilization in HeLa cells infected with Ctr WT and Tn-cdu1 for 24, 27 and 30 hr depicted in Figure 6D. HeLa cells were lysed at the indicated time points and Mcl-1 level as well as Cdu1 expression were analyzed by immunoblot. Actin and cHSP60 serve as cellular and bacterial loading controls, respectively.
Figure 6—figure supplement 2
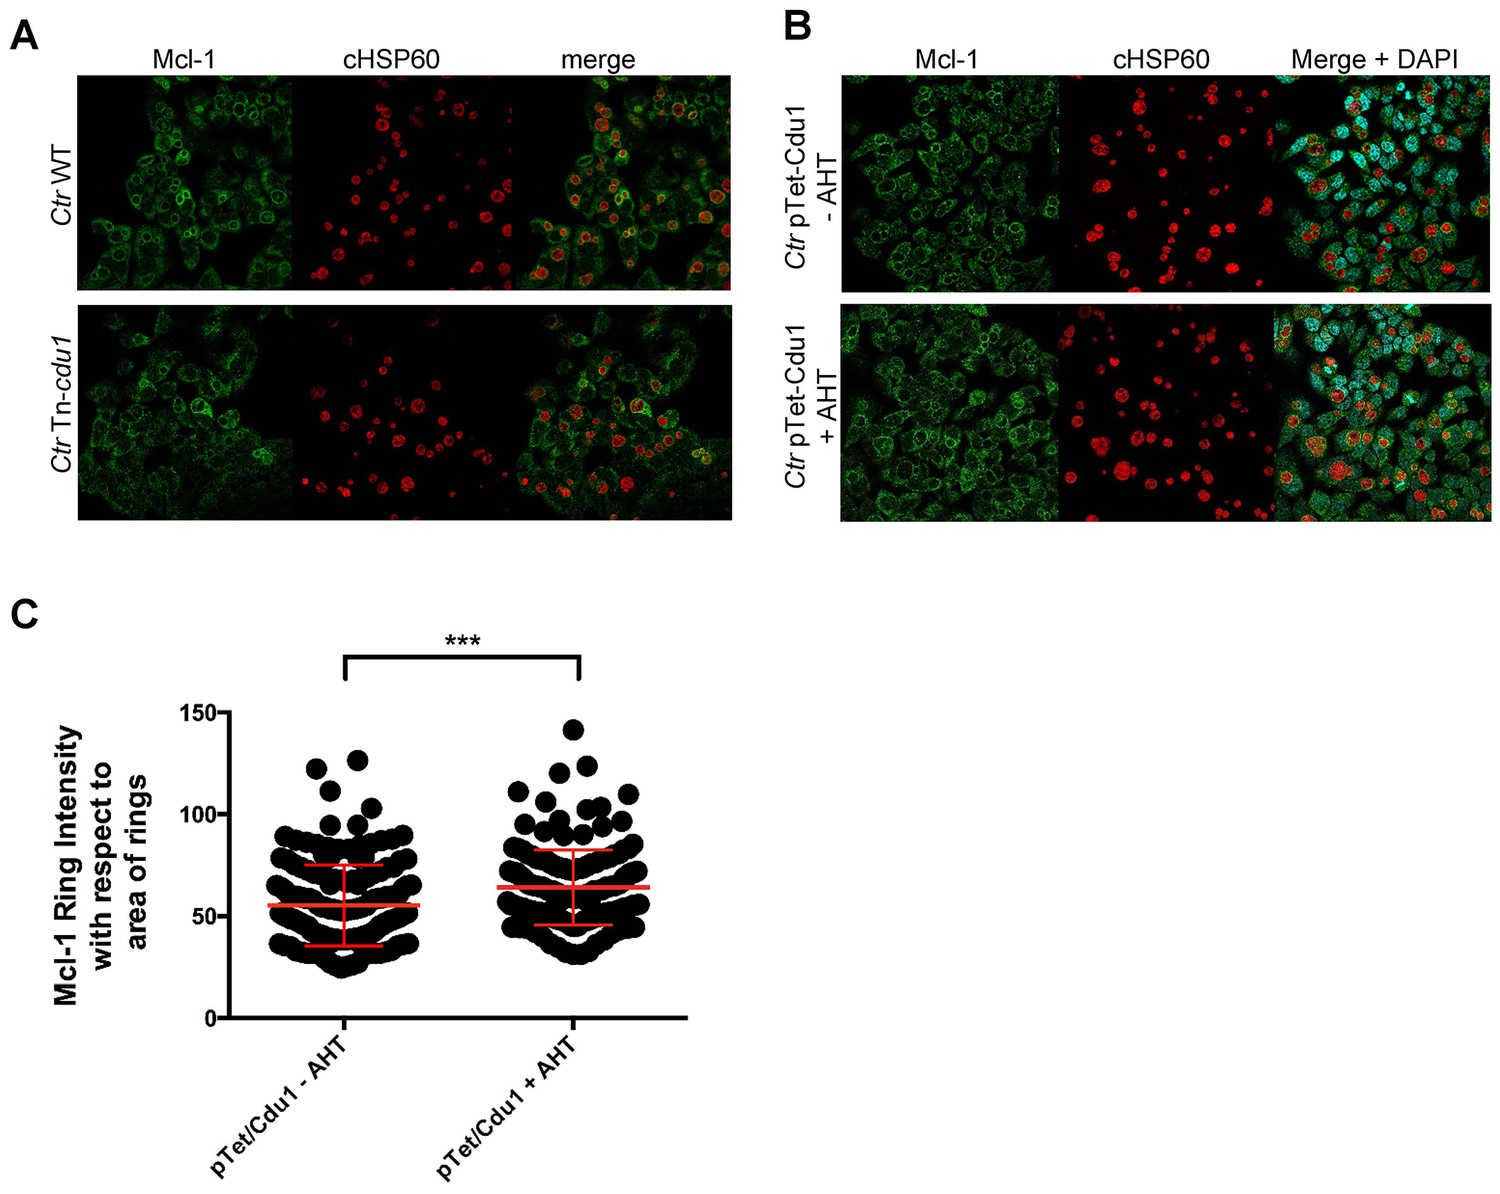
Mcl-1 association with the chlamydial inclusion.
(A) Representative immunofluorescence picture of Mcl-1 recruitment to the inclusion of C. trachomatis (Ctr) wild-type (WT) or Tn-cdu1 analyzed in Figure 6F–G. HeLa cells were infected with Ctr WT or Tn-cdu1 for 24 hr and fixed with 4% PFA/Sucrose. Immunostaining against Mcl-1 (green channel) and cHSP60 (red channel) was performed and analyzed by confocal microscopy. (B) HeLa cells were infected with Ctr pTet/Cdu1-FLAG (MOI 1) and induced with 10 ng/ml AHT for Cdu1 overexpression 12 hpi. Cells were fixed with 4% PFA/Sucrose at 24 hpi and indirect immunofluorescence staining against Mcl-1 (green channel) and chlamydial HSP60 (red channel) was performed and analyzed by confocal microscopy. (C) Quantification of Mcl-1 associated with the chlamydial inclusion upon Cdu1 overexpression. Representative picture is shown in (B). Depicted are mean values calculated from two individual experiments ± SD. Significance was calculated with Kolmogorov-Smirnov test; ***p<0.001. See also Figure 6—figure supplement 2—source data 1.
-
Figure 6—figure supplement 2—source data 1
Raw data for quantitative analysis of Mcl-1 ring intensity around C. trachomatis pTet/Cdu1 inclusions uninduced and induced for Cdu1 overexpression shown in Figure 6—figure supplement 2.
- https://doi.org/10.7554/eLife.21465.025
Figure 7 with 3 supplements
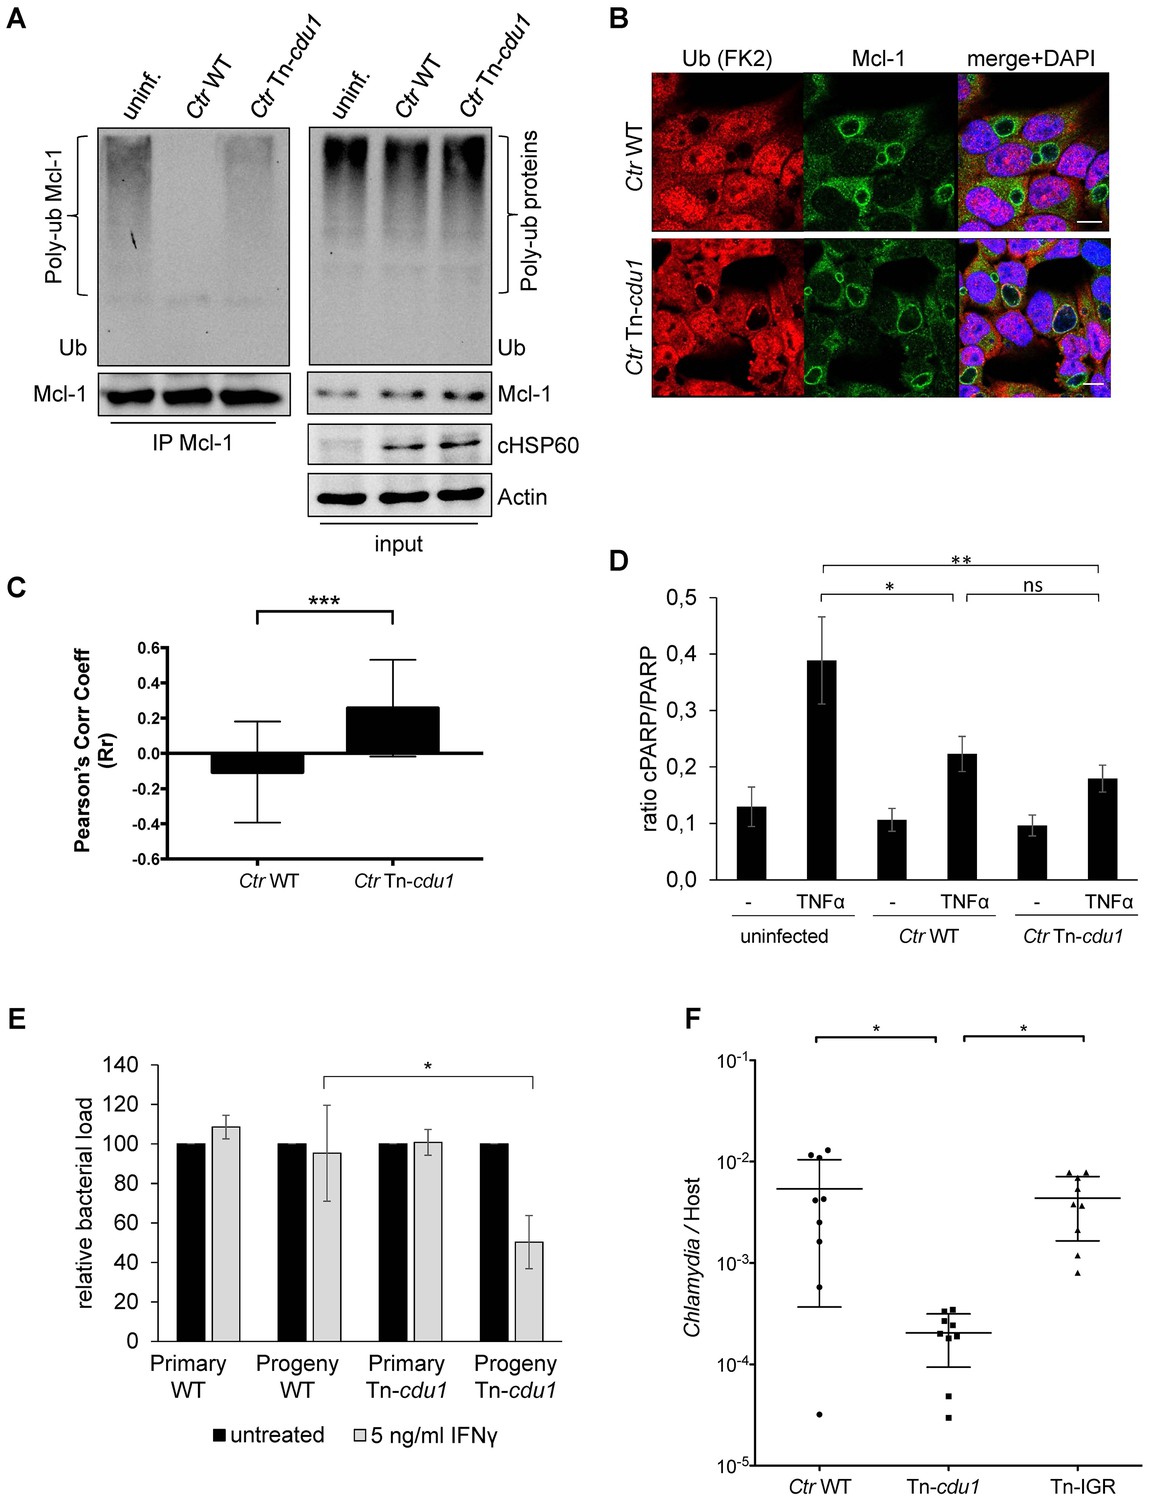
Disruption of cdu1 affects Mcl-1 ubiquitination and survival of Chlamydia.
(A) HeLa cells were infected with C. trachomatis (Ctr) wild-type (WT) or Tn-cdu1 and the proteasome inhibitor MG-132 was added 8 hpi. Cells were lysed under denaturing conditions 24 hpi and Mcl-1 was precipitated. Precipitated Mcl-1 (left panel) as well as the whole proteome (right panel) were analyzed for their ubiquitination pattern by immunoblot using an anti-ubiquitin antibody. (B) HeLa cells were infected with Ctr WT or the Tn-cdu1 mutant for 24 hr and fixed with 4% PFA/Sucrose. Indirect immunofluorescence staining against ubiquitin (FK2, red channel) and Mcl-1 (green channel) was performed. DAPI staining (blue channel) marks the host cell nucleus and chlamydial DNA. (C) Quantification of ubiquitin co-localization with Mcl-1 by comparison of Pearson’s co-localization coefficient using the COLOC2 plugin from FIJI. 10 ROI were randomly selected from five individual experiments. The significance was calculated with the Student’s T-test ***p<0.001. (D) HeLa cells were infected with Ctr WT or Tn-cdu1. Apoptosis was induced 20 hpi with 50 ng/ml TNFα and 5 µg/ml CHX. Apoptosis induction was analyzed by PARP cleavage in an immunoblot. Depicted are mean values from the ratio of cleaved PARP/PARP calculated from four individual experiments ± SD. The significance was calculated with the student’s T-test *p<0.05, **p<0.01. (E) Infectivity assay of Ctr WT and Tn-cdu1 in primary Fimb cells. Infected cells were challenged with 5 ng/ml IFNγ upon 8 hpi. Depicted are mean values of the bacterial load calculated from three individual experiments ± SD. The significance was calculated with the student’s T-test *p<0.05. (F) Female C57BL/6 mice (n = 9) were infected transcervically with either Ctr WT, Tn-cdu1 or Tn control Tn-IGR. Five days post-infection, genital tracts were harvested, homogenized and DNA isolated. DNA from uterine horns was subjected to ddPCR to determine detectable Chlamydia copies/µL. Samples are normalized to host DNA (copies/µL). WT and Tn-IGR-infected animals showed no significant difference while both WT vs Tn-cdu1 and Tn-IGR vs Tn-cdu1 showed a significant difference between detectable copies/µL (*p<0.01, Kruskall-Wallis test with Dunn’s multiple comparison post-test). See also Figure 7—source data 1.
-
Figure 7—source data 1
Raw data for quantitative analysis of apoptosis resistance analyzed by PARP cleavage and analysis of infectivity after IFNγ-treatment shown in Figure 7.
- https://doi.org/10.7554/eLife.21465.027
Figure 7—figure supplement 1
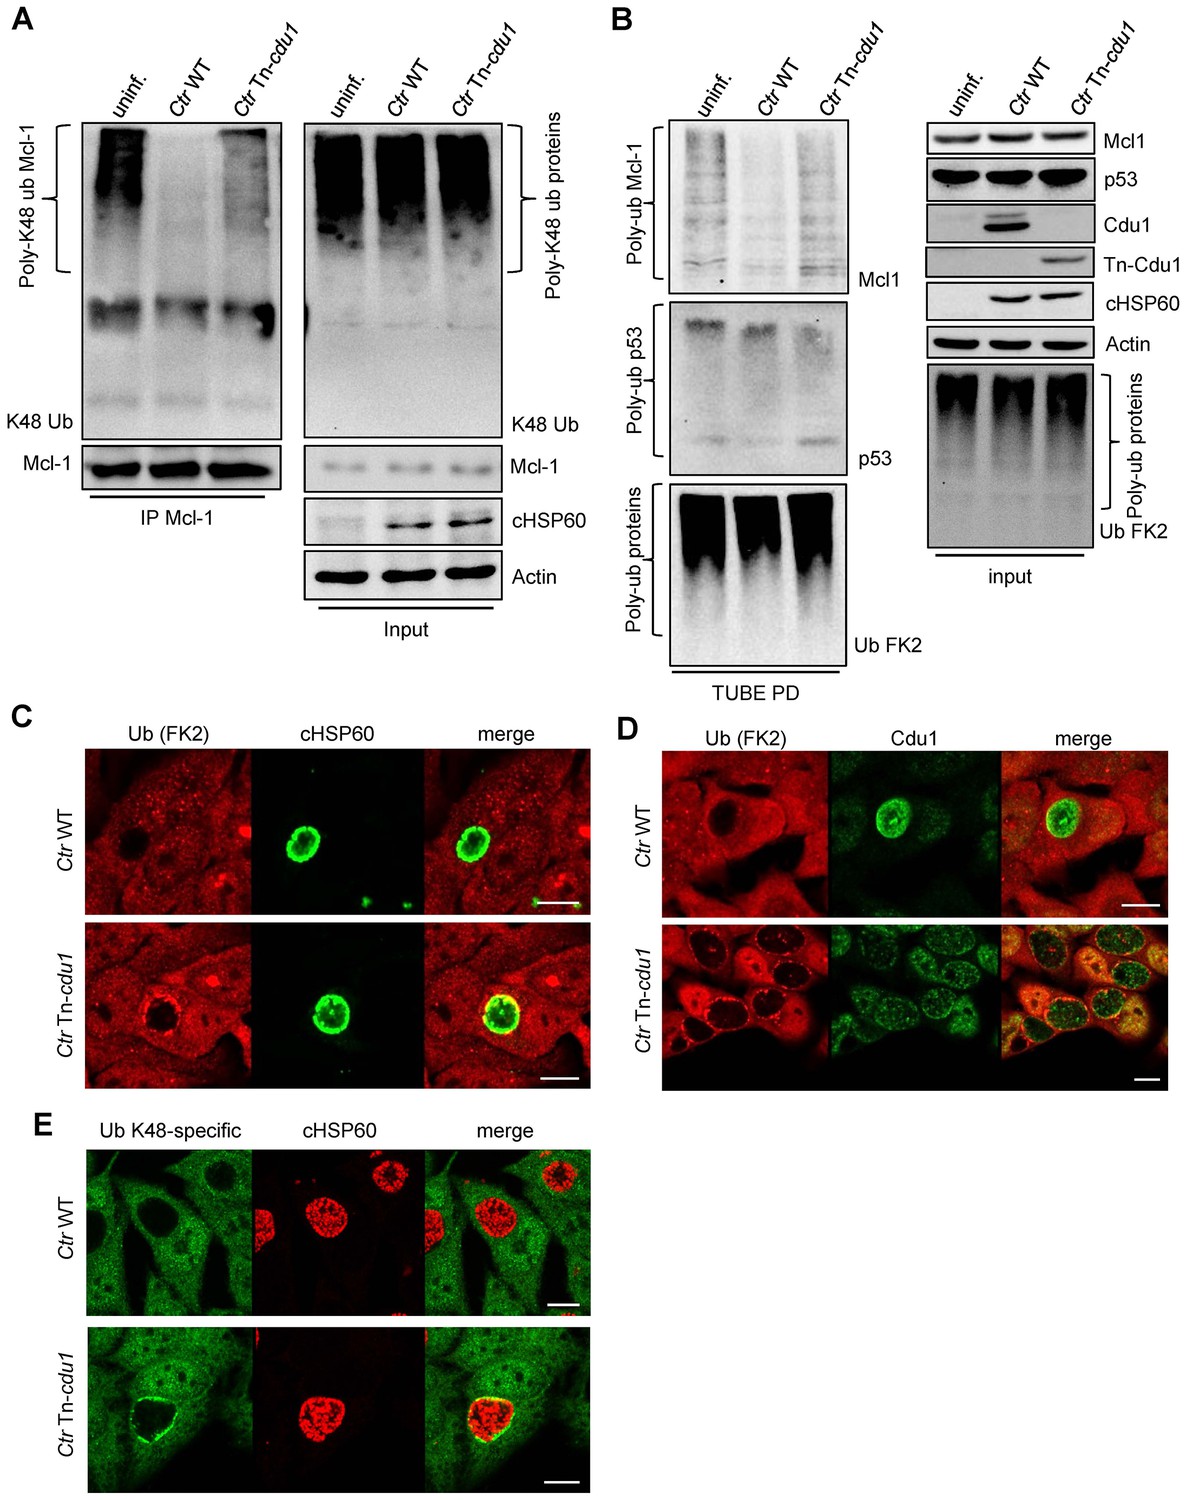
Ubiquitin is accumulated around the inclusion of Tn-cdu1 mutant Chlamydia.
(A) K48-ubiquitin immunoblot form experiment shown in Figure 7A. In detail, HeLa cells were infected with C. trachomatis (Ctr) wild-type (WT) or Tn-cdu1 and the proteasome inhibitor MG-132 was added 8 hpi. Cells were lysed under denaturing conditions 24 hpi and Mcl-1 was precipitated. Precipitated Mcl-1 (left panel) as well as the whole proteome (right panel) were analyzed for their K48-linked ubiquitination pattern by immunoblot using an anti-K48-linked ubiquitin antibody. (B) HeLa cells were infected with Ctr WT or Tn-cdu1 for 24 hr. Cells were treated with 20 µM MG132 to enrich ubiquitinated proteins upon 24 hpi and lysed 27 hpi. Ubiquitinated proteins were isolated by TUBE pull down and presence of Mcl-1 and p53 as a control were analyzed by immunoblot. (C–E) HeLa cells were infected with Ctr WT or the Tn-cdu1 mutant and fixed 24 hpi. Indirect immunofluorescence staining against ubiquitin (FK2, red channel) and chlamydial HSP60 (green channel) (C), ubiquitin (FK2, red channel) and Cdu1 (green channel) (D) or K48-linked ubiquitin (green channel) and chlamydial HSP60 (red channel) (E) was performed and analyzed by confocal microscopy. Scale bar 10 µm.
Figure 7—figure supplement 2
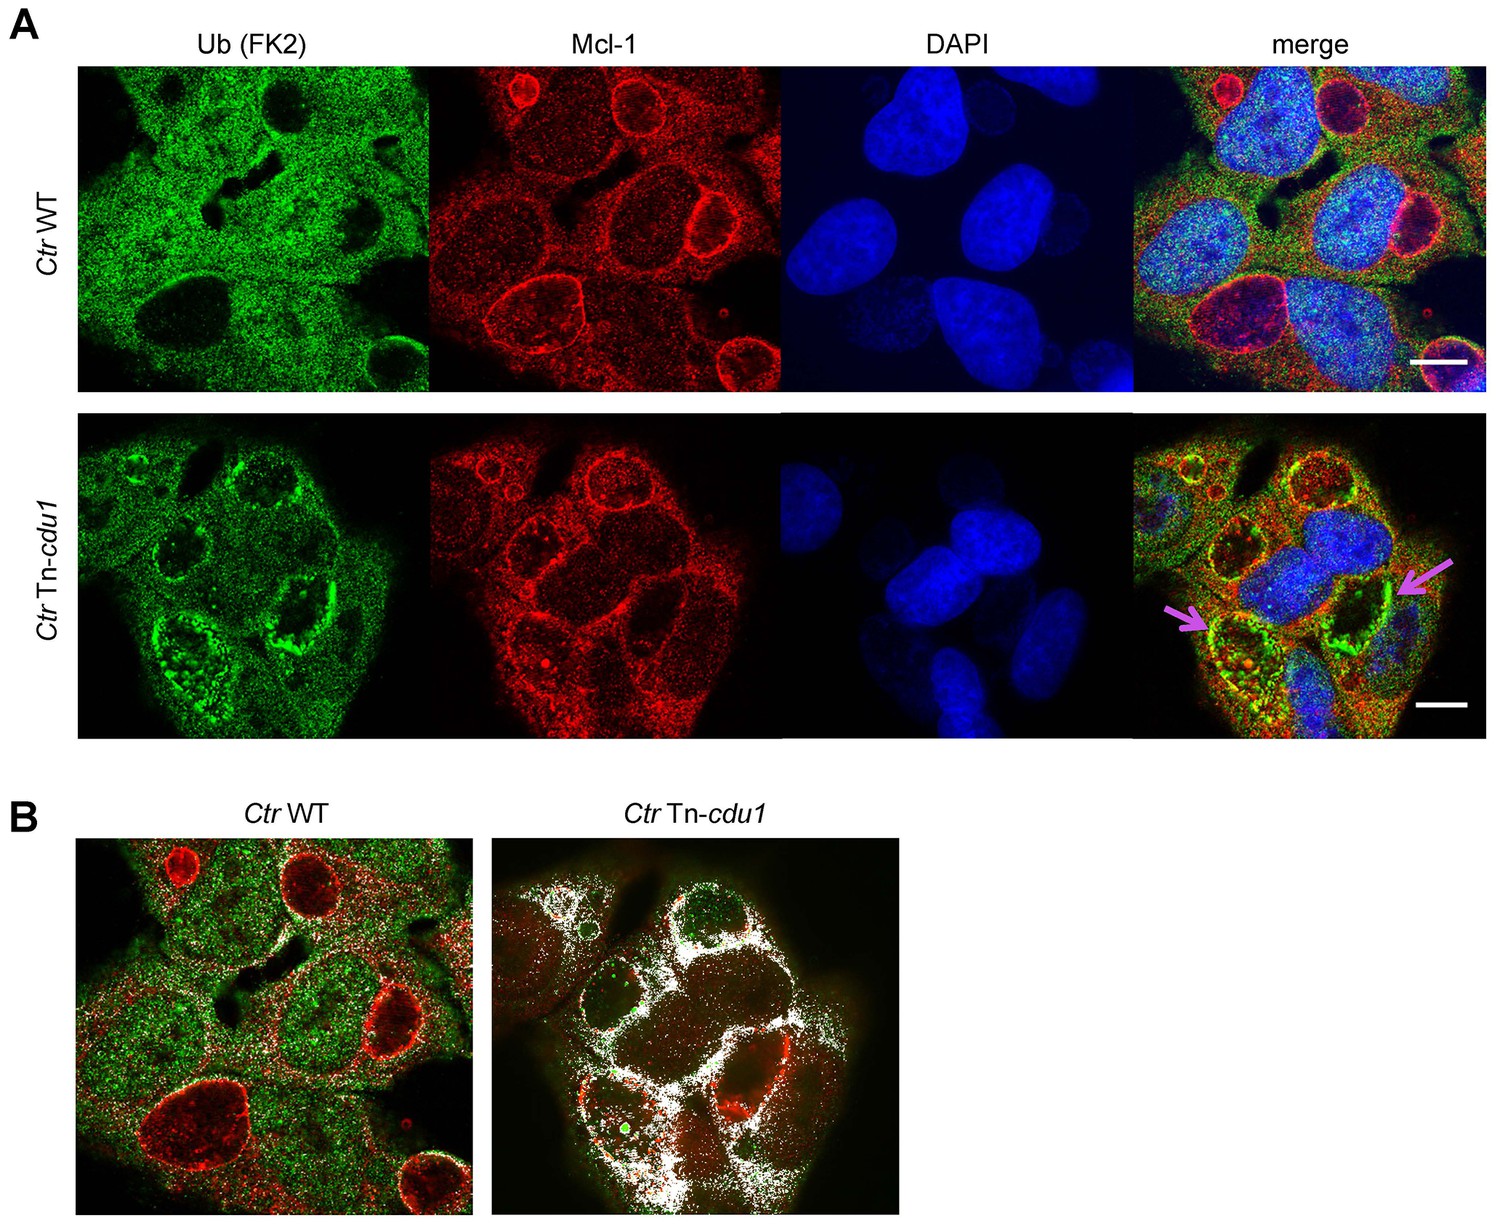
SIM analysis of Mcl-1 ubiquitin co-localization at the inclusion surface.
(A) Representative structured illumination micrographs of HeLa cells infected with Ctr WT or the Tn-cdu1 mutant for 24 hr. Cells were stained with ubiquitin (FK2, green channel) and Mcl-1 (red channel). The nuclei were stained with DAPI (blue). Cells infected with both WT and mutant Ctr exhibit localization of Mcl-1 to the inclusion while the cells infected with the Tn-cdu1 mutant Chlamydia exhibit strong co-localization of the ubiquitin signal to inclusion bound Mcl-1 (purple arrows). Scale bars represent 10 μm. (B) Co-localization masks for the ubiquitin and Mcl-1 signals in cells infected with wild-type and the Tn-cdu1 mutant Chlamydia generated by the COLOC2 plugin using FIJI. The images correspond to the quantification of ubiquitin co-localization with Mcl-1 in indicated samples.
Figure 7—figure supplement 3
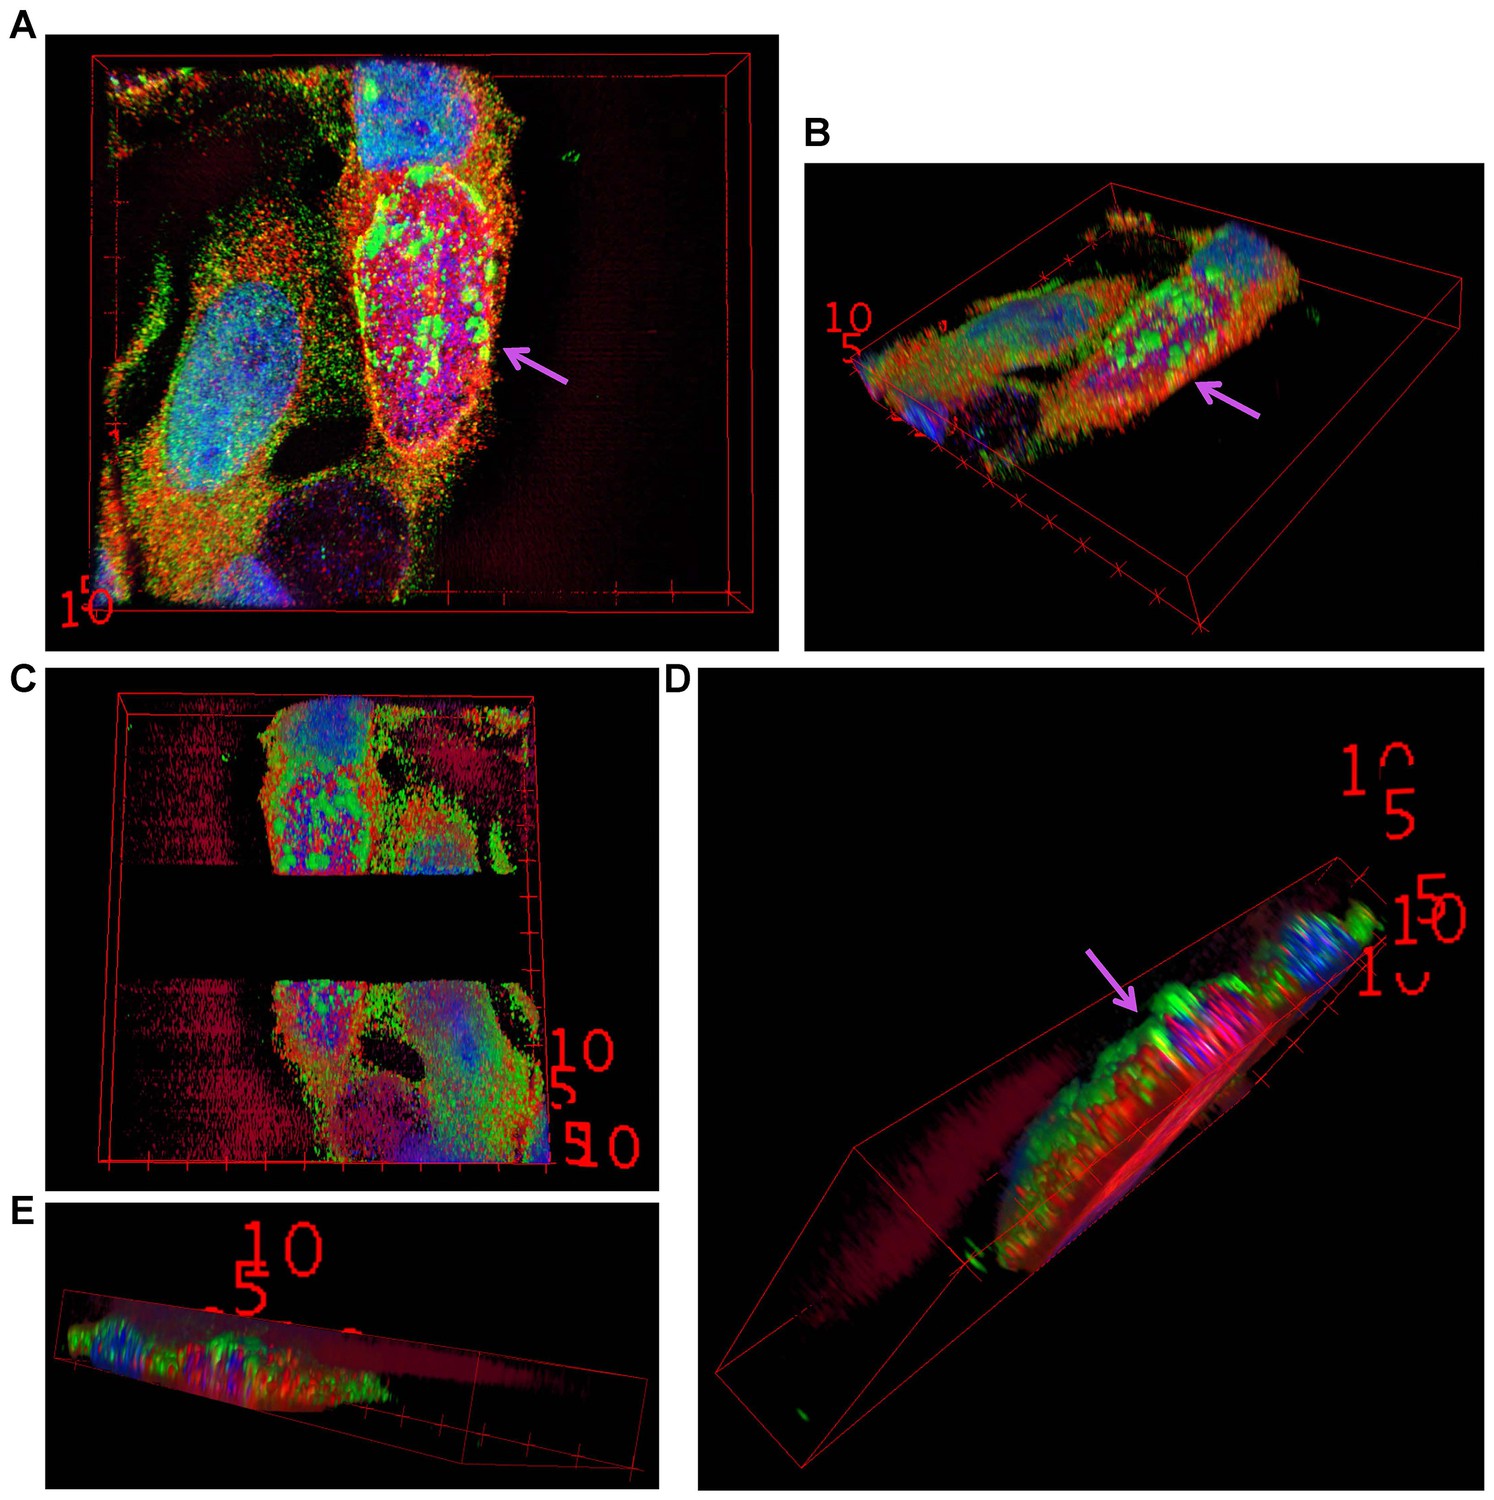
3D reconstruction of a Mcl-1/Ubiquitin co-staining.
(A+B) 3D projection of a HeLa cell infected with C. trachomatis Tn-cdu1. Staining was performed against Mcl-1 (red channel), ubiquitin (green channel) and DNA is stained with DAPI. (C–E) Blank stacks were inserted in-between to generate a lateral cross-section of the chlamydial inclusion. The ubiquitin signal (green) can be seen to co-localize with Mcl-1 (red) on the surface of the inclusion (purple arrows).
Videos
Video 1
3D reconstruction of a Mcl-1/Ubiquitin co-staining.
Diagonal rotation around Y of the 3D projection of a HeLa cell infected with C. trachomatis Tn-cdu1. Staining was performed against Mcl-1 (red channel), ubiquitin (green channel) and DNA is stained with DAPI. The ubiquitin signal (green) can be seen to co-localize with Mcl-1 (red) on the surface of the inclusion (purple arrows). Snapshots are depicted in Figure 7—figure supplement 2.
Video 2
3D reconstruction of a Mcl-1/Ubiquitin co-staining.
Diagonal rotation of the 3D projection around Y of Tn-cdu1 C. trachomtis-infected HeLa cells stained with Mcl-1 (red channel), ubiquitin (green channel) and DNA is stained with DAPI (blue channel). Blank stacks were inserted in-between to generate a lateral cross-section of the chlamydial inclusion.
Video 3
3D reconstruction of a Mcl-1/Ubiquitin co-staining.
Straight rotation around Y of the 3D projection of HeLa cells infected with C. trachomatis Tn-cdu1. Immunofluorescence staining was performed against Mcl-1 (red channel), ubiquitin (green channel) and DAPI staining marks the DNA (blue channel). Blank stacks were inserted in-between to generate a lateral cross-section of the chlamydial inclusion.
Additional files
-
Supplementary file 1
Data collection and refinement statistics.
X-ray crystallographic data collection and refinement statistics for the structure of Cdu1 (155-401). Data for the highest resolution shell are given in parentheses. a: Firedel’s mates were kept separately for calculation.
- https://doi.org/10.7554/eLife.21465.034
-
Supplementary file 2
Plasmids.
Listed are all plasmids used in this study to transfect human cells or to transform E. coli or C. trachomatis. If not stated otherwise, constructs were cloned in this study using the oligo nucleotides listed in Supplementary file 4.
- https://doi.org/10.7554/eLife.21465.035
-
Supplementary file 3
Chlamydia trachomatis strains.
Listed are all C. trachomatis strains used and generated in this study. All C. trachomatis strains generated by transformation and selection originate from the C. trachomatis LGV L2 (434) (ATCC VR-902B) strain.
- https://doi.org/10.7554/eLife.21465.036
-
Supplementary file 4
Oligo nucleotides.
Listed are all oligo nucleotides in 5’ → 3’ orientation used in this study. The oligo nucleotides were used for construct cloning, sequencing or southern hybridization as indicated in the comment column.
- https://doi.org/10.7554/eLife.21465.037
Download links
A two-part list of links to download the article, or parts of the article, in various formats.
Downloads (link to download the article as PDF)
Open citations (links to open the citations from this article in various online reference manager services)
Cite this article (links to download the citations from this article in formats compatible with various reference manager tools)
Chlamydia trachomatis-containing vacuole serves as deubiquitination platform to stabilize Mcl-1 and to interfere with host defense
eLife 6:e21465.
https://doi.org/10.7554/eLife.21465


