Variation in olfactory neuron repertoires is genetically controlled and environmentally modulated
- Wellcome Trust Sanger Institute, United Kingdom
- University of Campinas, Brazil
- Duke University Medical Center, United States
- Monell Chemical Senses Center, United States
- University of Pennsylvania, United States
Figures
Figure 1 with 1 supplement
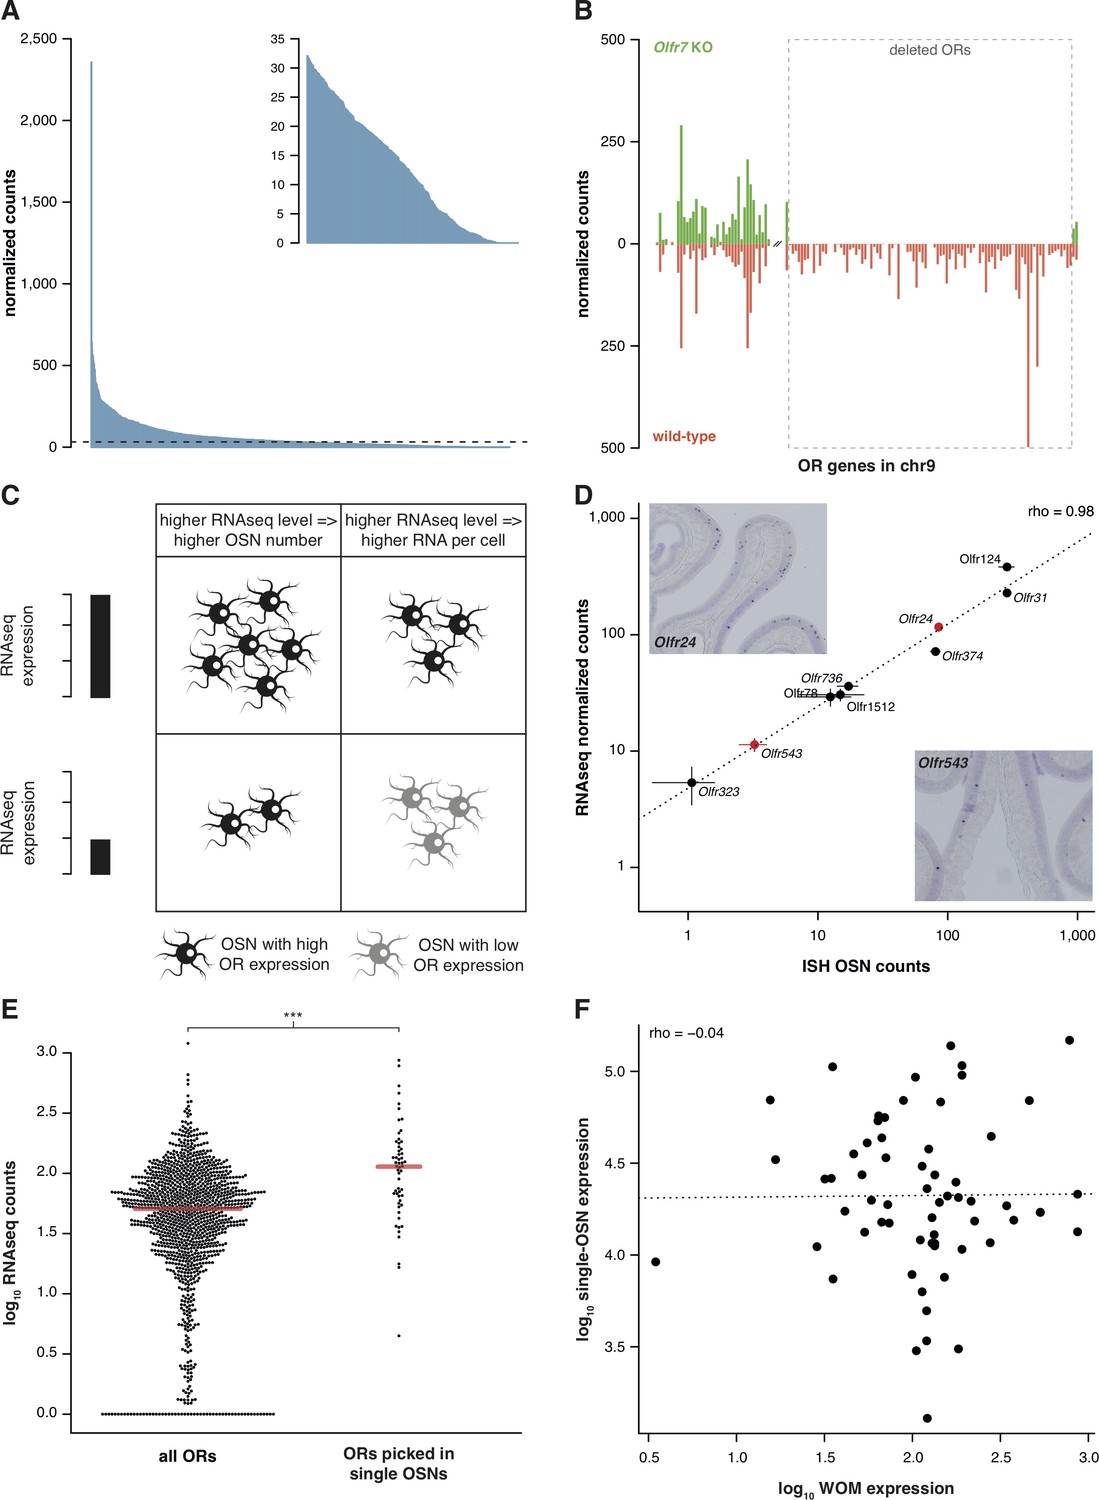
RNAseq is highly sensitive for OR mRNA detection and provides a measurement of OSN diversity.
(A) Barplot of the mean normalized expression of 1249 OR genes from six biological replicates, accounting for gene length. Genes are ordered by decreasing abundance. The horizontal line is the median expression (32.06) and all the genes below it are shown in the inset. (B) Mean normalized mRNA expression values for the OR genes in chromosome 9 of the Olfr7 cluster deletion mouse line (green; n = 3). The corresponding abundances in wild-type animals (orange) are shown as a mirror image (n = 3). The break on the x-axis separates the two OR clusters. The dotted box encloses the deleted ORs. (C) Unequal RNAseq expression levels for different OR genes can be explained by two scenarios: (left) an OR gene with high RNAseq levels is expressed by a larger number of OSNs than a gene with low RNAseq abundance; and/or (right) an OR with high RNAseq values is expressed in the same number of OSNs as one with low RNAseq values, but at higher levels per OSN. (D) Comparison of the number of OSNs that express nine OR genes assessed by in situ hybridization (ISH; x-axis) to the corresponding RNAseq values (y-axis). Error bars are the standard error of the mean (ISH n = 4, RNAseq n = 6). The line is the linear regression and the Spearman’s correlation coefficient (rho) indicates a very strong correlation. Representative ISH images of two OR genes (in red) are shown. (E) In single-cell RNAseq experiments, 63 OSNs were randomly collected from the MOE. The distribution of OR mRNA expression in WOM samples is plotted (left), alongside the equivalent values for the ORs that were present in the picked single-OSNs (right). There is a significant enrichment (p<6.44 × 10⁻⁹) toward collecting OSNs that express OR genes with high RNAseq counts in WOM. (F) Comparison of the normalized expression value for the highest OR detected in each of the 63 single-OSNs (y-axis) to the corresponding mean value in WOM (x-axis, n = 3). The line is the linear regression and the Spearman’s correlation coefficient (rho) indicates there is no correlation. See also Figure 1—figure supplement 1.
Figure 1—figure supplement 1

RNAseq expression values are a proxy for OSN number.
(A) Scatter plot for the OR mRNA expression levels using Ensembl gene models (x-axis) or the extended gene models from Ibarra-Soria et al. (2014) (y-axis). The red line is the 1:1 diagonal. A substantial proportion of the OR repertoire’s mRNA expression levels increase when mapped to more complete gene models. (B) Comparison of the number of OSNs in the MOE that express 10 particular OR genes (x-axis) as assessed by Bressel et al. (2016), to the corresponding values in the RNAseq data (y-axis). The line is the linear regression and the Spearman’s correlation coefficient is indicated. The high correlation between these measurements indicate that the RNAseq expression estimates are a proxy for the number of OSNs that express each OR gene. (C) Comparison of the number of OSNs in the MOE that express a particular set of OR genes (x-axis), as assessed by in situ hybridization by Fuss et al. (2007), to the corresponding values in the RNAseq data (y-axis). The line is the linear regression and the Spearman's correlation coefficient is indicated. (D) Comparison of the number of OSNs in the MOE that express a particular set of OR genes (x-axis), as assessed by in situ hybridization by Khan et al. (2011), to the corresponding values in the RNAseq data (y-axis). The line is the linear regression and the Spearman’s correlation coefficient is indicated.
Figure 2 with 1 supplement
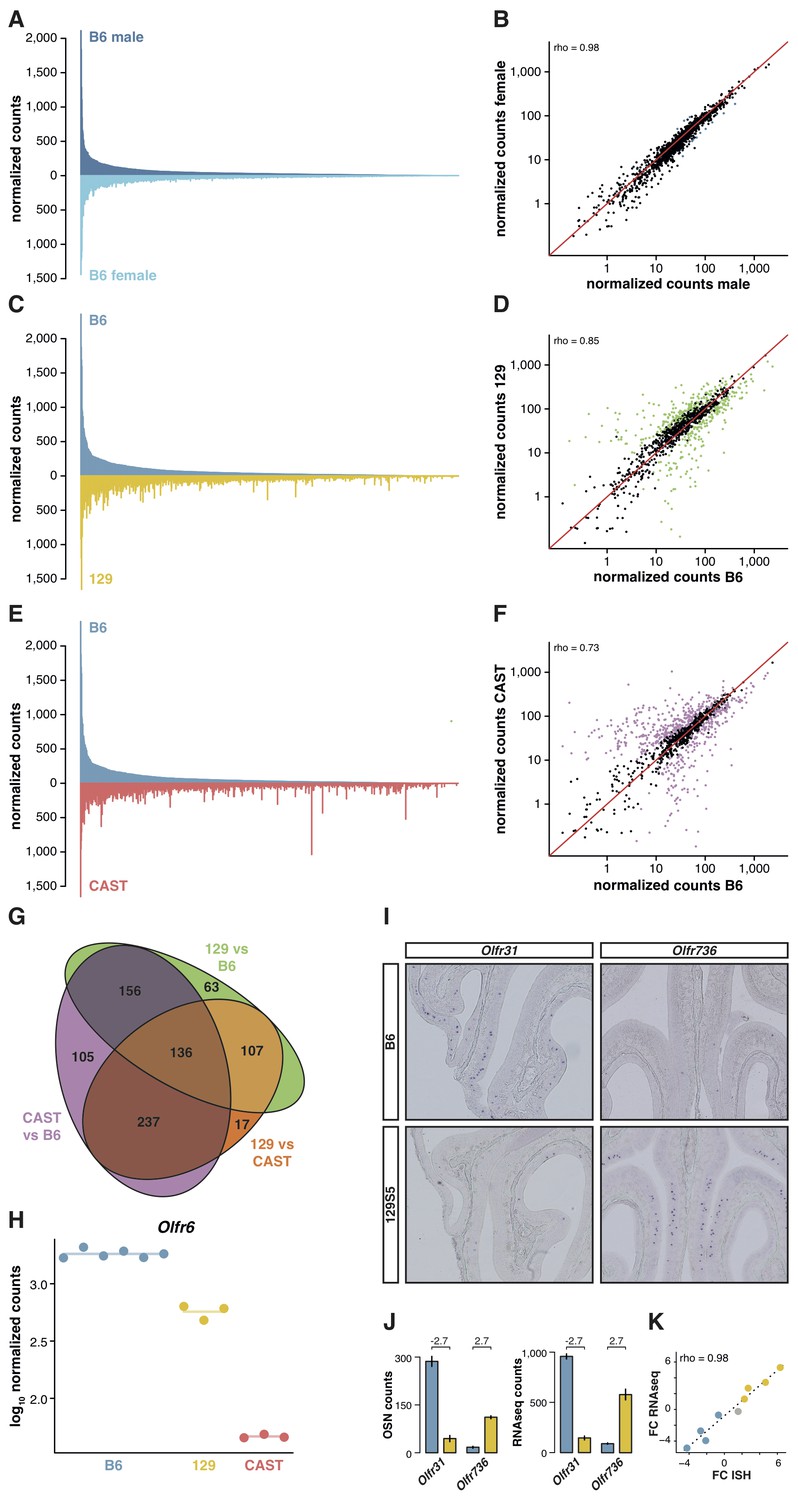
OSN diversity varies between mouse strains.
(A) Mirrored barplot of the mean normalized RNAseq expression values for the OR genes in male (dark blue, top) and female (light blue, bottom) B6 animals (n = 3). (B) Scatter plot for the same data, with the Spearman’s correlation (rho) indicating a strong correlation. The red line is the 1:1 diagonal. Significantly differentially expressed (DE) OR genes are represented in blue, non-DE genes are in black. (C) Same as in (A) but with the average B6 expression in blue (both males and females, n = 6) compared to the corresponding 129 expression values in yellow (n = 3). (D) Corresponding scatter plot, with the significant DE genes in green. (E) Same as in (A) but comparing the B6 expression in blue (n = 6) to the CAST abundances in red (n = 3). (F) Corresponding scatter plot, with DE genes in purple. (G) Venn diagram illustrating the intersection of DE OR genes between the pairwise comparisons of the three strains. (H) An example of an OR gene, Olfr6, that is DE in all strain comparisons. (I) Representative in situ hybridizations (ISH) on coronal slices of B6 and 129 MOEs for two OR genes, Olfr31 and Olfr736, that are DE between these strains. (J) The quantification of OSNs expressing each OR gene in B6 (blue) and 129 (yellow) are plotted alongside the corresponding RNAseq counts. The log2 fold-changes between the strains are indicated. (K) Fold-change between the strains obtained from ISH data (x-axis) or RNAseq counts (y-axis) for four DE OR genes expressed higher in B6 (blue), four expressed higher in 129 (yellow) and one expressed at equivalent levels in both strains (grey); these include Olfr31 and Olfr736. The line is the linear regression and the Spearman’s coefficient (rho) indicates a strong correlation between OSN and RNAseq counts. See also Figure 2—figure supplement 1.
-
Figure 2—source data 1
OR expression data in three strains of mice.
Excel workbook containing the normalized expression data for all OR genes in B6, 129 and CAST, along with the results of the differential expression analysis.
- https://doi.org/10.7554/eLife.21476.006
-
Figure 2—source data 2
Novel OR alleles in the CAST genome.
Text file with the fasta sequences of the novel alleles identified in the CAST genome.
- https://doi.org/10.7554/eLife.21476.007
Figure 2—figure supplement 1

Differences in genetic background result in great variance in OSN subtype diversity.
(A) The difference in mean expression values for OR gene mRNAs in 129 animals, as obtained by mapping to a pseudo-129 genome versus mapping to the B6 reference (n = 3). The genes are ordered by their decreasing mean expression value after mapping to the pseudo-129 genome. (B) Comparison of the number of OSNs that express nine OR genes assessed by in situ hybridization (ISH; x-axis) to the corresponding RNAseq values (y-axis) in 129 animals. Error bars are the standard error of the mean (ISH n = 4, RNAseq n = 3). The line is the linear regression and the Spearman’s correlation coefficient (rho) indicates a very strong correlation. (C) Same as (A) but for CAST RNAseq data mapped to a pseudo-CAST genome or the B6 reference (n = 3). (D) Mirrored barplot of the mean normalized expression values for the OR gene mRNAs in 129 (yellow) and CAST (red) animals. (E) Scatter plot of the same data as in (C), with the Spearman’s correlation value (rho) indicated. The red line is the 1:1 diagonal. Significantly differentially expressed (DE) genes are presented in orange. (F) Scatter plot of the mean OR raw RNAseq counts for the RNAseq CAST data mapped to the pseudo-CAST genome (x-axis) or to the pseudo-CAST genome plus additional OR alleles identified as CNVs (y-axis, n = 3). The red line is the 1:1 diagonal. The counts of the new alleles are represented in blue. Only mRNA from 36 other OR genes change their abundance; all lose counts that now map to the additional alleles. (G) Scatter plot for the differential expression analysis of the OR repertoire in B6 versus CAST. The mean mRNA expression for each OR gene is plotted against its fold-change between the strains. Those significantly DE are red and the rest grey. The horizontal red line indicates equal expression in both strains. Highlighted in black are the mRNAs from OR genes that, after accounting for the new OR alleles, lose their DE status; and in blue are those that become DE.
Figure 3 with 1 supplement
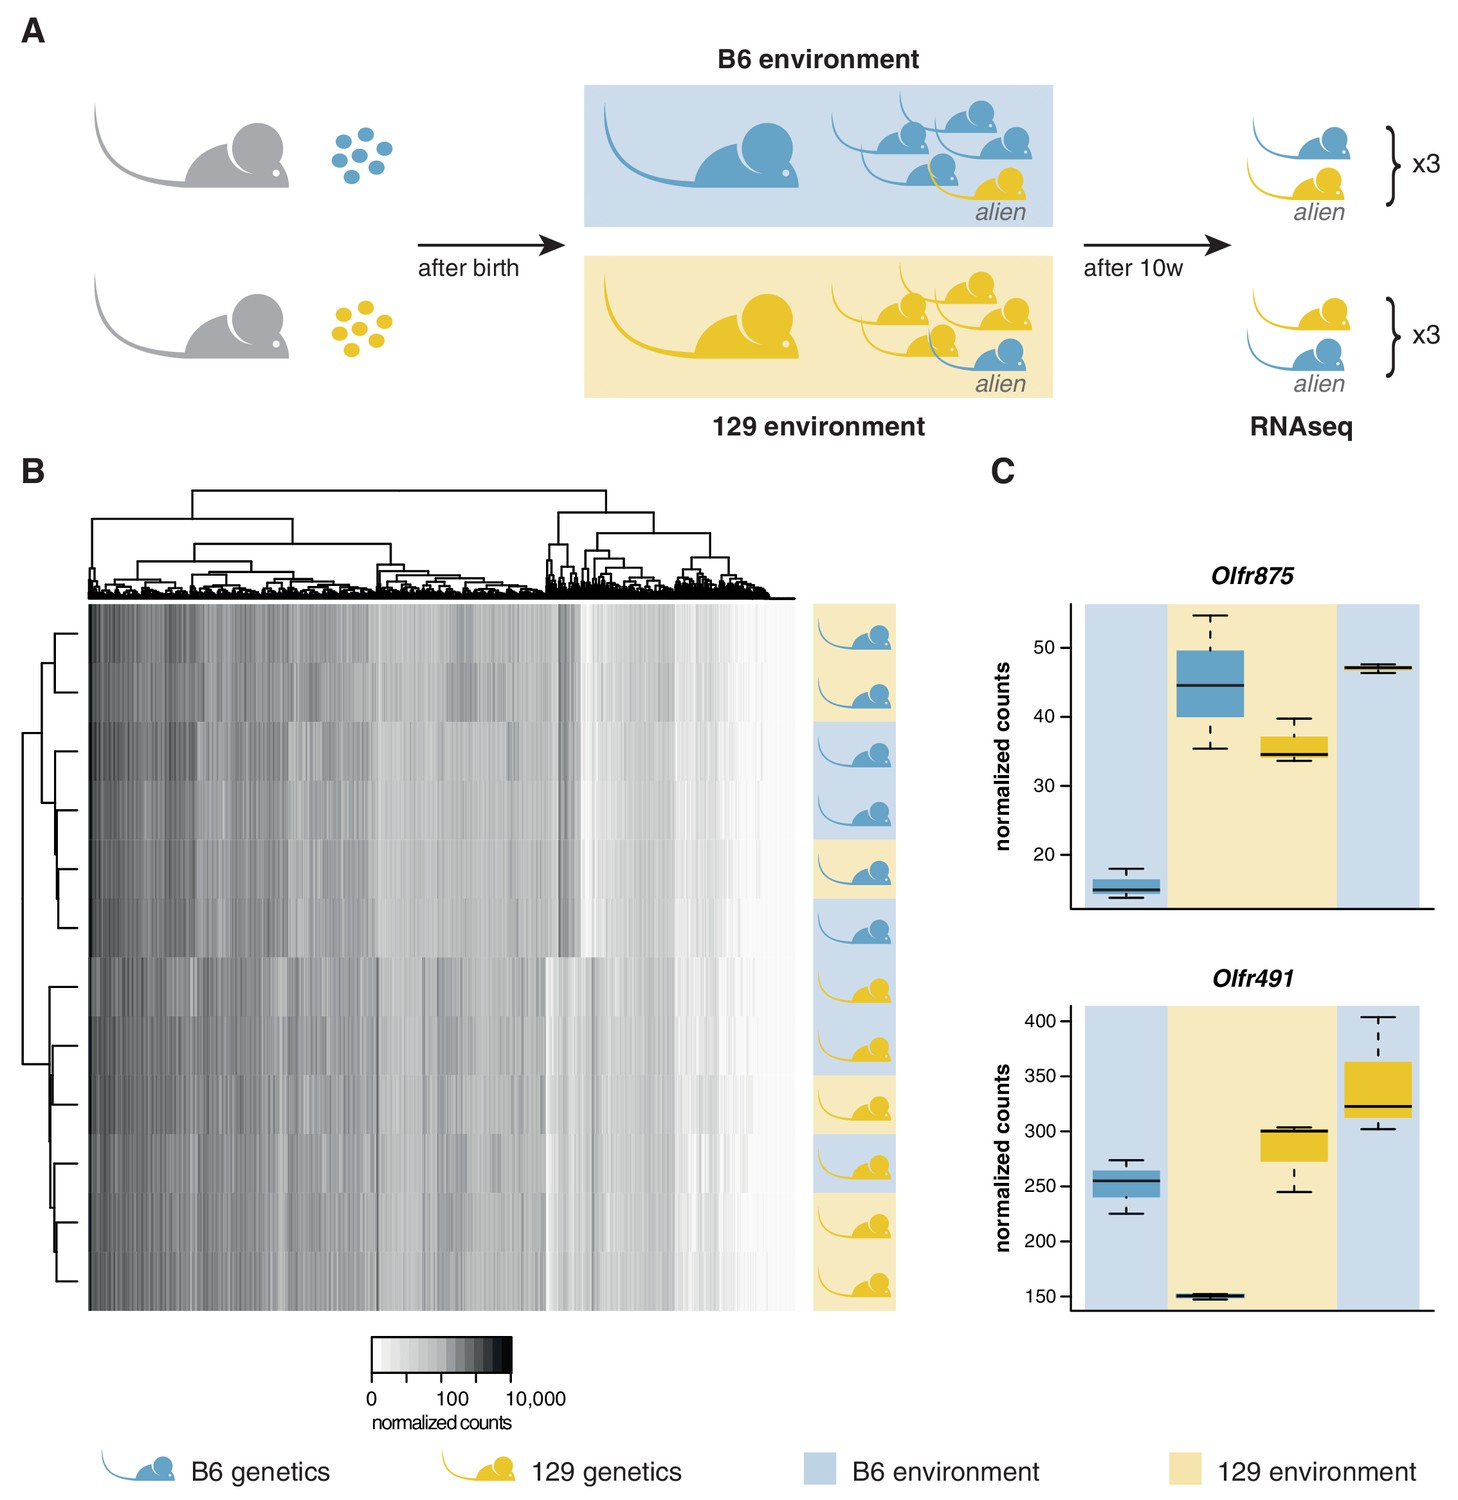
OSN diversity is determined by the genetic background and not by the olfactory environment.
(A) Experimental strategy to differentiate genetic from environmental influences on OSN diversity. B6 (blue) and 129 (yellow) embryos, depicted as circles, were transferred into F1 recipient mothers (grey). After birth, the litters were cross-fostered to B6 and 129 mothers, respectively. Each B6 litter received one 129 pup (the alien) and vice versa. After 10 weeks, the WOM was collected for RNAseq from three aliens from each strain, and one cage-mate each. (B) Heatmap of the expression of the OR genes (columns) in all 12 sequenced animals (rows). Samples cluster by the genetic background of the animals. The strain and environment of each mouse is indicated through shading (right). (C) Differential expression analyses revealed mRNA from only two genes, Olfr875 and Olfr491, that are significantly altered based on the olfactory environment. Expression values are shown for each group. Blue and yellow boxes indicate B6 or 129 animals respectively, and the background indicates the olfactory environment. See also Figure 3—figure supplement 1.
Figure 3—figure supplement 1
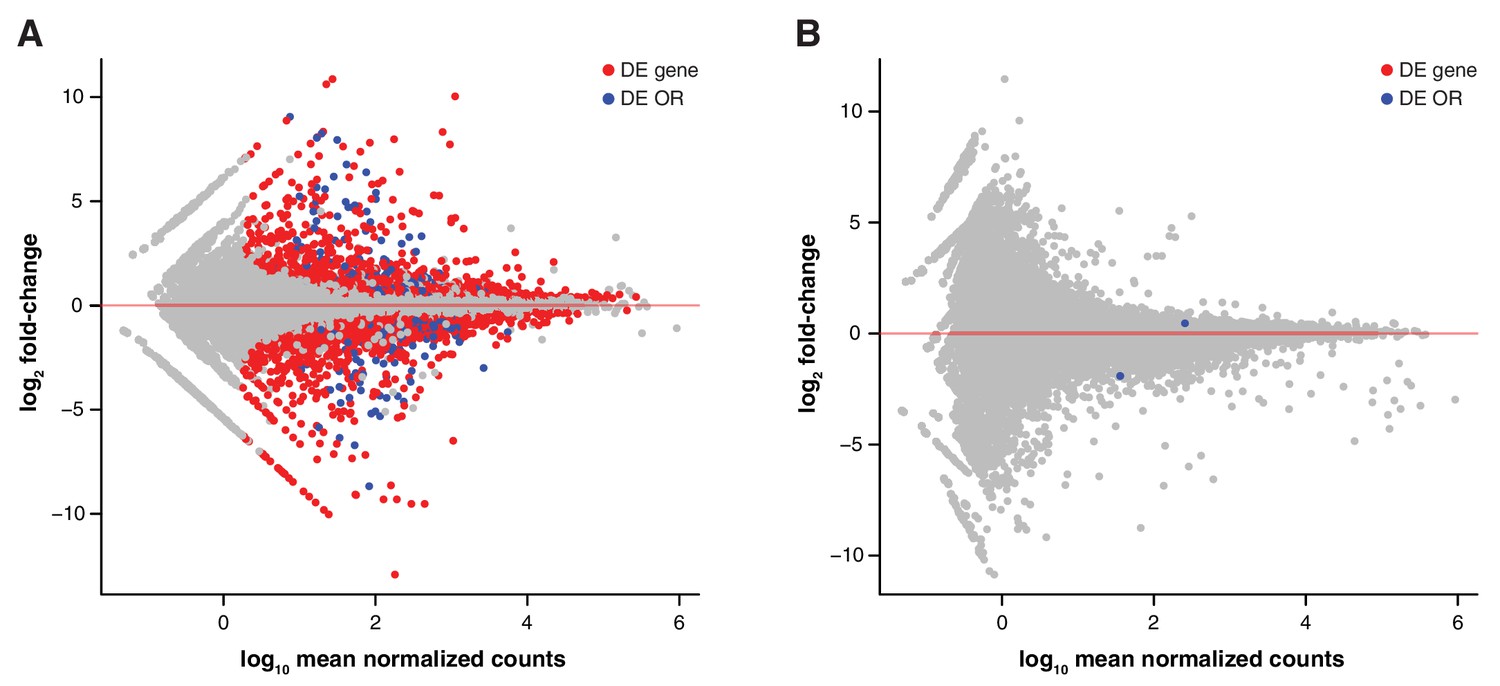
Genetic but not environmental factors regulate OSN subtype abundance.
MA plots of the transcriptome-wide differential expression analysis between aliens and cage-mates, testing for the effect of (A) a different genetic background and (B) a different olfactory environment. Significantly DE ORs are represented in blue; other DE genes are in red.
Figure 4 with 1 supplement

OSN diversity is independent of OR activity and is controlled in cis.
(A) Mean normalized expression of the OR mRNA in the WOM of newborn B6 animals, arranged from most to least abundant (n = 3). (B) Mean normalized mRNA expression of 134 annotated OR pseudogenes in the B6 adult WOM (n = 6). (C) A genetically modified mouse line was produced that contains the coding sequence (CDS) of Olfr2 in place of Olfr1507 (Olfr2 > Olfr1507). The strategy combined the use of CRISPR-Cas9 technology to create double-strand breaks on either side of the Olfr1507 CDS, and a DNA vector containing the Olfr2 CDS along with ~1 kb homology arms for homologous recombination (HR). (D) Mirrored barplot of the mean normalized mRNA expression values for the OR repertoire in B6 animals (light blue, top; n = 4) and in Olfr2 > Olfr1507 homozygous (hom) mutants (dark blue, bottom; n = 4). Olfr2 becomes the most abundant OR and Olfr1507 is no longer expressed in the genetically modified line. (E) Scatter plot of the mean normalized counts (x-axis) of OR genes versus the log2 fold-change between Olfr2 > Olfr1507 homozygotes and WT controls (y-axis, n = 4). OR genes that are significantly differentially expressed are represented in blue. Olfr2 and Olfr1507 are strikingly different, whereas the rest of the repertoire is equivalent or very slightly altered. (F) Comparison of the fold-change of the CAST versus B6 OR expression (y-axis) to the fold-change between the CAST and B6 alleles in the F1 (x-axis). The genes fall largely on the 1:1 diagonal (red line) indicating the mRNA expression pattern observed in the parents is preserved in the F1 and thus OR abundance is controlled in cis. The concordance correlation coefficient (ccc) is indicated, which quantifies the correlation between the two fold-change estimates while correction for agreement on the x=y line. (G) Examples of the normalized mRNA expression in the parental strains (top) of an OR gene that is more abundant in CAST (Olfr1535) or in B6 (Olfr598). The corresponding mRNA abundance of each allele in the F1 (bottom) is preserved. The log2 fold-change is indicated for each comparison. Error bars are the standard error of the mean. See also Figure 4—figure supplement 1.
-
Figure 4—source data 1
OR expression data in the Olfr2 > Olfr1507 mouse.
Excel workbook containing the normalized expression data for all OR genes in the Olfr2 > Olfr1507 mouse line and B6 controls, along with the results of the differential expression analysis.
- https://doi.org/10.7554/eLife.21476.012
-
Figure 4—source data 2
Number and coordinates of OE and HD binding sites in OR gene promoters.
Excel workbook detailing the number of Olf1/Ebf1 (OE) and homeodomain (HD) transcription-factor-binding sites predicted by RegionMiner, for 1 kb upstream of the transcription start site (TSS) of OR genes (as reported in Ibarra-Soria et al., 2014) in all three strains. The genomic coordinates of each motif are also provided. Note that while the coordinates for the B6 data are from the reference mouse genome (GRCm38), those for 129 and CAST are based on the constructed pseudo-genomes and will not match the reference genome annotation.
- https://doi.org/10.7554/eLife.21476.013
Figure 4—figure supplement 1
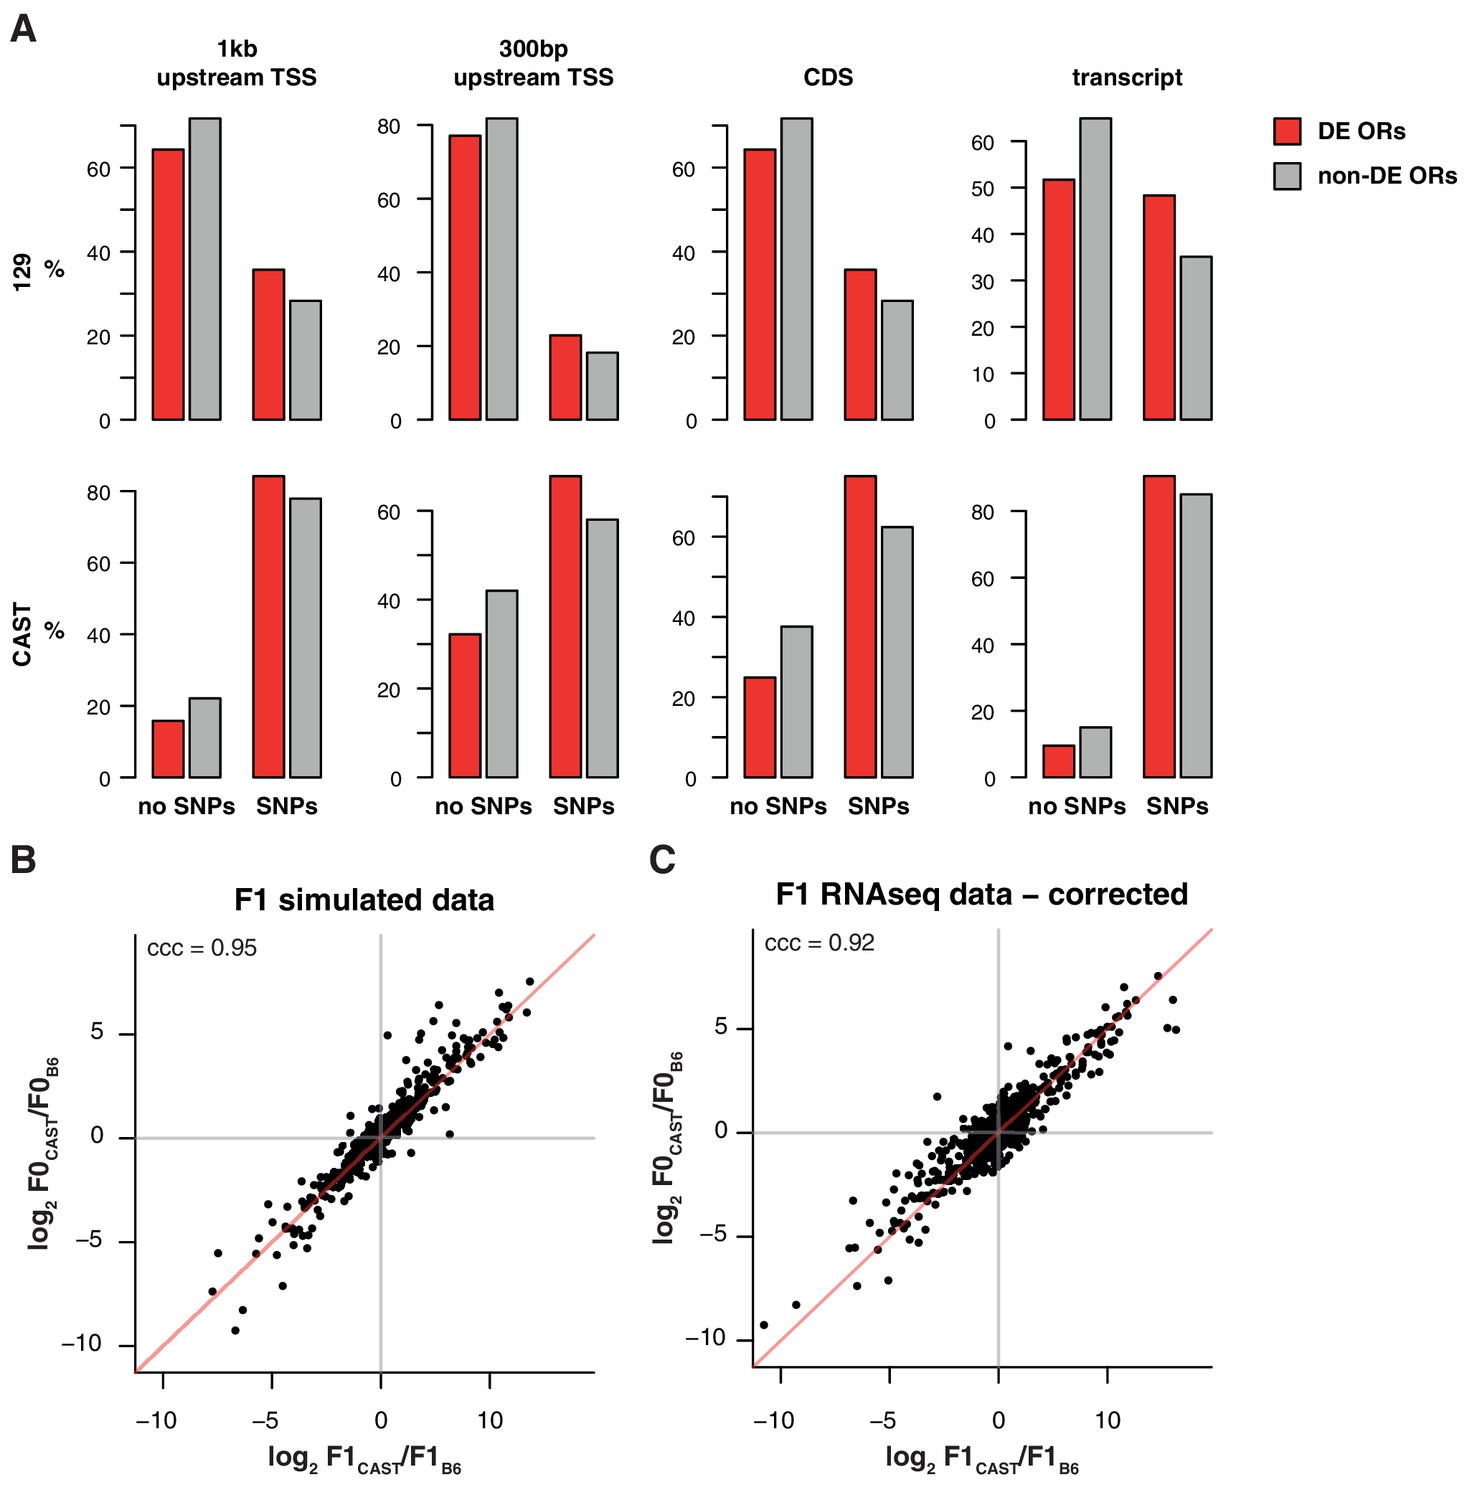
Differentially represented ORs have more variation.
(A) The proportion of OR genes that have no SNPs (left) or at least one SNP (right), between the B6 and 129 (top) or B6 and CAST (bottom) genomes. Data are further subdivided by whether mRNA from the OR is significantly differentially expressed (DE; red) or not (grey) between the corresponding strains. Across both strains and all sequence windows, a smaller proportion of invariant ORs are DE, while in ORs with sequence variation a larger proportion are DE. (B) Comparison of the fold-change of the CAST versus B6 OR expression (y-axis) to the fold-change between the CAST and B6 alleles in an in silico generated F1 (x-axis). The genes fall largely on the 1:1 diagonal (red line), but some deviation is observed. Such deviations can be attributed to technical noise. The concordance correlation coefficient (ccc) is 0.95. (C) The deviation from the x=y line in (B) was subtracted from the fold-change estimates from the real F1 data (Figure 4F) and the resulting estimates are plotted (x-axis) against the parental fold-change (y-axis). The ccc increases from 0.86 to 0.92 suggesting that a proportion of the deviation from equality observed in Figure 4F is due to technical noise.
Figure 5 with 1 supplement
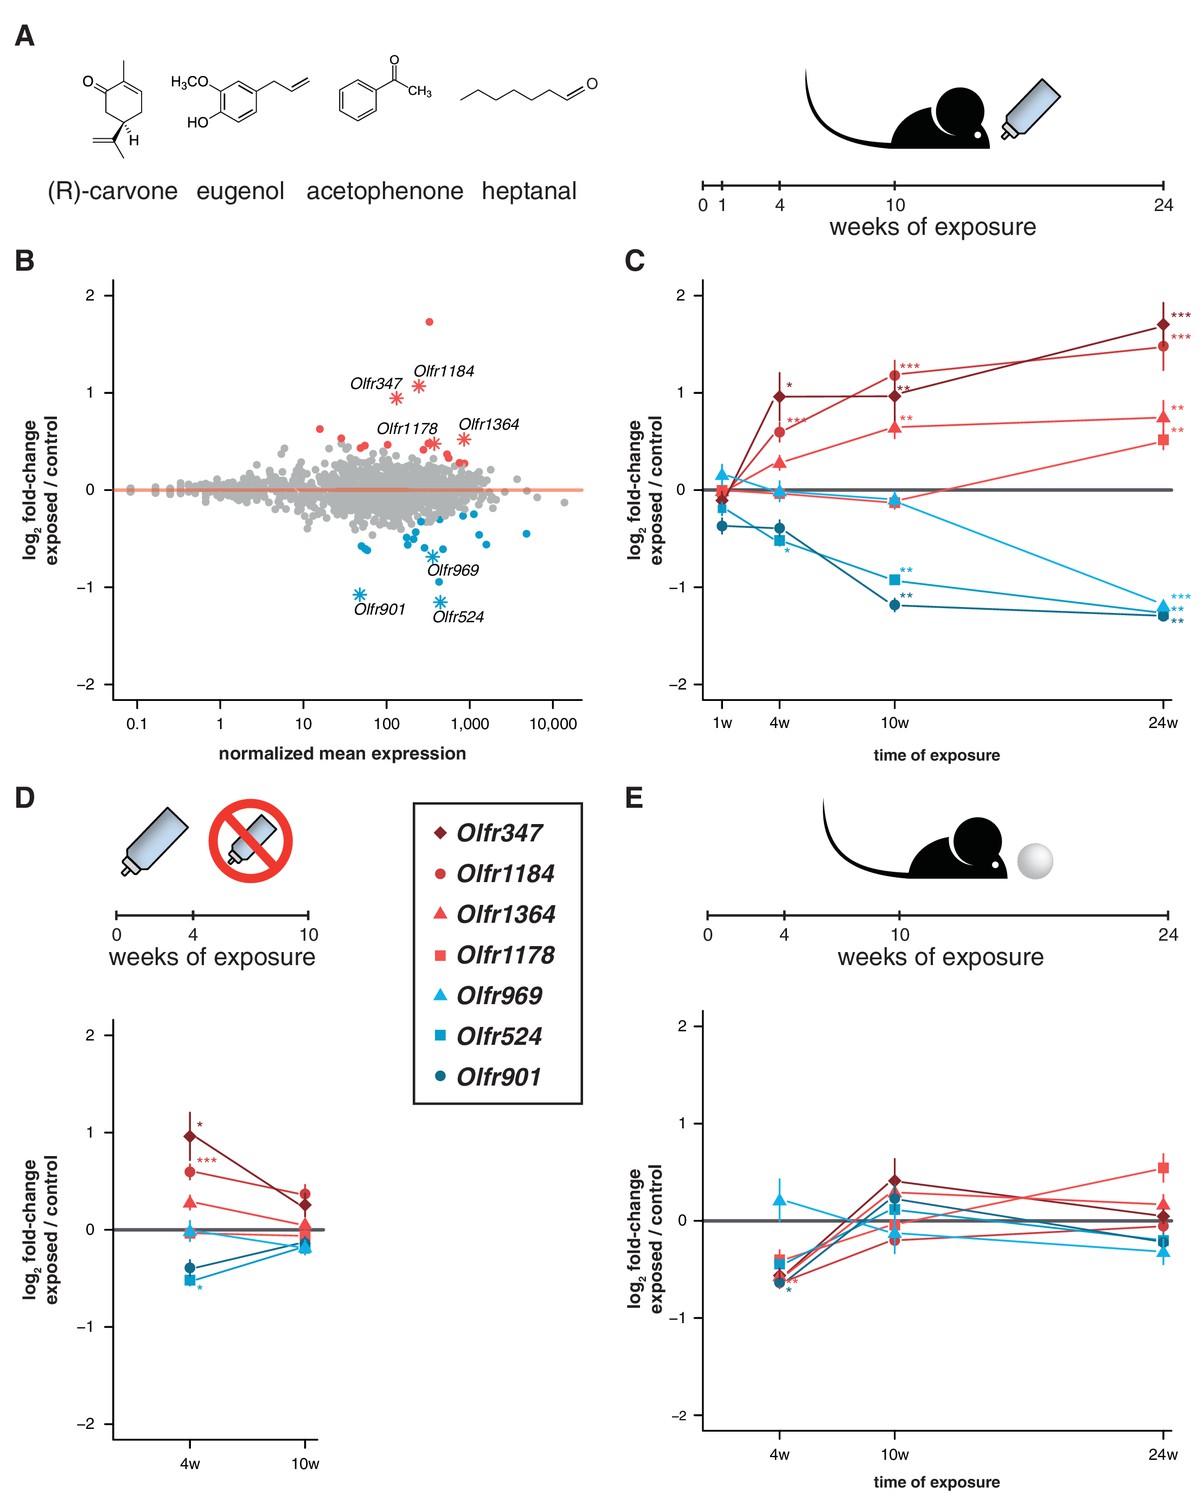
Acute but not chronic exposure to odors alters OR mRNA abundance.
(A) Four different odorants were mixed together and used to stimulate B6 animals. In an acute paradigm, the odor mix was added to the drinking water supplied to the animals and WOM was collected at different time-points. (B) WOM from animals exposed for 24 weeks and matched controls were sequenced (n = 6). The plot shows the normalized mean mRNA expression value (x-axis) for each OR gene compared to its fold-change in exposed versus control samples (y-axis). Genes highlighted in red or blue have significantly up- or downregulated mRNAs, respectively. OR genes represented by an asterisk were selected for further validation. (C) qRT-PCR validation of the DE genes highlighted in (B). The mean fold-change between exposed and control samples is plotted for animals exposed for differing periods of time (x-axis). After 24 weeks of exposure, all the genes are significantly DE (n = 8–13). (D) Animals were acutely exposed to the odor mix for four weeks and then the stimulus was removed for 6 weeks. After the recovery period none of the OR mRNAs are significantly different from controls (n = 8). (E) A chronic exposure paradigm was tested by presenting the odor mix on a cotton ball, placed in the cages of the animals for 24 hr a day. The WOM was collected at different time-points. The genes previously shown to be DE were tested by qRT-PCR and none show consistent changes in mRNA levels across time (n = 3–10). T-test, FDR < 5%; * < 0.05, ** < 0.01, *** < 0.001. Error bars are the standard error of the mean. See also Figure 5—figure supplement 1.
-
Figure 5—source data 1
OR expression data in odor-exposed mice.
Excel workbook containing the normalized expression data for all OR genes in control and mice exposed to the mixture of (R)-carvone, heptanal, acetophenone and eugenol; along with the results of the differential expression analysis.
- https://doi.org/10.7554/eLife.21476.016
Figure 5—figure supplement 1

Specific OSN subtypes change in abundance upon olfactory stimulation.
Significantly DE OR genes (FDR < 5%) after 24 weeks exposure to a mixture of (R)-carvone, heptanal, acetophenone and eugenol. The boxplots represent expression values for six controls (grey) and six exposed (blue) animals.
Figure 6 with 1 supplement

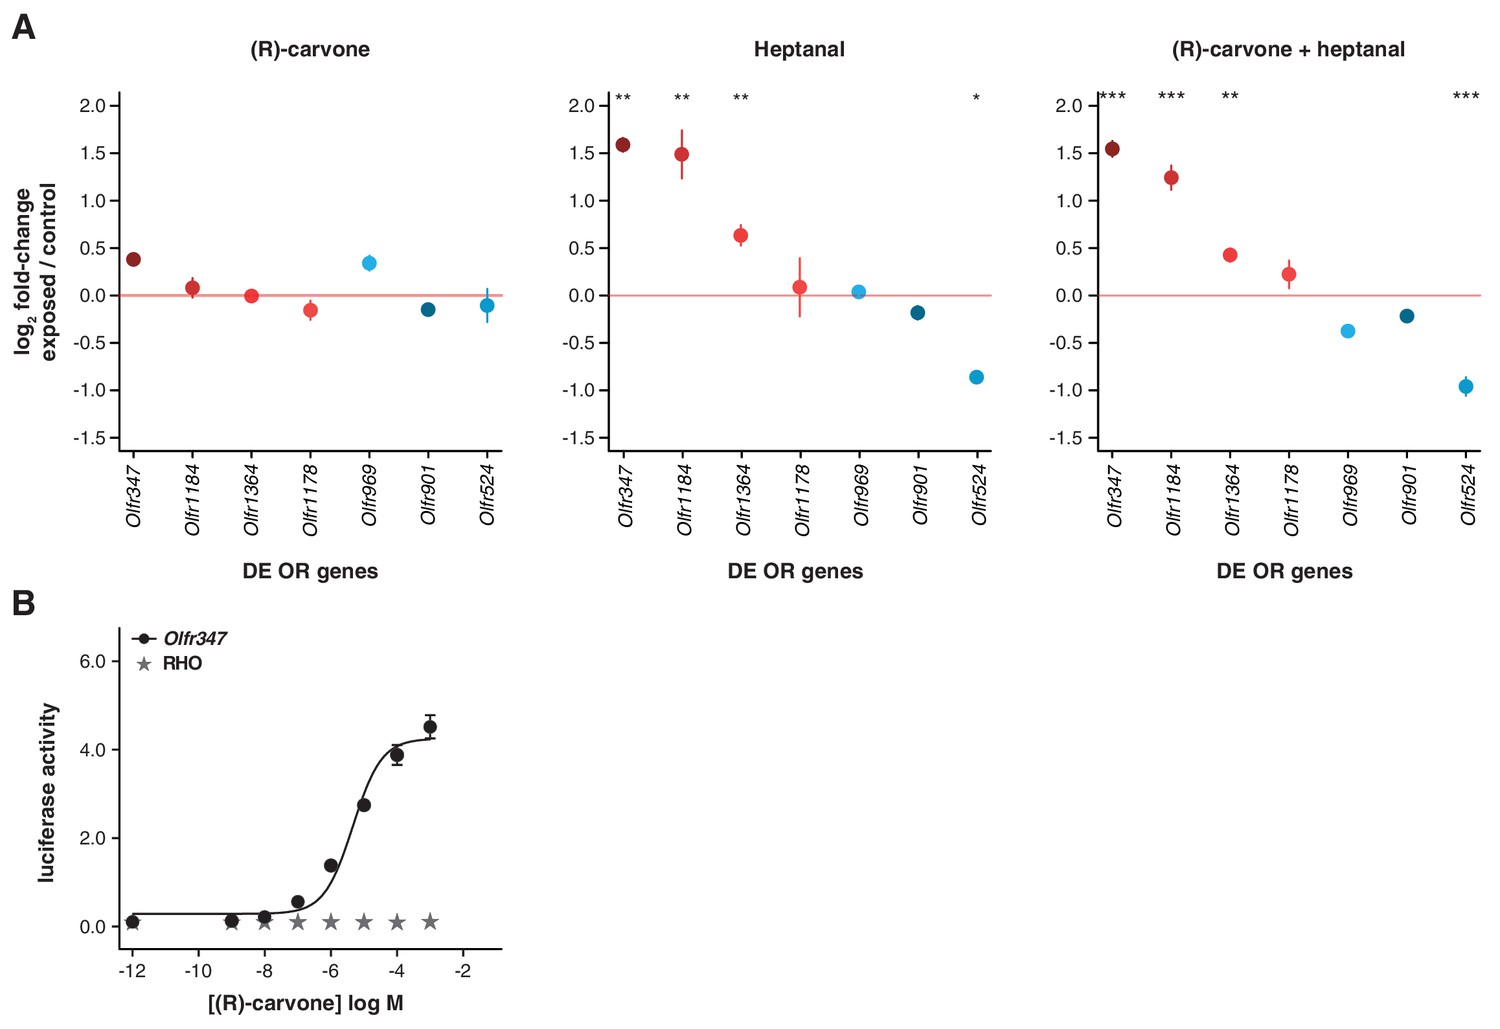
Odor-mediated changes in OR mRNA abundance are receptor specific.
(A) B6 animals were acutely exposed for 10 weeks to (R)-carvone, heptanal or both. (B) The fold-change of exposed compared to control animals based on RNAseq data (y-axis) is plotted against the OR genes mean mRNA abundance (x-axis), for each of the experimental groups (n = 6). Genes in red or blue have significantly up or downregulated mRNAs, respectively. (C) Venn diagram showing the intersections of the DE OR genes in each of the exposure groups. Only one OR mRNA changed in all groups; all the other are specifically altered upon exposure to (R)-carvone or heptanal. (D) Examples of an OR mRNA that changes in all groups (Olfr538), one that is specific to stimulation with (R)-carvone (Olfr902) and one that responds only to heptanal (Olfr1182). (E) Dose-response curve for HEK293 cells expressing Olfr538 (black) and challenged with increasing concentrations of (R)-carvone. HEK293 cells expressing a RHO-tag only (grey) were challenged with the same concentrations of (R)-carvone as a control. (F) Dose-response curve for cells expressing Olfr524 (black) and challenged with heptanal, control cell responses are represented in grey. Error bars are the standard error of the mean. (G) Comparison of DE genes identified after 10 weeks of acute exposure to heptanal to those found via an in vivo deorphanization strategy. On the x-axis is the fold change of acutely exposed versus control animals with the corresponding p-value on the y-axis. The horizontal line represents the cutoff for significance. Each dot is an OR gene; those called significantly DE in both assays are shown in black, while those responding in only one experiment are in blue and purple. Half (11/20) of all the DE genes in the acute exposure experiment are identified in the deorphanization assay, suggesting that the changes are indeed mediated by OSN activation by heptanal. See also Figure 6—figure supplement 1.
-
Figure 6—source data 1
OR expression data in odor-exposed mice.
Excel workbook containing the normalized expression data for all OR genes in control and mice exposed to (R)-carvone alone, heptanal alone or the combination of both; along with the results of the differential expression analysis.
- https://doi.org/10.7554/eLife.21476.019
Figure 6—figure supplement 1
Olfactory-induced changes in OSN abundance are odor-specific.
(A) qRT-PCR expression estimates for seven OR genes that were previously validated as DE in animals exposed to a mix of four odorants (Figure 5C), here in mice exposed singly to (R)-carvone (left), to heptanal (center) or to the combination of both (right). The mean fold-change in expression between the exposed (n = 6) and control mice (n = 6) is plotted. The horizontal red line represents equal expression in both groups. None of the genes are significantly DE in animals exposed to (R)-carvone, but four are significantly DE when exposed to heptanal or the combination of both. T-test, FDR < 5%; * < 0.05, ** < 0.01, *** < 0.001. Error bars are standard error of the mean. (B) Dose-response curve for HEK293 cells expressing Olfr347 (black) challenged with increasing concentrations of (R)-carvone. Control cells (grey) do not respond to the same increase in odorant concentration.
Additional files
-
Supplementary file 1
Sample and gene accessions.
(1) Information on the sex, age and strain of the samples sequenced, along with the accession numbers for the raw data; and (2) information on the reconstructed OR alleles for the CAST strain.
- https://doi.org/10.7554/eLife.21476.021
Download links
A two-part list of links to download the article, or parts of the article, in various formats.
Downloads (link to download the article as PDF)
Open citations (links to open the citations from this article in various online reference manager services)
Cite this article (links to download the citations from this article in formats compatible with various reference manager tools)
Variation in olfactory neuron repertoires is genetically controlled and environmentally modulated
eLife 6:e21476.
https://doi.org/10.7554/eLife.21476


