Speed and segmentation control mechanisms characterized in rhythmically-active circuits created from spinal neurons produced from genetically-tagged embryonic stem cells
- Howard Hughes Medical Institute, Salk Institute for Biological Studies, United States
- University of California, San Diego, United States
- University of Illinois at Chicago, United States
- Salk Institute for Biological Studies, United States
Figures
Figure 1 with 3 supplements
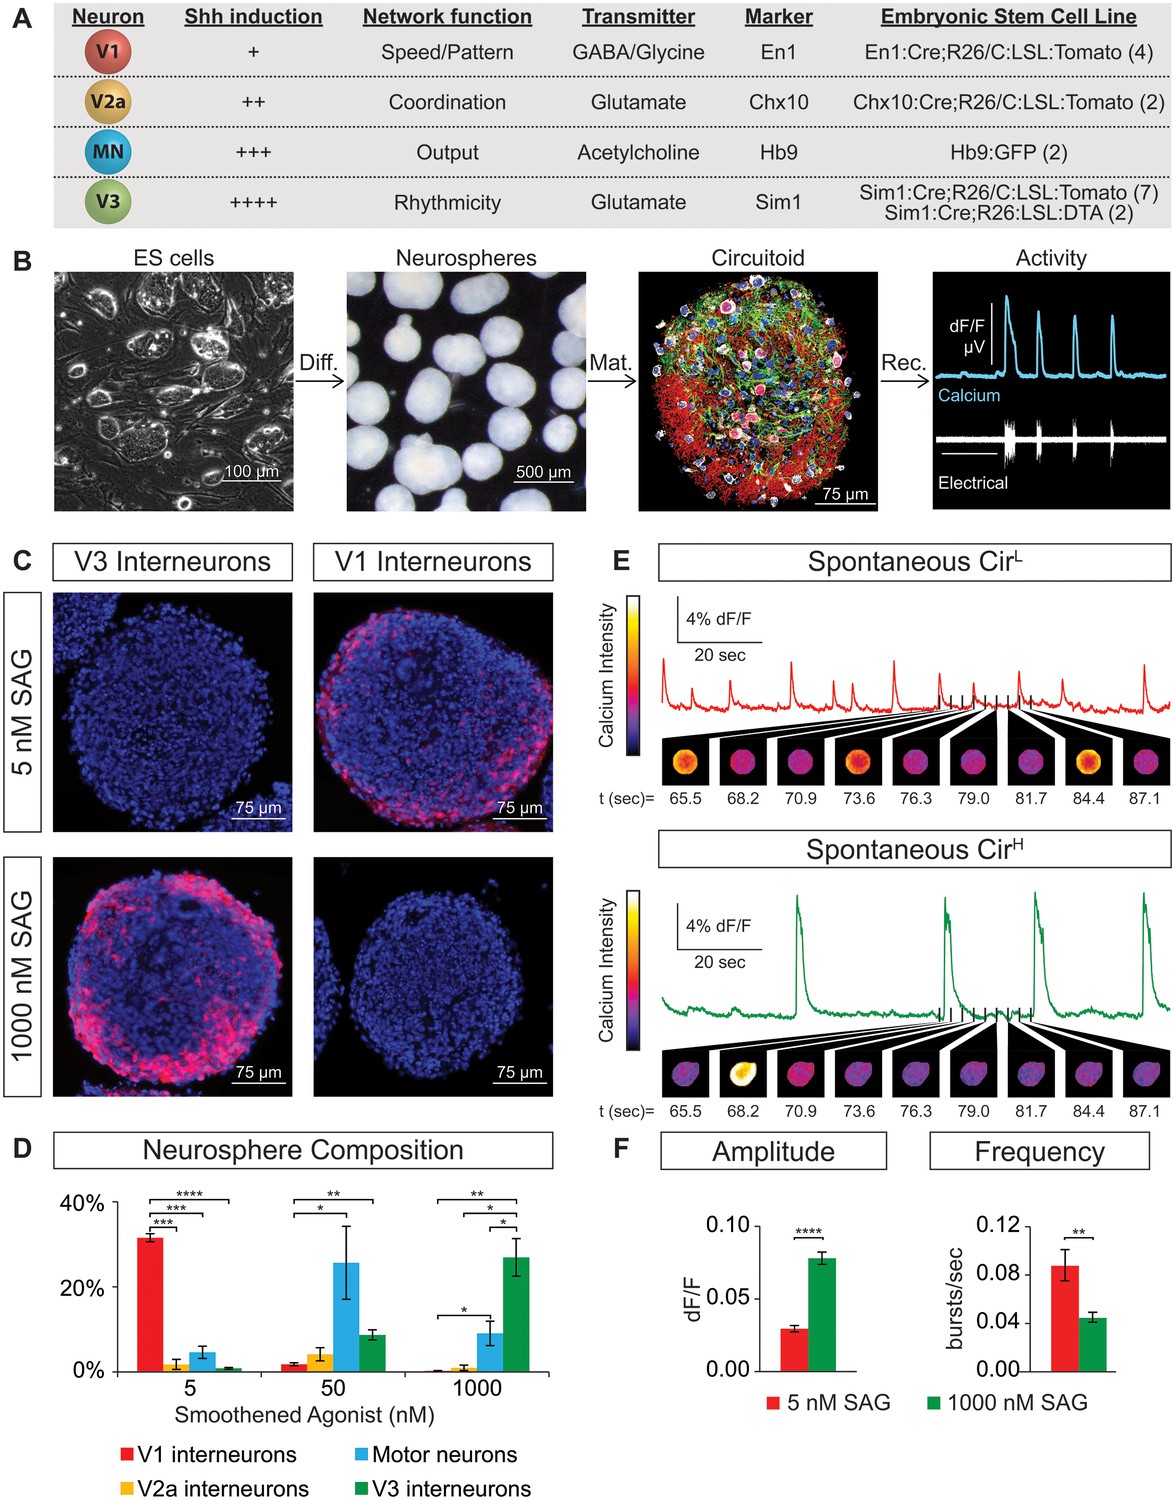
Spontaneous activity emerges from networks created from ES cell-derived spinal neurons.
(A) Mouse ES cell lines were derived from embryos with genetic tags for defined spinal neuron subclasses. The number of individual ES cell lines generated for each genotype is shown in parentheses. (B) ES cells (phase contrast) were differentiated (diff.) into neurospheres (dark field) with retinoic acid and smoothened agonist (SAG) for six days. After maturation (mat., 17 days post-ES cell), a circuitoid was immunostained to identify cell types (neurotrace: white; V3 tomato reporter: red; astrocytes, GFAP: green; nuclei, DAPI: blue). Network activity was recorded (rec.) from circuitoids using a suction electrode and calcium imaging (tgCAG:GCaMP3 ES cell line, 1000 nM SAG, 15 days post-ES). Vertical scale bar is 8% dF/F and 280 μV, and horizontal 1 min. (C) The V3 reporter line generates tomato +V3 interneurons (red) with 1000 nM SAG, whereas the V1 ES cell line generates tomato +V1 interneurons (red) with 5 nM SAG 10 days post-ES cell differentiation. DAPI (blue). (D) Quantification of neuronal subtypes from ES cell-fluorescent reporter lines in (A) generated with increasing SAG concentrations using FACS to quantify cell numbers. Mean ± standard error of the mean (SEM). Differentiations: n = 8 for each ES cell-reporter line tested at each SAG concentration. Unpaired t test: *p<0.05; **p<0.01; ***p<0.001; ****p<0.0001. (E and F) Circuitoids composed of different neuronal subtypes produce distinct spontaneous network burst activity. (E) Calcium dye traces from spontaneously active circuitoids (Cir) generated at low (L) or high (H) SAG concentration: 5 nM SAG, CirL, red trace; 1000 nM SAG, CirH, green trace. Fluorescent images shown for indicated time points. (F) Quantification of bursting parameters using calcium imaging. CirL spheres produce low-amplitude high-frequency bursts compared to CirH spheres 16–17 days post-ES. Mean ± SEM; 1000 nM n = 21; 5 nM n = 19; unpaired t test ***p<0.001, ****p<0.0001.
Figure 1—figure supplement 1

Neurosphere differentiation and composition.
(A and B) 10 days-post ES cell differentiation neurospheres were dissociated and cell composition was quantified using FACS. Plots of V3, V2a, and V1 interneurons and motor neurons from Sim1:Cre;R26/C:LSL:Tomato, Chx10:Cre;R26/C:LSL:Tomato, En1:Cre;R26/C:LSL:Tomato, and Hb9:GFP ES cell reporter lines, respectively are shown after differentiation with (A) 1000 nM and (B) 5 nM SAG. (C) Two Chx:10:Cre;R26/C:LSL:Tomato ES cell lines were differentiated 10 days under a range of SAG concentrations. Tomato+V2a neuron number was quantified using FACS. (D) Chx:10:Cre;R26/C:LSL:Tomato lines #1 and #2 were differentiated with 15 nM and 40 nM SAG, respectively. 5 μM DAPT was applied days 6–10. Standardized tomato+ V2a neurons relative to no DAPT control.
Figure 1—figure supplement 2
ES-cell-derived neurons express neuronal subtype markers.
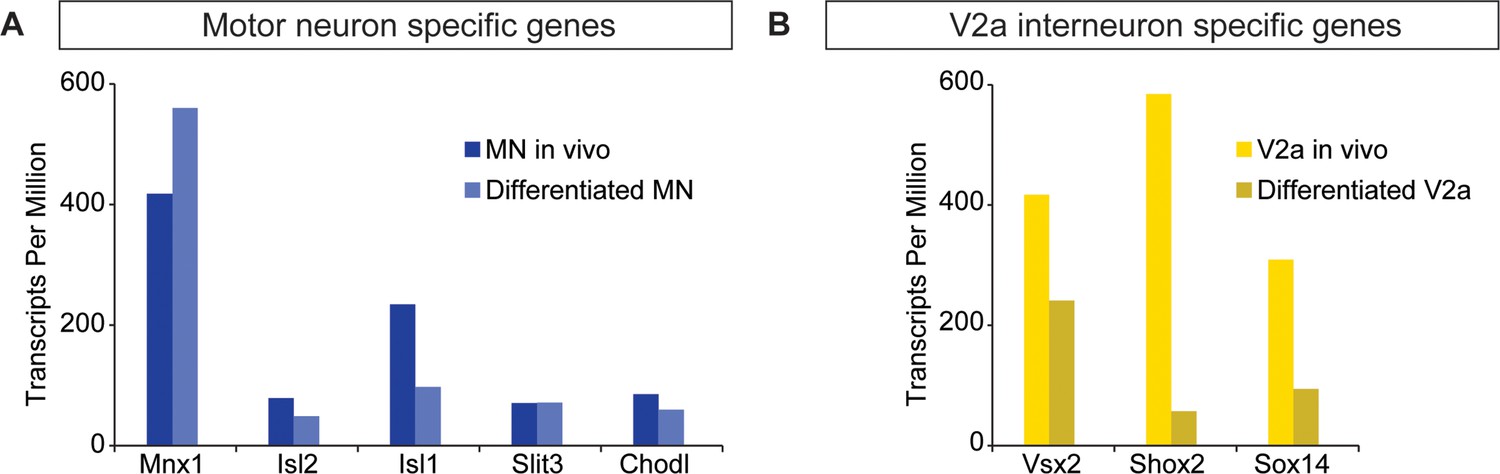
(A–B) Motor neurons and V2a interneurons were differentiated from Hb9:GFP and Chx10:Cre;R26/C:LSL:Tomato ES cell lines, respectively. FACS-purified cells were gene-expression profiled using next generation RNAseq. ES-cell-derived motor neurons and V2a interneurons express markers corresponding to motor neurons and V2a cells purified from mouse embryos, respectively.
Figure 1—figure supplement 3

Circuitoid activity and synaptic structures.
(A) Plated ES-cell-derived V3 interneurons labeled with calcium indicator dye (OGB-1, green) and gradient contrast transmitted light (Dodt). Cells simultaneously recorded with electrode and calcium imaging circled (red, blue). (B) Simultaneous calcium imaging and electrical recording similarly reveals neuronal activity. (C) V3 interneurons (red) differentiated from Sim1:Cre;LSL:tdTomato ES cells immunostained for VGLUT2 (magenta) and PSD95 (green) form numerous pre- and post-synaptic structures.
Figure 2
Physiological properties of circuitoids.
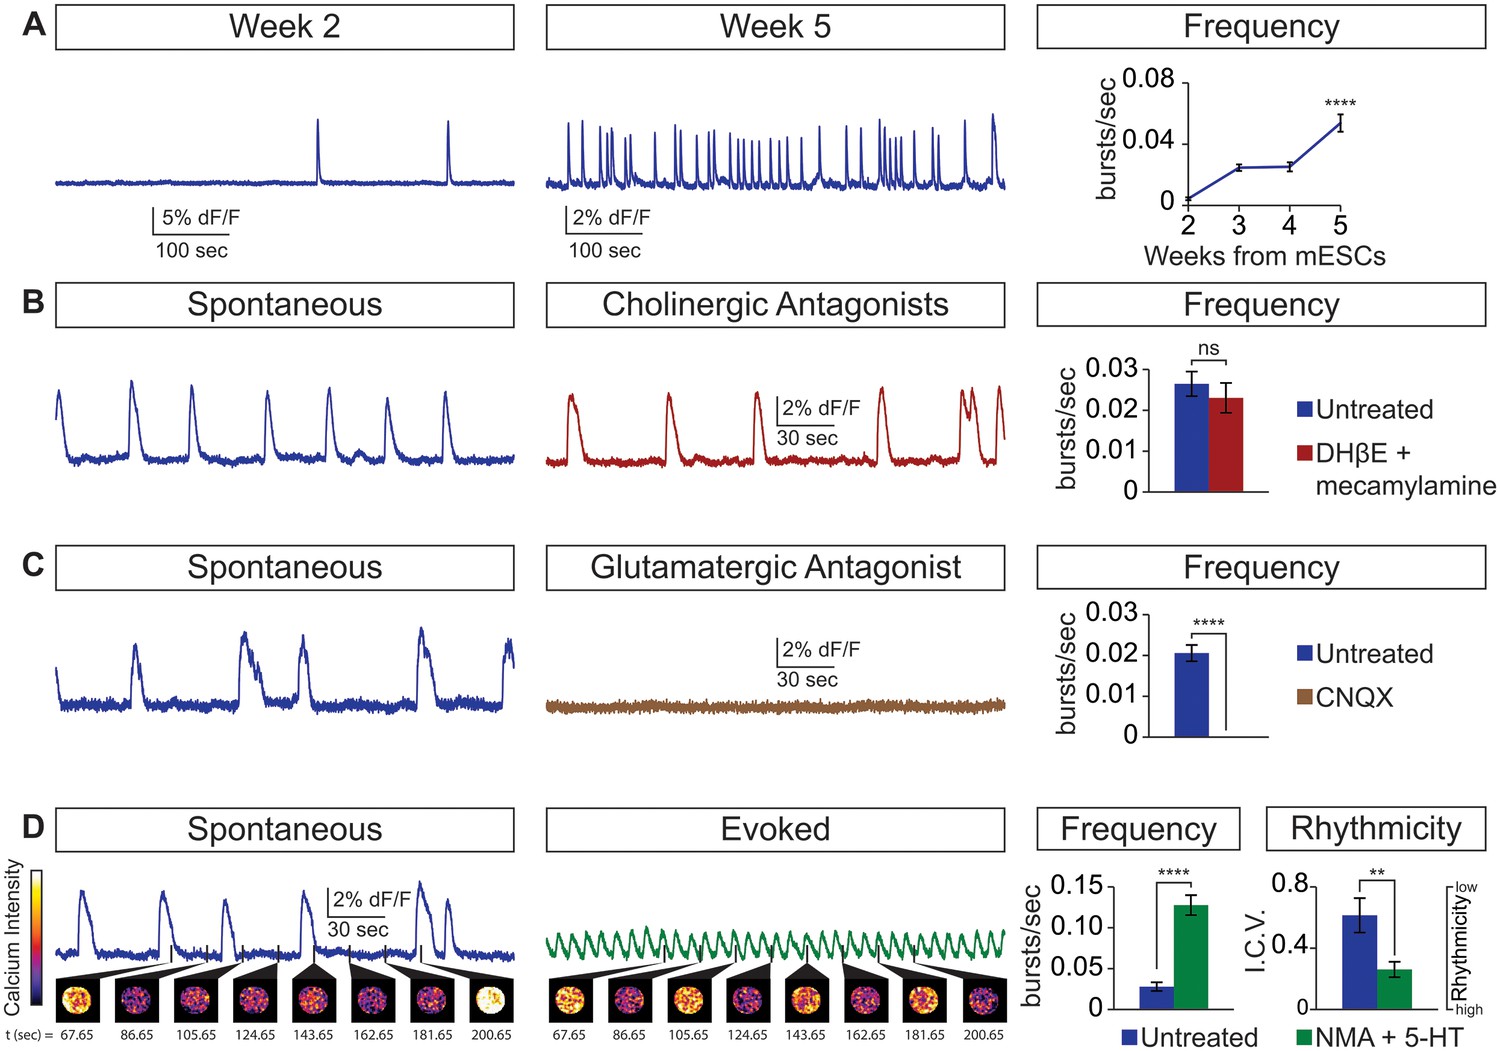
Circuitoids were generated with 1000 nm SAG (CirH) for analysis using calcium imaging with a ubiquitously expressed GCaMP3 ES cell line. (A) Spontaneous bursting frequency increased from week 2 to 5. Mean ± SEM, Week 2 n = 78; Week 3 n = 60; Week 4 n = 46; Week 5 n = 48; ****p<0.0001, unpaired t test. (B–D) Activity recorded 15–17 days post ES cell differentiation. (B) Cholinergic antagonists DHβE and mecamylamine (red) do not block activity. Mean ± SEM, n = 17 circuitoids, ns p=0.31, paired t test. (C) Glutamatergic antagonist CNQX (brown) abolishes bursting. Mean ± SEM, n = 16 circuitoids; ****p<0.0001, paired t test. (D) CPG evoking drugs NMA and 5-HT increase the frequency and rhythmicity of circuitoids compared to spontaneous activity. Rhythmicity measured using interval coefficient of variation (I.C.V.; low values indicate high rhythmicity). Mean ± SEM, n = 18 circuitoids; ****p<0.0001, **p<0.01, paired t test.
Figure 3
Cellular composition influences circuitoid rhythmicity and burst speed.
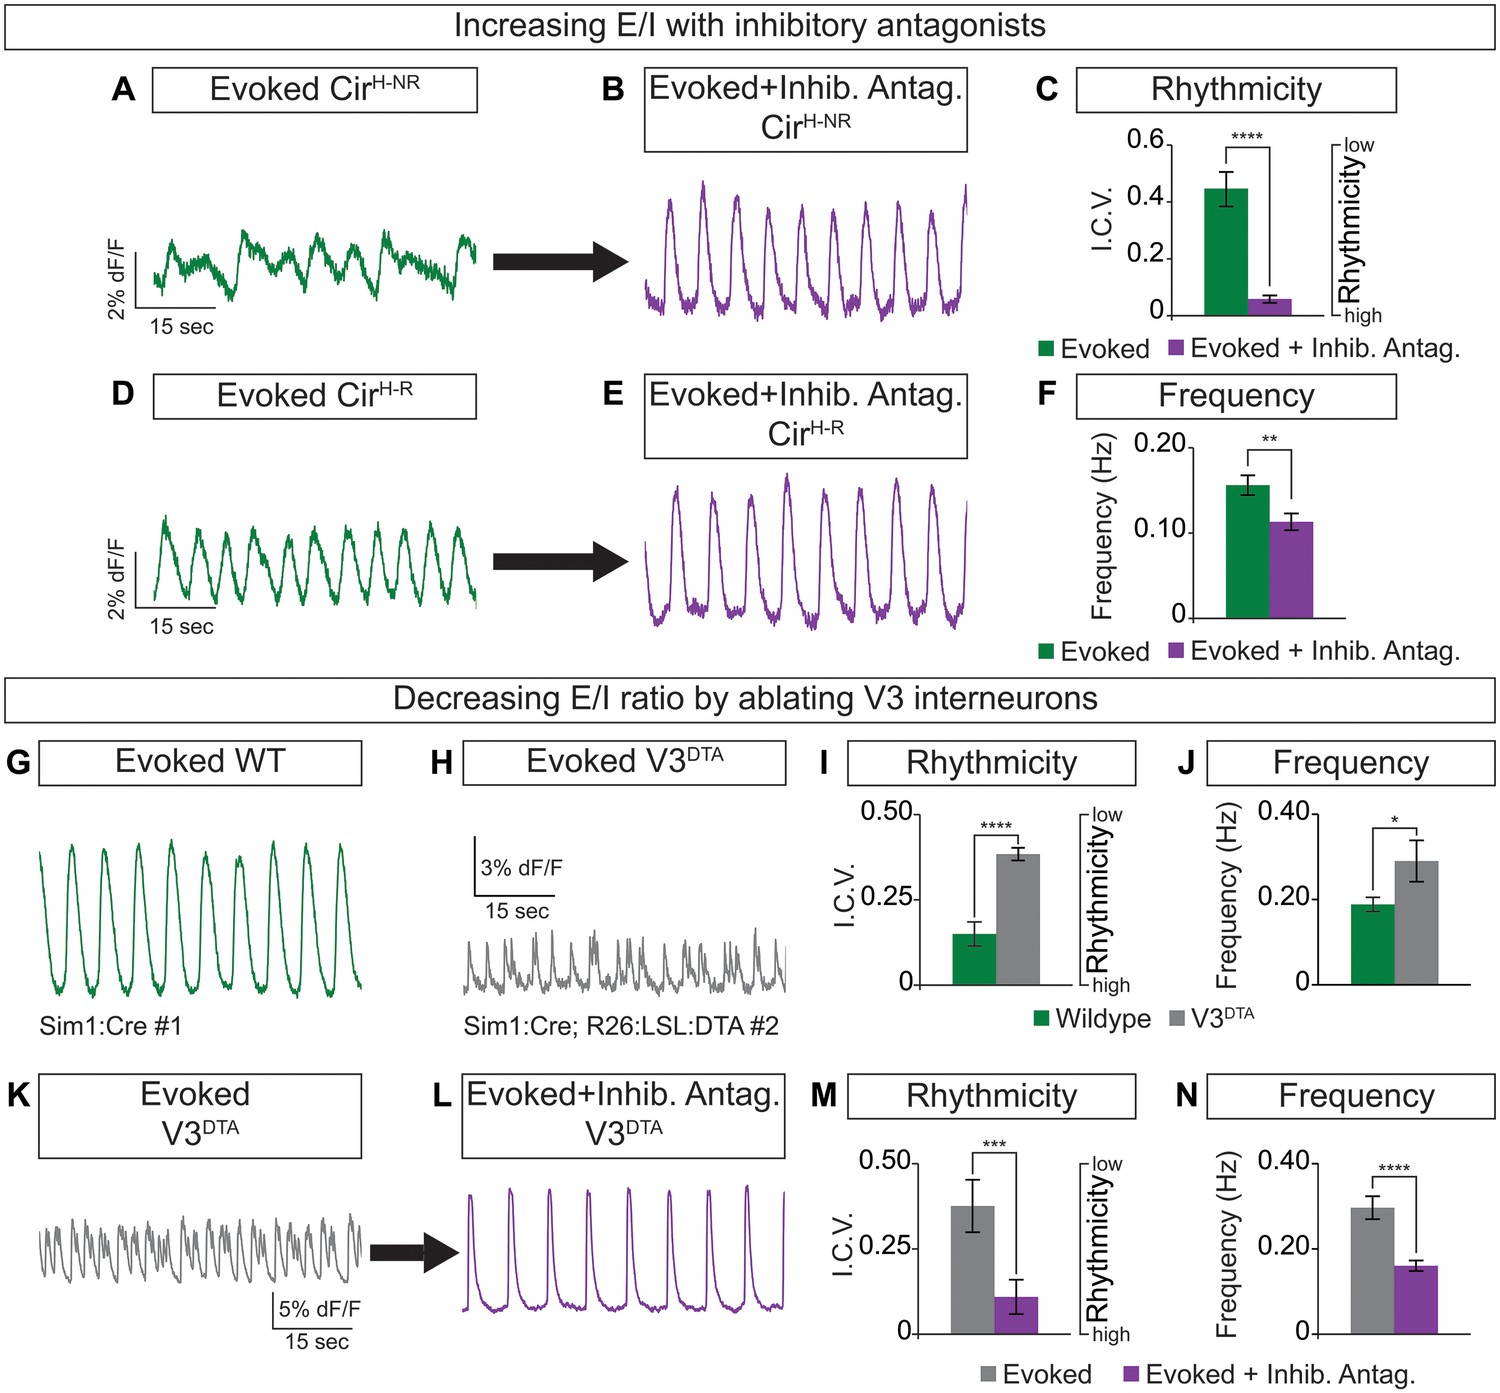
(A–F) Circuitoids generated with 1000 nM SAG (CirH) were recorded in drugs that evoke CPG activity (evoked, NMA +5 HT, green) 16–17 days post ES cell differentiation. Activity was classified as either rhythmic (CirH-R, I.C.V.<0.2) or non-rhythmic (CirH-NR, I.C.V.>0.2). (A) Irregular bursting CirH-NR sphere. (B) CirH-NR bursting after application of inhibitory antagonists strychnine and picrotoxin (purple). (C) CirH-NR bursting becomes more rhythmic (lower I.C.V.) when inhibitory synaptic transmission is blocked. Mean ± SEM, n = 14 circuitoids, paired t test ****p<0.0001. (D) Bursting activity of CirH-R sphere. (E) Bursting activity of CirH-R after application of inhibitory antagonists strychnine and picrotoxin (purple). (F) CirH-R burst frequency decreases when inhibitory synaptic transmission is blocked. Mean ± SEM, n = 9 circuitoids, paired t test **p<0.01. (G–N) Circuitoids generated from the V3DTA ES cell line (derived from Sim1:Cre;R26:LSL:DTA) with 1000 nM SAG (CirH) were recorded in drugs that evoke CPG activity (evoked, NMA +5 HT, green) 16–17 days post differentiation. (G) Control (Sim1:Cre, WT, green) circuitoid bursting. (H) V3DTA bursting (grey) in circuitoids lacking V3 interneurons. (I) V3DTA bursting is less rhythmic and (J) more frequent. (K–N) V3DTA bursting becomes more rhythmic and less frequent with inhibitory antagonists strychnine and picrotoxin (purple). (G–J) WT n = 5 independent differentiations n = 69 circuitoids. V3DTAn = 5 independent differentiations n = 85 circuitoids. Mean ± SEM, unpaired t test: *p<0.05, ****p<0.0001. (K–N) n = 18 circuitoids, mean ± SEM, paired t test: ***p<0.001; ****p<0.0001.
Figure 4 with 3 supplements
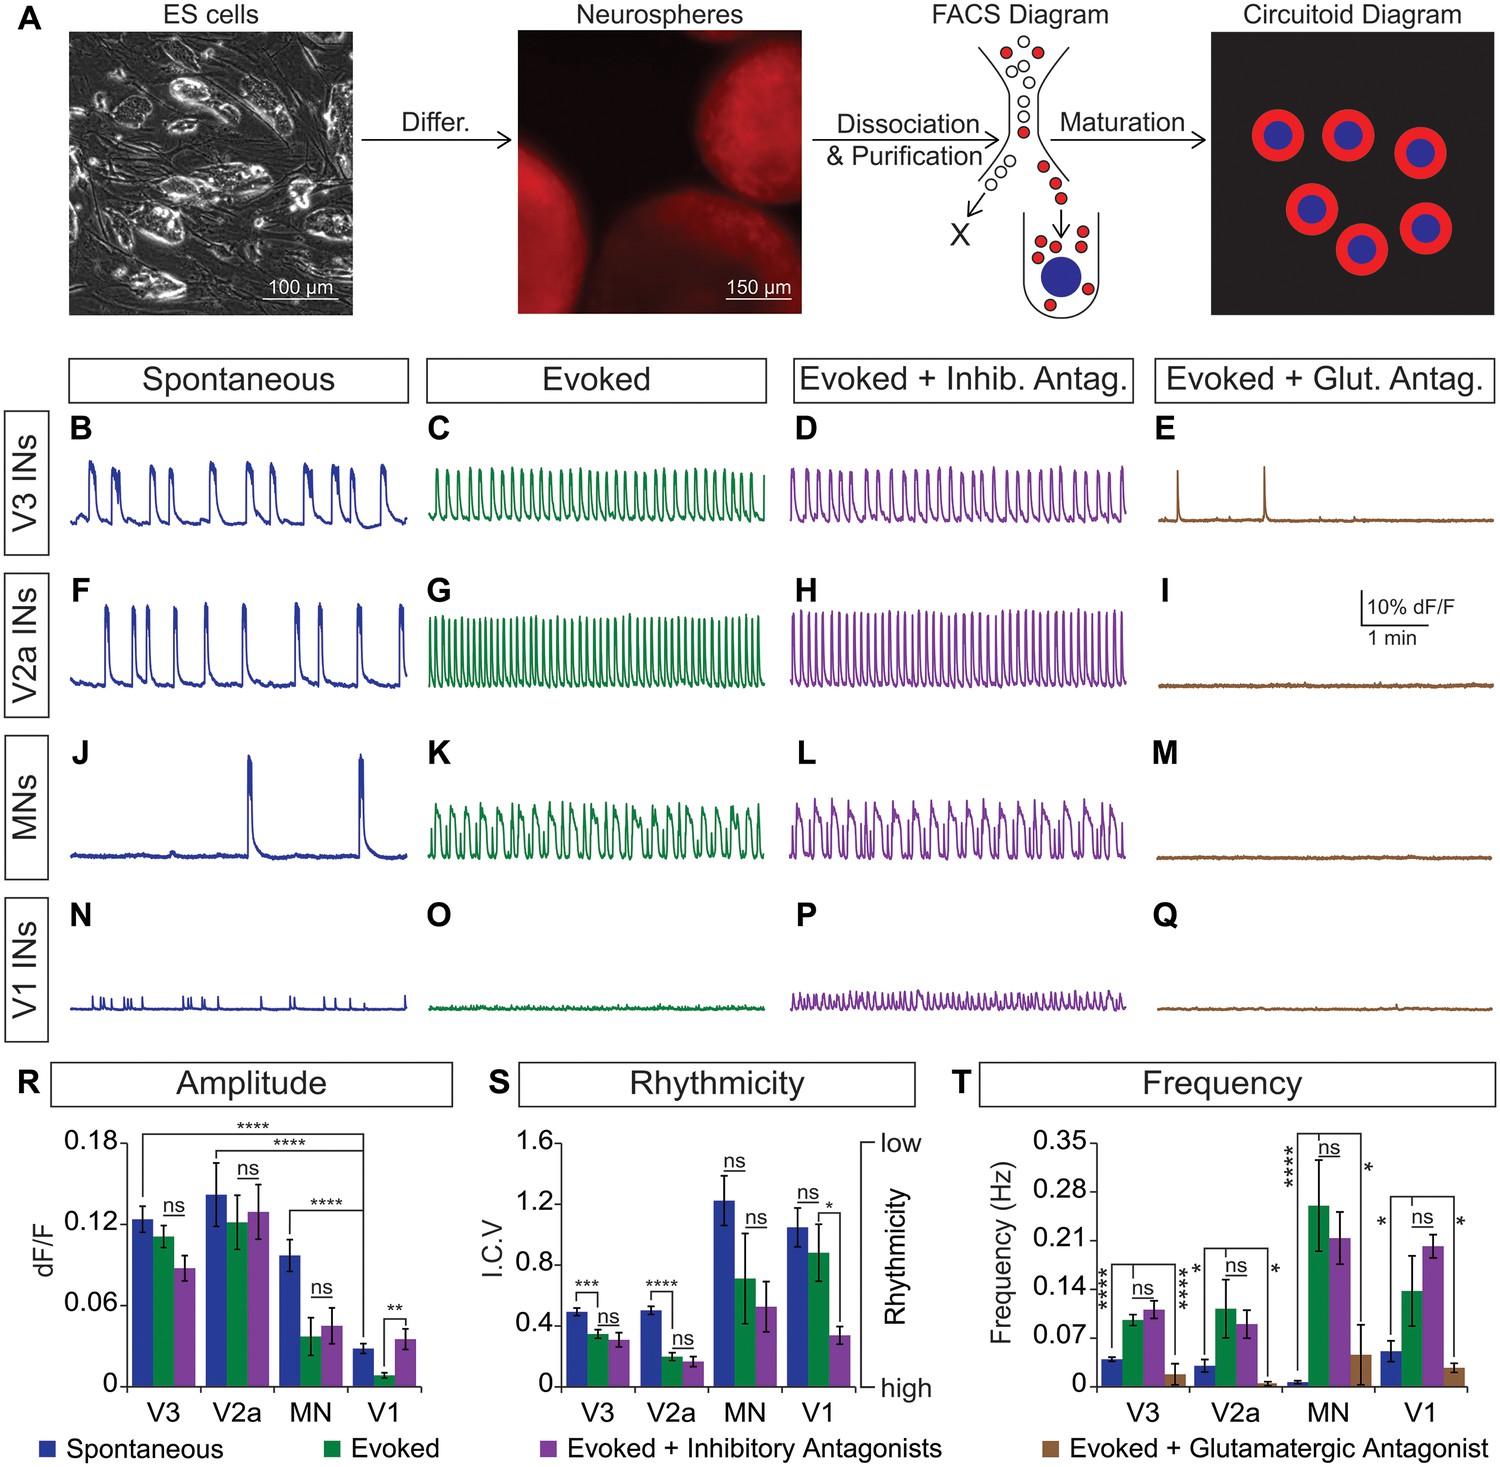
Rhythmic activity in networks with purified neuron subclasses.
(A) Circuitoids of defined cellular composition were created by re-aggregating FACS purified ES cell-derived neurons (red) with astrocytes (blue) following the outlined scheme. (B–Q) Bursting activity of neuronal subclasses measured with calcium dyes under various conditions: spontaneous (blue), evoked (NMA +5 HT, green), evoked + inhibitory antagonists (NMA +5 HT + strychnine + picrotoxin, purple), and evoked + glutamatergic antagonist (NMA +5 HT + CNQX, brown). (R) Spontaneous burst amplitude of V1 interneurons is lower than V3, V2a, and motor neuron circuitoids. Evoked burst amplitudes were unaffected by inhibitory antagonists with V3, V2a, and motor neuron networks. Mean ± SEM, {number} of independent differentiations and [number] of circuitoids indicated after each cell type. V3 interneurons (INs) {22}[175], V2a interneurons {5}[49], motor neurons (MNs) {11}[49], V1 interneurons {12}[42]. Unpaired t test: (ns) p>0.05; **p<0.01; ****p<0.0001. (S) V3 and V2a interneuron rhythmicity increased (I.C.V. decreased) under the evoked condition compared to spontaneous bursts. Mean ± SEM, {number} of independent differentiations and [number] of circuitoids indicated after each cell type. V3 {22}[175], V2a {5}[49], MN {11}[49], V1 {12}[42]. Paired t test: (ns) p>0.05; *p<0.05; ***p<0.001; ****p<0.0001. (T) Burst frequency increases in the evoked condition and decreases with glutamatergic antagonist CNQX. Mean ± SEM, {number} of independent differentiations and [number] of circuitoids indicated after each cell type. V3 {22}[175], V2a {5}[49], MN {11}[49], V1 {12}[42]. Paired t test: (ns) p>0.05; *p<0.05; ***p<0.001; ****p<0.0001.
Figure 4—figure supplement 1
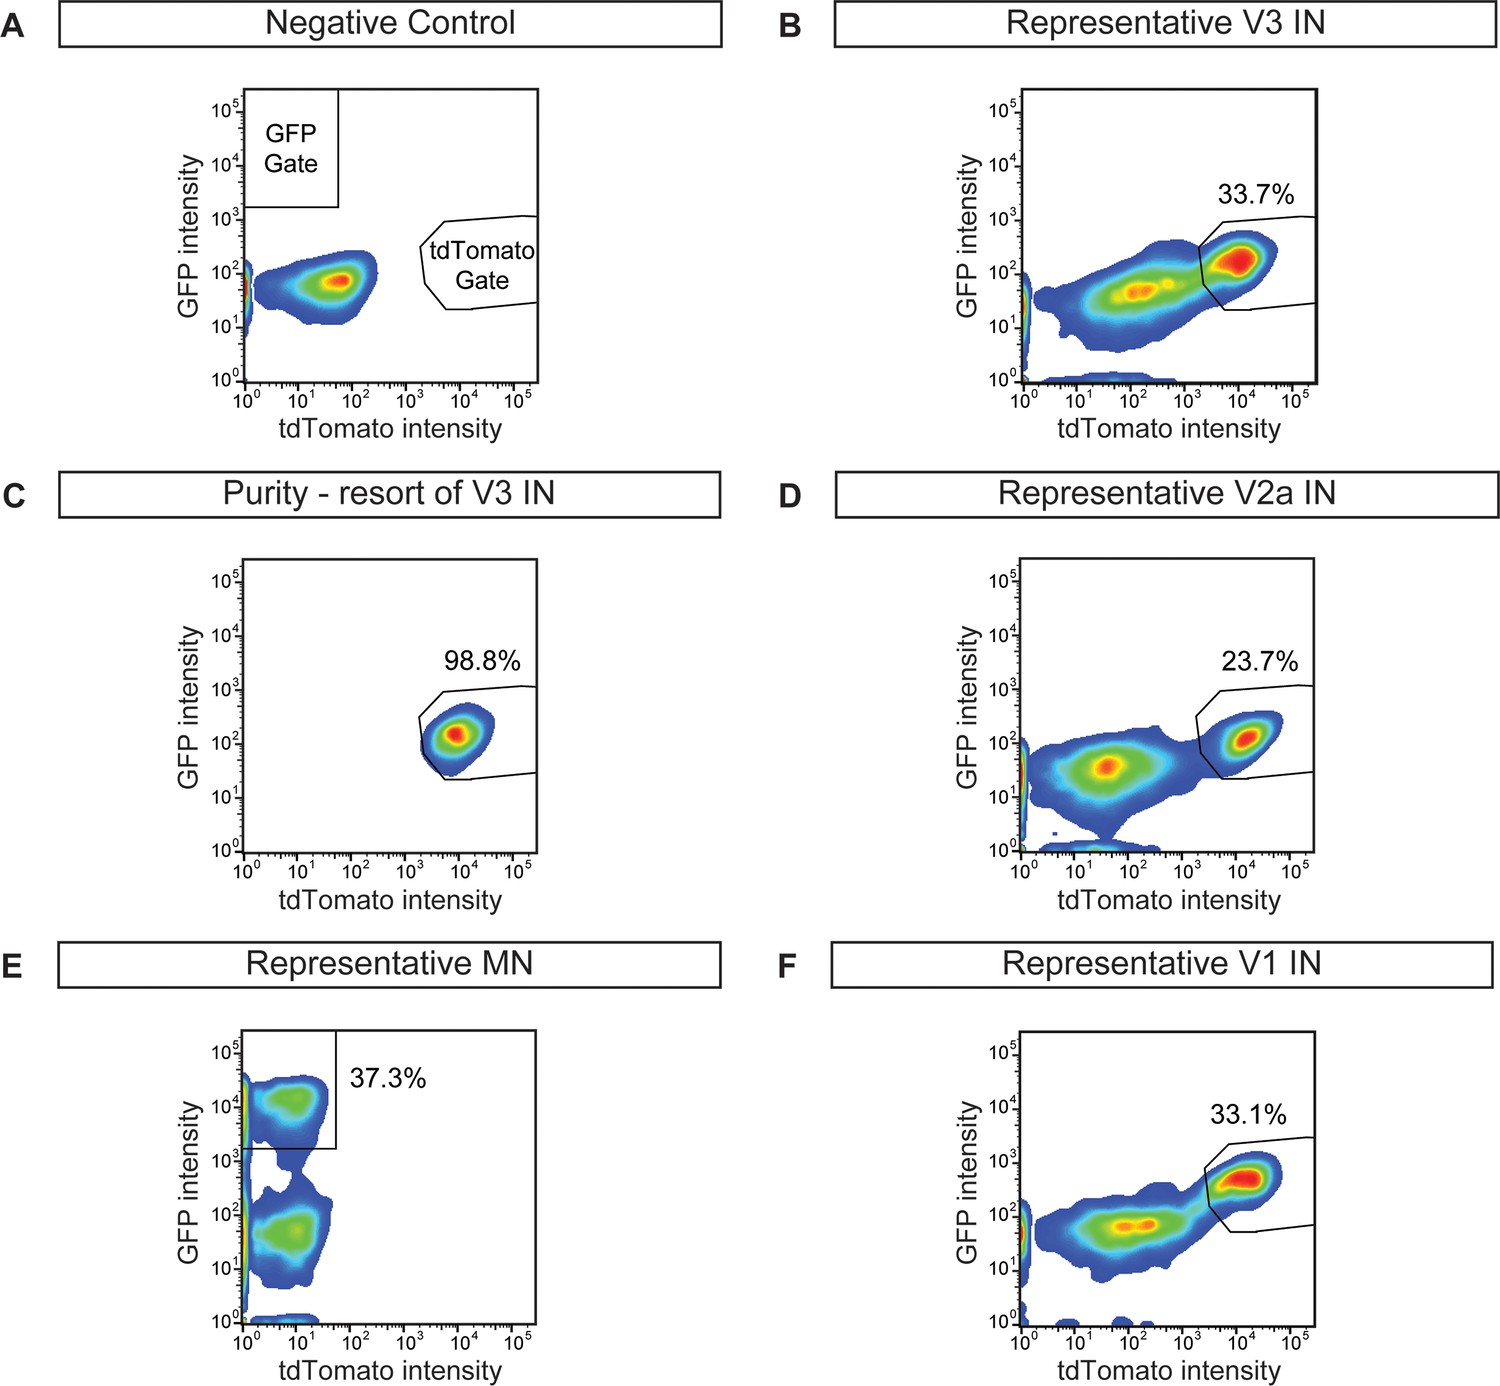
Cell purifications to generate synthetic neural networks.
ES cells were differentiated, dissociated, and neuronal subtypes were FACS purified to evaluate differentiation efficiency and purity. (A) Wild-type non-fluorescent cell line, negative control. (B) V3 interneuron purification (Sim1:Cre;R26/C:LSL:Tomato). (C) Resorting of purified V3 interneurons from (B) reveals 98.8% purity. (D) V2a interneuron (Chx10:Cre;R26/C:LSL:Tomato) sort. (E) Motor neuron (Hb9:GFP) sort. (F) V1 interneuron (En1:Cre;R26/C:LSL:Tomato) sort.
Figure 4—figure supplement 2
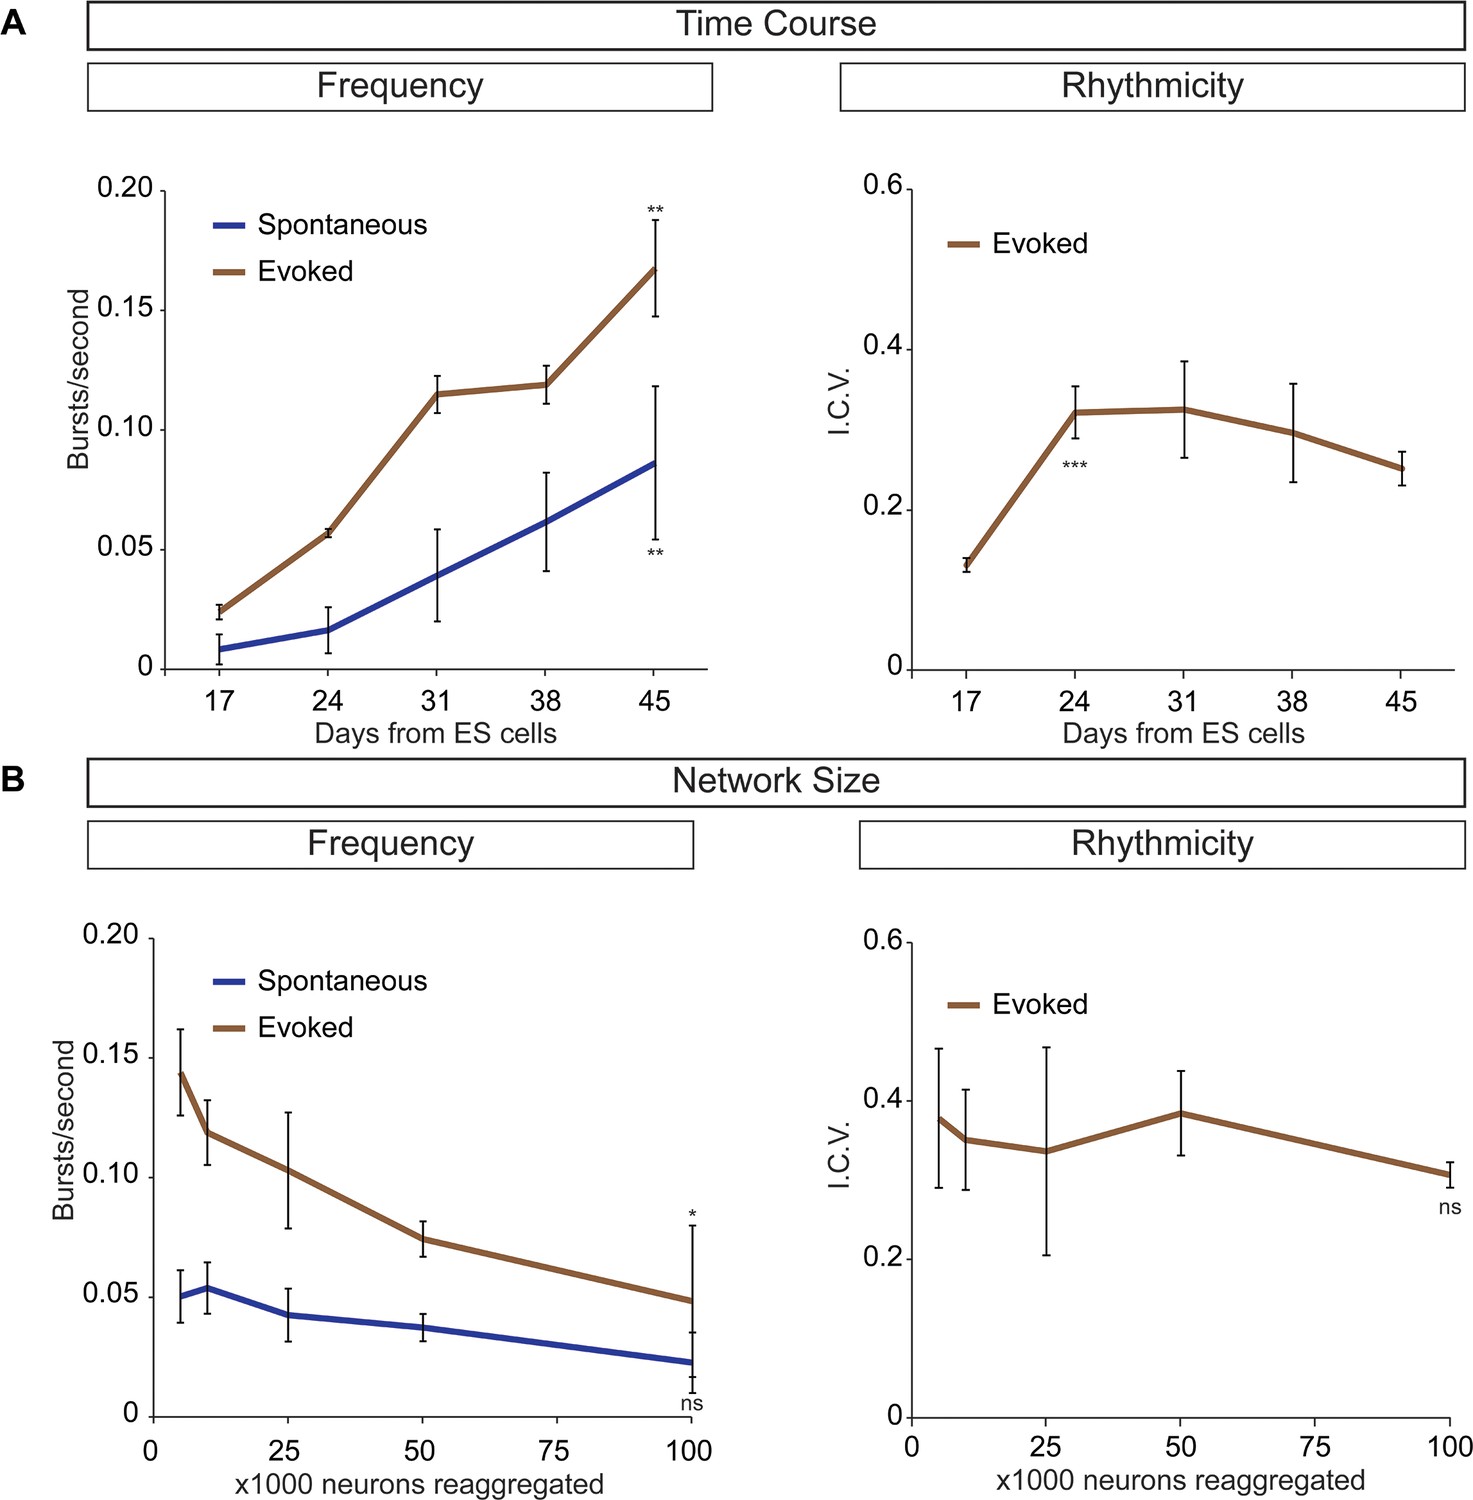
Frequency and rhythmicity of V3 interneuron networks.
(A) Sim1:Cre;R26/C:LSL:Tomato ES cell lines were differentiated and cell sorted. 50,000 V3 interneurons were aggregated and calcium imaged at weekly intervals. Spontaneous and evoked bursting frequency increases as networks mature. Evoked bursting is rhythmic by D17 and stable at D24, roughly corresponding to the gestational period of a mouse embryo. Mean ± SEM, four independent differentiations and ≥19 circuitoids measured for each time point. Unpaired t test **p<0.01, ***p<0.001. (B) Sim1:Cre;R26/C:LSL: Tomato ES cell lines were differentiated and cell sorted. 5000 to 100,000 V3 interneurons were reaggregated and bursting activity was recorded three weeks later using calcium dyes. Network cell number does not affect spontaneous burst frequency or the regularity of evoked rhythmicity (I.C.V.), but burst frequency decreases slightly as network size increases in the evoked condition. Mean ± SEM, four independent differentiations and ≥23 circuitoids measured for each network size. Unpaired t test (ns) p>0.05, *p<0.05.
Figure 4—figure supplement 3
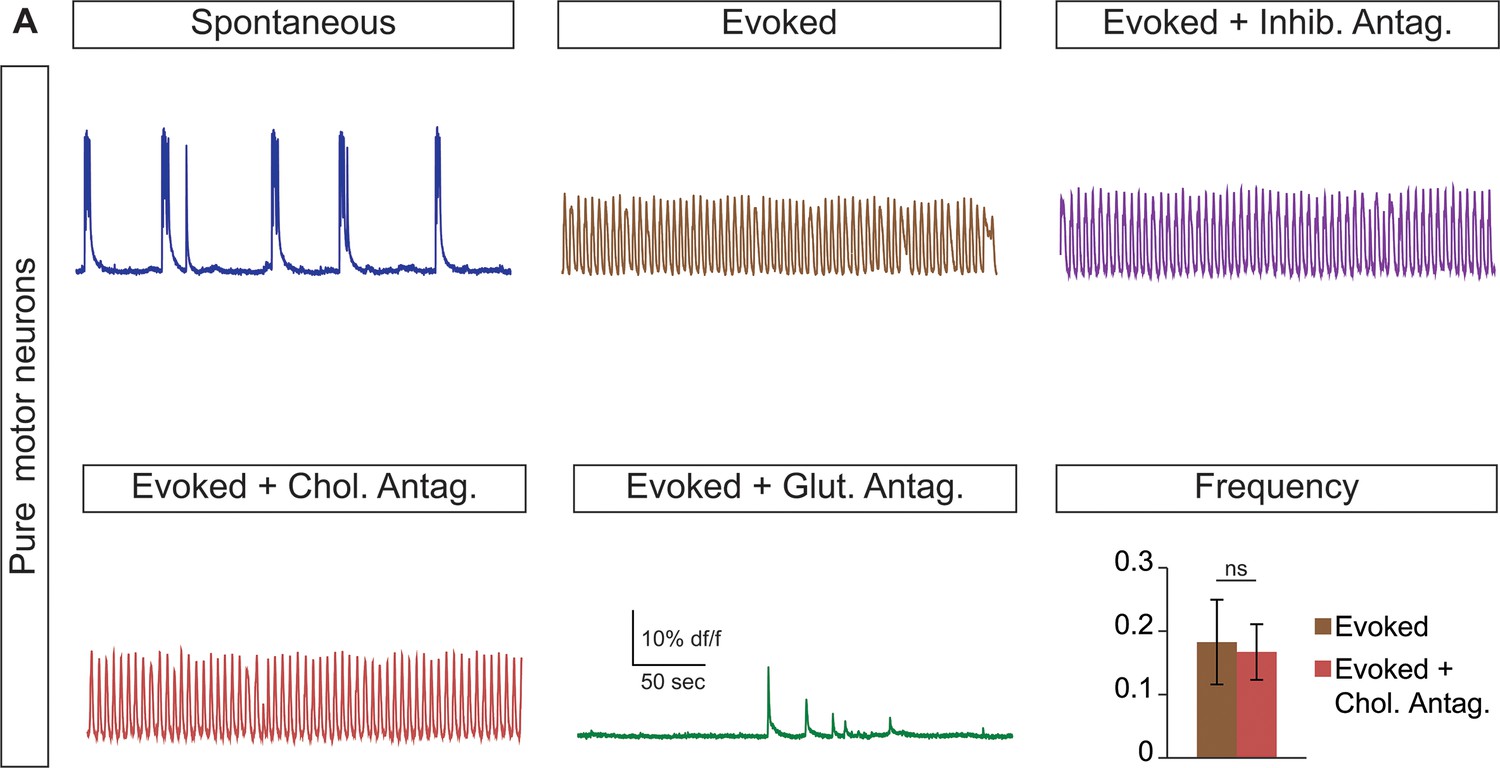
Cholinergic antagonists do not affect motor neuron networks.
(A) Hb9:GFP ES cell lines were differentiated and purified with FACS to create pure motor neuron networks. Three weeks after reaggregation spontaneous and evoked bursts were detected with calcium dye imaging. Neither cholinergic antagonists (DHβE and mecamylamine) nor inhibitory antagonists (strychnine + picrotoxin) disrupt the bursts, whereas glutamatergic antagonist (CNQX) blocks activity. Mean ± SEM, four independent differentiations and 47 circuitoids measured, paired t test (ns) p=0.52.
Figure 5 with 1 supplement
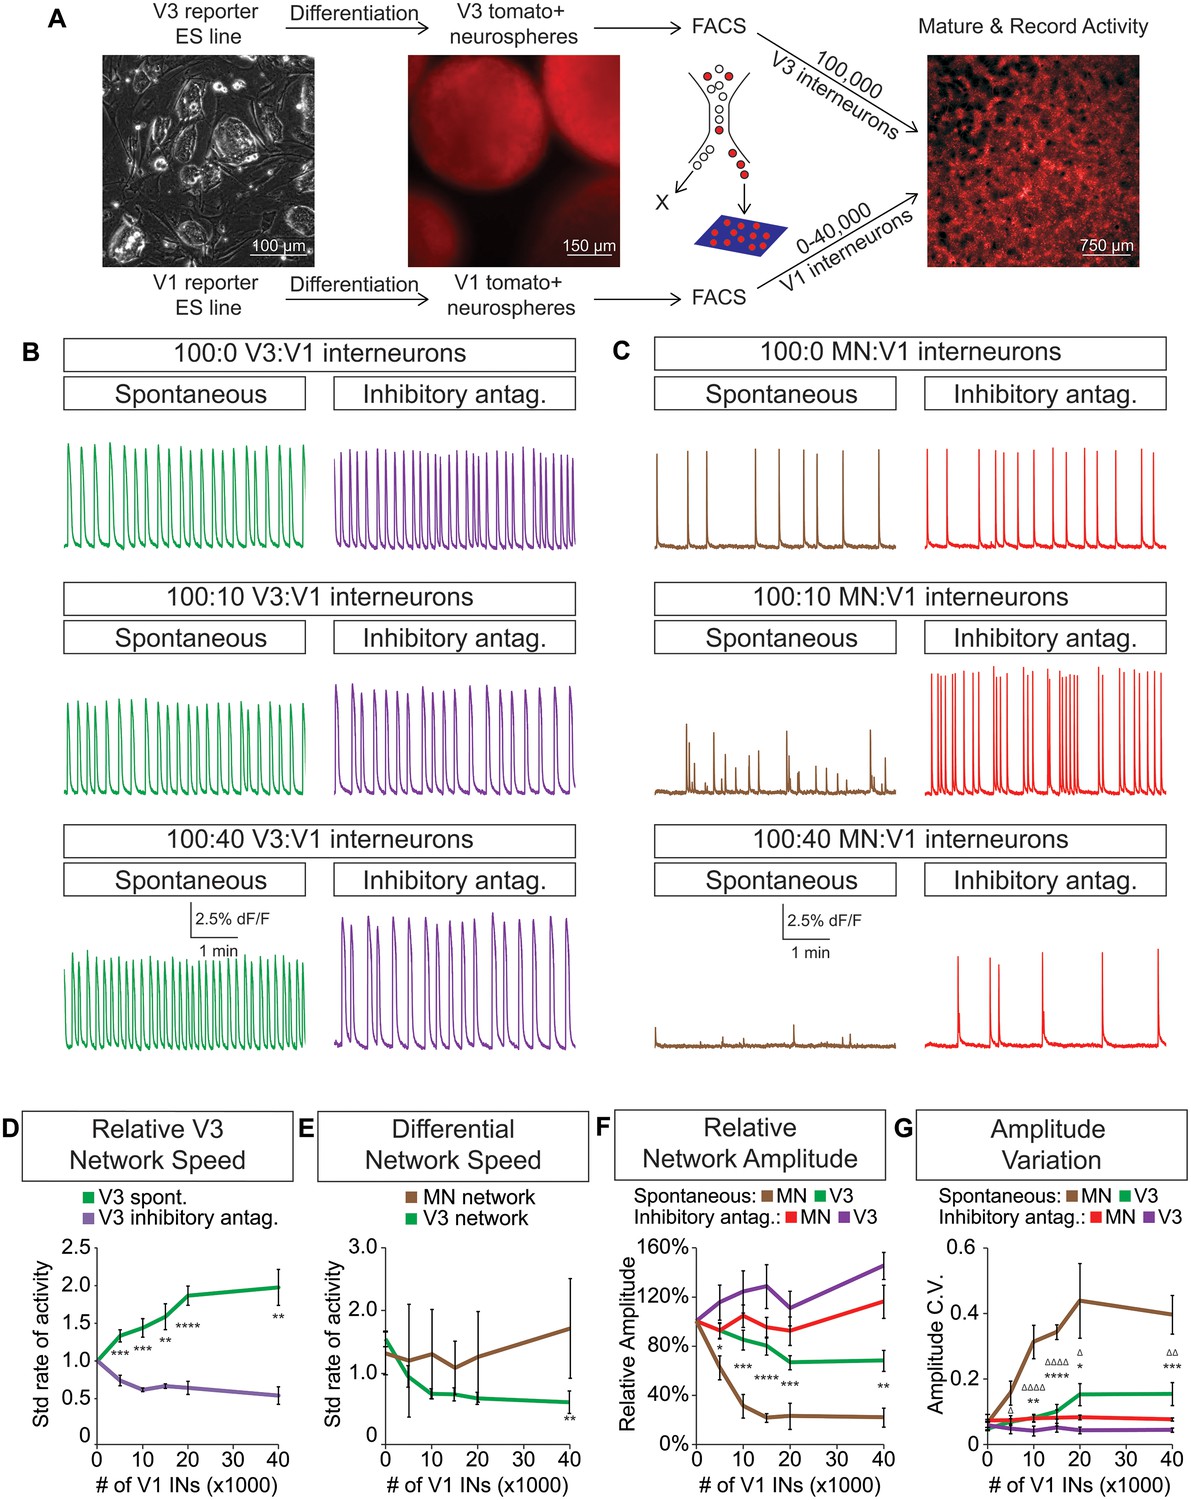
V3 network burst speed is tuned by inhibitory V1 interneurons.
(A) ES cell lines with fluorescent reporters for neuronal subtypes were differentiated, and tomato +V3 and V1 interneurons were purified by FACS. Monolayer circuitoids were created by plating 100,000 V3 interneurons with 0–40,000 V1 cells onto astrocytes. Activity was recorded using calcium indicator dye to image co-culture networks 14 days after plating. (B) Spontaneous network bursting increases as the number of inhibitory V1 interneurons increases in the V3 interneuron cultures (green). Network frequency returns to baseline levels in the presence of inhibitory antagonists strychnine + picrotoxin (purple). (C) Motor neuron burst frequency does not increase as the concentration of V1 interneurons increases, but the amplitude of the bursts decreases (brown). Inhibitory antagonists strychnine + picrotoxin return motor neuron network burst amplitude to normal levels (red). (D) Quantification of burst frequency from traces in (B). For each trial and condition, the standardized rate of activity was calculated by dividing the burst frequency of each network by the control network’s (lacking V1 cells) rate. Mean ± SEM, n = 10 networks for each V1 concentration in the spontaneous condition, n = 4 networks with inhibitory antagonists for each V1 concentration. Unpaired t test: *p<0.05, **p<0.01, ***p<0.001, ****p<0.0001. (E) Quantification of relative burst rate from traces in (B, C). Standard rate of activity was calculated by taking the ratio of a network’s frequency in the inhibitory antagonist condition to its frequency in the spontaneous condition. Mean ± SEM, n = 6 motor neuron networks and n = 4 V3 interneuron networks at 0 and 40,000 V1 interneurons, unpaired t test: (ns) p=0.63; **p<0.01. (F) Quantification of relative burst amplitude from traces in (B, C). Mean ± SEM, n = 10 V3 networks vs n = 7 MN networks for each V1 concentration tested, unpaired t test: **p<0.01; ***p<0.001; ****p<0.0001. (G) Amplitude coefficient of variation (C.V., Materials and methods) calculated from network activity in (B, C). Motor neuron burst amplitude C.V. increased as V1 inhibitory cell number increased. Mean ± SEM, n networks in the (spontaneous) and [inhibitory antagonist] condition for V3 networks (10)[4] and MN networks (8)[≥4] at all V1 interneuron concentrations. MN spontaneous vs MN inhibitory antagonist (*) and MN spontaneous vs V3 spontaneous (Δ). Δ/*p<0.05; ΔΔ/**p<0.01; ***p<0.001; ΔΔΔΔ/****p<0.0001; unpaired t test.
Figure 5—figure supplement 1
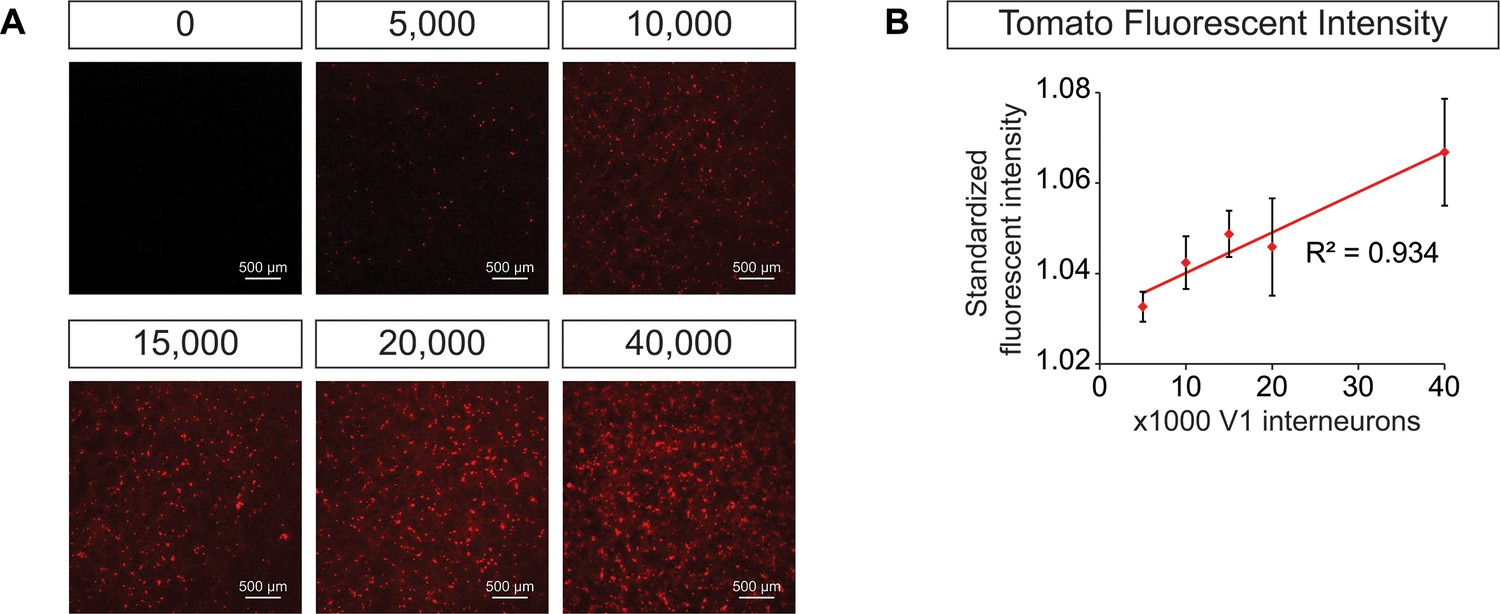
Generation of synthetic networks comprised of defined neuronal subtypes.
Hb9:GFP ES cell lines were differentiated and GFP+ motor neurons purified using FACS to generate base networks of 100,000 motor neurons. In parallel, En1:Cre;R26/C:LSL:Tomato ES cell lines were differentiated and tomato +V1 inhibitory neurons purified using FACS. 0 to 40,000 V1 interneurons were added to the base motor neuron networks. (A) Fluorescent images of synthetic networks confirming graded numbers of tomato+ cells (red) in the co-cultures. (B) Tomato+ signal quantification in the co-cultures. Mean ± SEM, n = 7 networks per condition.
Figure 6 with 1 supplement
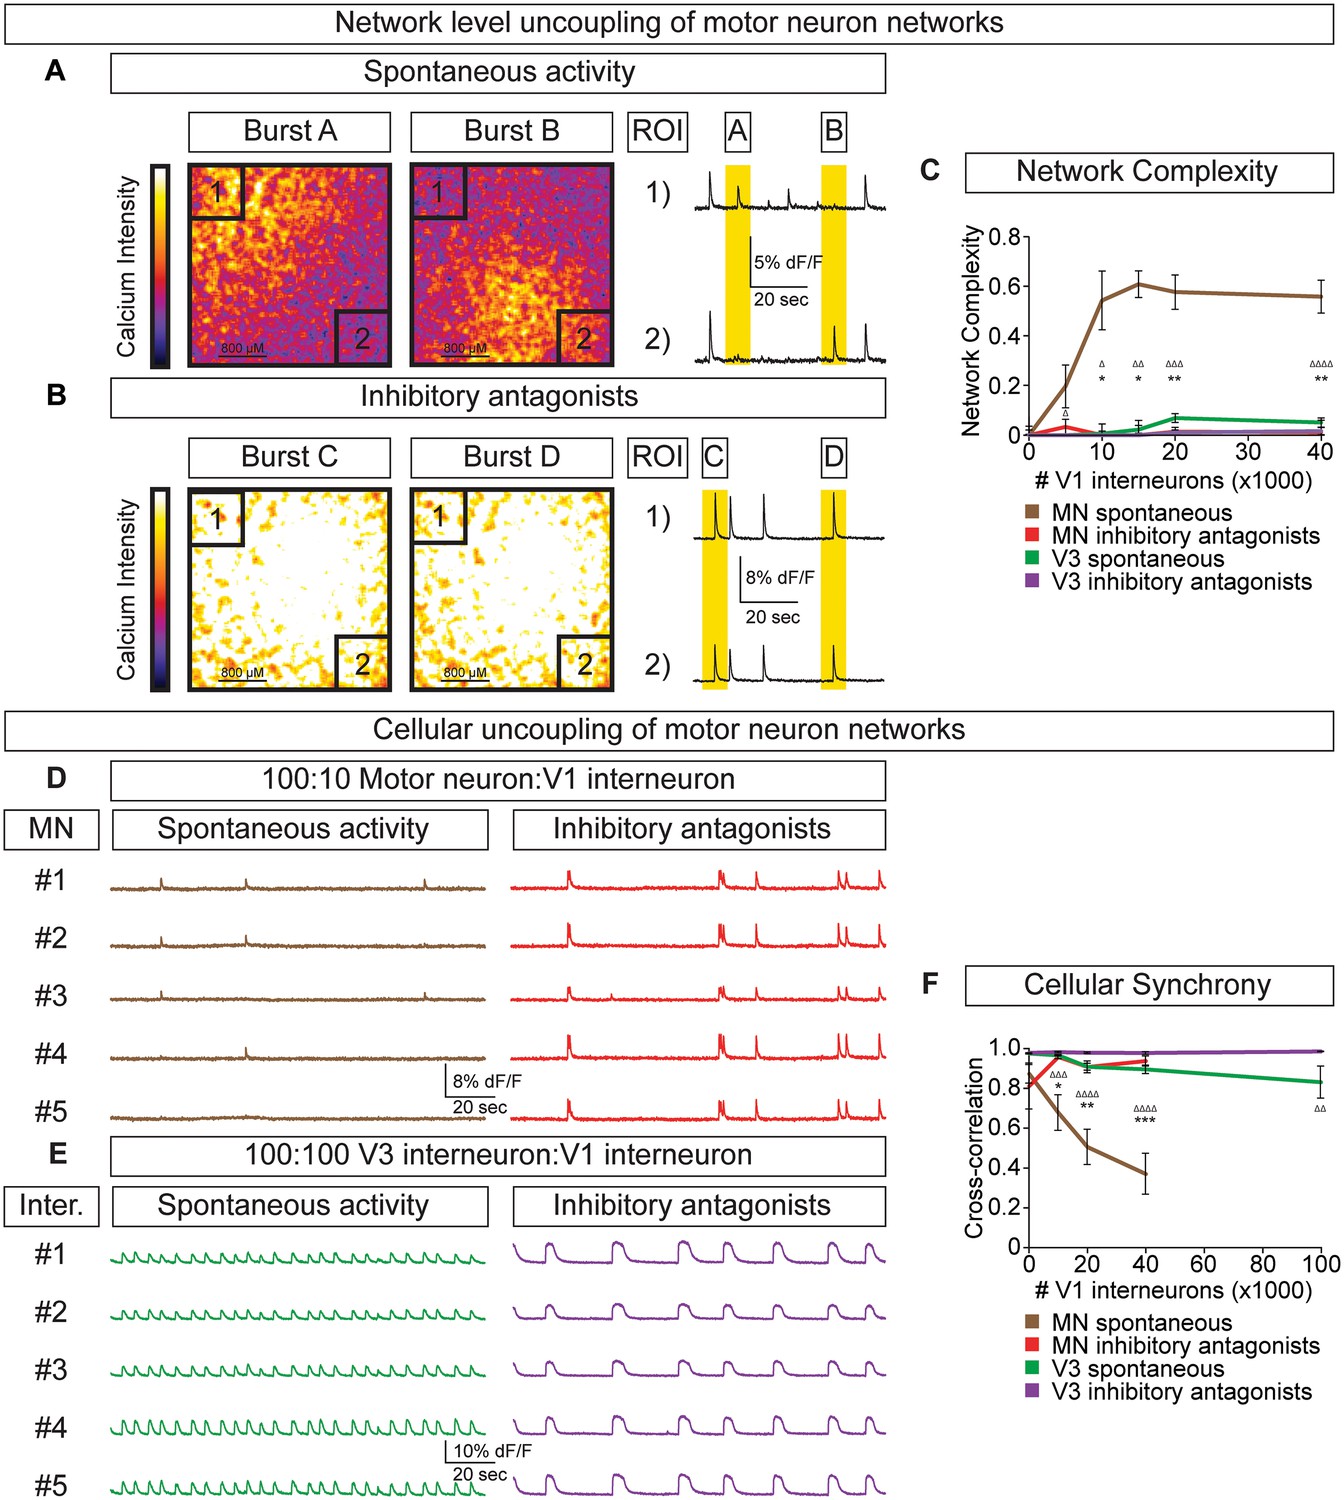
V1 interneurons control the segmentation of motor neuron network activity.
Circuitoids were established with either 100,000 motor neurons or 100,000 V3 interneurons combined with 0–40,000 V1 interneurons, plated on astrocytes. Networks were imaged 14 days after sorting with a calcium indicator dye and the static frames show pseudocolored calcium intensity (dF/F) images (scale from black to white). (A) Neurons within plated circuitoids (10,000 V1 interneurons and 100,000 motor neurons) fire asynchronously. Static frames during Burst A and B reveal different areas of activity in the network. Traces from two regions of interest (ROI 1 and 2) on opposite corners of the field of view are displayed. (B) Inhibitory antagonists (strychnine + picrotoxin) applied to the network in (A) lead to synchronous bursts across the entire network. (C) Quantification of network complexity (Materials and methods) calculated from network activity. V1 interneurons increase network complexity of motor neuron networks. Median ± bootstrap standard error, n networks in the (spontaneous) and [inhibitory antagonist] condition for V3 networks (10)[4] and MN networks (8)[≥4] at all V1 interneuron concentrations. MN spontaneous vs MN inhibitory antagonist (*) and MN spontaneous vs V3 spontaneous (Δ). Δ/*p<0.05; ΔΔ/**p<0.01; ΔΔΔp<0.001; ΔΔΔΔp<0.0001 Kolmogorov–Smirnov test. (D) 100,000 purified GFP+ motor neurons were cocultured with 10,000 tomato +V1 inhibitory neurons. Calcium imaging was used to detect bursts from five individual GFP+ motor neurons. Individual cells displayed coupled activity (brown), but the entire cohort of motor neurons only became synchronously active when V1 inhibition was blocked with strychnine + picrotoxin (red). (E) 100,000 purified V3 interneurons were cocultured with 100,000 V1 cells, and five individual cells were calcium imaged. Individual interneurons consistently fired together whether V1 cells were active (green) or silenced with inhibitory antagonists (purple). (F) Quantification of neuronal synchrony using pair-wise cross-correlation analysis of motor neurons in motor neuron-V1 networks and interneurons in V3-V1 networks. The activity within motor neuron networks became increasingly less synchronized as V1 cell number increased. Mean±SEM, sample size n=(network number)[neuron number]. V3 network, spontaneous burst condition: 0–40,000 V1 cells (10)[200], 100,000 V1 cells (4)[80]. V3 network, inhibitory antagonist condition: 0–40,000 V1 cells (4)[80], 100,000 V1 cells (2)[40]. MN network, spontaneous burst condition, each V1 concentration tested (≥7)[≥140]. MN network, inhibitory antagonist condition, each V1 concentration tested (6)[120]. MN spontaneous vs MN inhibitory antagonist (*) and MN spontaneous vs V3 spontaneous (Δ) all compared at same V1 concentration, except for spontaneous 100,000 V1 in V3 network vs 40,000 V1 in MN network. Δ/*p<0.05; ΔΔ/**p<0.01; ΔΔΔp<0.001; ΔΔΔΔp<0.0001, unpaired t-test.
Figure 6—figure supplement 1
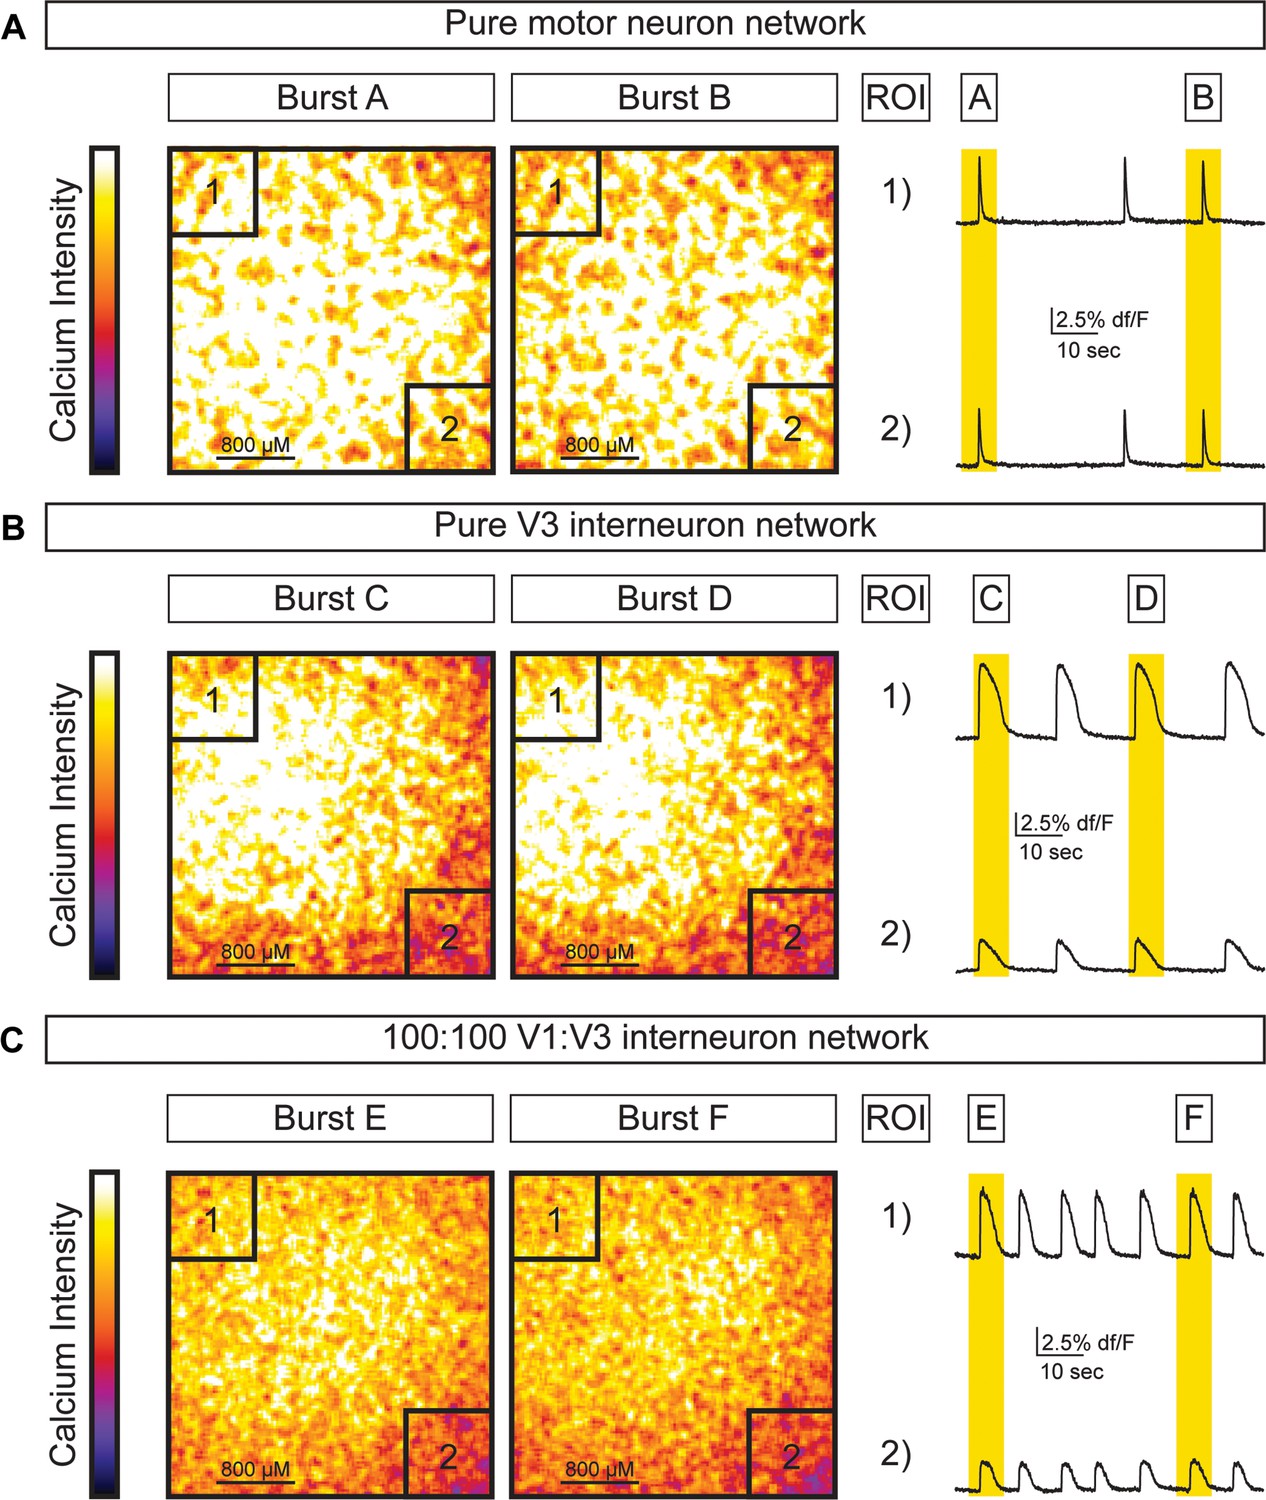
Activity across different network configurations.
Motor neuron networks, V3 interneuron networks, and V3:V1 mixed networks were created by differentiating and sorting 100,000 motor neurons (using Hb9:GFP ES cell lines), 100,000 V3 interneurons (using Sim1:Cre;R26/C:LSL:Tomato ES cell lines), and 100,000 V1 interneurons (using En1:Cre;R26/C:LSL:Tomato ES cell lines) and plating them on astrocytes. Network activity was imaged using calcium indicator dye. (A) Pure motor neuron networks burst synchronously across the network (ROIs are co-active during Burst A and B). (B) Pure V3 interneuron networks burst synchronously across the network (ROIs are co-active during Burst C and D). (C) Networks with a 1:1 mixture of V3:V1 interneurons burst synchronously across the network (ROIs are co-active during Burst E and F).
Figure 7
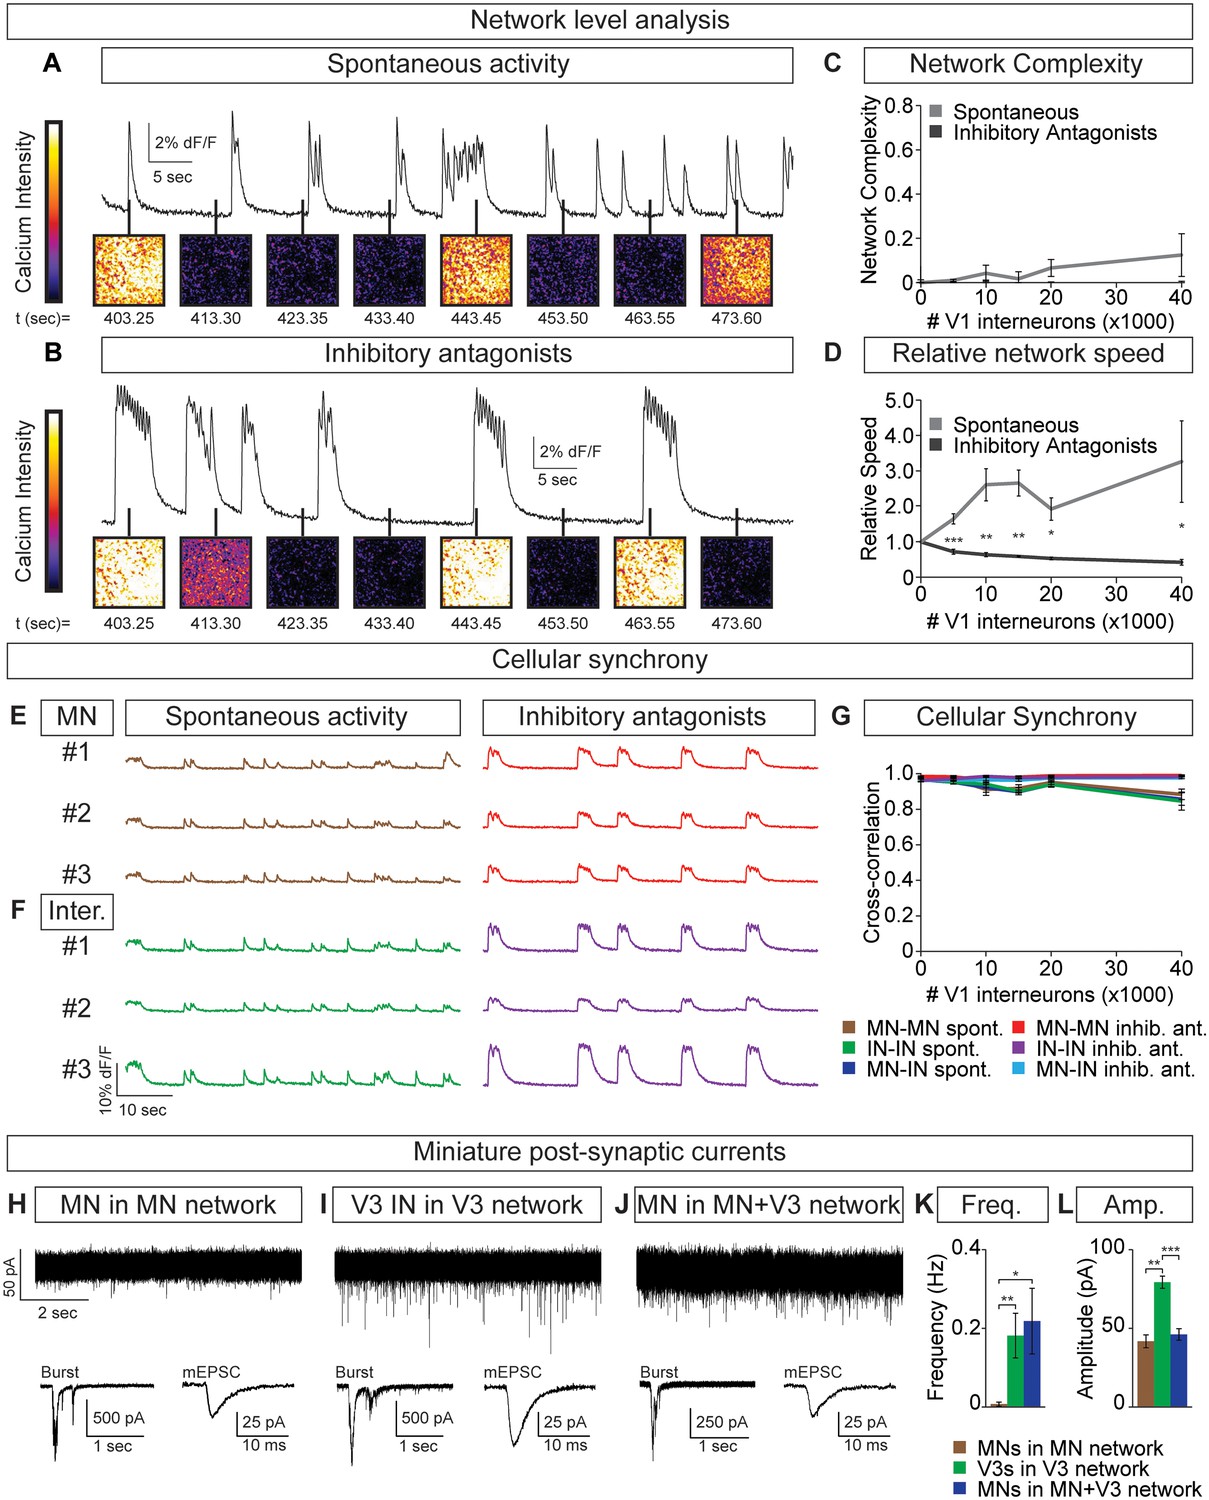
Motor neuron burst frequency is set by V3-V1 network activity.
(A–D) Tripartite networks of 50,000 motor neurons, 50,000 V3 interneurons, and 0–40,000 V1 interneurons were formed, and burst activity monitored using calcium dyes (see Figure 5A). (A) Spontaneous activity of 50,000:50,000 V3-MN network with 40,000 V1 neurons. (B) Spontaneous activity of network in (A) with inhibitory antagonists (strychnine + picrotoxin). (C) Quantification of network complexity (Materials and methods) shows that unlike MN-V1 networks (see Figure 6) MN-V1-V3 networks burst synchronously. Median ± bootstrap standard error, n = 5 for each V1 concentration and condition. (D) Increasing numbers of V1 interneurons in V3-MN networks increases burst frequency. Inhibitory antagonists reduce burst frequency of V1-V3-MN networks. For each trial, the frequency of the networks in each condition was standardized to the burst rate of control V3-MN networks (lacking V1 cells). Mean ± SEM, n = 5 for each V1 concentration and condition. Paired t test: *p<0.05, **p<0.01, ***p<0.001. (E–G) Burst analysis of individual fluorescent-labeled cell types in V1-V3-MN networks prepared as described in (A–D). (E) Motor neuron bursting in a 50,000:50,000 V3-MN network with 40,000 V1 neurons. Spontaneous bursts (brown) and activity with inhibitory antagonists (strychnine + picrotoxin, red) are shown. (F) Interneuron bursting in the same network as (E). Spontaneous burst (green) and activity with inhibitory antagonists (purple) are shown. (G) Neuronal synchrony quantification using pair-wise cross-correlation analysis of MN-MN, IN-IN, and MN-IN activity. The activity of each neuronal combination is highly correlated in V1-V3-MN networks. Mean±SEM, sample size n=(network number)[neuron number] (5)[50] for all cell populations and conditions at each V1 concentration. (H–L) Recordings of miniature post-synaptic currents (mEPSC) in 0.5 μM TTX. (H) Synaptic activity in pure motor neuron network. (I) Synaptic activity in pure V3 interneuron network. (J) Motor neuron mEPSCs in MN-V3 network. (H-J) Insets show synaptic drive associated with network bursting prior to TTX application (Burst, left) and averaged miniature events from one neuron (mEPSC, right). (K) Frequency of mEPSCs is reduced in pure motor neuron networks. (L) Amplitudes of motor neuron mEPSCs are smaller than V3 interneurons. Mean ± SEM, n = 6 MNs from MN networks; n = 4 V3 INs from V3 networks; n = 6 MNs from MN-V3 networks. *p<0.05; **p<0.01; ***p<0.001.
Figure 8
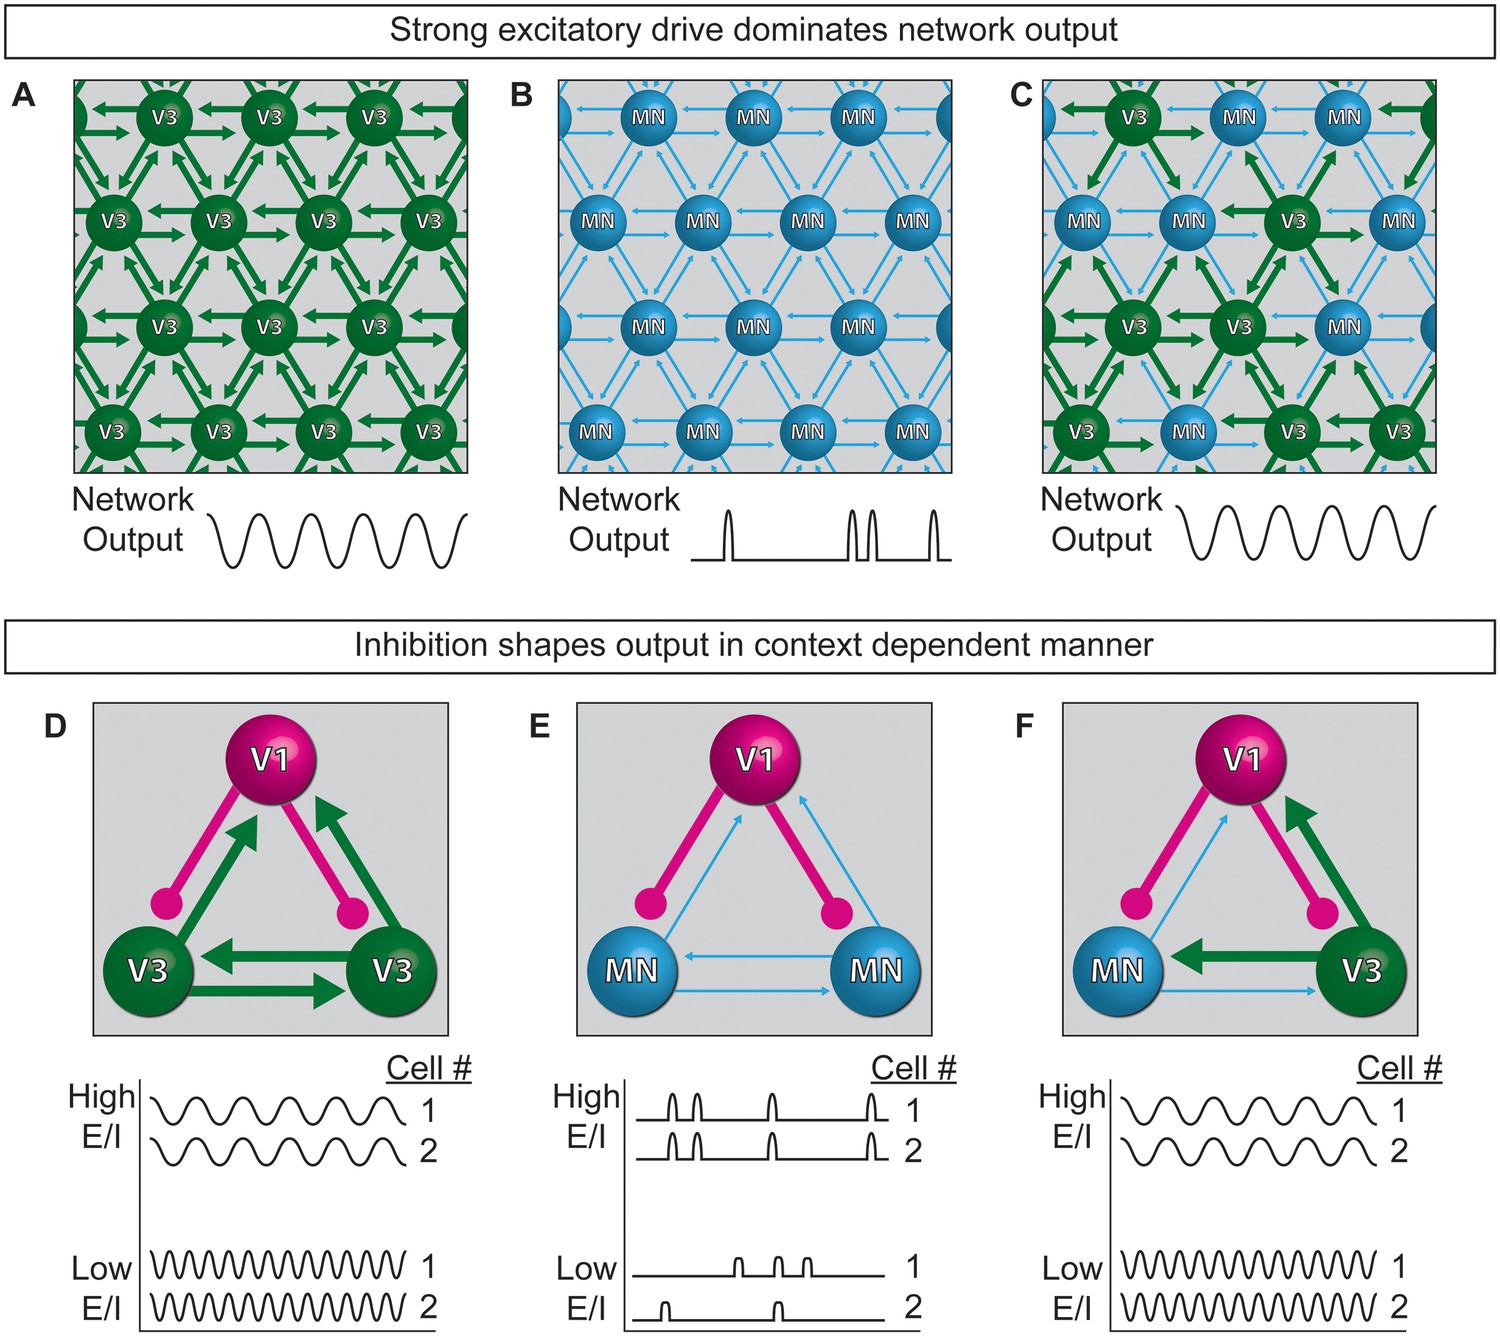
Model of neuronal interactions in an oscillatory circuit.
(A–C) V3 interneurons form strong synaptic interactions, whereas motor neurons have weaker connections. (A) Strongly connected neurons in V3 networks become rhythmically active. (B) Weakly connected neurons in MN networks burst with less regularity. (C) V3 interneurons bind MNs into a network with stronger inter-connections, leading to more regular network activity. (D–F) V1 inhibitory neurons shape the activity of V3 and MN cells differently. (D) The E/I ratio established between V1-V3 interneurons influences burst frequency. This is analogous to speed regulation of oscillators such as CPGs. (E) The E/I ratio established between V1-MN neurons influences the pattern of bursts across the network. This is analogous to switching the coupling and uncoupling of activity among different motor pools during motor behaviors. (F) In networks with a mixture of V1-V3-MN cells, the specific combination of E/I balance and degree of interconnectedness among networked neurons are predicted to influence the burst speed and segmentation of activity.
Videos
Video 1
Mature circuitoids display spontaneous activity.
Heterogeneous circuitoids display spontaneous bursts of network activity that appear to be synchronous throughout each sphere. Here, an En1:Cre;R26/C:LSL:Tomato ES cell line was differentiated with 1000 nM SAG and allowed to mature until 16 days post-ES cell. Calcium intensity change (dF/F) was pseudocolored (scale from black to white). About 15 individual circuitoids with 50,000 cells each are in the field of view. Movie plays at 2x speed.
Video 2
V1 interneurons generate subnetwork activity in motor neuron-V1 networks.
A network of 100,000 motor neurons and 10,000 V1 interneurons displays segmented activity. Calcium intensity change (dF/F) was pseudocolored (scale from black to white), showing different active regions within a network. Movie plays at 10x speed.
Video 3
Inhibitory antagonists synchronize motor neuron-V1 networks.
The same network (see Video 2) displays synchronous network activity after the application of inhibitory antagonists (strychnine+picrotoxin), suggesting that synaptic activity from V1 inhibitory neurons patterns motor neuron networks. Calcium intensity change (dF/F) was pseudocolored (scale from black to white), showing coordinated activity across the network. Movie plays at 10x speed.
Download links
A two-part list of links to download the article, or parts of the article, in various formats.
Downloads (link to download the article as PDF)
Open citations (links to open the citations from this article in various online reference manager services)
Cite this article (links to download the citations from this article in formats compatible with various reference manager tools)
Speed and segmentation control mechanisms characterized in rhythmically-active circuits created from spinal neurons produced from genetically-tagged embryonic stem cells
eLife 6:e21540.
https://doi.org/10.7554/eLife.21540


