Loss of Ptpn11 (Shp2) drives satellite cells into quiescence
- Max Delbrück Center for Molecular Medicine (MDC) in the Helmholtz Society, Germany
- Experimental and Clinical Research Center, Charité Medical Faculty and Max Delbrück Center for Molecular Medicine Berlin, Germany
- Children's Cancer Therapy Development Institute, United States
- Leibniz Institute for Molecular Pharmacology, Germany
Figures
Figure 1 with 1 supplement
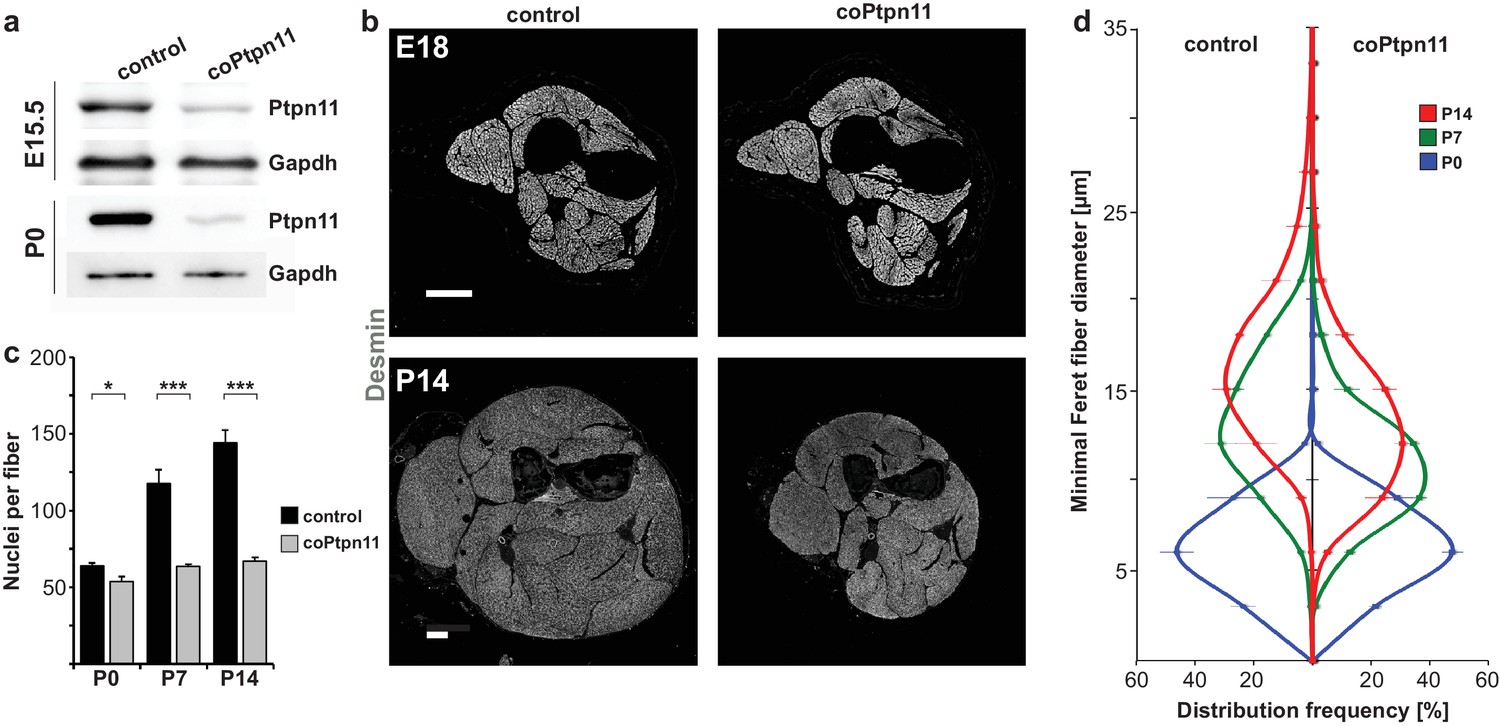
Conditional Ptpn11 mutation leads to a deficit in postnatal muscle growth.
(a) Western blot analysis of Ptpn11 in YFP-positive cells isolated by FACS from limbs of control and coPtpn11 mutant mice that carry the RosaeYFP allele; YFP-positive cells from E15.5 and P0 animals were analyzed. (b) Histological analysis of the lower forelimb of control and coPtpn11 mutant mice at E18 and P14 using anti-desmin antibodies. (c) Quantification of nuclei per extensor carpi radialis longus muscle fiber at P0, P7 and P14. (d) Minimal Feret fiber diameter distribution of extensor carpi radialis longus myofibers at P0, P7, P14. *p<0.05, **p<0.01, ***p<0.001. Error bars show S.E.M. Scale bar: 250 µm.
Figure 1—figure supplement 1
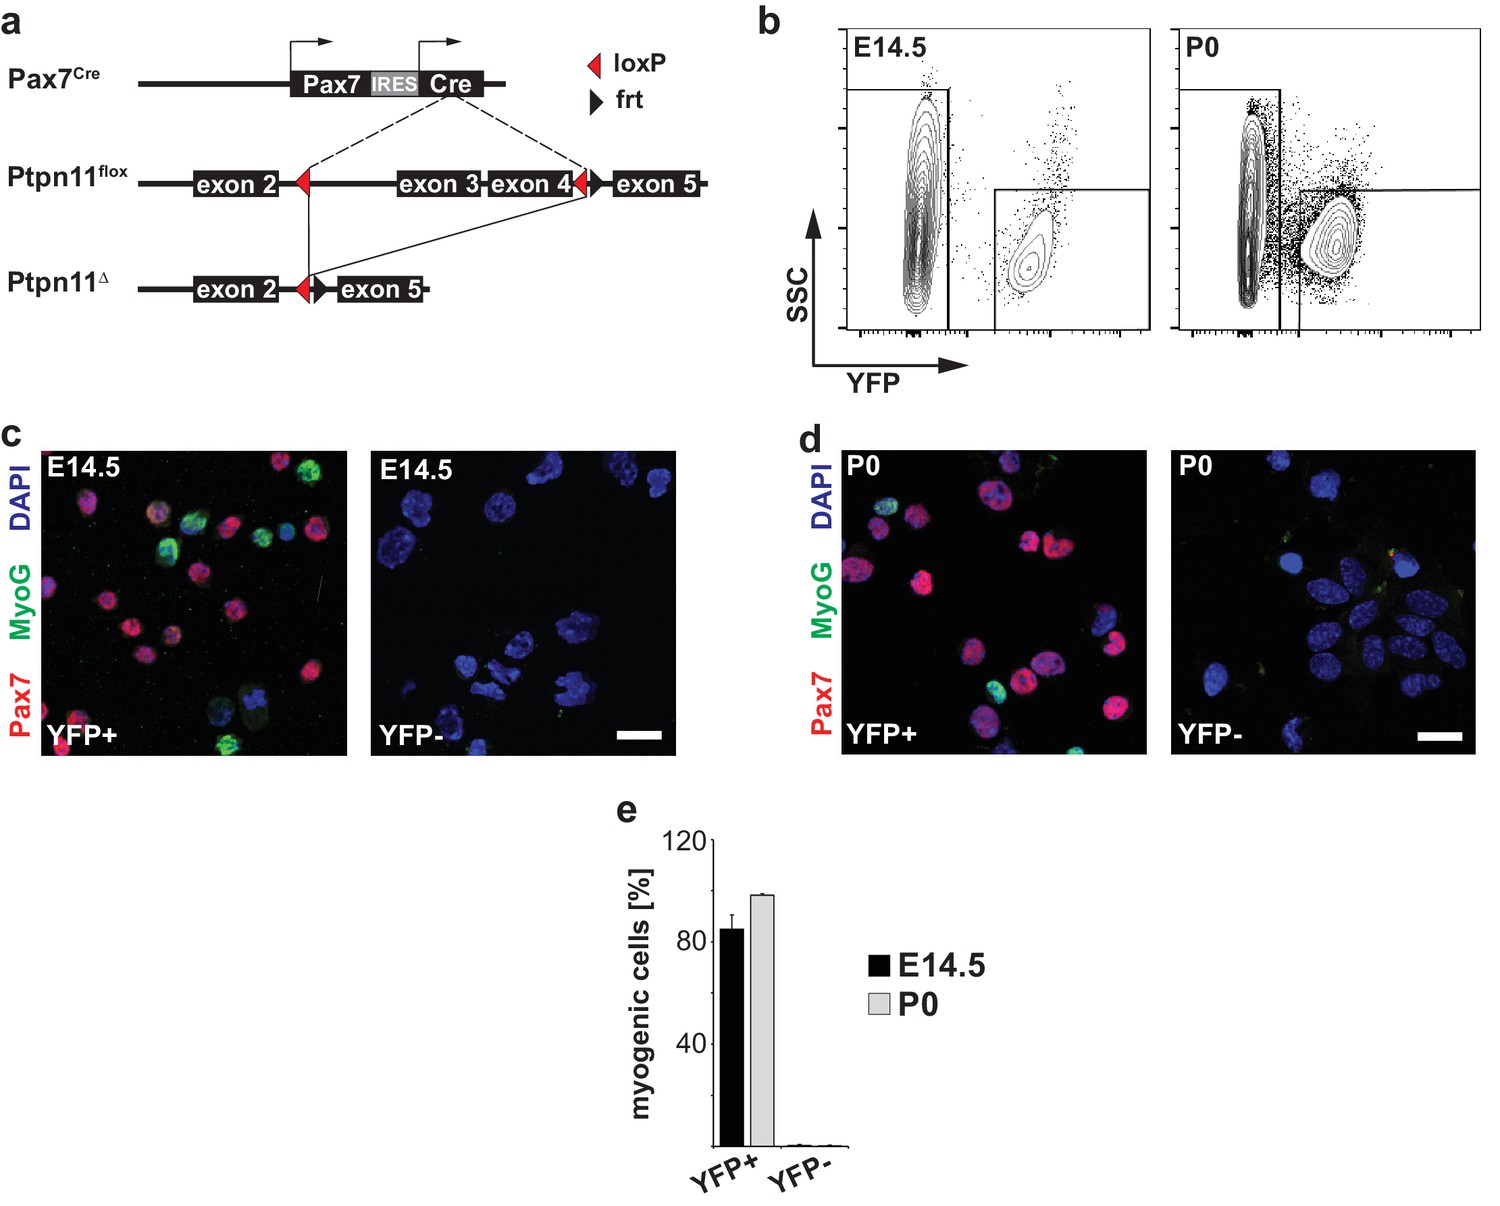
Genetic strategy used to mutate Ptpn11 and isolation of myogenic stem cells.
(a) Genetic strategy used to mutate Ptpn11 using Pax7Cre and Ptpn11flox alleles. (b) Gating strategy to isolate YFP+ and YFP- cells from E14.5 and P0 Pax7Cre;RosaeYFP animals by FACS. YFP fluorescence and side scatter (SSC) are shown on the x- and y-axis, respectively. (c,d) Staining for Pax7 (red), MyoG (green) and DAPI (blue) of freshly isolated YFP+ and YFP- cells by FACS at E14.5 (c) and P0 (d). (e) Quantification of cells expressing Pax7 or MyoG in the YFP+ and YFP- population at E14.5 and P0. Error bars show S.E.M. Scale bar: 20 µm.
Figure 2 with 2 supplements
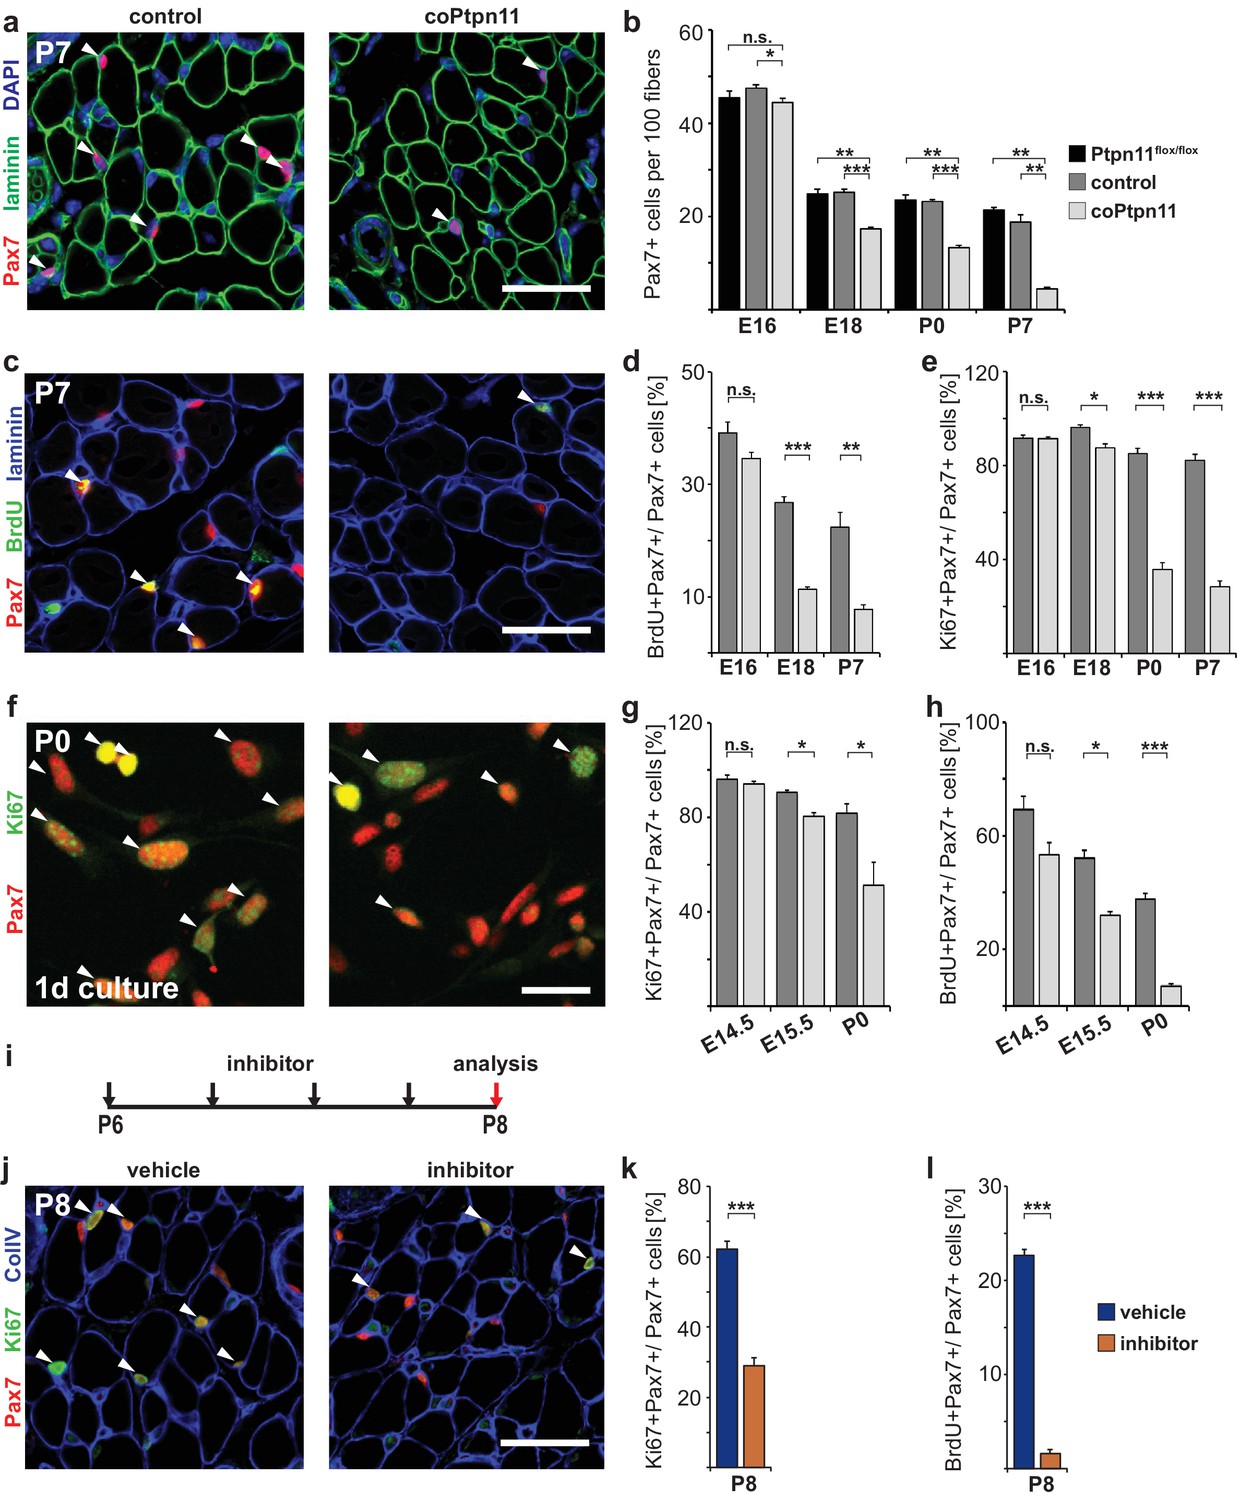
Ptpn11 is essential for proliferation of muscle stem cells in neonatal mice.
(a) Immunohistological analysis of Pax7 (red) and laminin (green) in muscle of control and coPtpn11 mutant mice; DAPI (blue) was used as a counterstain. Arrowheads point to Pax7+ cells. (b) Quantification of Pax7+ cells per 100 fibers. (c) Immunohistological analysis of Pax7 (red), laminin (blue) and BrdU (green) in forelimb muscles of control and coPtpn11 mutants at P7. Arrowheads point to Pax7+BrdU+ cells. (d,e) Quantification of Pax7+ cells that incorporated BrdU (d) or co-expressed Ki67 (e) at E16, E18, P0 and P7 in control and coPtpn11 mutants; the BrdU pulse was given for 2 hr. (f) Pax7 (red) and Ki67 (green) immunostaining of cultured myogenic progenitor cells isolated from control and coPtpn11 mutant mice that carry the RosaeYFP allele; YFP-positive cells were isolated by FACS and cultured for 18–20 hr. Arrowheads show Pax7+Ki67+ cells. (g,h) Quantification of cultured Pax7+ cells that incorporate BrdU (g) or co-express Ki67 (h) at E14.5, E15.5 and P0; the BrdU pulse was given for 1 hr. (i) Scheme for GS493 injections during postnatal growth. (j) Immunohistological analysis of Pax7 (red), Ki67 (green) and collagen IV (ColIV, blue) in forelimb muscles (P8) of animals treated with GS493 or vehicle from P6 to P8. Arrowheads point to Pax7+Ki67+ cells. (k,l) Quantification of Pax7+ cells that co-express Ki67 (k) or incorporated BrdU (l) in muscle of GS493- or vehicle-treated animals. n.s. = not significant, *p<0.05, **p<0.01, ***p<0.001. Error bars show S.E.M. Scale bars 25 µm in a, c, j, 15 µm in f.
Figure 2—figure supplement 1
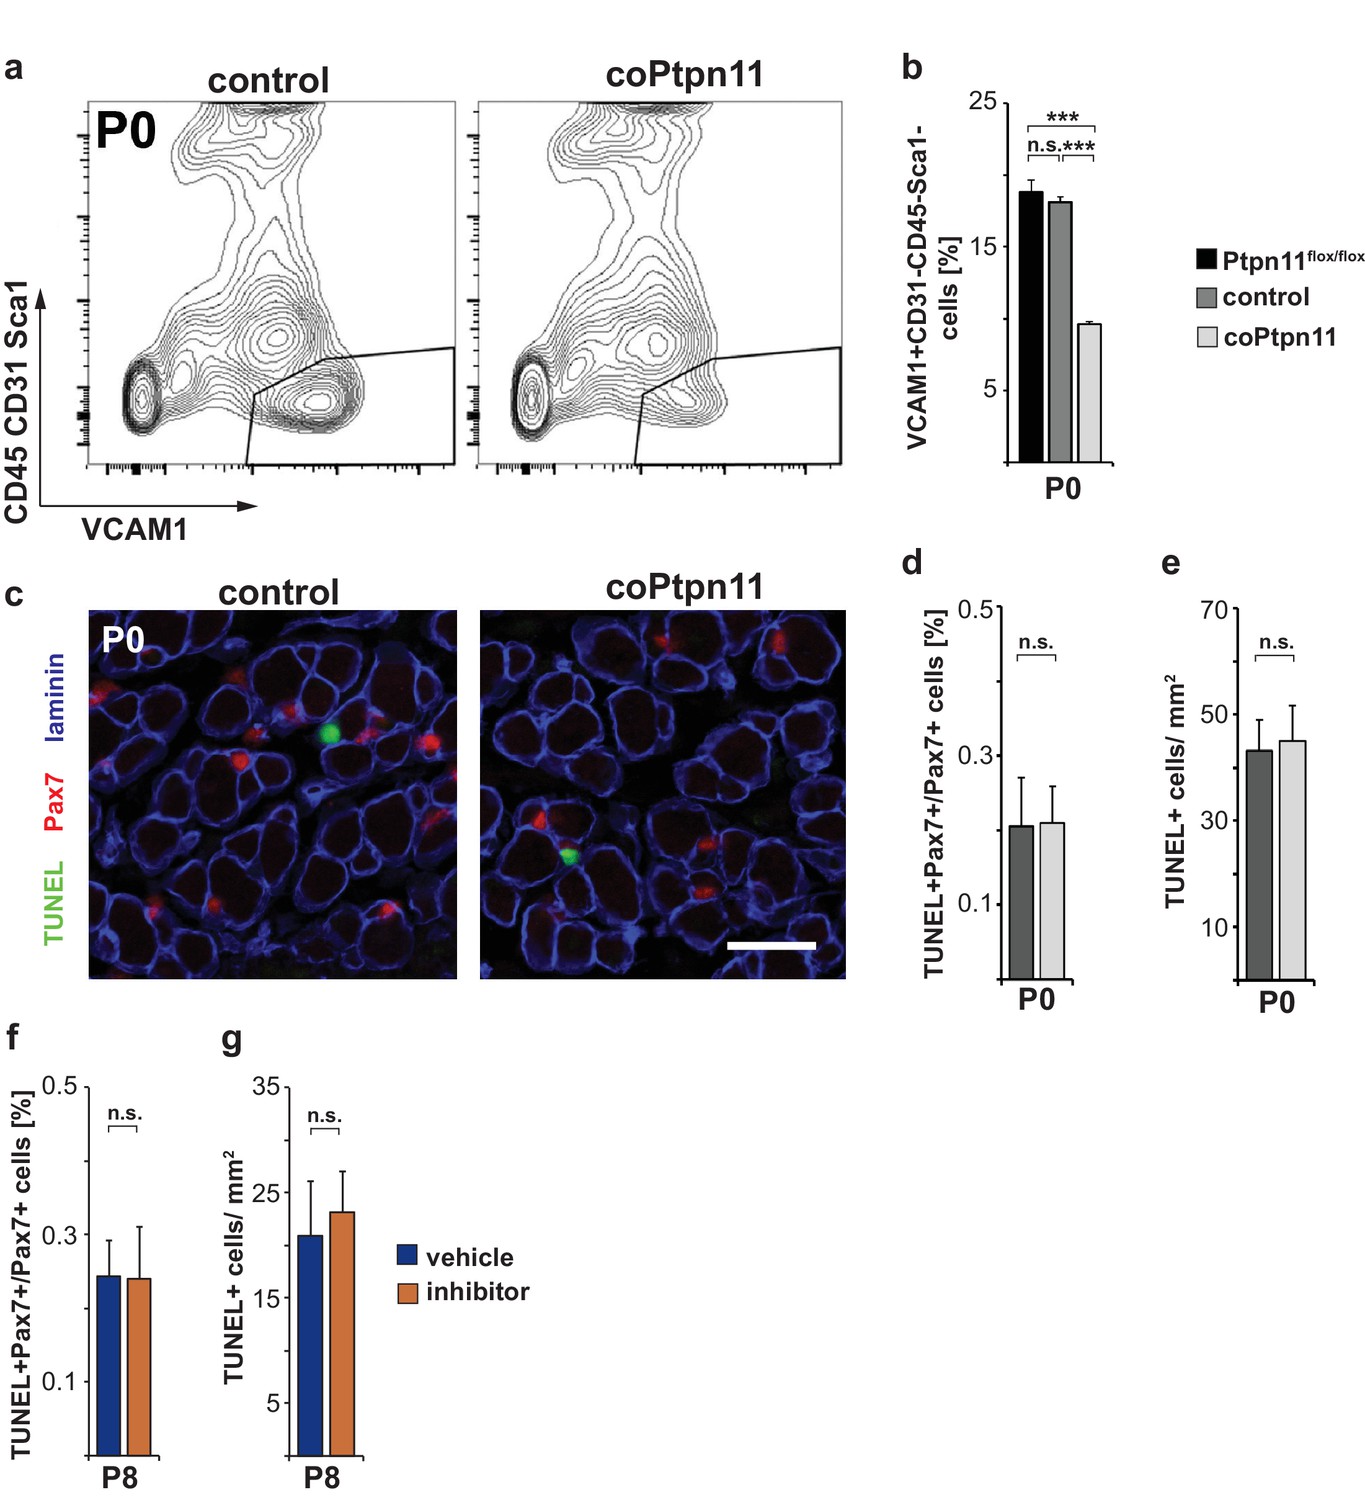
Ptpn11 mutation leads to decreased numbers of myogenic progenitor cells but does not affect apoptosis.
(a) Gating strategy used to isolate VCAM1+ CD31- CD45- Sca1- myogenic cells from P0 animals. VCAM1 and the sum of CD31, CD45, and Sca1 fluorescence intensities are displayed on the x- and y-axis, respectively. (b) Quantification of proportions of VCAM1+CD31-CD45-Sca1- cells. (c) Immunostaining for TUNEL (green), Pax7 (red), and laminin (blue) of control and coPtpn11 muscle (P0). (d) Quantification of TUNEL+Pax7+ cells in muscle of control and coPtpn11 mice at P0. (e) Quantification of TUNEL+ cells/mm2 cells in muscle of control and coPtpn11 mice at P0. (f, g) Quantification of the proportion of Pax7+ cells positive for the TUNEL reaction (f) and TUNEL+ cells/mm2 (g) in muscle of vehicle- and GS493-treated mice. n.s. = not significant, *p<0.05, **p<0.01, ***p<0.001. Error bars show S.E.M. Scale bar: 25 µm.
Figure 2—figure supplement 2
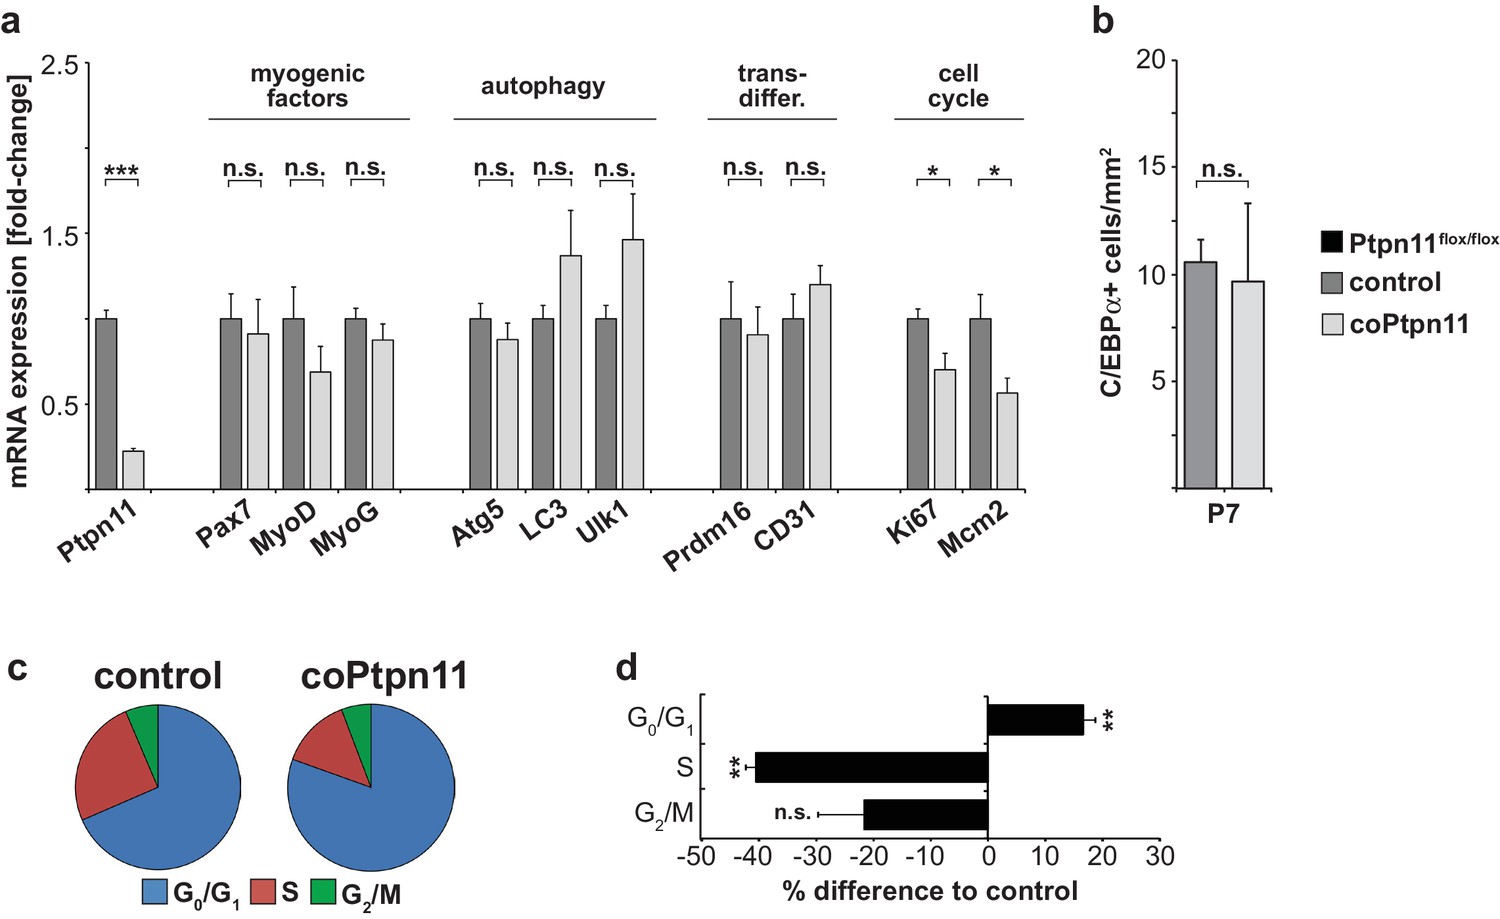
Ptpn11 mutation impairs proliferation of satellite cells.
(a) Quantification of mRNA transcripts related to cell cycle, myogenesis, autophagy, transdifferentiation in YFP+ cells isolated by FACS from control and coPtpn11 mutant limb muscle at P0. (b) Quantification of C/EBPα+ adipocytes/mm2 in muscle of control and coPtpn11 mutant mice at P7. (c) Pie chart summarizing the cell cycle phase distribution determined by FACS using propidium iodide to define DNA content of control and coPtpn11 mutant satellite cells (E18). (e) Deviation plot showing changes in proportion of cells that are in a particular phase of the cell cycle. n.s. = not significant, *p<0.05, **p<0.01, ***p<0.001. Error bars show S.E.M.
Figure 3

Loss of Ptpn11 does not affect myogenic differentiation.
(a) Cytospins of freshly isolated muscle stem cells from control and coPtpn11 mice (P0); cells were immunostained for Pax7 (red) and MyoG (green), and nuclei were counterstained with DAPI (blue). (b) Quantification of Pax7+ and MyoG+ cells in cytospins of cells isolated from control and coPtpn11 mice (P0). (c) Quantification Pax7+ and MyoG+ cells in cytospins of freshly isolated stem cells after donors had been treated with GS493 or vehicle. (d) Immunostaining for desmin (green) of cultured myogenic progenitor cells kept in differentiation medium for 4 days. Nuclei were counterstained with DAPI (red). n.s. = not significant. Error bars show S.E.M. Scale bars 10 µm (a) 50 µm (d).
Figure 4 with 1 supplement
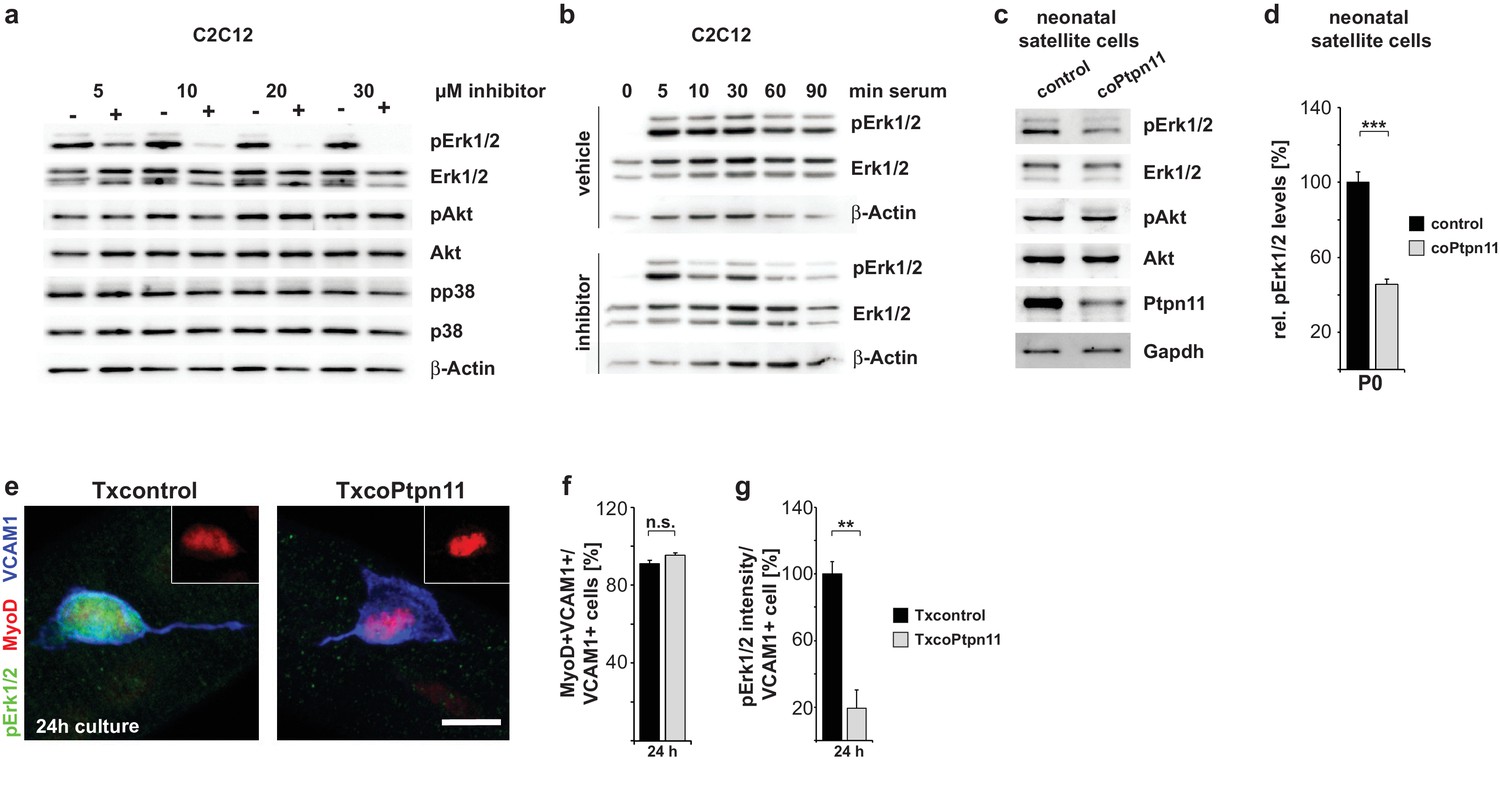
Ptpn11 controls Mapk/Erk1/2 activation in myogenic cells.
(a) Western blot analysis of phosphorylation of Mapk/Erk1/2, PI3K/Akt and Mapk/p38 in C2C12 cells cultured in the presence of either vehicle or GS493 (5, 10, 20 and 30 µM). (b) Western blot analysis of Mapk/Erk1/2 phospho-rylation in C2C12 cells; cells were incubated for 6 hr in serum-free medium, and stimulated with 20% fetal calf serum in the presence/absence of GS493. (c) Western blot analysis of Mapk/Erk1/2 and PI3K/Akt in cultured neonatal satellite cells. (d) Quantification of Mapk/Erk1/2 phosphorylation. (e) Immunostaining of cultured fibers obtained from adult Txcontrol and TxcoPtpn11 mice. Satellite cells associated with the fibers are displayed, and pErk1/2 (green), MyoD (red) and VCAM1 (blue) staining is shown; the inset displays MyoD (red). (f) Quantification of VCAM1+ cells co-expressing MyoD. (g) Densitometric quantification of pErk1/2 staining intensity in VCAM1+ cells. n.s. = not significant, *p<0.05, **p<0.01, ***p<0.001. Error bars show S.E.M. Scale bar: 10 µm.
Figure 4—figure supplement 1
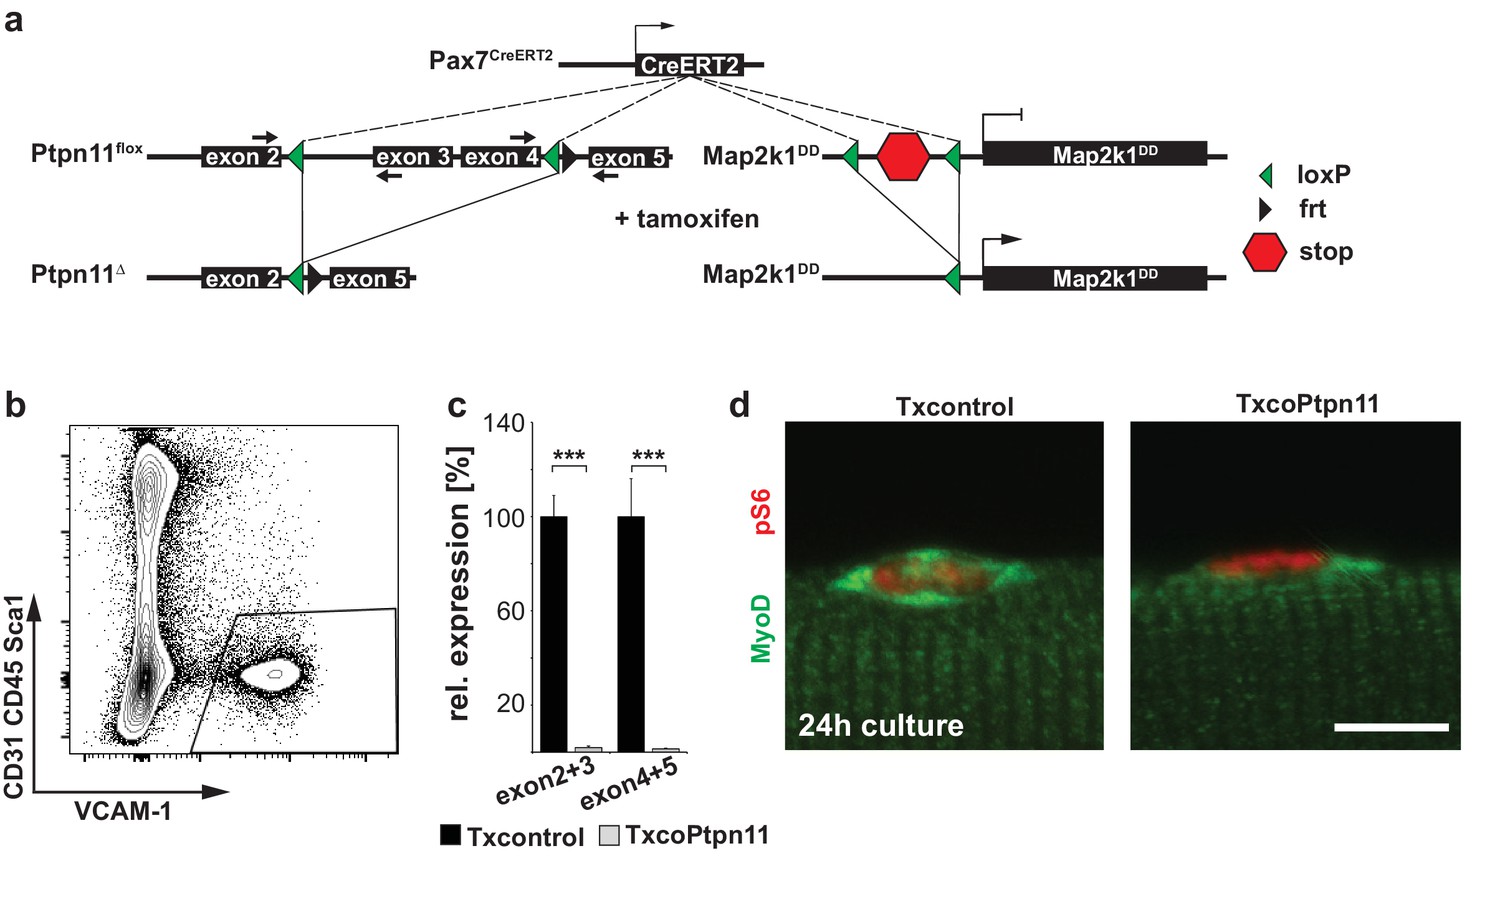
Efficient recombination of the Ptpn11flox allele in adult satellite cells and floating fiber cultures.
(a) Genetic strategy used to induce tamoxifen-dependent mutation of Ptpn11 and to activate Map2k1DD expression in adult satellite cells. (b) Gating strategy to isolate VCAM1+ CD31- CD45- Sca1- satellite cells from muscle of adult mice. (c) Relative expression of wildtype Ptpn11 mRNA. The positions of the primers are indicated by small arrows in (a) and they are chosen to exclusively allow the amplification of the unrecombined mRNA by qPCR. (d) Immunostaining of phospho-S6 and MyoD on fibers from Txcontrol and TxcoPtpn11 mice cultured for 24 hr; shown are satellite cells associated with the fiber. n.s. = not significant, *p<0.05, **p<0.01, ***p<0.001. Error bars show S.E.M.
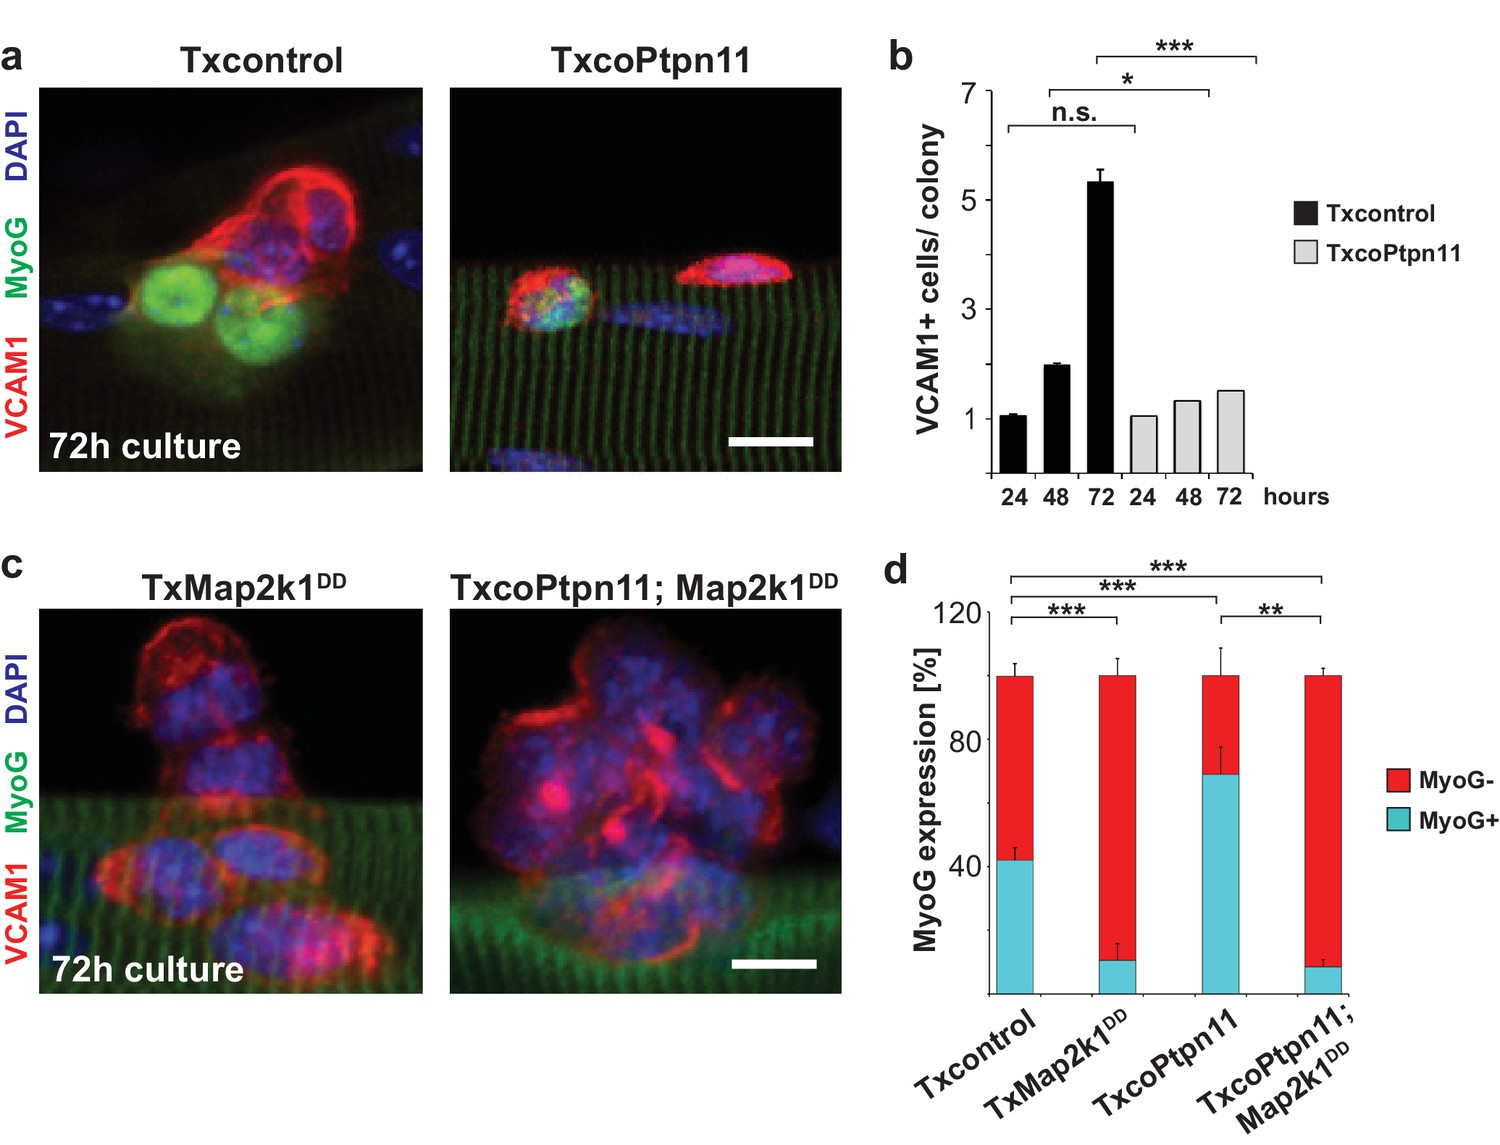
Figure 5 with 1 supplement

Activation of Mapk/Erk1/2 signaling rescues proliferation of Ptpn11-mutant satellite cells.
Fibers from adult Txcontrol and TxcoPtpn11 mice were cultured for the indicated times, and analyzed for VCAM1 (red) and Ki67 (green) protein; the inset depicts Ki67 staining (green). Nuclei were counterstained with DAPI (blue). (b) Quantification of VCAM1+ cells co-expressing Ki67. (c,e) Staining of satellite cells for VCAM1 (red), Ki67 (green) and DAPI (blue); fibers were isolated from (c) Txcontrol and TxcoPtpn11 mutant mice and (e) from TxMap2k1DD and TxcoPtpn11;Map2k1DD mice. The insets depict Ki67 staining (green). (d) Quantification of VCAM1+ cells/colony. (f,g) Quantification of VCAM1+ cell co-expressing Ki67 (f) or incorporating BrdU (g). n.s. = not significant, *p<0.05, **p<0.01, ***p<0.001. Error bars show S.E.M. Scale bar: 10 µm.
Figure 5—figure supplement 1
Ptpn11/Mapk/Erk signaling affects satellite cell differentiation in floating single myofiber cultures.
(a) Immunostaining of VCAM1 (red) and MyoG (green) on fibers from Txcontrol and TxcoPtpn11 mice cultured for 72 hrs. Nuclei were counterstained with DAPI (blue). (b) Quantification of VCAM1+ cells per colony on floating fibers cultured for 24, 48 and 72 hr. (c) Immunostaining of VCAM1 (red) and MyoG (green) on fibers from TxMap2k1DD and TxcoPtpn11;Map2k1DD mice cultured for 72 hrs. Nuclei were counterstained with DAPI (blue). (d) Quantification of MyoG expressing VCAM1+ cells cultured for 72hrs. n.s. = not significant, *p<0.05, **p<0.01, ***p<0.001. Error bars show S.E.M. Scale bar: 10 µm.
Figure 6 with 1 supplement
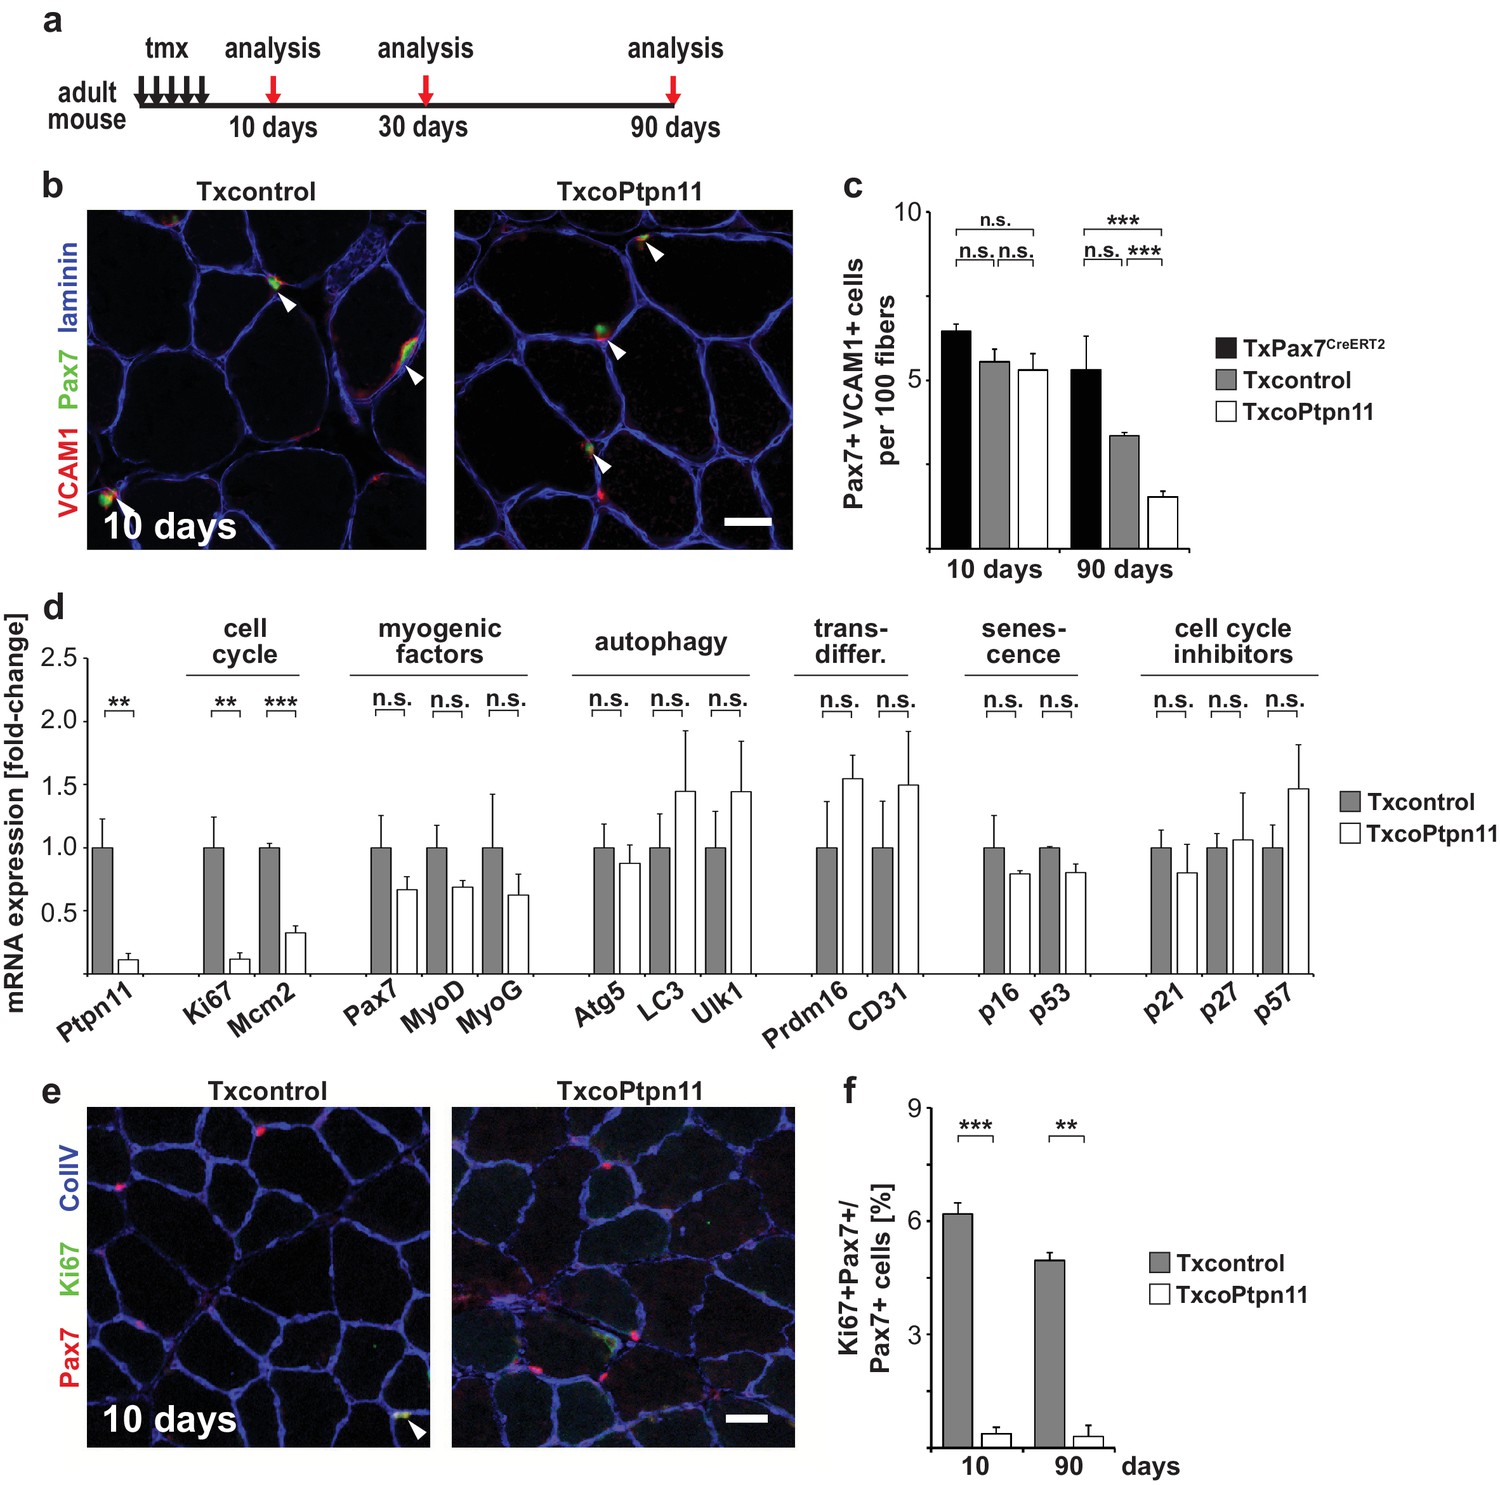
Ptpn11 is essential for long-term maintenance of satellite cells in sedentary adult muscle.
(a) Outline of the experiment. (b) Immunostaining for VCAM1 (red), Pax7 (green), and laminin (blue) of tibialis anterior muscle from Txcontrol and TxcoPtpn11 mice 10 days after tamoxifen; arrowheads point to Pax7+VCAM1+ cells. (c) Quantification of Pax7+VCAM1+ cells in control and TxcoPtpn11 animals 10 and 90 days after tamoxifen. (d) Quantification of mRNA transcripts expressed in satellite cells isolated by FACS from control (Txcontrol) and mutant (TxcoPtpn11) mice 30 days after tamoxifen. (e) Immunostaining for Pax7 (red), Ki67 (green) and collagen (ColIV, blue) of muscle from Txcontrol and TxcoPtpn11 mice 10 days after tamoxifen. Arrowheads point to Pax7+Ki67+ cells. (f) Quantification of Pax7-positive cells co-expressing Ki67 10 and 90 days after tamoxifen administration. n.s. = not significant, *p<0.05, **p<0.01, ***p<0.001. Error bars show S.E.M. Scale bars: 25 µm.
Figure 6—figure supplement 1
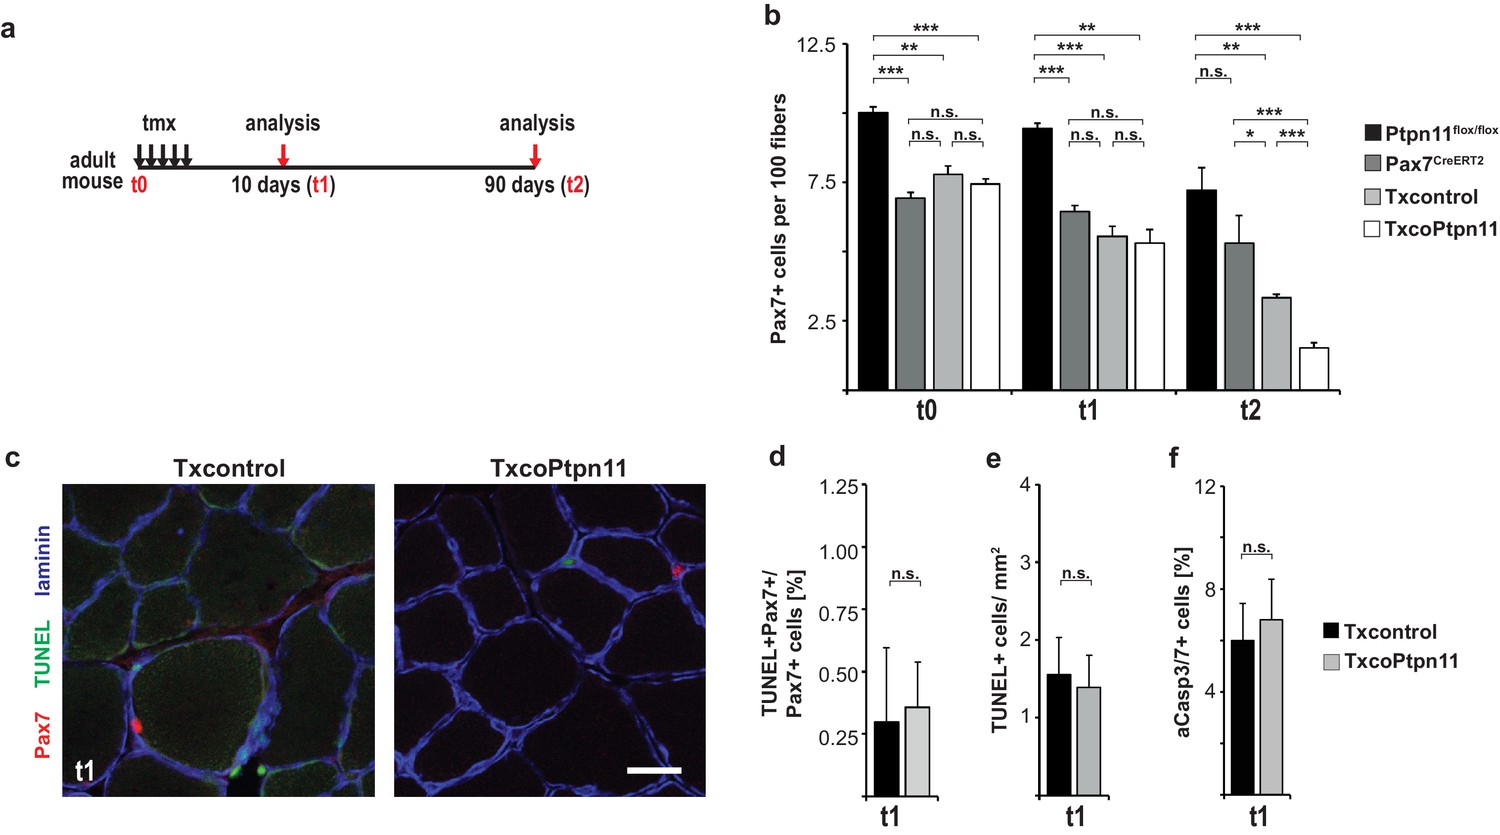
Ptpn11 is essential for long-term maintenance of satellite cells and muscle regeneration.
(a) Outline of the experiment. (b) Quantification of Pax7+VCAM1+ satellite cells/100 fibers in tibialis anterior muscle before (t0), 10 (t1), and 90 (t2) days after tamoxifen administration. (c) Immunostaining for Pax7 (red), TUNEL (green) and laminin (blue) of sedentary muscle 10 days after tamoxifen administration. (d) Quantification of the proportions of Pax7+ cells that are TUNEL+. (e) Quantification of TUNEL+ cells/mm2. (f) Flow cytometric quantification of VCAM1+CD31-CD45-Sca1- satellite cells possessing active caspase 3 and 7 in Txcontrol and TxcoPtpn11 mice two weeks after tamoxifen administration. n.s. = not significant, *p<0.05, **p<0.01, ***p<0.001. Error bars show S.E.M. Scale bar: 25 µm.
Figure 7 with 1 supplement
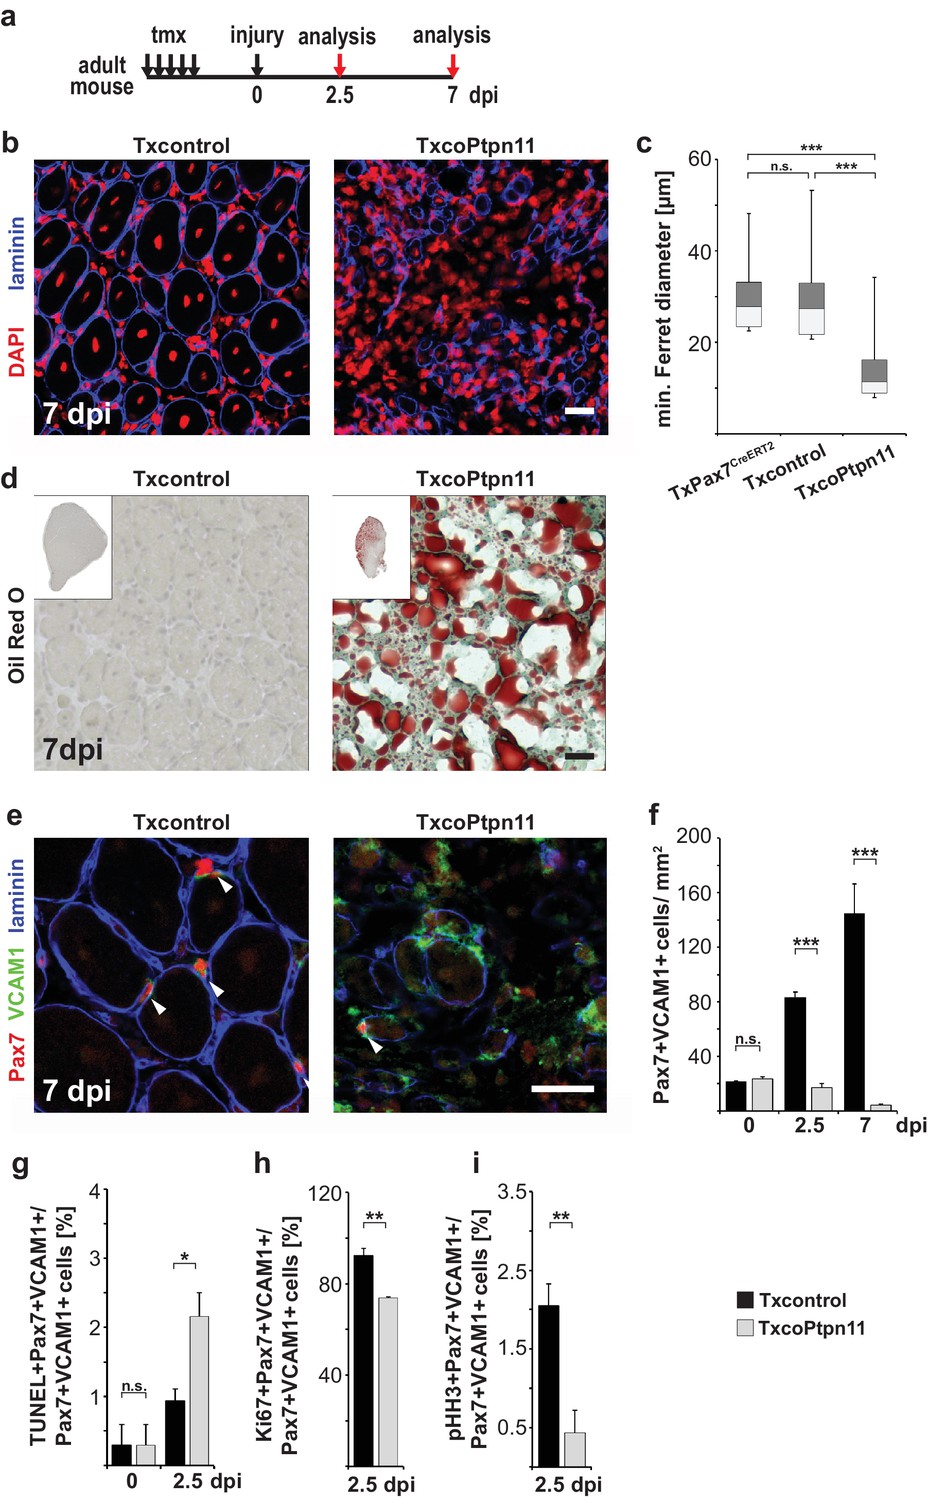
Ptpn11 is essential for skeletal muscle repair.
(a) Outline of the regeneration experiment. (b) Immunostaining for laminin (blue) of injured muscle from Txcontrol and TxcoPtpn11 animals seven days after injury (7dpi). Nuclei were counterstained with DAPI (red). (c) Box plot showing the quartile distribution and minima/maxima of the diameters of regenerating fibers. (d) Oil Red O staining of regenerating muscle seven days after injury. (e) Immunohistochemical analysis using antibodies for Pax7 (red), VCAM1 (green) and laminin (blue) of muscle after injury; arrowheads point towards Pax7+VCAM1+ cells. (f) Quantification of Pax7+VCAM1+ cells/mm2 before injury, as well as 2.5 and 7 days after injury. (g) Quantification of Pax7+VCAM1+TUNEL+ positive cells before and 2.5 days after muscle injury. (h, i) Quantification of Pax7+VCAM1+ cells co-expressing Ki67 (h) or phospho-Histone H3 (pHH3) (i) 2.5 days after injury. n.s. = not significant, *p<0.05, **p<0.01, ***p<0.001. Error bars show S.E.M. Scale bar: 25 µm.
Figure 7—figure supplement 1
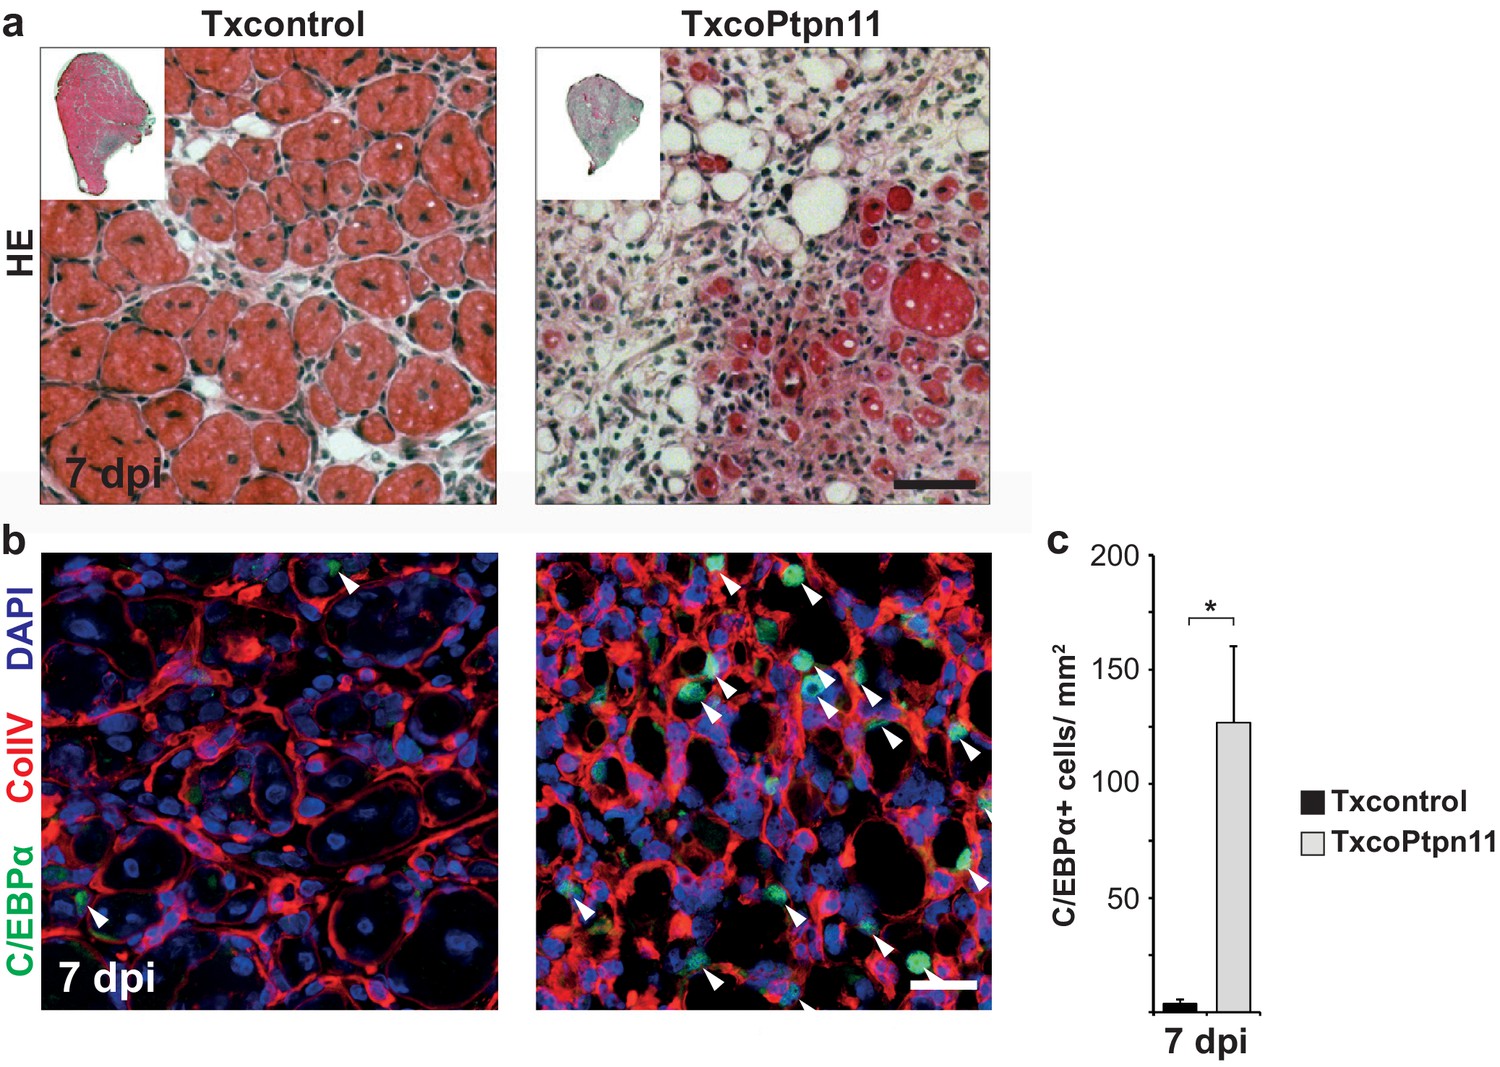
Mutation of Ptpn11 in satellite cells leads to a severe muscle regeneration deficit and accumulation of fibrotic and adipose tissue.
(a) Haematoxylin/eosin staining of adult tibialis anterior muscle seven days after injury. (b) Staining for C/EBPα (green), collagen IV (ColIV, red) and DAPI (blue) of muscle from Txcontrol and TxcoPtpn11 mice seven days after injury. (c) Quantification of C/EBPα+ cells/mm2. n.s. = not significant, *p<0.05, **p<0.01, ***p<0.001. Error bars show S.E.M. Scale bar: 25 µm.
Figure 8 with 1 supplement
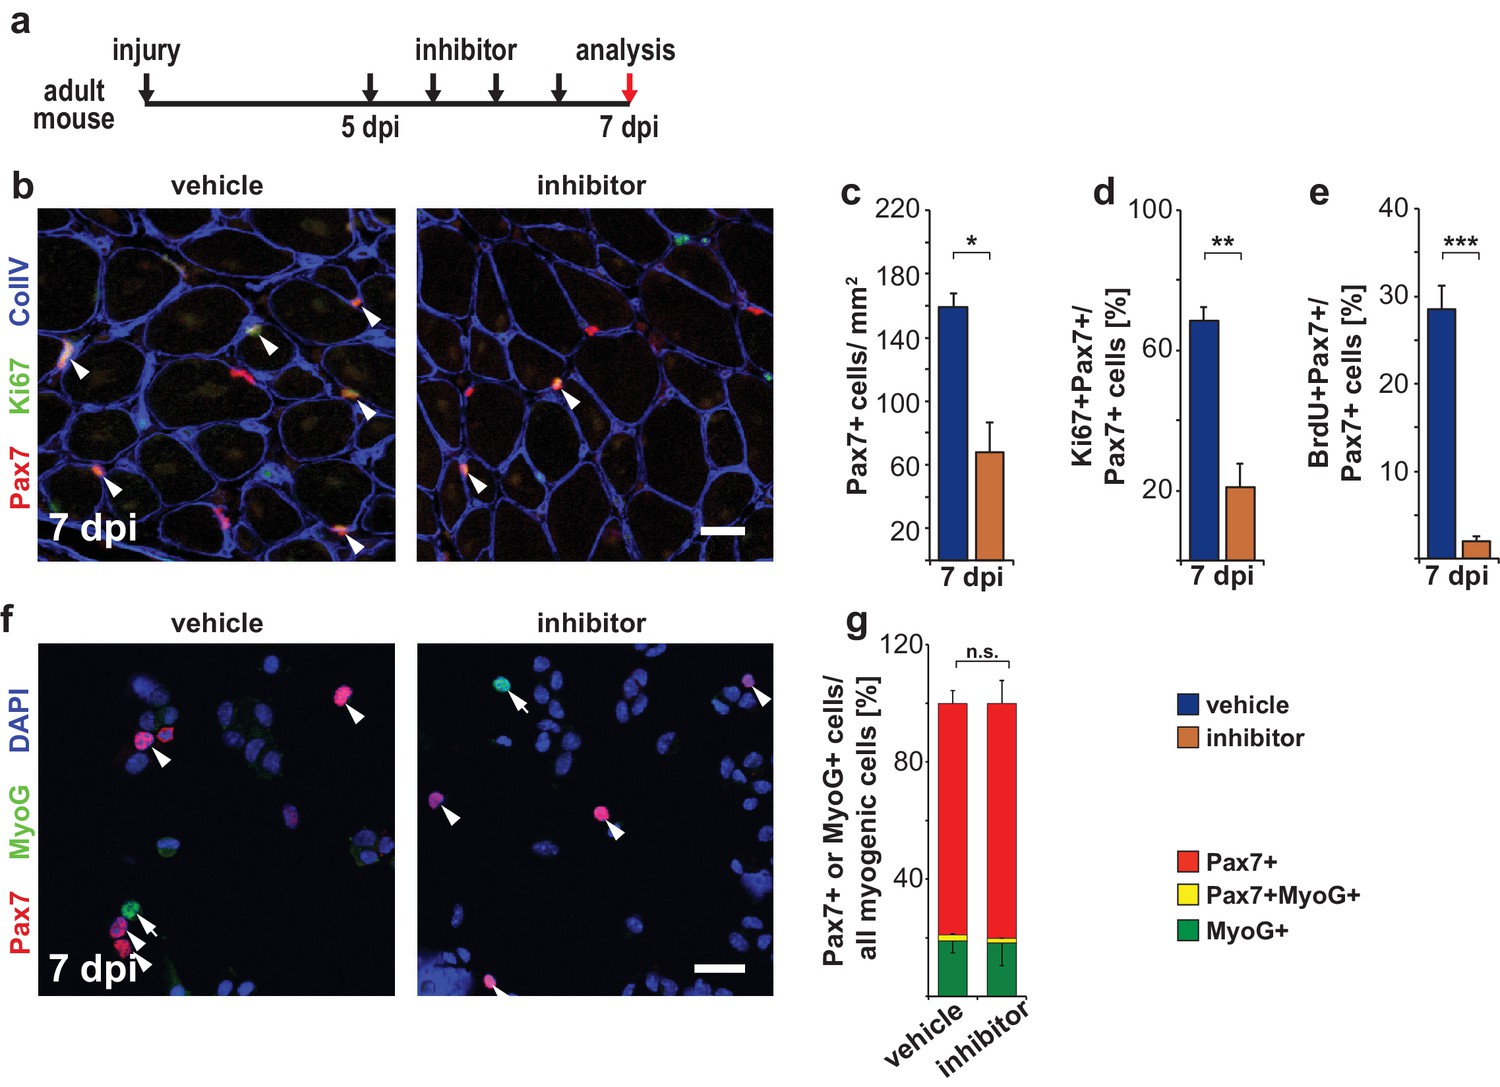
Pharmacological inhibition of Ptpn11 leads to a premature cell cycle withdrawal of satellite cells at late stages of muscle regeneration.
(a) Outline of the experiment. (b) Immunostaining for Pax7 (red), Ki67 (green) and collagen IV (CollV; blue) in regenerating tibialis anterior muscle seven days after injury (7dpi). Mice were treated with GS493 or with vehicle as indicated. Arrowheads point towards Pax7+Ki67+ cells. (c–e) Quantifications of Pax7+ cells/mm2 (c), Pax7+Ki67+ cells (d) or Pax7+BrdU+ cells (e). (f) Cytospins of single cells isolated from injured muscle seven days after injury stained for Pax7 (red), MyoG (green) and DAPI (blue); arrowheads and arrows point to Pax7+ and MyoG+ cells, respectively. (g) Quantification of Pax7 and MyoG expressing myogenic cells (i.e. Pax7+ plus MyoG+ cells). n.s. = not significant, *p<0.05, **p<0.01, ***p<0.001. Error bars show S.E.M. Scale bars: 25 µm (b), 20 µm (f).
Figure 8—figure supplement 1
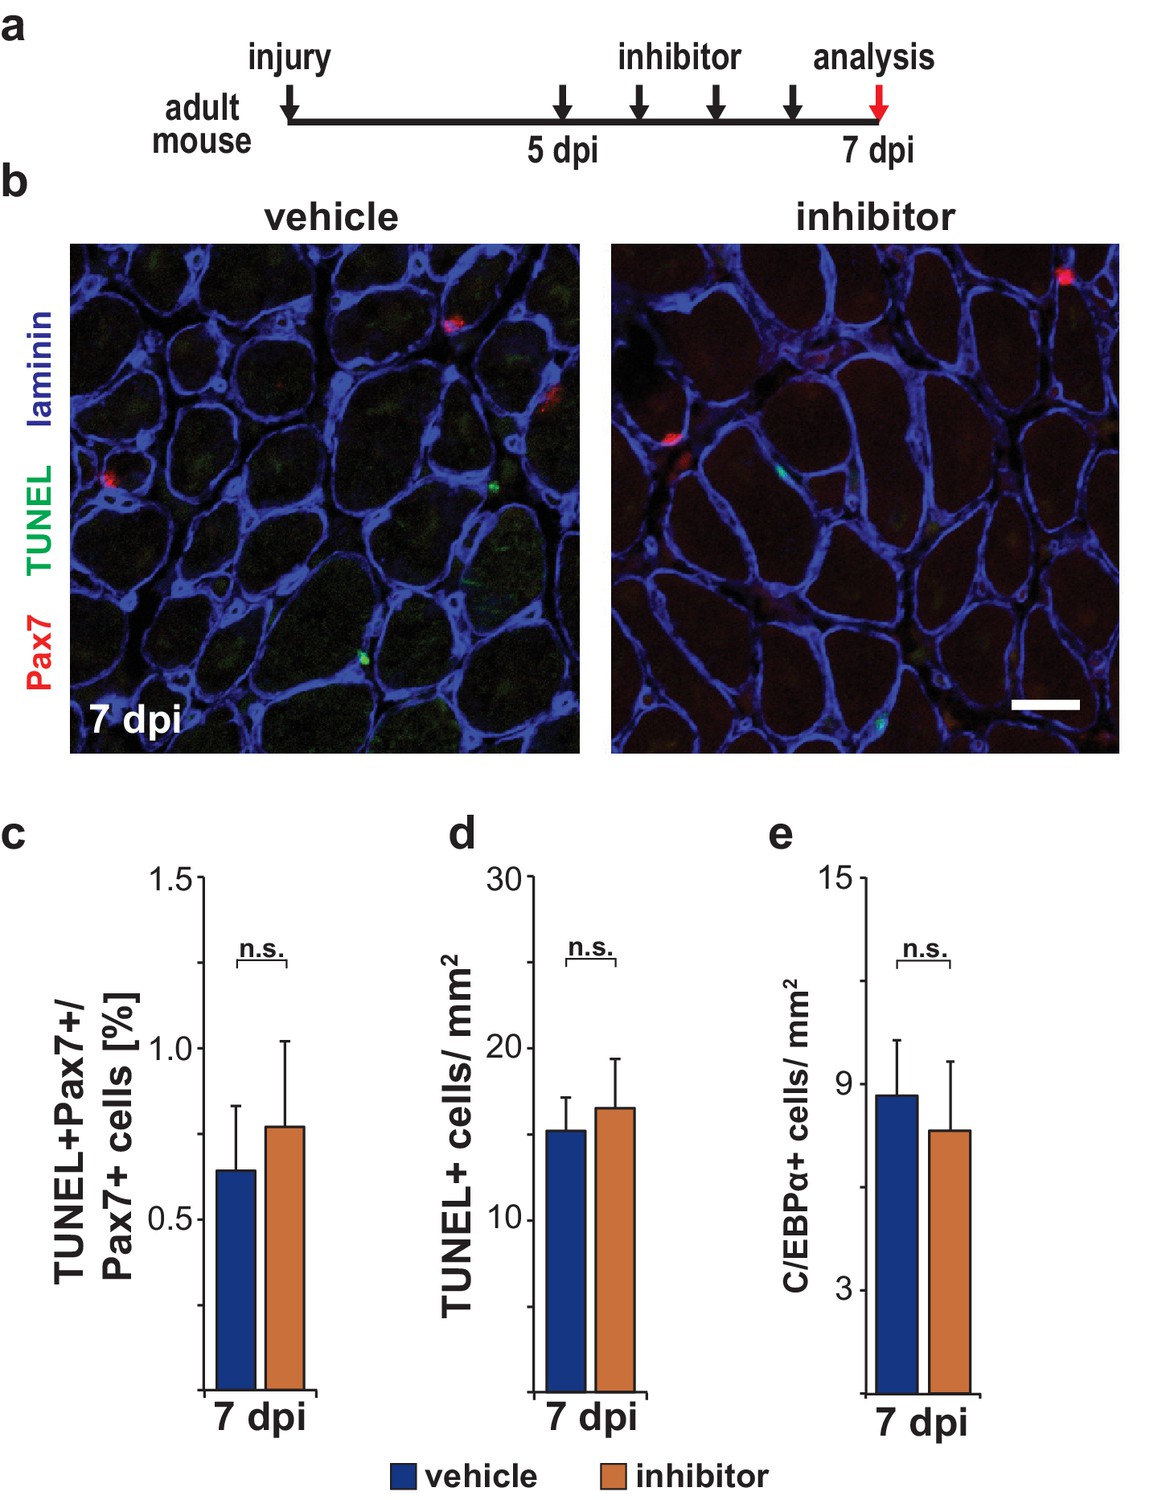
Pharmacological inhibition of Ptpn11 at late stages of muscle regeneration does not induce apoptosis or adipogenesis.
(a) Outline of the experiment. (b) Immunostaining for Pax7 (red), TUNEL (green) and laminin (blue) on regenerating muscle after treatment with vehicle or GS493. (c) Quantification of TUNEL+Pax7+/Pax7+ cells. (d) Quantification of TUNEL+ cells/mm2. (e) Quantification of C/EBPα+ cells/mm2. n.s. = not significant, *p<0.05, **p<0.01, ***p<0.001. Error bars show S.E.M. Scale bar: 25 µm.
Tables
Table 1
Gene expression changes in Ptpn11 mutant satellite cells.
| Cell cycle associated genes | FC | FDR |
|---|---|---|
| Ccnd1 Cyclin D1 | -2.58 | 0.00363 |
| Ccnb1 Cyclin B1 | -2.33 | 0.00144 |
| Prc1 Protein regulator of cytokinesis 1 | -2.32 | 0.01522 |
| Ranbp1 Ran-binding protein 1 | -2.18 | 0.00081 |
| Cdc2a Cyclin dependent kinase 1a | -2.11 | 0.00402 |
| Immediate early genes | ||
| Egr4 Early growth response 4 | -3.00 | 0.00300 |
| Tnfrsf12a FGF-inducible 14/ Tweak-receptor | -2.65 | 0.00144 |
| Egr2 Early growth response 2 | -2.58 | 0.00318 |
| Plk2 Polo-like-kinase 2 | -2.57 | 0.00004 |
| Extracellular matrix/ secreted proteins | ||
| Adamts2 ADAM Metallopeptidase 2 | 3.15 | 0.00144 |
| Thbs2 Thrombospondin 2 | 2.89 | 0.00519 |
| Mfap5 Microfibrillar-associated protein 4 | 2.84 | 0.01179 |
| Col1a1 Collagen 1a1 | 2.75 | 0.00374 |
| Mfap2 Microfibrillar-associated protein 2 | 2.62 | 0.00179 |
| Col1a2 Collagen 1a2 | 2.29 | 0.00082 |
| Col16a1 Collagen 16a1 | 2.17 | 0.00681 |
-
FC: fold-change; FDR: false discovery rate; corrected p-value (q-value) determined as described (Hochberg and Benjamini, 1990).
Additional files
-
Supplementary file 1
List of all deregulated genes in neonatal Ptpn11 mutant muscle stem cells.
Transcripts labeled in colors are also shown in Table 1 and are associated with particular GO terms. Green: cell cycle-associated; yellow: immediate early gene; purple: extracellular matrix and matrix remodeling. FDR: false discovery rate. Corrected p-values (q-value) was determined as described (Hochberg and Benjamini, 1990).
- https://doi.org/10.7554/eLife.21552.019
-
Supplementary file 2
List of enriched GO terms.
Enriched GO terms in deregulated genes in Ptpn11 mutant muscle stem cells. FDR: false discovery rate. Corrected p-values (q-value) was determined as described (Hochberg and Benjamini, 1990).
- https://doi.org/10.7554/eLife.21552.020
-
Supplementary file 3
Statistical data for each experiment shown in Figures 1–8 and Figure 1—figure supplement 1; Figure 2—figure supplement 1; Figure 2—figure supplement 2; Figure 4—figure supplement 1; Figure 5—figure supplement 1; Figure 6—figure supplement 1; Figure 7—figure supplement 1; Figure 8—figure supplement 1.
Shown are the definition of the center, the error bars, the statistical test used, n-numbers for each genotype or treatment for a specific developmental stage and the corresponding p-value for each comparison. S.E.M.: standard error of the mean.
- https://doi.org/10.7554/eLife.21552.021
Download links
A two-part list of links to download the article, or parts of the article, in various formats.
Downloads (link to download the article as PDF)
Open citations (links to open the citations from this article in various online reference manager services)
Cite this article (links to download the citations from this article in formats compatible with various reference manager tools)
Loss of Ptpn11 (Shp2) drives satellite cells into quiescence
eLife 6:e21552.
https://doi.org/10.7554/eLife.21552


