Early dysfunction and progressive degeneration of the subthalamic nucleus in mouse models of Huntington's disease
- Feinberg School of Medicine, Northwestern University, United States
Figures
Figure 1
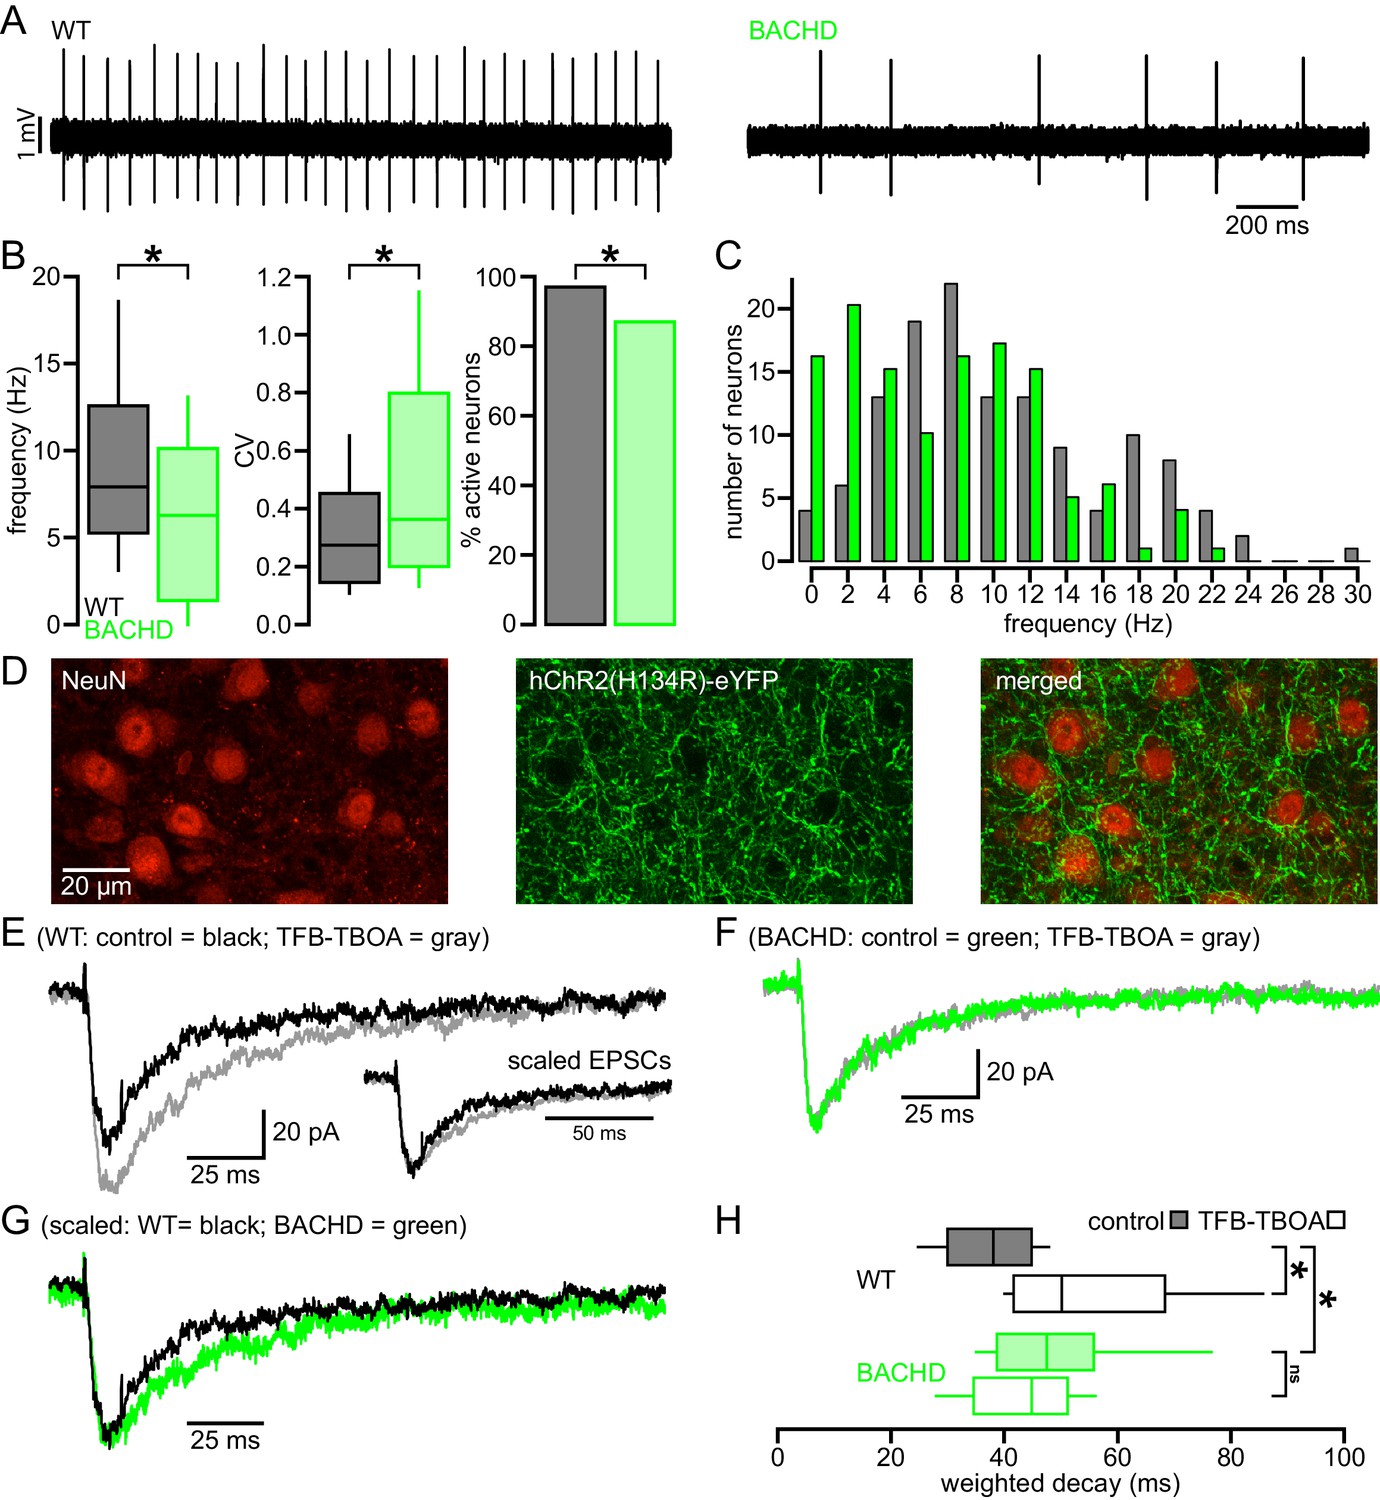
Abnormal intrinsic and synaptic properties of STN neurons in BACHD mice.
(A) Representative examples of autonomous STN activity recorded in the loose-seal, cell-attached configuration. The firing of the neuron from a WT mouse was of a higher frequency and regularity than the phenotypic neuron from a BACHD mouse. (B) Population data showing (left to right) that the frequency and regularity of firing, and the proportion of active neurons in BACHD mice were reduced relative to WT mice. (C) Histogram showing the distribution of autonomous firing frequencies of neurons in WT (gray) and BACHD (green) mice. (D) Confocal micrographs showing NeuN expressing STN neurons (red) and hChR2(H134R)-eYFP expressing cortico-STN axon terminals (green) in the STN. (E) Examples of optogenetically stimulated NMDAR EPSCs from a WT STN neuron before (black) and after (gray) inhibition of astrocytic glutamate uptake with 100 nM TFB-TBOA. Inset, the same EPSCs scaled to the same amplitude. (F) Examples of optogenetically stimulated NMDAR EPSCs from a BACHD STN neuron before (green) and after (gray) inhibition of astrocytic glutamate uptake with 100 nM TFB-TBOA. (G) WT (black, same as in E) and BACHD (green, same as in F) optogenetically stimulated NMDAR EPSCs overlaid and scaled to the same amplitude. (H) Boxplots of amplitude weighted decay show slowed decay kinetics of NMDAR EPSCs in BACHD STN neurons compared to WT, and that TFB-TBOA increased weighted decay in WT but not BACHD mice. *p < 0.05. ns, not significant. Data for panels B–C provided in Figure 1—source data 1; data for panel H provided in Figure 1—source data 2.
-
Figure 1—source data 1
Autonomous firing frequency and CV for BACHD and WT STN neurons in Figure 1B–C.
- https://doi.org/10.7554/eLife.21616.003
-
Figure 1—source data 2
Amplitude weighted decay of NMDAR-mediated EPSCs in Figure 1H.
- https://doi.org/10.7554/eLife.21616.004
Figure 2

Cortico-STN EPSCs in WT and BACHD mice.
(A) Boxplot showing the distribution of single optogenetically stimulated cortico-STN NMDAR EPSC amplitudes in WT and BACHD mice. (B) Scatterplot showing NMDAR EPSC amplitude vs amplitude weighted decay time. There was no correlation between NMDAR EPSC amplitude and decay time in WT or BACHD mice. (C–D) Example of NMDAR EPSCs generated by 5 × 50 Hz optogenetic stimulation from a WT STN neuron (C) before (black) and after (gray) inhibition of astrocytic glutamate uptake with 100 nM TFB-TBOA and a BACHD STN neuron (D) before (green) and after (gray) TFB-TBOA application. (E) Line segment plots of amplitude weighted decay of compound NMDAR EPSCs before and following TFB-TBOA. The decays of compound NMDAR ESPCs were similar in WT and BACHD before TFB-TBOA application. In addition, inhibition of astrocytic glutamate uptake prolonged the decay of compound NMDAR ESPCs in all neurons tested. ns, not significant. Data for panels A–B provided in Figure 2—source data 1; data for panel E provided in Figure 2—source data 2.
-
Figure 2—source data 1
Amplitude and amplitude weighted decay of NMDAR-mediated EPSCs in Figure 2A–B.
- https://doi.org/10.7554/eLife.21616.006
-
Figure 2—source data 2
Amplitude weighted decay of compound NMDAR-mediated EPSCs in Figure 2E.
- https://doi.org/10.7554/eLife.21616.007
Figure 3
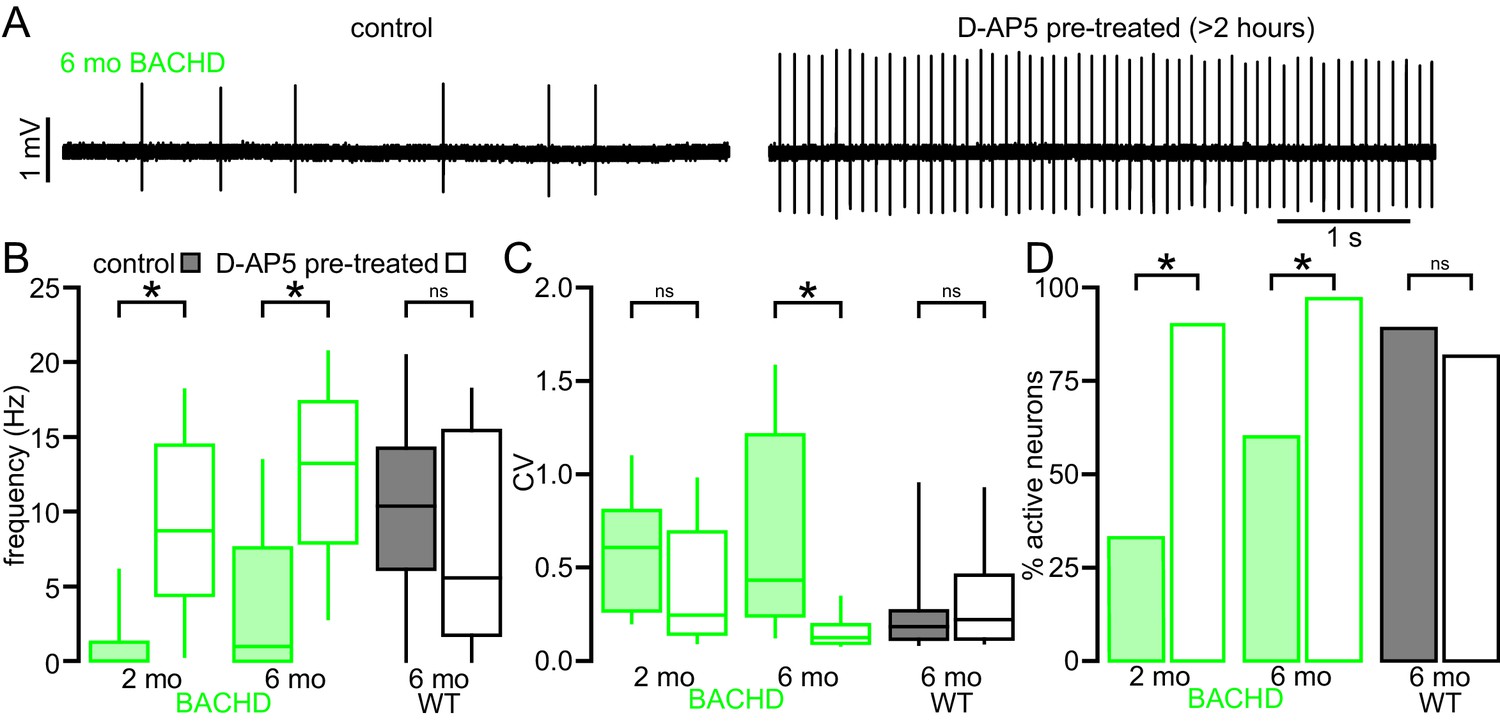
The impaired autonomous activity of STN neurons in BACHD mice is rescued by antagonism of NMDARs.
(A) Examples of loose-seal cell-attached recordings of 6-month-old BACHD STN neurons from an untreated slice (left) and a slice that was treated with 50 µM D-AP5 for 3–5 hr prior to recording. (B) Population data showing elevated autonomous firing in STN neurons from D-AP5 pre-treated slices from 2-month-old and 6-month-old BACHD mice but not in WT mice. (C) Population data showing increased firing regularity in STN neurons from D-AP5 pre-treated slices from 6-month-old BACHD mice but not 2-month-old BACHD mice or WT mice. (D) Population data showing a higher proportion of active neurons in STN neurons from D-AP5 pre-treated slices from 2-month-old and 6-month-old BACHD mice but not in WT mice. *p < 0.05. ns, not significant. Data for panels B–C provided in Figure 3—source data 1.
-
Figure 3—source data 1
Autonomous firing frequency and CV for BACHD control and D-AP5 pretreated STN neurons in Figure 3B–C.
- https://doi.org/10.7554/eLife.21616.009
Figure 4
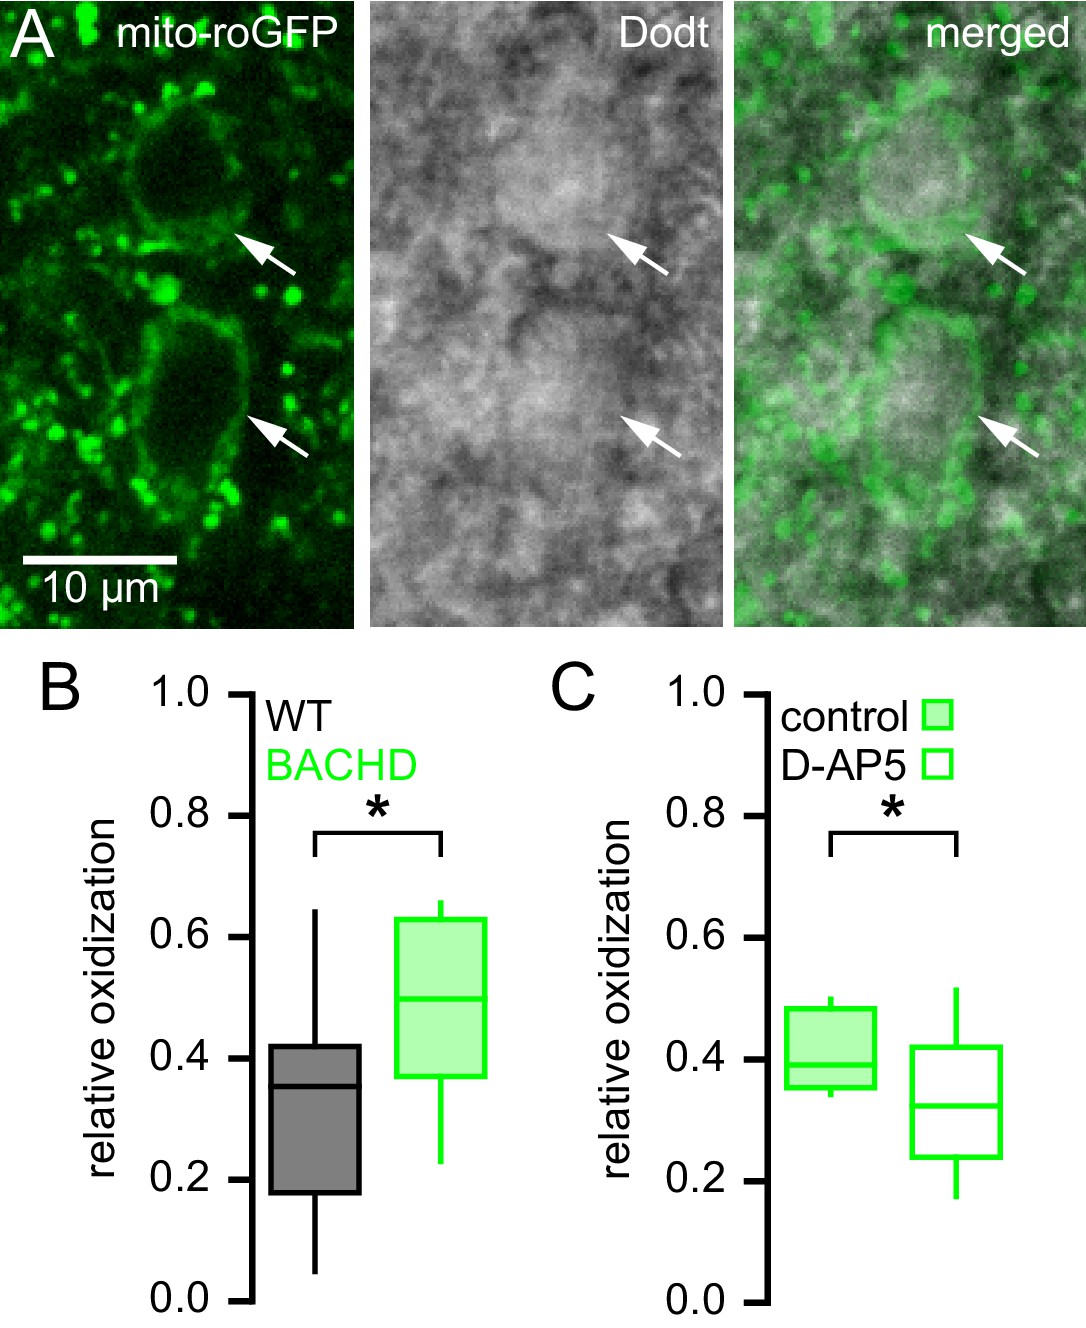
Mitochondrial oxidant stress is elevated in STN neurons from BACHD mice.
(A) Two-photon (left), Dodt contrast (center) and combined (right) images showing expression of MTS-roGFP (green) in STN neurons of a BACHD mouse. (B) Population data illustrating greater relative oxidation of mitochondria in BACHD STN neurons compared to WT STN neurons. (C) Population data showing that >3 hr pre-treatment with the NMDA receptor antagonist D-AP5 (50 µM) lowered the relative oxidation of mitochondria in BACHD STN neurons. Arrows indicate MTS-roGFP expressing STN neurons; *p < 0.05. Data for panel B provided in Figure 4—source data 1; data for panel C provided in Figure 4—source data 2.
-
Figure 4—source data 1
The relative mitochondrial oxidant stress of WT and BACHD STN neurons in Figure 4B.
- https://doi.org/10.7554/eLife.21616.011
-
Figure 4—source data 2
The relative mitochondrial oxidant stress of control and D-AP5 pre-treated BACHD STN neurons in Figure 4C.
- https://doi.org/10.7554/eLife.21616.012
Figure 5

The abnormal autonomous activity of STN neurons in BACHD mice is rescued by inhibition of KATP channels.
(A) Examples of loose-seal cell-attached recordings from STN neurons before (left) and after (right) inhibition of KATP channels with 100 nM glibenclamide. Upper traces show data from a WT mouse; lower traces show data from a BACHD mouse. (B) Population data (from 5–7-month-old mice). In WT neurons, inhibition of KATP channels had mixed effects on firing, whereas in BACHD neurons inhibition of KATP channels increased both the frequency and regularity of firing. (C) Examples of whole-cell recordings from WT and BACHD STN neurons before (left) and after (right) inhibition of KATP channels with 100 nM glibenclamide. (D) Population data (from 5–7-month-old mice). The interspike voltage trajectory was lower in BACHD neurons compared to WT. KATP channel inhibition increased the interspike voltage trajectory in BACHD neurons but had no effect in WT. As with cell-attached recordings, inhibition of KATP channels had mixed effects on firing in WT neurons, whereas in BACHD mice inhibition of KATP channels increased the frequency and regularity of firing. *p < 0.05. ns, not significant. Data for panel B provided in Figure 5—source data 1; data for panel D provided in Figure 5—source data 2.
-
Figure 5—source data 1
Autonomous firing frequency and CV for WT and BACHD STN neurons under control conditions and following glibenclamide application in Figure 5B.
- https://doi.org/10.7554/eLife.21616.014
-
Figure 5—source data 2
Autonomous interspike voltage trajectory, firing frequency and CV for whole-cell recordings from WT and BACHD STN neurons in Figure 5D.
- https://doi.org/10.7554/eLife.21616.015
Figure 6
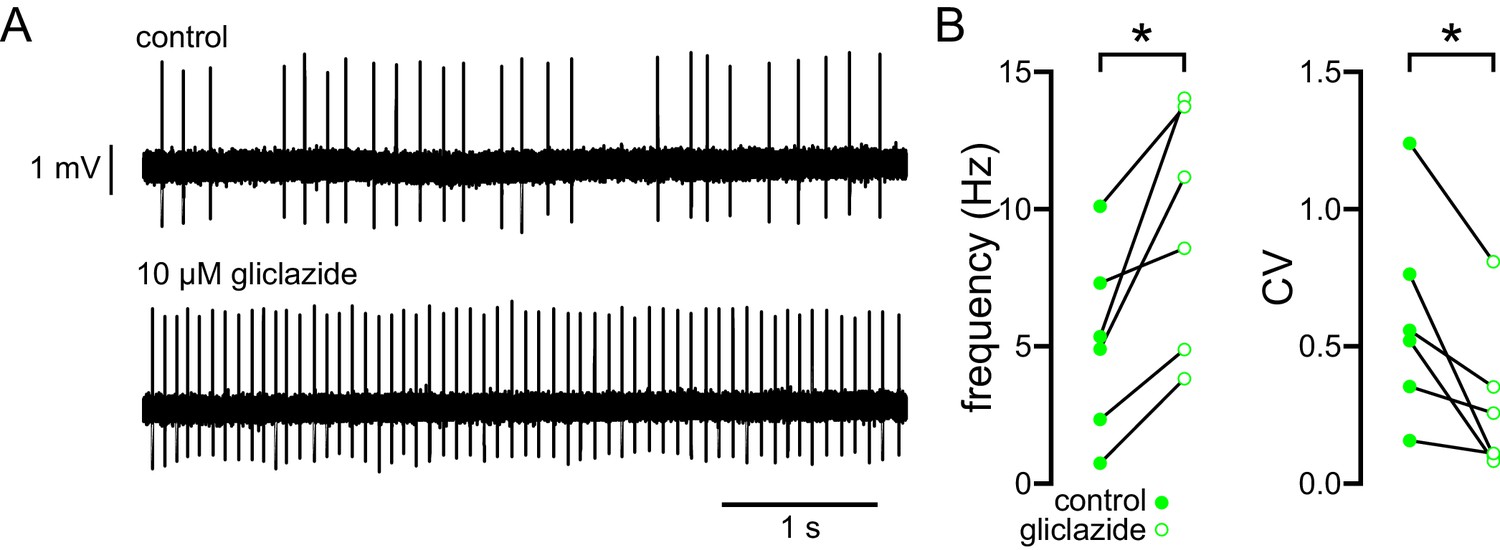
The abnormal autonomous activity of STN neurons in BACHD mice is rescued by inhibition of KATP channels with gliclazide.
(A) Examples of loose-seal cell-attached recordings of a STN neuron from a 6-month-old BACHD mouse before (upper) and after (lower) inhibition of KATP channels with 10 µM gliclazide. (B) Population data (5–7-month-old). In BACHD STN neurons inhibition of KATP channels with gliclazide increased the frequency and regularity of firing. *p < 0.05. Data for panel B provided in Figure 6—source data 1.
-
Figure 6—source data 1
Autonomous firing frequency and CV for WT and BACHD STN neurons under control conditions and following gliclazide application in Figure 6B.
- https://doi.org/10.7554/eLife.21616.017
Figure 7
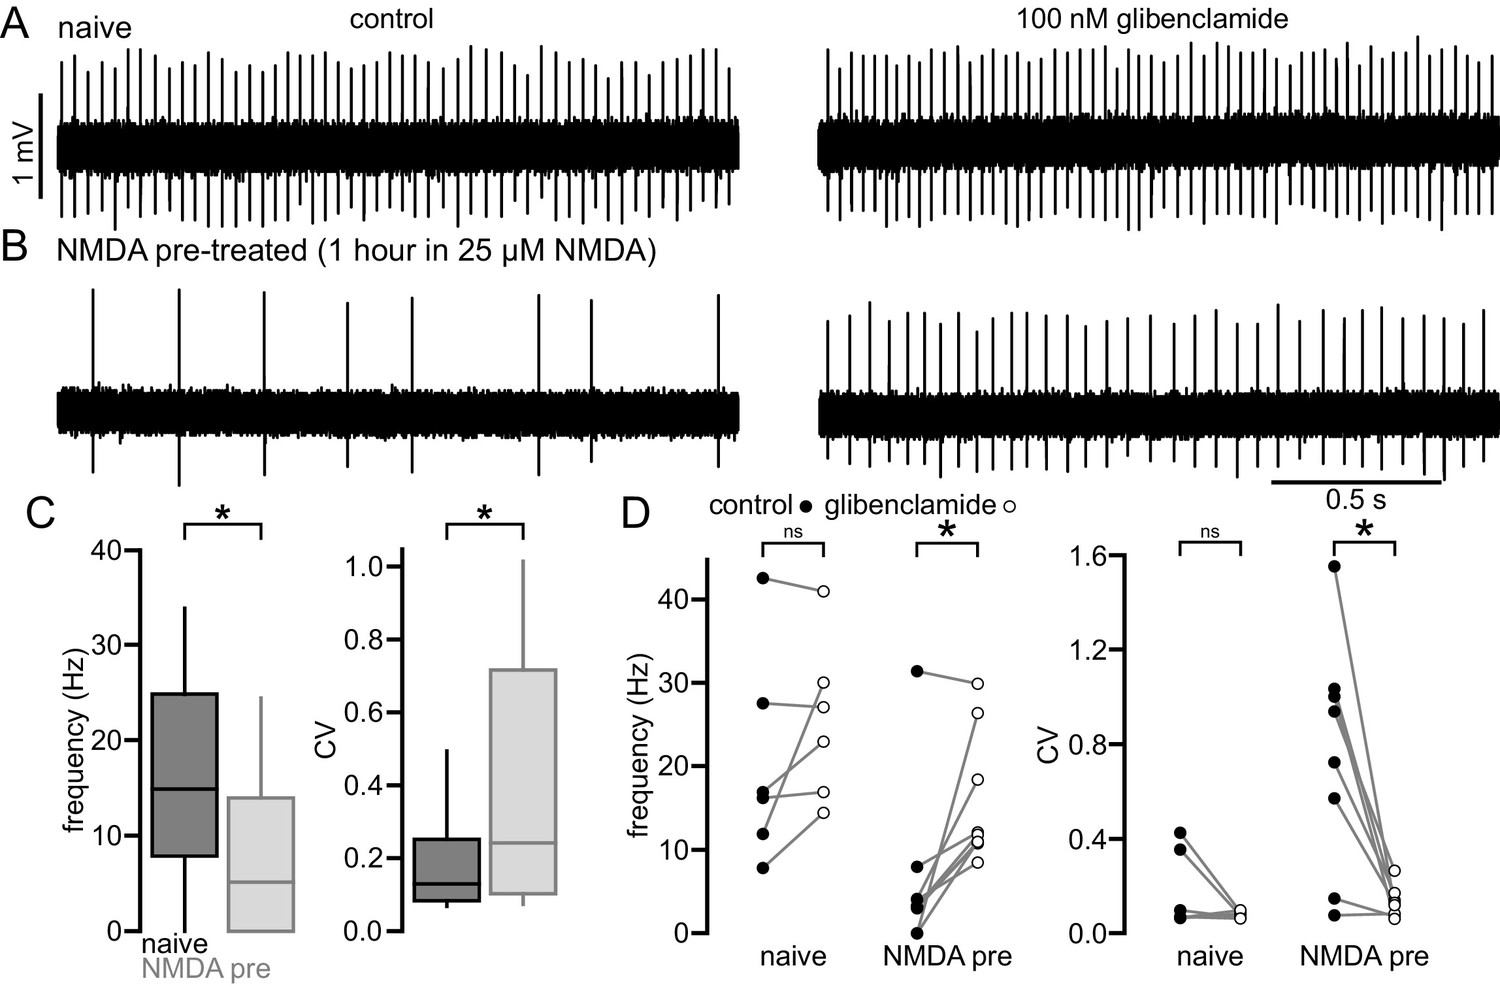
NMDA exposure persistently disrupts autonomous activity.
(A) Example of a loose-seal cell-attached recording from an STN neuron from an untreated slice from a C57/BL6 mouse before (left) and after (right) inhibition of KATP channels with 100 nM glibenclamide. (B) Example of a loose-seal cell-attached recording from an STN neuron from a slice treated with 25 µM NMDA for 1 hr prior to recording, before (left) and after (right) inhibition of KATP channels with 100 nM glibenclamide. (C) Population data. Following NMDA pre-treatment STN neurons had a lower frequency and regularity of firing. (D) Inhibition of KATP channels with 100 nM glibenclamide restored firing in STN cells from NMDA pre-treated slices but had no effect on firing from naïve slices. *p < 0.05. ns, not significant. Data for panel C provided in Figure 7—source data 1; data for panel D provided in Figure 7—source data 2.
-
Figure 7—source data 1
Autonomous firing frequency and CV for control and NMDA pre-treated C57BL/6 STN neurons in Figure 7C.
- https://doi.org/10.7554/eLife.21616.019
-
Figure 7—source data 2
Autonomous firing frequency and CV for control and NMDA pre-treated C57BL/6 STN neurons in control conditions and following glibenclamide application in Figure 7D.
- https://doi.org/10.7554/eLife.21616.020
Figure 8
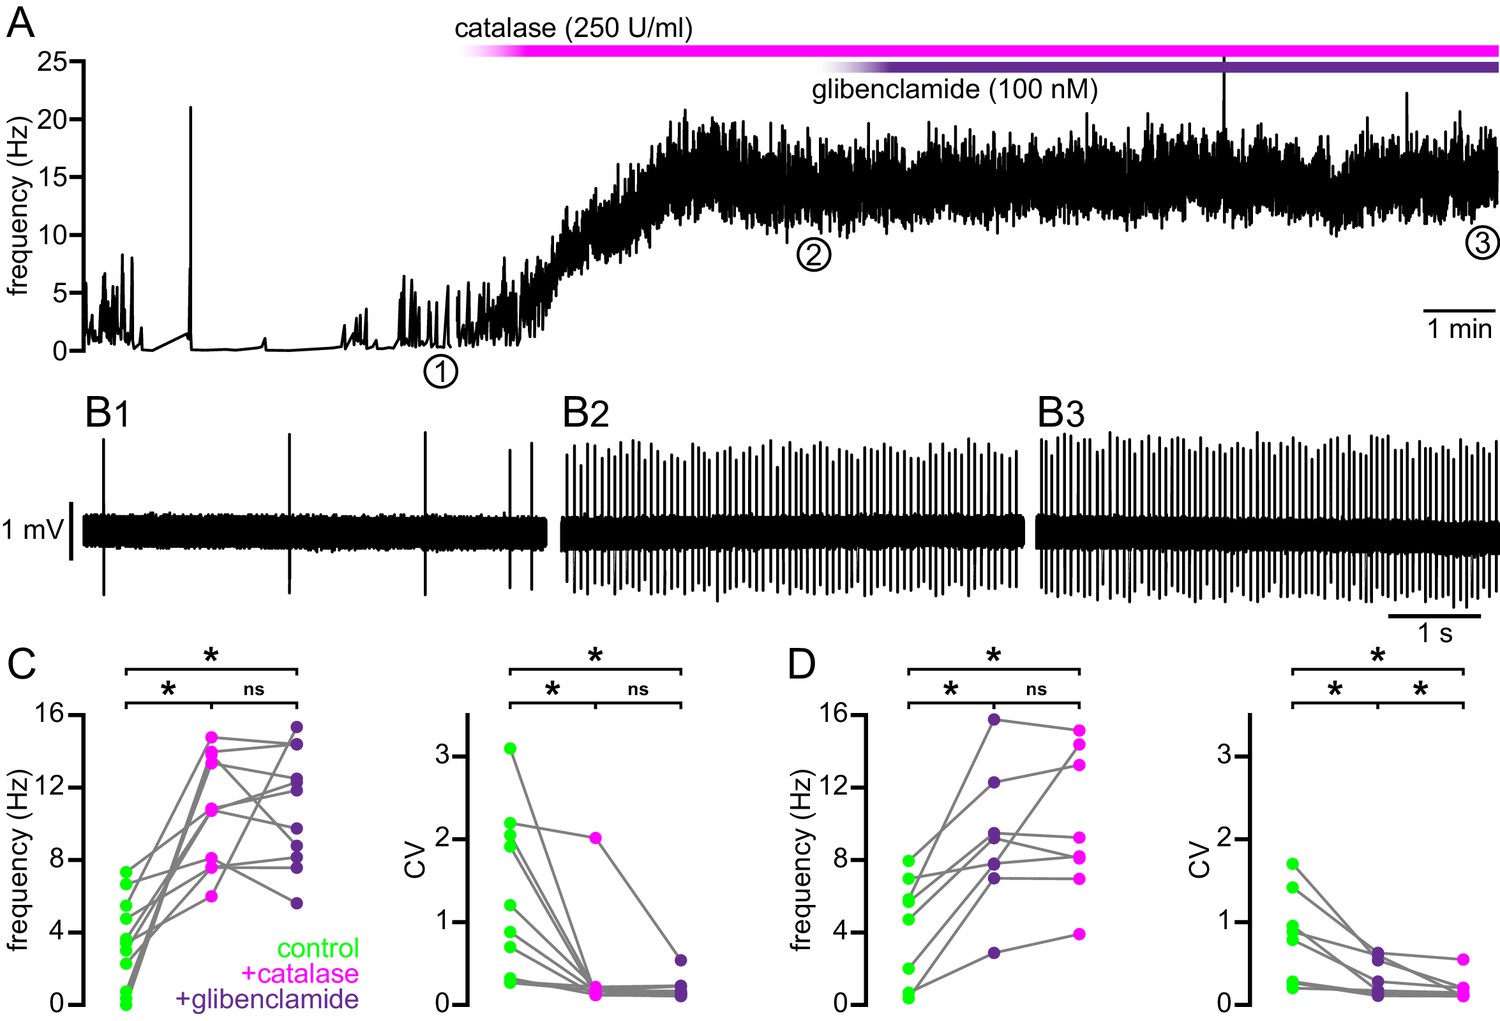
Break down of H2O2 by catalase rescues autonomous firing in BACHD STN neurons.
(A) Example showing the instantaneous firing rate of a BACHD STN neuron in control conditions, during the application of catalase (250 U/ml), and during co-application of catalase and glibenclamide (100 nM). (B1) Example of BACHD STN neuron firing in control conditions (marked 1 in A). (B2) Example of elevated firing during break down of H2O2 by catalase (marked 2 in A). (B3) Example showing no further elevation of firing rate during additional inhibition of KATP channels with glibenclamide (marked 3 in A). (C) Population data from 4–6-month old BACHD mice showing an increase in the frequency and regularity of firing following break down of H2O2, with no further changes upon KATP channel inhibition. (D) Population data showing an increase in the frequency and regularity of firing following KATP channel inhibition with no further change in firing rate and a slight increase in firing regularity upon H2O2 break down. *p < 0.05. ns, not significant. Data for panels C–D provided in Figure 8—source data 1.
-
Figure 8—source data 1
Autonomous firing frequency and CV for WT and BACHD STN neurons under control conditions and following catalase and/or glibenclamide application in Figure 8C–D.
- https://doi.org/10.7554/eLife.21616.022
Figure 9
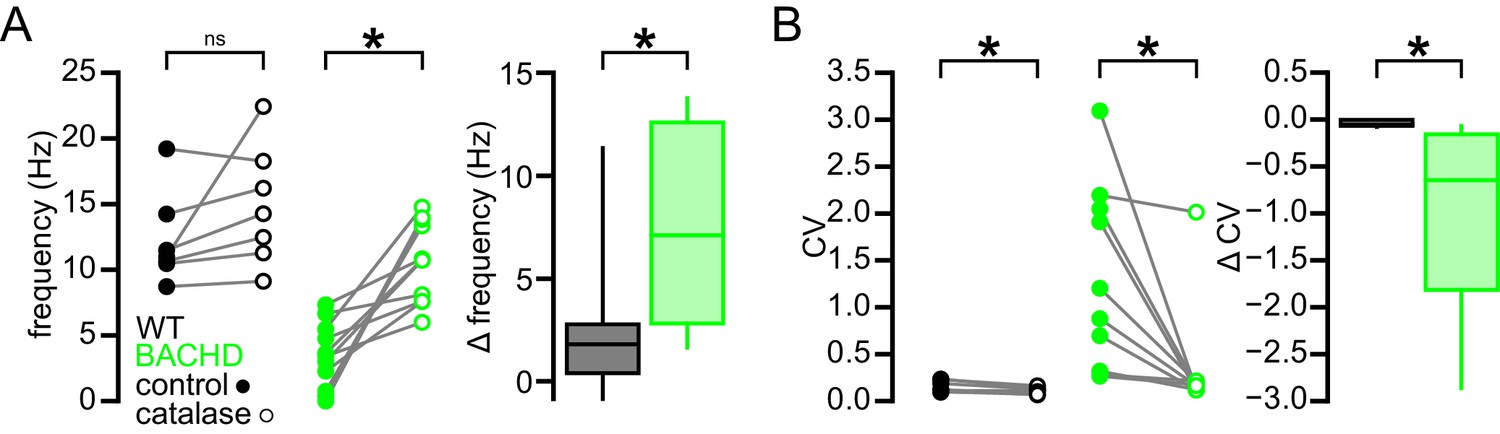
Break down of H2O2 by catalase has a relatively minimal effect on autonomous firing in WT STN neurons compared to BACHD neurons.
(A) Line plots showing of the effect of catalase (250 U/ml) on the frequency of autonomous action potential generation in STN neurons from WT (black) and BACHD mice (green; BACHD data same as in Figure 8C). Break down of H2O2 elevated autonomous firing in BACHD STN neurons only. The boxplot confirms that the elevation of firing due to catalase application was greater in BACHD mice. (B) Line plots illustrating a small but statistically significant effect of catalase on the regularity of autonomous action potential generation in STN neurons from WT mice (black) compared to a larger increase in regularity following catalase application in BACHD neurons (green; BACHD data same as in Figure 8C). The boxplot confirms that the increase in regularity due to catalase was greater in BACHD mice. *p < 0.05. ns, not significant. Data provided in Figure 9—source data 1.
-
Figure 9—source data 1
Autonomous firing frequency and CV for WT and BACHD STN neurons under control conditions and following catalase application in Figure 9.
- https://doi.org/10.7554/eLife.21616.024
Figure 10
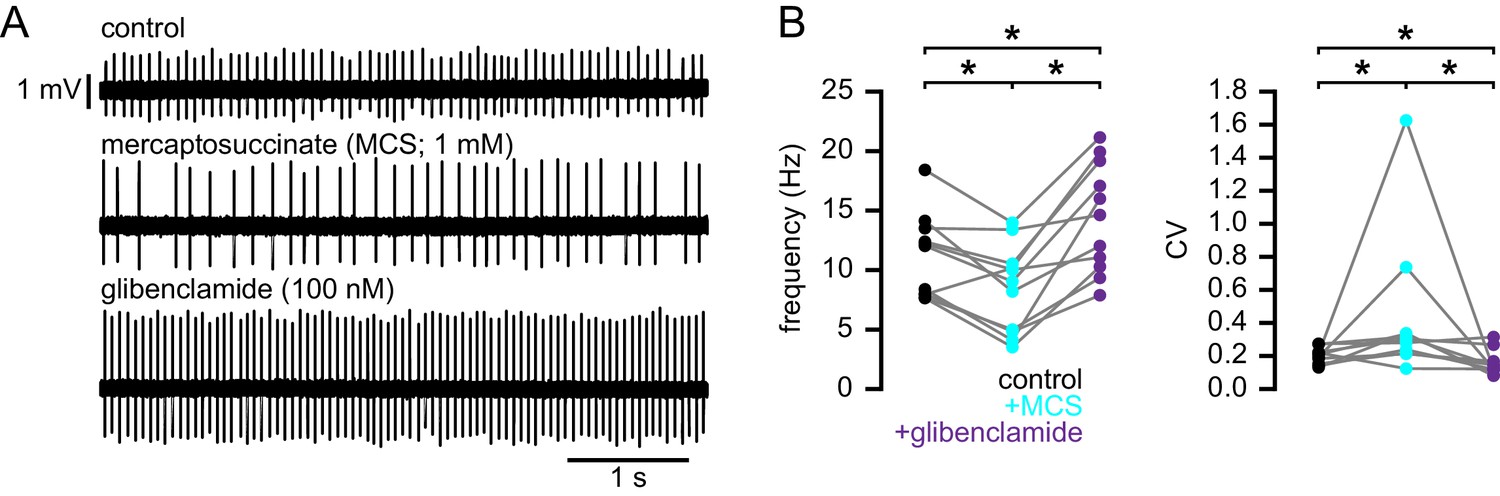
Increasing H2O2 levels by inhibition of glutathione peroxidase with mercaptosuccinic acid in WT mice leads to disruption of autonomous action potential generation through activation of KATP channels.
(A) Example of autonomous activity of a STN neuron from a C57BL/6 mouse in control conditions (upper), during application of 1 mM mercaptosuccinic acid (MCS; middle), and during subsequent application of 100 nM glibenclamide (lower). These recordings were made in the presence of 20 µM flufenamic acid to block transient receptor potential (TRP) channels (Lee et al., 2011). (B) Population data showing a decrease in the frequency and regularity of firing following MCS application, which was reversed by subsequent KATP channel inhibition. *p < 0.05. Data for panel B provided in Figure 10—source data 1.
-
Figure 10—source data 1
Autonomous firing frequency and CV for WT and BACHD STN neurons under control conditions and following MCS and glibenclamide application in Figure 10B.
- https://doi.org/10.7554/eLife.21616.026
Figure 11

Degeneration of STN neurons in BACHD mice.
(A) Expression of NeuN in STN neurons in a BACHD mouse (ZI, zone incerta; ic, internal capsule). (B) Population data showing a 32.3% reduction in the median STN neuron number and a 10.3% reduction in STN volume at 12 months old. *p < 0.05. ns, not significant. (C) Population data showing no difference in STN neuron number, STN volume or density between WT and BACHD mice at 2 months old. Data for panels B–C provided in Figure 11—source data 1.
-
Figure 11—source data 1
BACHD STN neuron counts, density and STN volume in Figure 11B–C.
- https://doi.org/10.7554/eLife.21616.028
Figure 12
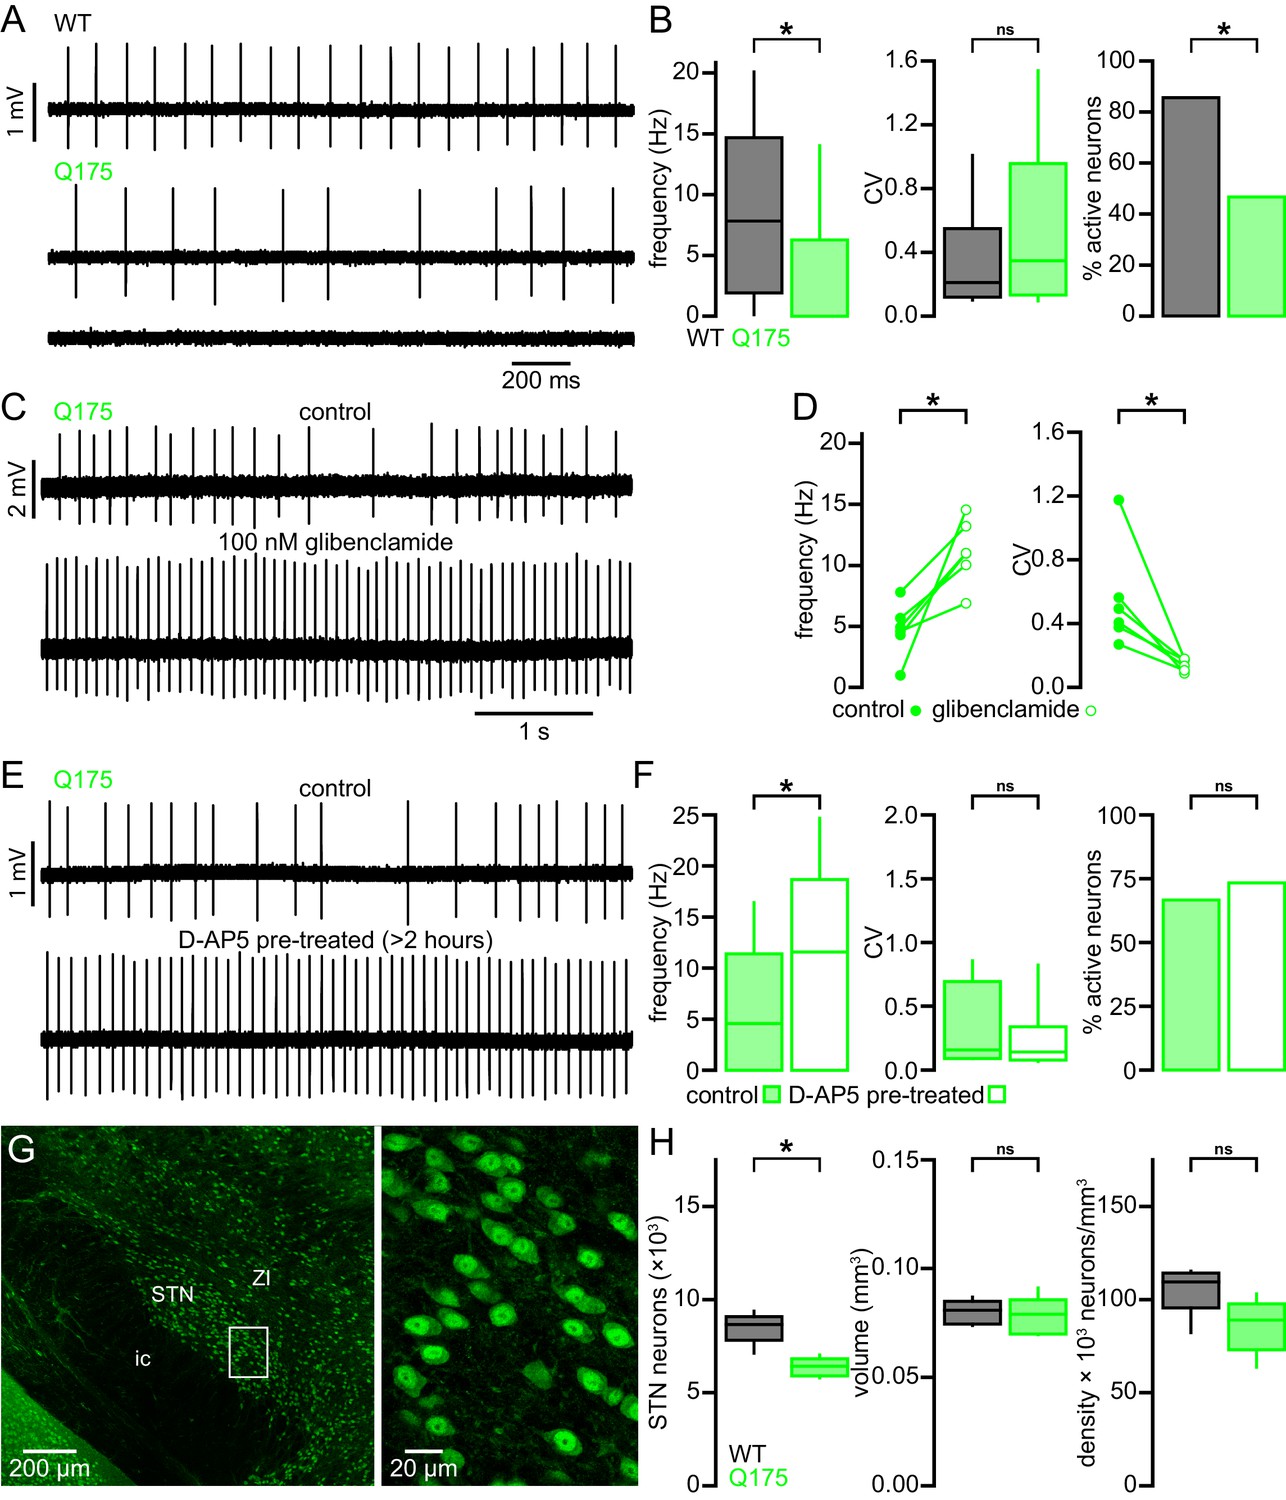
STN neurons exhibit similar dysfunction and degeneration in Q175 mice.
(A) Examples of impaired (middle, lower) autonomous firing of neurons from Q175 mice relative to WT (upper). (B) Population data showing STN neuron firing rate, CV, and proportion of active neurons from 6-month-old WT and Q175 mice. (C) Example showing the autonomous firing of a STN neuron from a Q175 mouse before (upper) and during (lower) inhibition of KATP channels with glibenclamide (100 nM). (D) Paired data confirming that inhibition of KATP channels in Q175 STN neurons consistently increased the rate (left) and regularity (right) of autonomous firing. (E) Examples of autonomous action potential generation from Q175 STN neurons from an untreated slice (upper) and a slice treated with 50 µM D-AP5 for 3–5 hr prior to recording (lower). (F) Population data showing STN neuron firing rate, CV, and the proportion of active cells in untreated and D-AP5 treated slices. The frequency of autonomous firing increased in D-AP5 treated slices. (G) Expression of NeuN in STN neurons in a Q175 mouse. (H) Population data showing STN neuron number (left), STN volume (center), and neuron density (right) in 12-month-old Q175 mice. The number of STN neurons was lower in Q175 mice compared to WT. *p < 0.05. ns, not significant. Data for panel B provided in Figure 12—source data 1; data for panel D provided in Figure 12—source data 2; data for panel F provided in Figure 12—source data 3; data for panel H provided in Figure 12—source data 4.
-
Figure 12—source data 1
Autonomous firing frequency and CV for Q175 and WT STN neurons in Figure 12B.
- https://doi.org/10.7554/eLife.21616.030
-
Figure 12—source data 2
Autonomous firing frequency and CV for Q175 in control conditions and following glibenclamide application Figure 12D.
- https://doi.org/10.7554/eLife.21616.031
-
Figure 12—source data 3
Autonomous firing frequency and CV for control and D-AP5 pre-treated Q175 STN neurons in Figure 12F.
- https://doi.org/10.7554/eLife.21616.032
-
Figure 12—source data 4
Q175 STN neuron counts, density and STN volume in Figure 12H.
- https://doi.org/10.7554/eLife.21616.033
Download links
A two-part list of links to download the article, or parts of the article, in various formats.
Downloads (link to download the article as PDF)
Open citations (links to open the citations from this article in various online reference manager services)
Cite this article (links to download the citations from this article in formats compatible with various reference manager tools)
Early dysfunction and progressive degeneration of the subthalamic nucleus in mouse models of Huntington's disease
eLife 5:e21616.
https://doi.org/10.7554/eLife.21616


