Lissencephaly-1 is a context-dependent regulator of the human dynein complex
- MRC Laboratory of Molecular Biology, United Kingdom
Figures
Figure 1 with 1 supplement
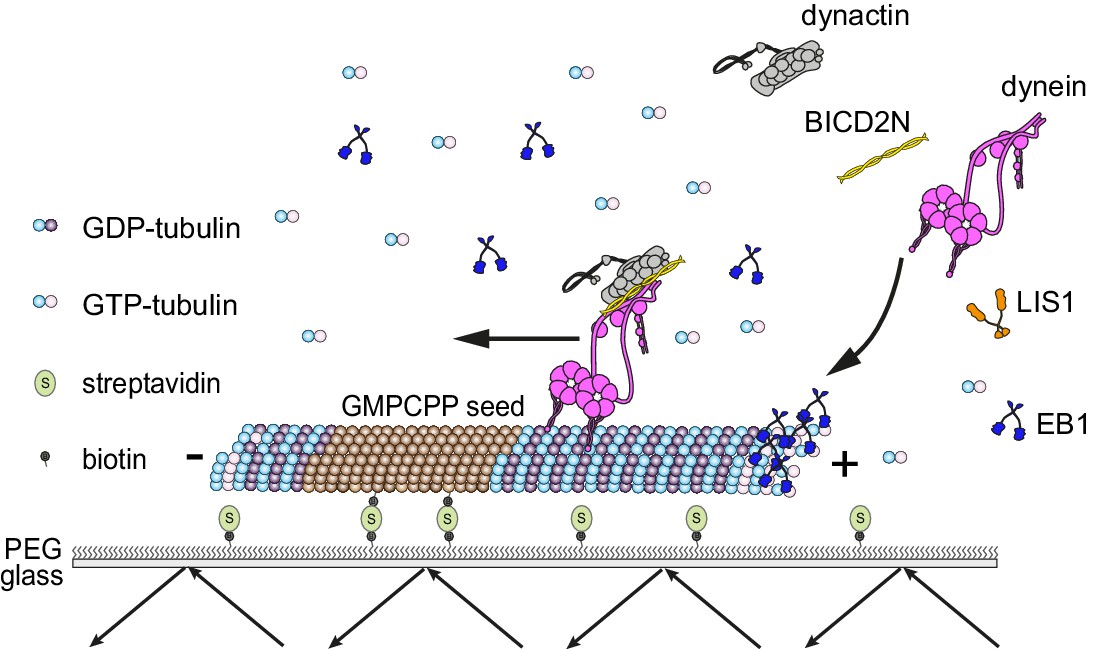
Diagram of the in vitro assay system.
Dynamic microtubules are produced from stable, immobilised seeds and the behaviour of human recombinant dynein complexes studied in the presence and absence of the indicated regulatory co-factors, including activators of processive, minus end-directed motion (straight arrow). − and + refer to the microtubule minus and plus end, respectively. Purified dynein and its regulators were incubated together before diluting in a solution containing EB1 and free tubulin, and injection into flow chambers that had stable microtubule seeds preadsorbed on the glass.
Figure 1—figure supplement 1
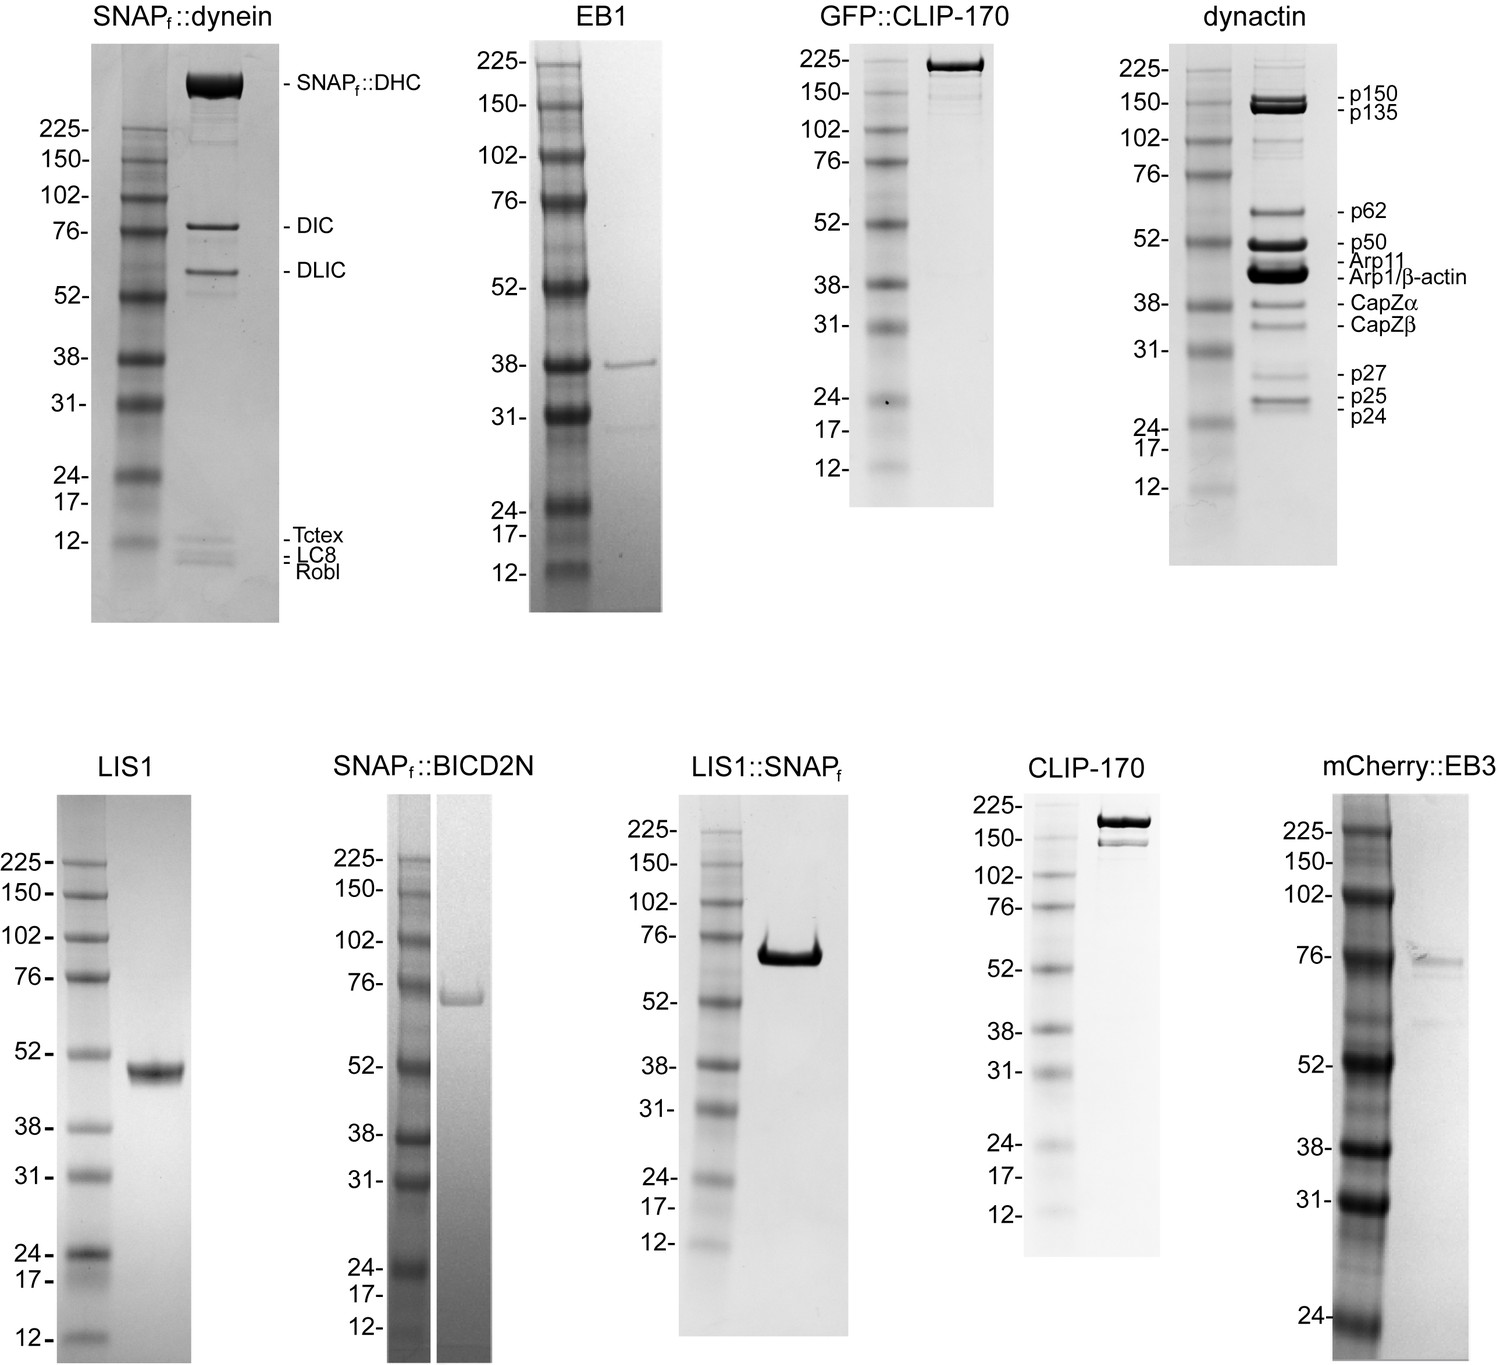
Purity of protein preparations.
Coomassie-stained SDS gels of the indicated samples and molecular weight markers. Note the dynactin preparation from pig brains contains a mixture of p150 and its splice form p135, which lacks the CAP-Gly domain required for interaction with EB1 and efficient binding to microtubules (Lazarus et al., 2013; Tokito et al., 1996).
Figure 2 with 3 supplements

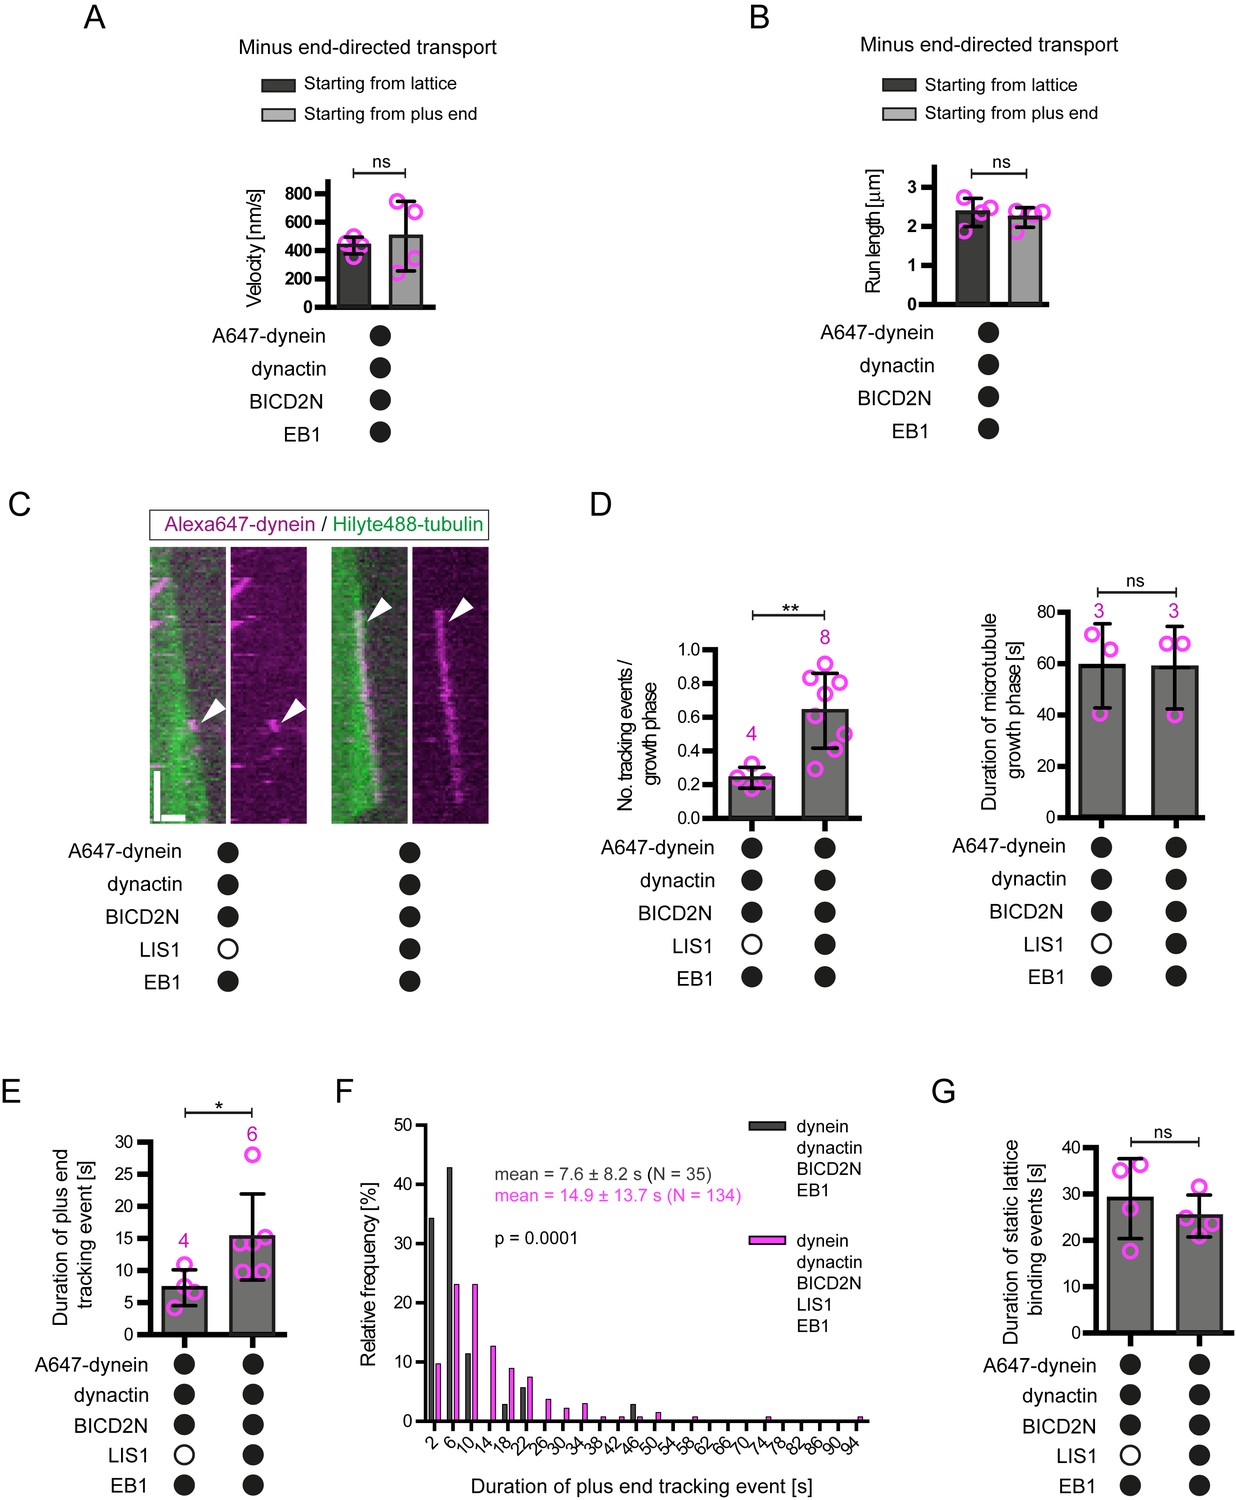
LIS1 induces persistent association of dynein complexes with the plus end of growing microtubules in the presence of EB1 and dynactin.
(A) Kymographs showing examples of dynein behaviour on growing microtubules in the presence of the indicated proteins (filled circles). In A and F: Y-axis, time; x-axis, distance; scale bars, 10 s and 1 μm. In these and other kymographs, the microtubule plus end is to the right. Arrowheads, plus-end tracking events. As expected, minus end-directed dynein transport was hardly ever observed in these conditions or others without either dynactin or BICD2N. (B–D) Quantification of LIS1’s effects on the number (B) and duration (C–D) of dynein tracking events at the plus end during growth phases and (E) the duration of dynein binding events on lattice sites (including the GMPCPP seed). (F) Kymographs showing examples (arrowheads) of TMR-LIS1 localisation with Alexa647-dynein that undergoes tracking on growing microtubule plus ends (left kymograph) or lattice binding (right kymograph). LIS1 was labelled with a C-terminal SNAPf tag. See Figure 2—figure supplement 3 for quantification of co-localisation in multiple chambers. In B, C and E, means ± S.D. are shown with values for each chamber represented as magenta circles (four chambers per condition, except for dynein alone and dynein plus LIS1 in B) (three chambers); mean of 35 growth phases (B), 22 events (C–D) or 87 events (E) analysed per chamber). (D) shows overall distribution of the duration of dynein’s plus-end tracking events during growth phases (errors are S.D.; N is total number of tracking events summed from four chambers per condition). Statistical significance in B–E was evaluated with a Mann-Whitney test (*p<0.05; ns, not significant). Dynactin complexes and LIS1 dimers were used, respectively, at a molar excess of 2x and 20x that of dynein. The concentration of the dynein complex in the assembly mixes was 20 nM, with a 1 in 10 dilution added to the imaging chamber. In these and other experiments EB1 dimers were present in the imaging chamber at a concentration of 100 nM.
Figure 2—figure supplement 1
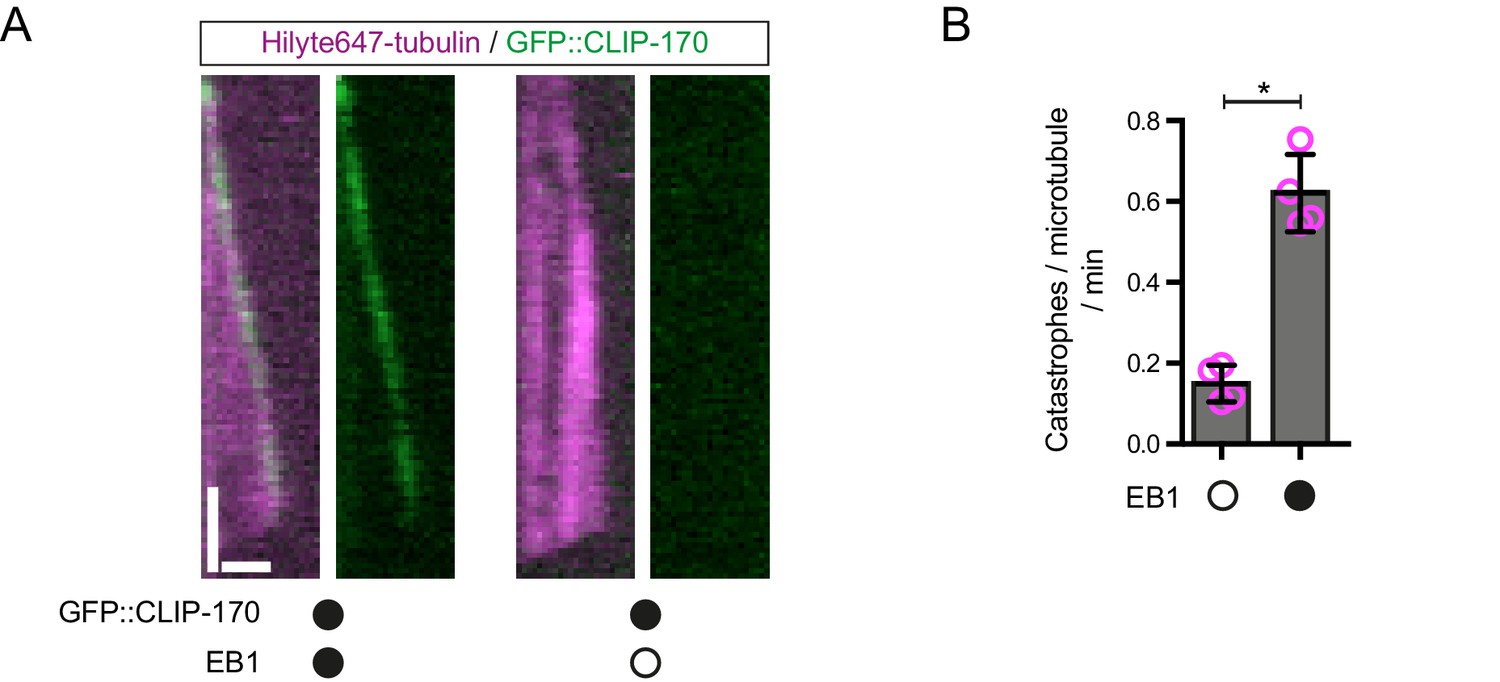
Further evidence of EB1 functionality.
(A) Representative kymographs showing that GFP::CLIP-170 robustly tracks the plus ends of growing microtubules in an EB1-dependent manner, as observed previously (Bieling et al., 2008; Dixit et al., 2009). This observation indicates that unlabelled EB1 tracks growing plus ends in our assay conditions. Y-axis, time; x-axis, distance; scale bars, 10 s and 1 μm. (B) EB1 strongly increases the catastrophe rate of dynamic microtubules, as expected. Means ± S.D. are shown with values for each chamber represented as magenta circles (four chambers per condition, 15 microtubules analysed per chamber). Statistical significance was evaluated with a Mann-Whitney test (*p<0.05). Concentrations of EB1 and CLIP-170 dimers in the imaging chambers were 100 nM and 50 nM, respectively.
Figure 2—figure supplement 2
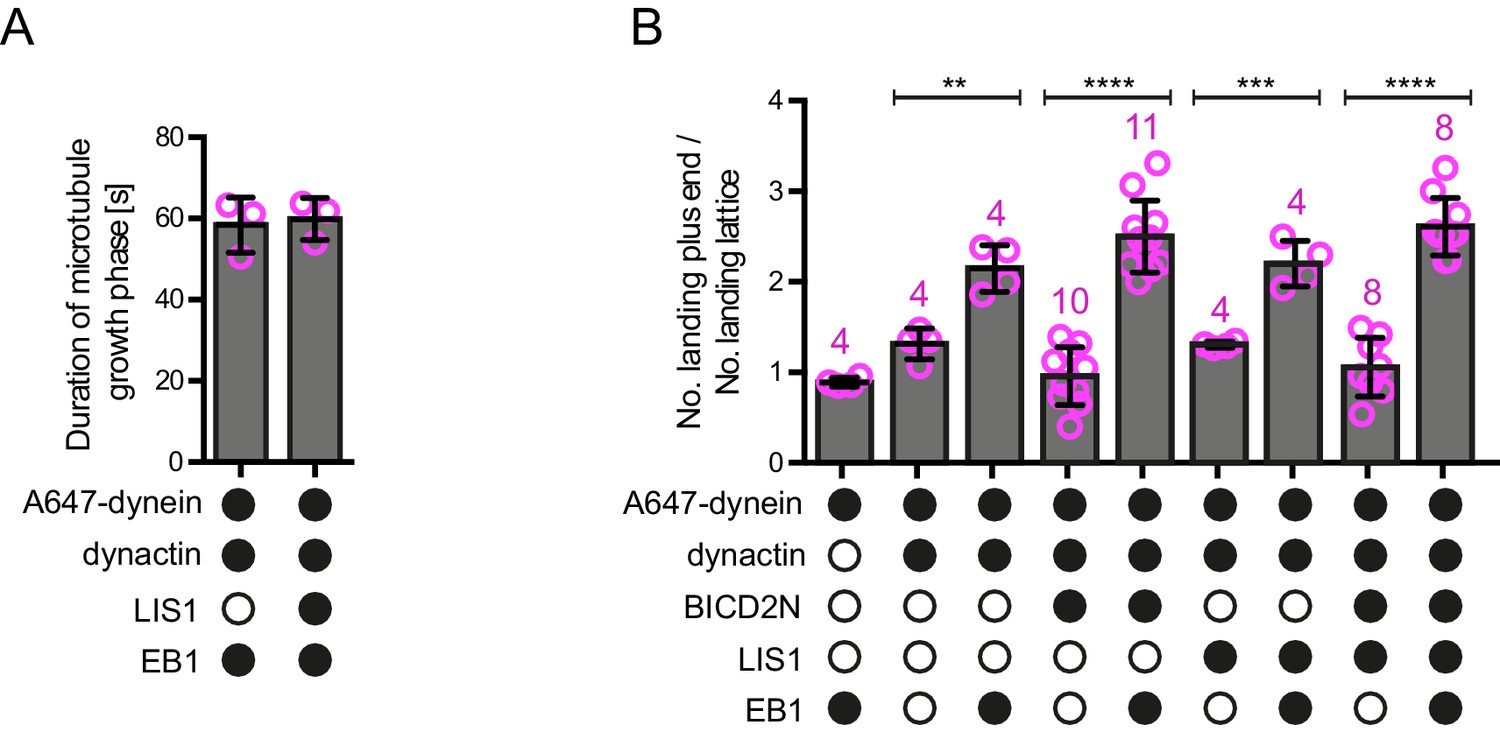
Additional data on microtubule dynamics and the landing site of dynein on growing microtubules.
(A) Quantification of the duration of microtubule growth phases in the presence of the indicated proteins, demonstrating that LIS1’s ability to increase the number of dynein plus-end tracking events per growth phase (Figure 2B) is not due to prolonged growth phases. Thus, LIS1 increases the frequency of tracking events. (B) Quantification of the ratio of dynein landing events on the growing plus end vs an equivalently sized site on the GDP lattice, regardless of the dwell time of dynein at these sites (note that many dynein binding events were shorter than the 1.8 s threshold applied when classifying tracking events at the plus end). In the presence of both EB1 and dynactin there is an ~2–2.5-fold increase in the likelihood of landing on the plus end vs the lattice site; this behaviour is not influenced by the presence of LIS1 or BICD2N. As shown in Figure 4B, we observed an approximately six-fold preference for initiation of minus end-directed dynein complexes at the plus end vs an equivalently-sized GDP lattice site when BICD2N, dynactin and EB1 were present. The obligatory presence of dynactin in minus end-directed complexes offers an explanation for their preferential targeting to the plus end compared to that of the total dynein population, which contains non-motile complexes that may not be associated with dynactin. In A–B, means ± S.D. are shown with values for each chamber represented as magenta circles (three chambers per condition in A; the number of chambers is shown in magenta above the bars in B; mean of 30 growth phases (A) or 68 complexes (B) were analysed per chamber). In B, statistical significance was evaluated with a one-way ANOVA with Sidak’s multiple comparisons test (****p<0.0001; ***p<0.001; **p<0.01). See Figure 2 legend for experimental details.
Figure 2—figure supplement 3
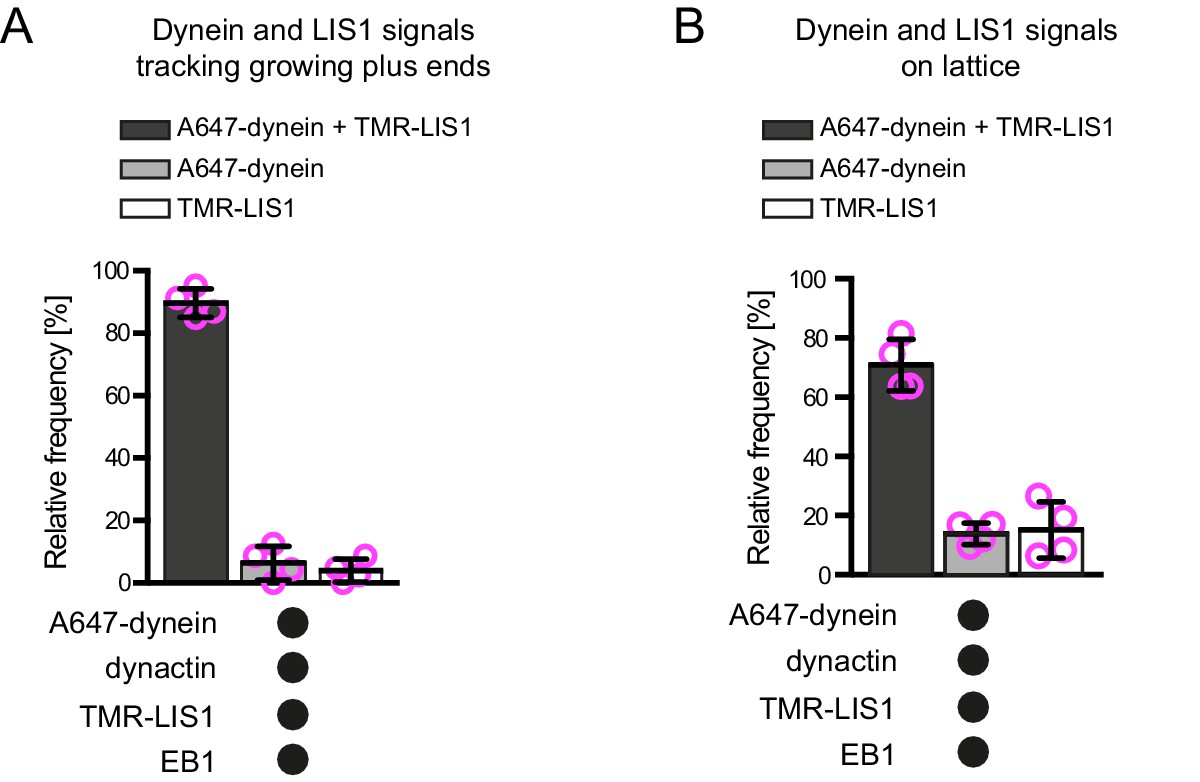
Additional data on dynein and LIS1 co-localisation on dynamic microtubules.
Quantification of the proportion of plus-end tracking (A) or lattice binding (B) events of Alexa647-dynein or TMR-LIS1 on growing microtubules with detectable signals from both proteins. Means ± S.D. are shown with values for each chamber represented as magenta circles (four chambers per condition; mean of 27 (A) or 75 (B) complexes analysed per chamber). Note that in these and other co-localisation experiments the degree of complex formation may be underestimated by photobleaching of the dye or incomplete protein labelling. See Figure 2 legend for experimental details.
Figure 3 with 1 supplement
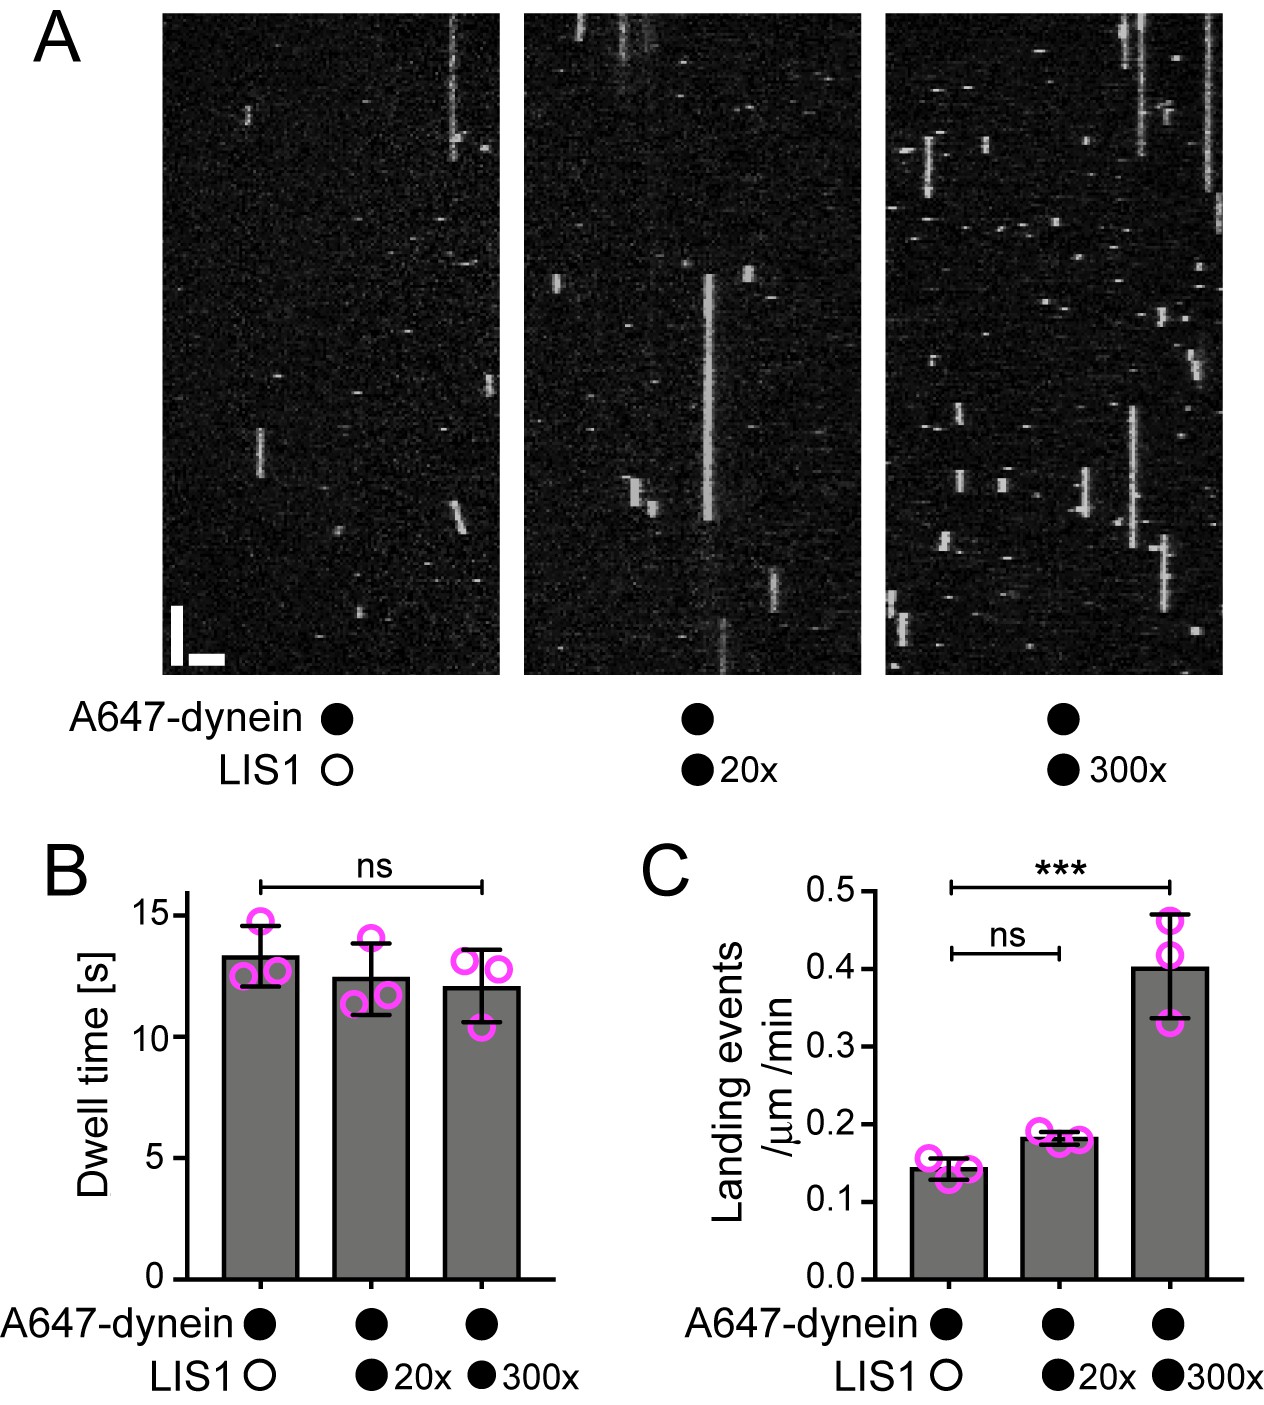
Evaluation of the influence of LIS1 on the interaction of individual human dynein complexes with microtubules in the absence of other factors.
(A) Kymographs showing examples of dynein behaviour on taxol/GMPCPP-stabilised microtubules in the presence of the stated molar excess of LIS1 to dynein. Y-axis, time; x-axis, distance; scale bars, 10 s and 2 μm (B) Quantification of the effect of LIS1 on dynein dwell time (B) and landing rate (events per μm of microtubule per minute) (C). Means ± S.D. are shown with values for each chamber represented as magenta circles (three chambers per condition; mean of 28 microtubules and 210 complexes (no LIS1 and 20x LIS1) or 545 complexes (300x LIS1) analysed per chamber). Statistical significance was evaluated with a one-way ANOVA with Sidak’s multiple comparisons test (***p<0.001; ns, not significant). Dynein concentration in the assembly mixes was 100 nM, with a 1 in 20 dilution added to the imaging chambers.
Figure 3—figure supplement 1
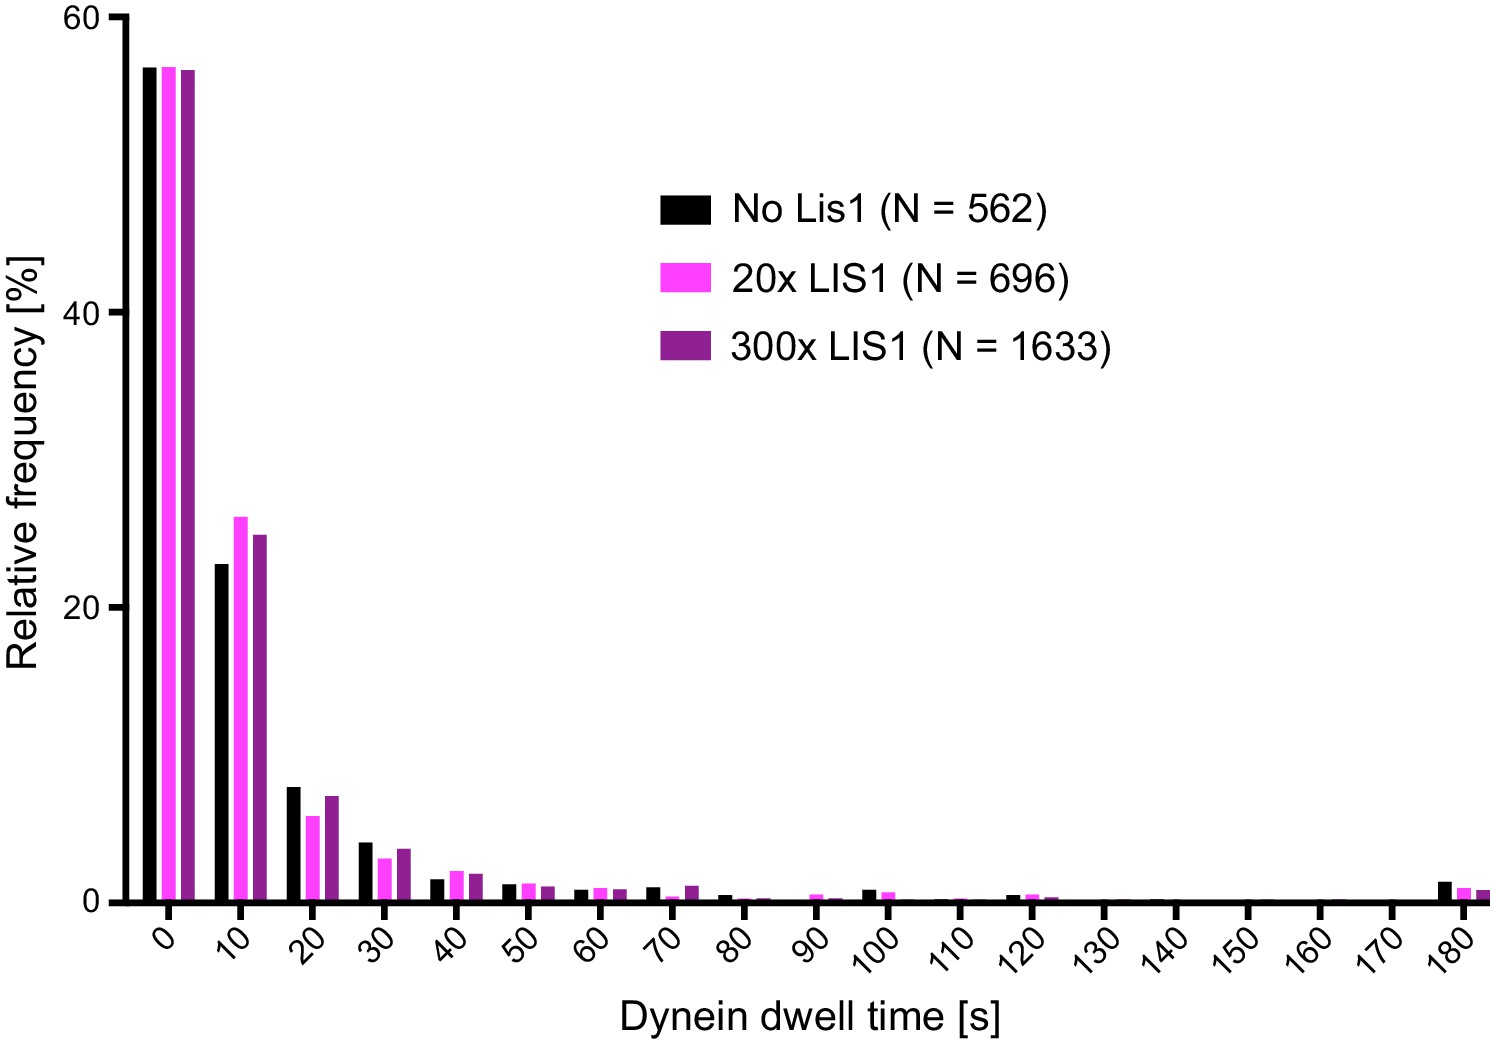
Distribution of dwell times of individual dynein complexes on stabilised microtubules in the presence and absence of LIS1.
For each condition, data were collated from three chambers; N is number of complexes analysed. See Figure 3 legend for experimental details.
Figure 4 with 3 supplements

The effect of EB1 and LIS1 on the initiation site of minus end-directed transport of dynein in the presence of dynactin and BICD2N.
(A) Kymographs showing examples of dynein behaviour on polymerising microtubules. Arrowheads, examples of initiation of minus end-directed motion of dynein from the growing plus end in the presence of dynactin, BICD2N and EB1. In these and other experiments, BICD2N has an N-terminal SNAPf tag. In A and D: y-axis, time; x-axis, distance; scale bars, 10 s and 1 μm. (B) Quantification of initiation of minus end-directed motility of dynein on the growing plus end vs a site on the GDP lattice of the same length. (C) Quantification of the source of dynein used for minus end-directed motion of dynein-dynactin-BICD2N complexes on dynamic microtubules. (D) Kymographs of growing microtubules showing that Alexa647-BICD2N can be detected with TMR-dynein engaged in minus end-directed transport (left kymograph, arrowhead) or end tracking (right kymograph, arrowhead). See Figure 4—figure supplement 3B for another example of BICD2N localisation on minus end-directed dynein. BICD2N was labelled using the SNAPf tag. (E) Quantification of the proportion of plus-end tracking events of TMR-dynein or Alexa647-BICD2N on growing microtubules with detectable signals from both proteins. In B, C and E, means ± S.D. are shown with values for each chamber represented as magenta circles (four chambers per condition, except in B) where the number of chambers is shown in magenta above the bars; mean of 22 complexes (B), 33 growth phases (C) or 17 complexes (E) analysed per chamber). Statistical significance was evaluated with a one-way ANOVA with Sidak’s multiple comparisons test (B) or a Mann-Whitney test (C) (****p<0.0001; ***p<0.001; *p<0.05; ns, not significant). Dynactin complexes, BICD2N dimers and LIS1 dimers were used, respectively, at a molar excess of 2x, 10x and 20x that of dynein. Dynein concentration in the assembly mixes was 20 nM, with a 1 in 10 (A–C) or 1 in 2 (D,E) dilution added to the imaging chambers.
Figure 4—figure supplement 1
Additional data on the behaviour of dynein on dynamic microtubules in the presence of BICD2N and other regulators.
(A–B) Quantification of velocity (A) and run length (B) of processive dynein-dynactin-BICD2N complexes that initiate transport from the plus end or a GDP lattice site in the presence of EB1. (C) Kymographs showing that LIS1 also induces long tracking events in the presence of EB1 and dynactin when BICD2N is present in the chamber. Y-axis, time; x-axis, distance; scale bars, 10 s and 1 μm. Arrowheads indicate plus-end tracking behaviour. (D) Quantification of LIS1’s effects on the number of dynein tracking events per growth phase and the duration of growth phases in the presence of dynactin, BICD2N and EB1. Collectively, these data demonstrate that LIS1 increases the frequency of plus-end tracking events on growing microtubules. (E–F) Quantification of LIS1’s effects on the duration of dynein tracking events on the growing plus end in the presence of dynactin, BICD2N and EB1. (G) Quantification of LIS1’s effect on the duration of binding of static dynein complexes on the lattice (including the GMPCPP seed) in the presence of dynactin, BICD2N and EB1. In A, B, D, E and G, means ± S.D. are shown with values for each chamber represented as magenta circles (four chambers per condition in A, B and G; the number of chambers is shown in magenta above the bars in D–E; mean of 14 complexes (A–B), 34 growth phases (D), 12 events (E) or 61 events (G) were analysed per chamber). (F) shows the overall distribution of the duration of dynein tracking events at the plus end of growing microtubules (errors are S.D.; N is number of tracking events summed from a total of at least four chambers). Statistical significance in A, B and D–G was evaluated with a Mann-Whitney test (**p<0.01; *p<0.05; ns, not significant). See Figure 4A–C legend for experimental details.
Figure 4—figure supplement 2
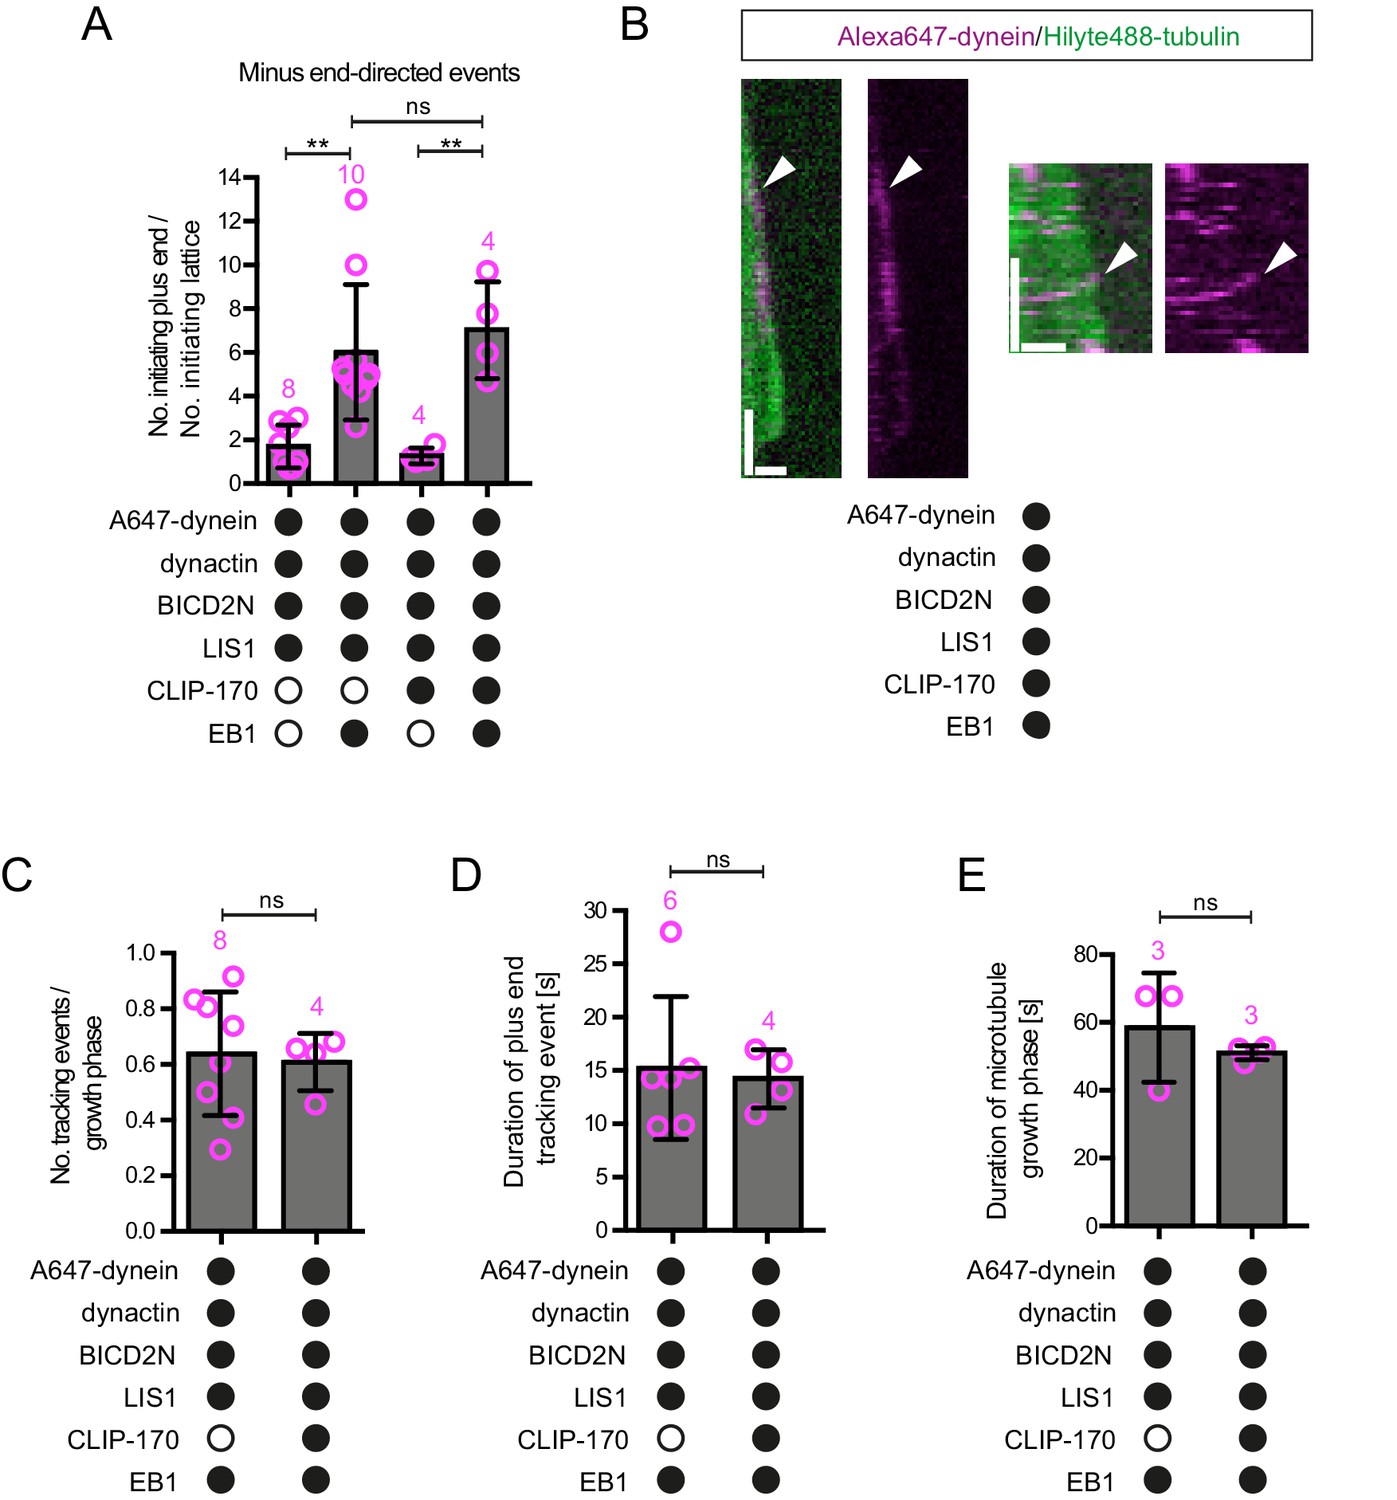
Evaluation of the effects of CLIP-170 on dynein behaviour in the presence of dynactin, BICD2N, LIS1 and EB1.
(A) Quantification of the initiation of minus end-directed motility of dynein on the growing plus end vs a site on the GDP lattice of the same length. The inclusion of CLIP-170 in the assay does not influence the likelihood of initiating transport from the plus end vs a lattice site in the presence of the indicated proteins. (B) Kymographs showing examples of end tracking (left panels) and minus end-directed behaviours (right panels) of dynein (arrowheads) in the presence of CLIP-170. We did not observe any events in which minus end-directed transport events initiated from an end tracking dynein complex. Y-axis, time; x-axis, distance; scale bars, 10 s and 1 μm. (C–E) Evaluation of the influence of CLIP-170 on the number of dynein tracking events per growth phase (C), the duration of plus-end tracking events (D), and the duration of microtubule growth phases (E) in the presence of the indicated proteins. In A and C–E, means ± S.D. are shown with values for each chamber represented as magenta circles (number of chambers analysed per condition shown above the bars; mean of 28 events (A), 31 growth phases (C), 20 events (D) or 29 growth phases (E) analysed per chamber. Dynactin complexes, BICD2N dimers, LIS1 dimers and CLIP-170 dimers were used, respectively, at a molar excess of 2x, 10x, 20x and 25x compared to dynein. Dynein concentration in the assembly mixes were 20 nM, with a 1 in 10 dilution added to the imaging chambers. Statistical significance was evaluated with a one-way ANOVA with Sidak’s multiple comparisons test (A) or a Mann-Whitney test (C–E). (**p<0.01; ns, not significant). Data in the absence of CLIP-170 are reproduced from Figure 4 and Figure 4—figure supplement 1.
Figure 4—figure supplement 3
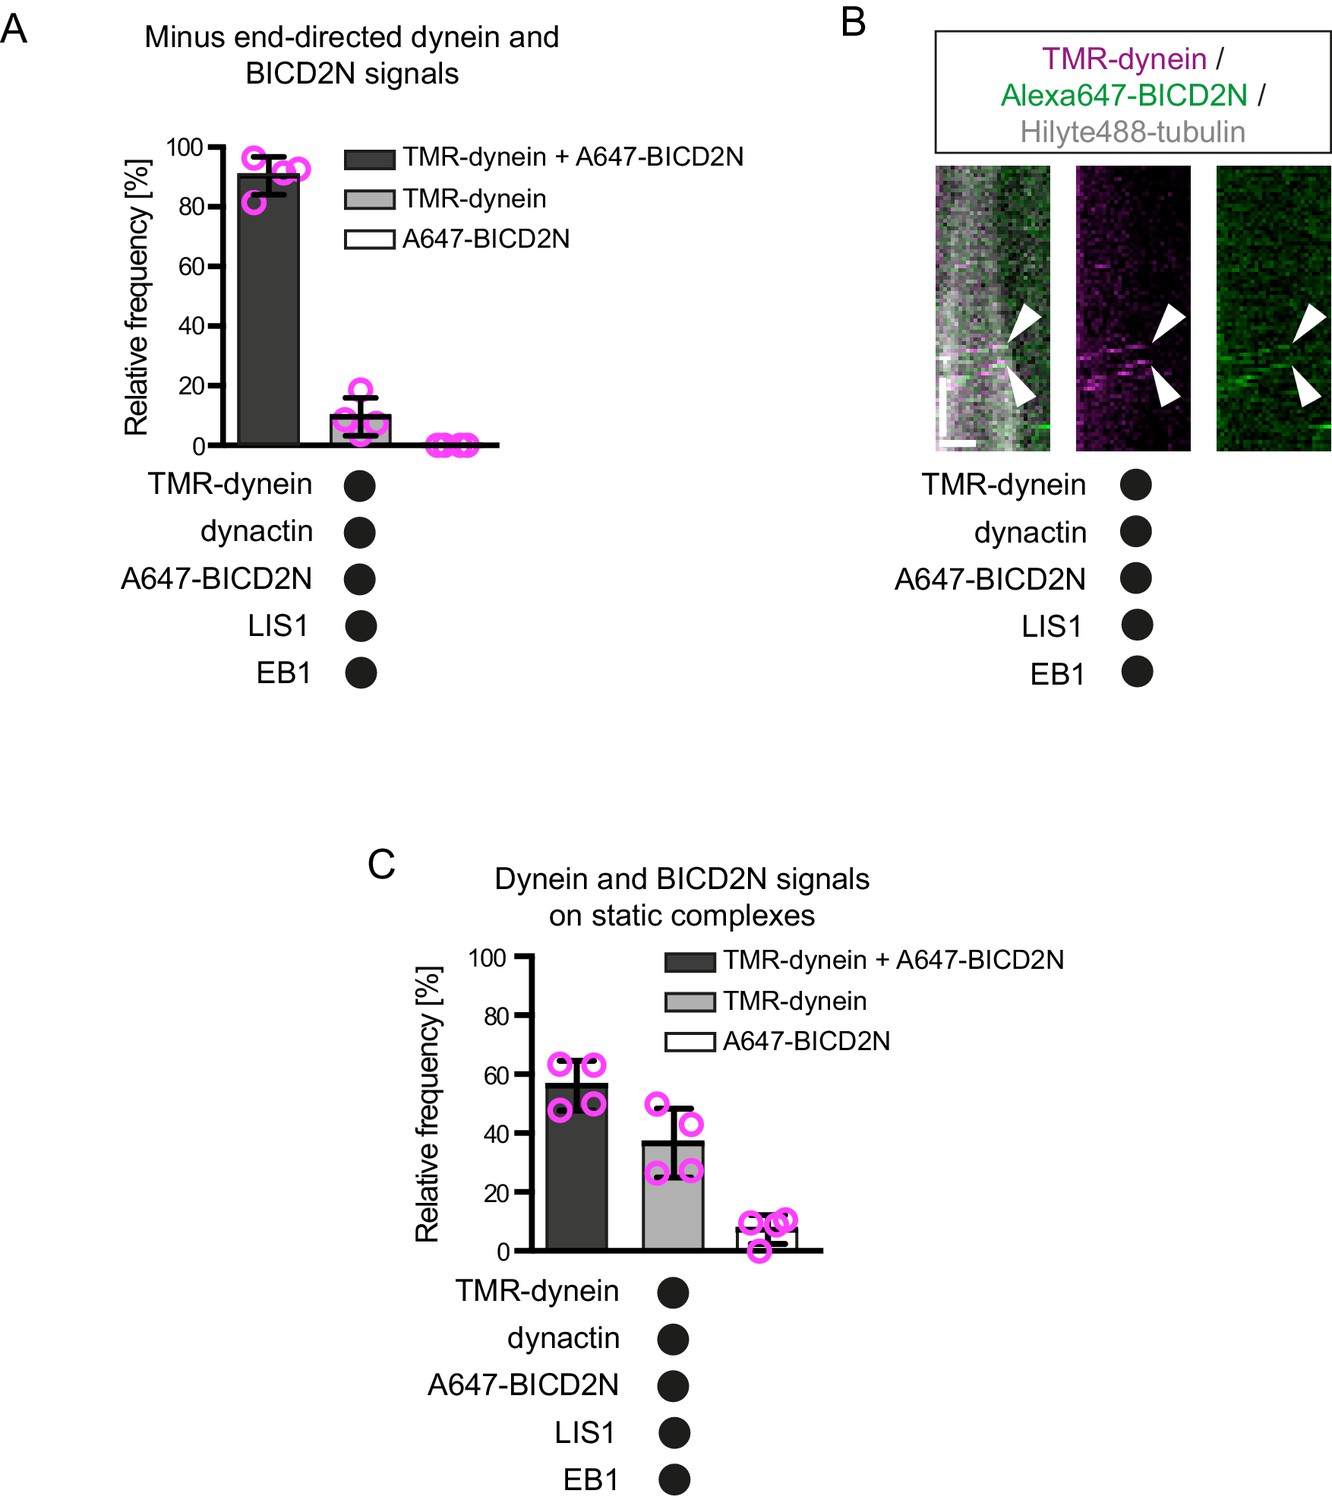
Further analysis of the co-localisation of BICD2N and dynein signals on dynamic microtubules.
(A) Quantification of the proportion of minus end-directed transport events of TMR-dynein or Alexa647-BICD2N with detectable signals from each protein. (B) Additional example of a kymograph illustrating co-localisation of BICD2N with minus end-directed dynein on dynamic microtubules. Arrowheads indicate initiation of transport from the plus end. Y-axis, time; x-axis, distance; scale bars, 10 s and 1 μm. (C) Quantification of the proportion of static binding events of TMR-dynein or Alexa647-BICD2N on the lattice with detectable signals from each protein. In A and C, means ± S.D. are shown with values for each chamber represented as magenta circles (four chambers per condition; mean of 27 (A) or 22 (C) complexes analysed per chamber). See Figure 4D,E legend for experimental details.
Figure 5
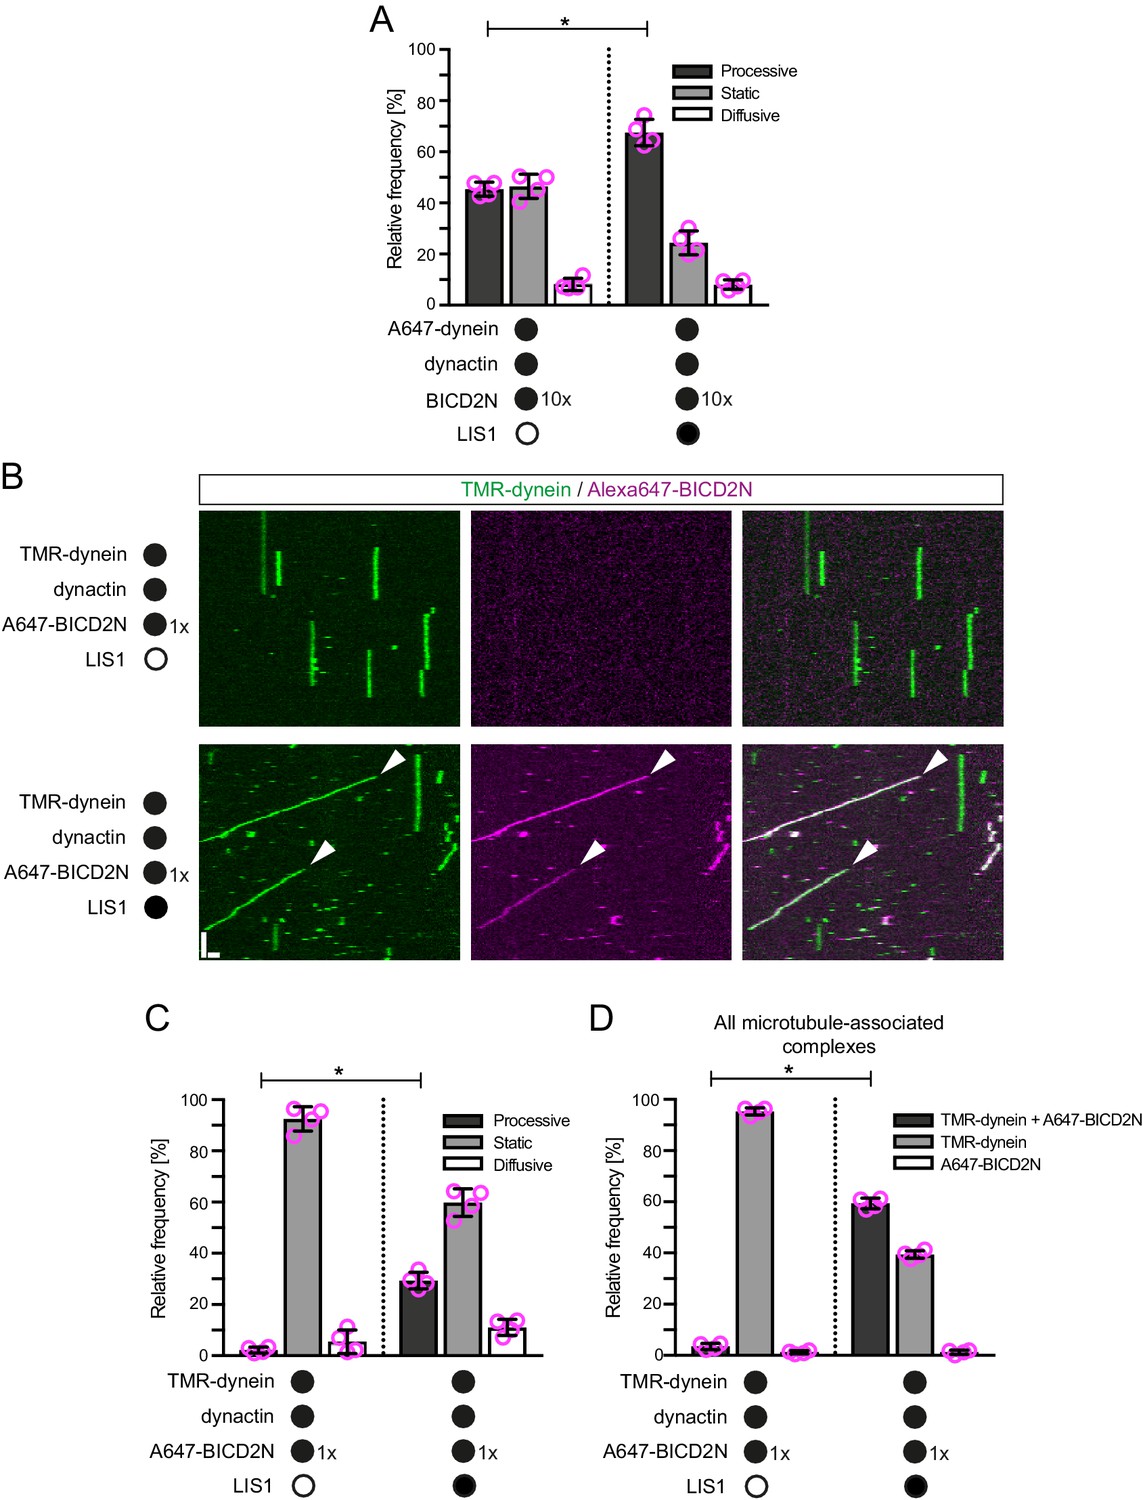
LIS1 promotes the frequency of processive minus end-directed movement of dynein in the presence of dynactin and BICD2N.
(A) Quantification of the effect of LIS1 on the motile behaviour of microtubule-associated dynein complexes in the presence of BICD2N and dynactin. Dynactin complexes, BICD2N dimers and LIS1 dimers were used, respectively, at a molar excess of 2x, 10x and 20x compared to dynein. (B) Kymographs from experiments in which the relative concentration of BICD2N is lowered 10-fold. Arrowheads show examples of processive minus end-directed dynein-dynactin-BICD2N complexes in the presence of LIS1. Y-axis, time; x-axis, distance; scale bars, 10 s and 1 μm. (C–D) Quantification of the effect of LIS1 on the motile behaviour (C) or association with BICD2N (D) of microtubule-associated dynein complexes in the presence of dynactin and the lower relative concentration of BICD2N. A and B–D used dynamic and stabilised microtubules, respectively. In A, C and D, means ± S.D. are shown with values for each chamber represented as magenta circles (four chambers per condition; mean of 177 (A) or 249 (C–D) complexes analysed per chamber). Statistical significance was evaluated with a Mann-Whitney test (*p<0.05). Dynein concentration in the assembly mixes was 20 nM (with a 1 in 10 dilution added to the imaging chamber) (A) or 100 nM (with a 1 in 40 dilution added to the imaging chambers (B–D)).
Figure 6 with 3 supplements
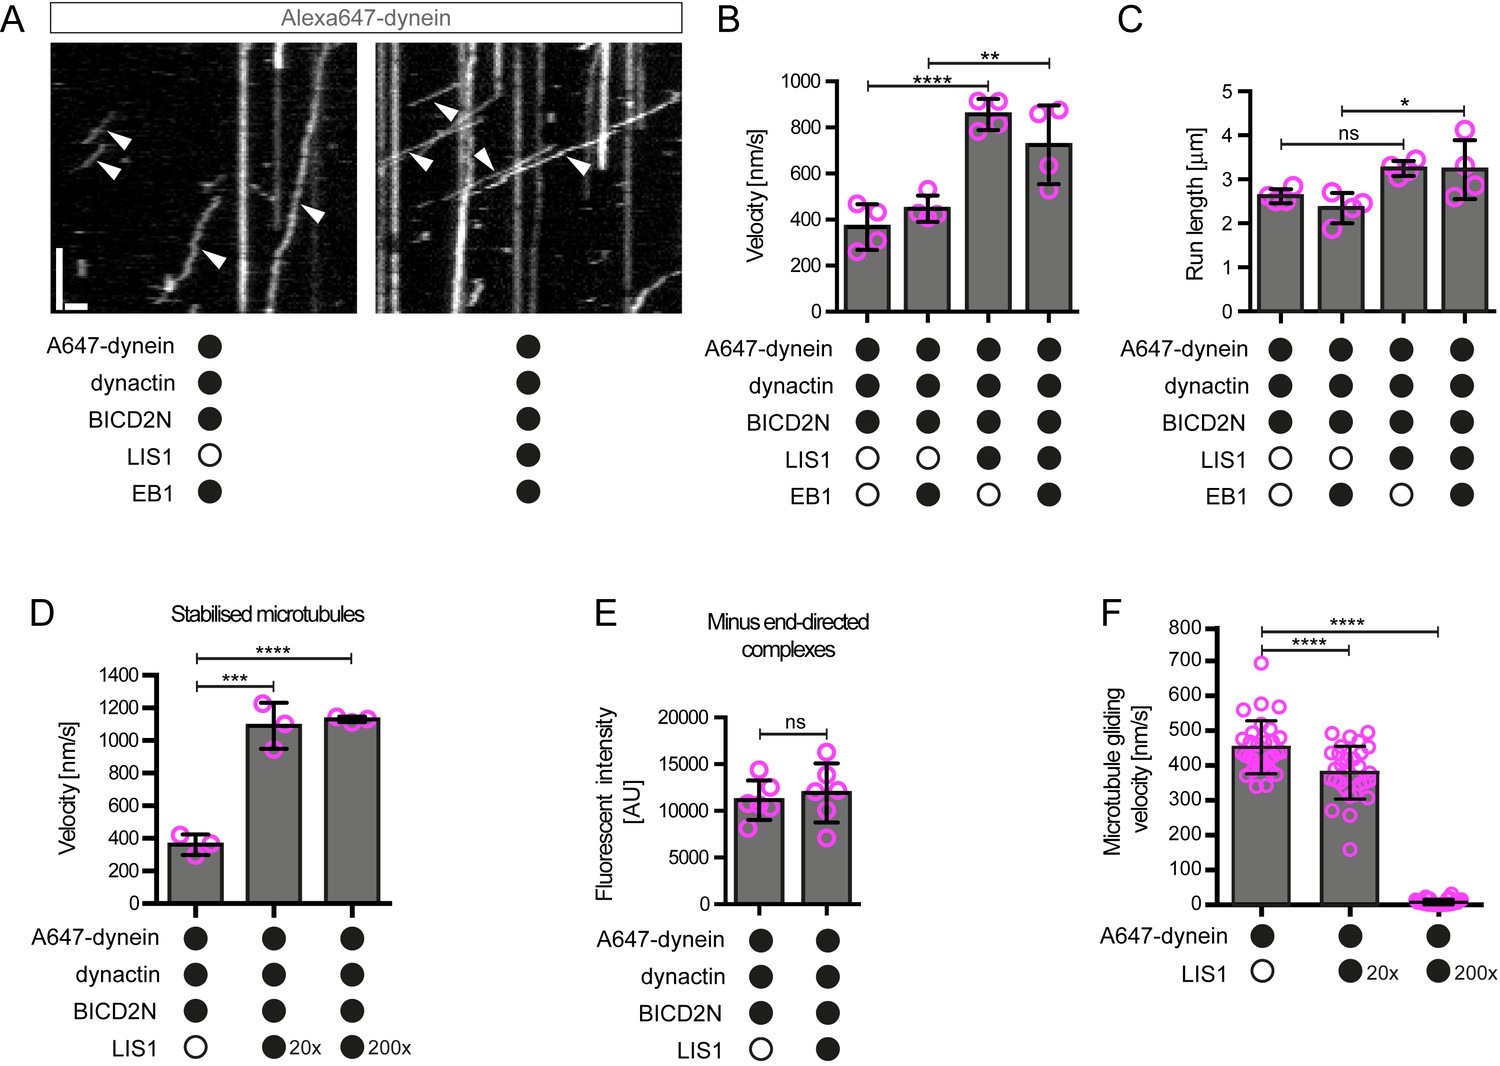
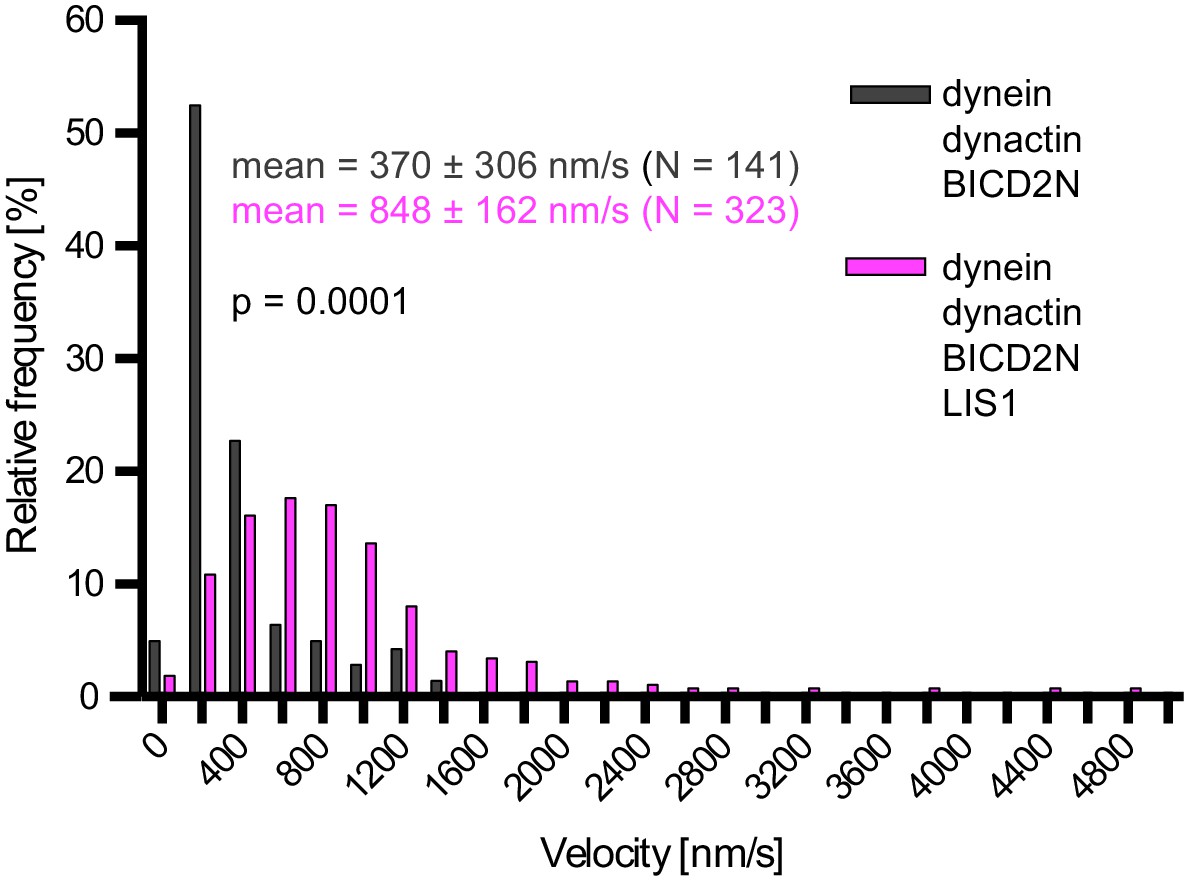
LIS1 increases the velocity of minus end-directed movements of dynein in the presence of dynactin and BICD2N.
(A) Kymograph from experiments with dynamic microtubules illustrating increased velocity of minus end-directed dynein-dynactin-BICD2N complexes in the presence of LIS1. Arrowheads: examples of minus end-directed complexes. Y-axis, time; x-axis, distance. Scale bars, 3 s and 1 μm. (B–C) Quantification of the velocity (B) and run length (C) of minus end-directed dynein-dynactin-BICD2N complexes on dynamic microtubules in the presence and absence of LIS1. See Figure 6—figure supplement 1 for examples of velocity distributions. (D) Quantification of minus end-directed velocity of dynein-dynactin-BICD2N complexes on taxol/GMPCPP-stabilised microtubules in the presence and absence of LIS1. (E) Quantification of fluorescence intensity of Alexa647-dynein in minus end-directed complexes in the presence and absence of LIS1. The experiments were performed with stabilised microtubules. (F) Quantification of LIS1’s inhibitory effect on microtubule gliding by surface immobilised human dynein. Dynein alone or with a 20x or 200x molar excess of LIS1 dimers was mixed and incubated with glass surfaces, followed by washing and addition of fluorescent microtubules. In B–D, means ± S.D. are shown with values for each chamber represented as magenta circles (four chambers per condition in B and C, three chambers per condition in D); mean number of complexes analysed per chamber: 60 (B, C) and 106 (D). In E, means ± S.D. are shown with values for each movie represented as magenta circles (six movies from two chambers per condition, with a mean of 102 complexes analysed per chamber). In F, means ± S.D. are shown with values for each microtubule represented as magenta circles (30 microtubules from two chambers per condition). Statistical significance was evaluated with a one-way ANOVA with Sidak’s multiple comparisons test (B–D and F) or a Mann-Whitney test (E). (****p<0.0001; *** p<0.001; **p<0.01; *p<0.05; ns, not significant). Dynactin complexes, BICD2N dimers and LIS1 dimers were used, respectively, at a molar excess of 2x, 10x and 20x compared to dynein, except in some experiments in D and F, when LIS1 dimers were included at a molar excess of 200x relative to dynein. Dynein concentration in the assembly mixes was 20 nM (with a 1 in 10 dilution added to the imaging chambers) (A–E) or 30 nM (F). The acquisition rate was 7.3 frames/s in A and D, one frame/s in F, and 1.7 frame/s in other panels.
Figure 6—figure supplement 1
Examples of velocity distributions from the data in Figure 6B.
Errors are S.D.; N is number of constant velocity segments summed from four chambers per condition). Statistical significance was evaluated with a Mann-Whitney test.
Figure 6—figure supplement 2
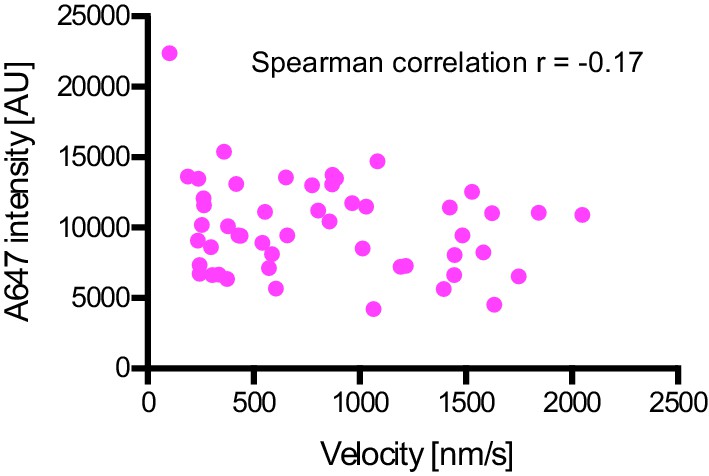
Plot of fluorescent intensity vs velocity for minus end-directed Alexa647-dynein complexes on stabilised microtubules in the presence of dynactin, BICD2N and LIS1.
Data were collected from a single movie to eliminate any chamber-to-chamber variability in fluorescent intensity. The Spearman correlation coefficient indicates no correlation between fluorescent intensity and velocity. N = 49 complexes. See Figure 6 legend for experimental details.
Figure 6—figure supplement 3

Additional data on the effect of LIS1 on microtubule gliding by surface immobilised dynein.
(A) Stills from Video 1 illustrating the ability of LIS1 to inhibit microtubule gliding by surface immobilised dynein. Data were acquired following the addition of Hilyte488-labelled microtubules to glass surfaces preincubated with 30 nM dynein alone (top panels) or a mixture of 30 nM dynein plus a 200x molar excess of LIS1 dimers (bottom panels). Magenta and green arrowheads point to ends of specific microtubules at the indicated time points. Note the lack of microtubule movement in the bottom panel. Scale bar, 2 μm. (B) Quantification of microtubule gliding velocity (left) or fluorescent intensity of Alexa647-dynein on the glass surface (right). In these experiments, LIS1 was not added together with dynein to the glass, but instead incubated with surfaces that had first been adsorbed with a 300 nM solution of dynein and washed (see Materials and methods for details). Magenta circles represent velocities for individual microtubules (left; a total of 60 microtubules from two independent chambers) or mean Alexa647 signal per pixel from randomly selected regions of the glass surface (right; from the same two imaging chambers with ~22 regions per condition). Error bars are S.D.
Figure 7 with 1 supplement

LIS1 frequently associates with dynein complexes undergoing minus end-directed transport.
(A) Kymograph from a dynamic microtubule showing localisation of TMR-LIS1 on minus end-directed Alexa647-dynein complexes (e.g. arrowhead) in the presence of dynactin and BICD2N. Y-axis, time; x-axis, distance. Scale bars, 10 s and 1 μm. (B) Quantification of the proportion of minus end-directed transport events of Alexa647-dynein or TMR-LIS1 on dynamic microtubules with detectable signals from both proteins. (C) Quantification of the velocity of minus end-directed movements along dynamic microtubules that have detectable Alexa647-dynein signal alone, or signals from both Alexa647-dynein and TMR-LIS1. Minus end-directed complexes labelled with only TMR-LIS1, in which the dynein must be unlabelled or photobleached, were too few in number for meaningful velocity analysis. In B and C, means ± S.D. are shown with values for each chamber represented as magenta circles (four chambers per condition, with a mean of 104 and 110 complexes analysed per chamber in B and C, respectively. In C, statistical significance was evaluated with a Mann-Whitney test (*p<0.05). Dynactin complexes, BICD2N dimers and LIS1 dimers were used, respectively, at a molar excess of 2x, 10x and 20x compared to dynein. Dynein concentration in the assembly mixes was 20 nM, with a 1 in 5 dilution added to the imaging chambers.
Figure 7—figure supplement 1
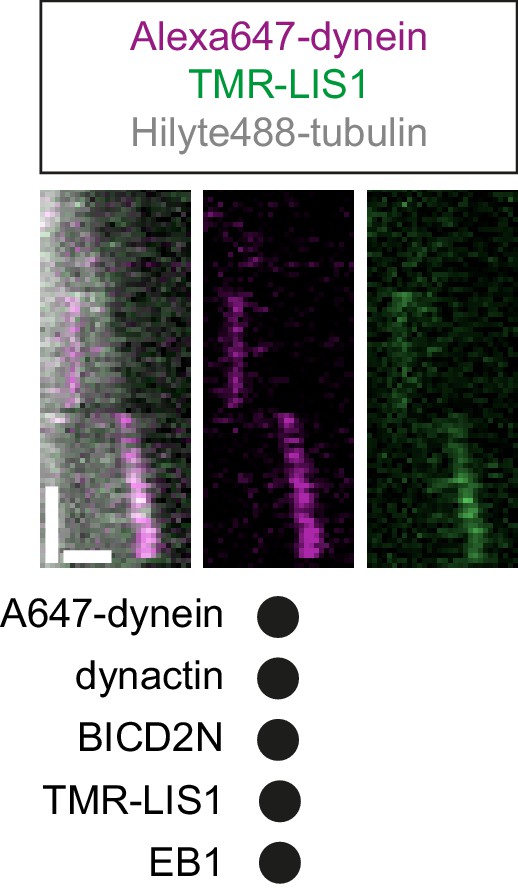
Kymograph exemplifying co-localisation of TMR-LIS1 with end tracking and static Alexa647-dynein in the presence of EB1, dynactin and BICD2N.
Y-axis, time; x-axis, distance. Scale bars, 10 s and 1 μm. See Figure 7 legend for experimental details.
Figure 8 with 1 supplement
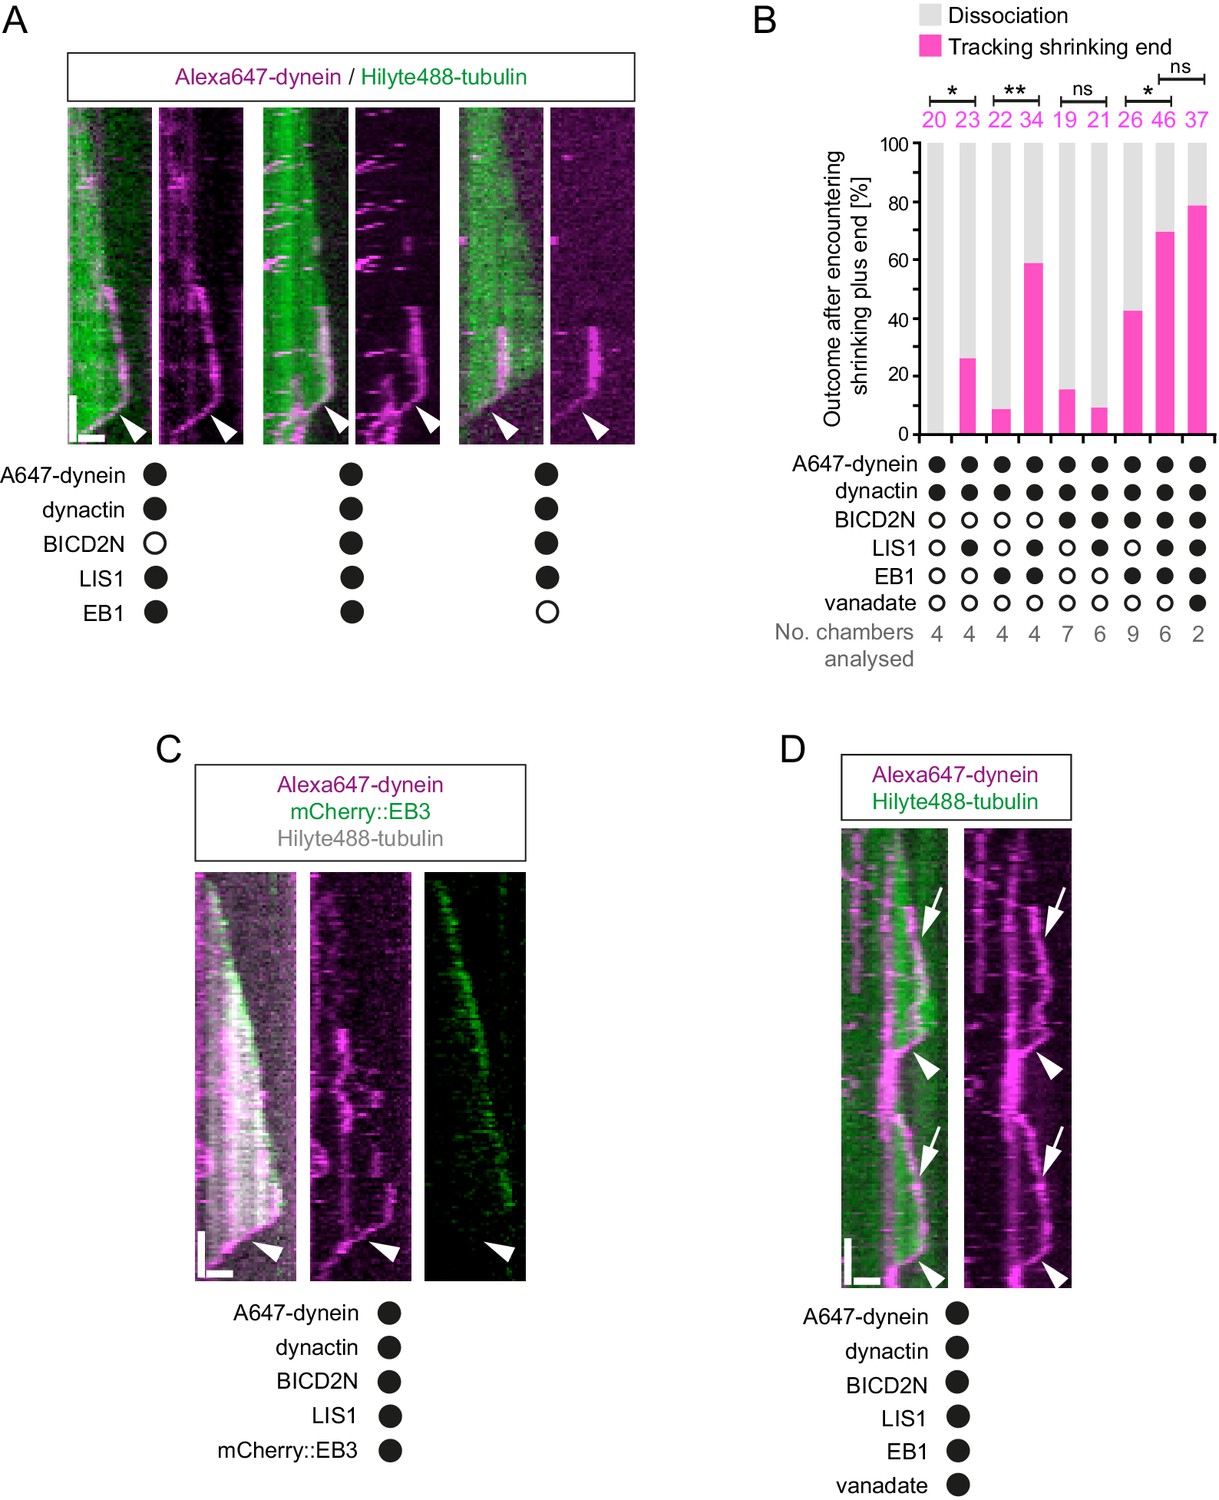
Characterisation of dynein association with plus ends during shrinkage phases.
(A) Kymographs showing examples of dynein retention on plus ends undergoing shrinkage (arrowheads). In A, C and D: y-axis, time; x-axis, distance; scale bars, 10 s and 1 μm. (B) Quantification of outcome of microtubule-associated dyneins encountering the plus end of a shrinking microtubule. Fifteen microtubules were scored per chamber; magenta numbers above bars indicate the number of scored encounters of dynein with a shrinking end. Statistical significance was evaluated with a Fisher’s exact test (**p<0.01; *p<0.05; ns, not significant). (C) Kymograph showing that mCherry::EB3 is not present on shrinking plus ends bound by dynein (arrowhead). (D) Kymograph showing that maintenance of dynein on the plus end of microtubules during shrinkage (arrowheads) and growth phases (arrows) is not abolished by ATP.vanadate. Dynactin complexes, BICD2N dimers and LIS1 dimers were used, respectively, at a molar excess of 2x, 10x and 20x compared to dynein. Dynein concentration in the assembly mixes was 20 nM, with a 1 in 10 dilution added to the imaging chambers.
Figure 8—figure supplement 1
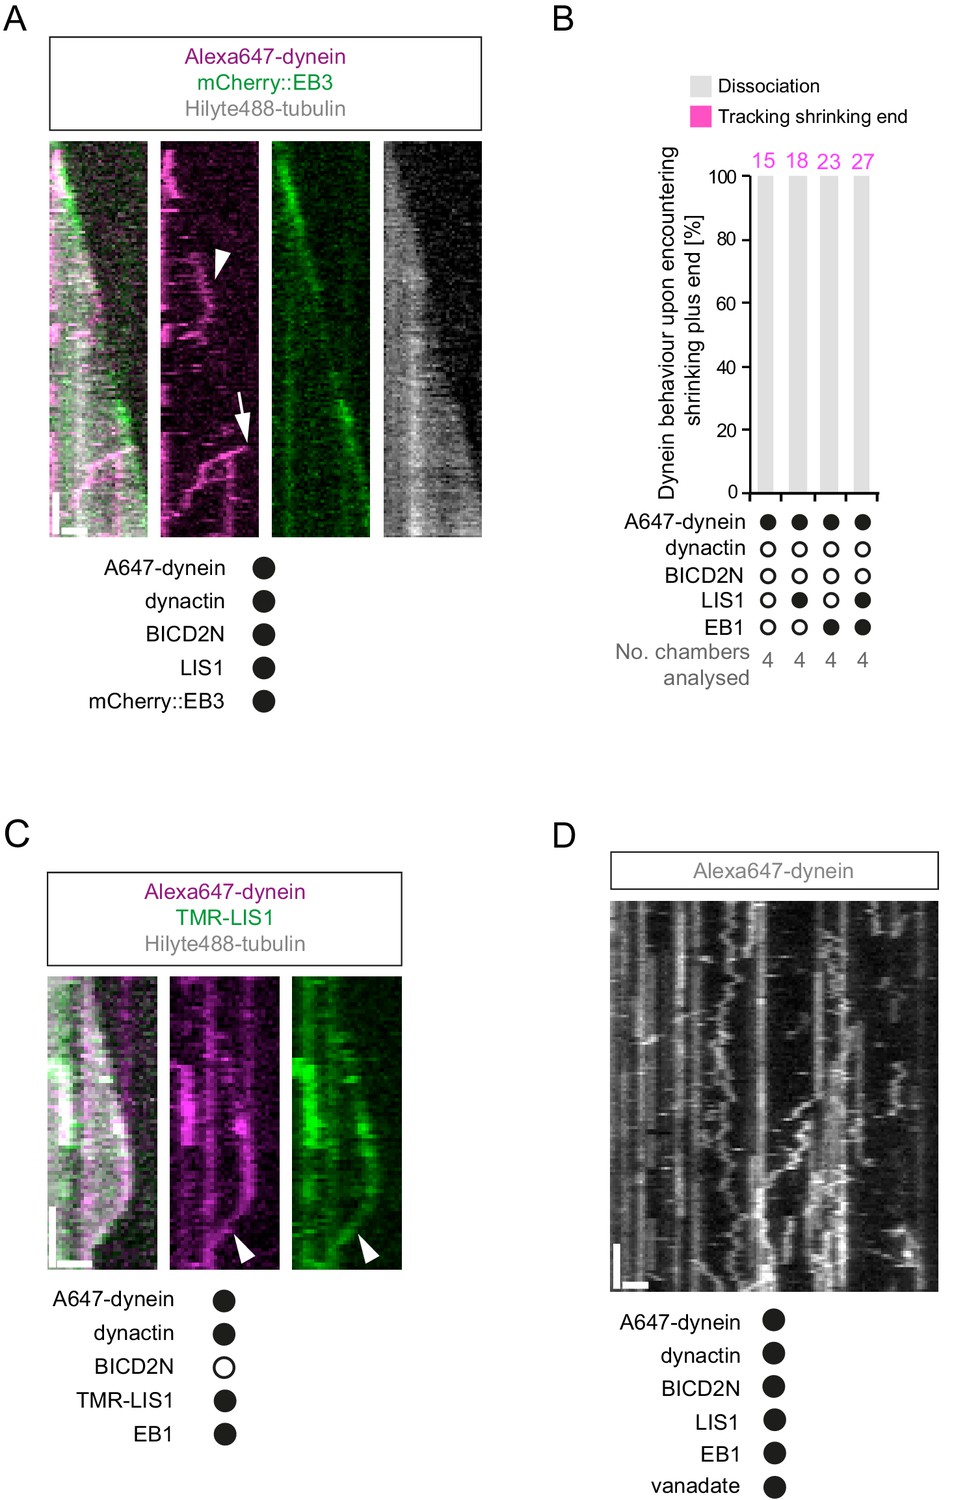
Additional data relevant to the association of dynein with plus ends undergoing shrinkage.
(A) Kymograph showing that long tracking events of dynein on growing plus ends are observed in the presence of dynactin, LIS1 and mCherry::EB3 (arrowhead). A dynein-dynactin-BICD2N complex that initiates minus end-directed movement from the plus end of the growing microtubule is also observed in this kymograph (arrow). (B) Quantification of the outcome of microtubule-associated dyneins encountering the plus end of a shrinking microtubule in the absence of dynactin. 15 microtubules were scored per chamber; magenta numbers above bars indicate the number of scored encounters of dynein with a shrinking end. See Figure 8B for quantification of dynein behaviour at shrinking ends in experiments containing dynactin. (C) Kymograph illustrating co-localisation of TMR-LIS1 and Alexa647-dynein when the motor complex retreats with the shrinking plus end (arrowhead). Co-localisation was observed in 20 of the 22 observed tracking events by dynein on the shrinking end. (D) Kymograph of a dynamic microtubule showing that ATP.vanadate disrupts minus end-directed motility of dynein in the presence of dynein and dynactin. In the presence of vanadate almost all dynein complexes exhibit static or diffusive behavior. In A, C and D, y-axis, time; x-axis, distance; scale bars, 10 s and 1 μm. See Figure 8 legend for experimental details.
Figure 9
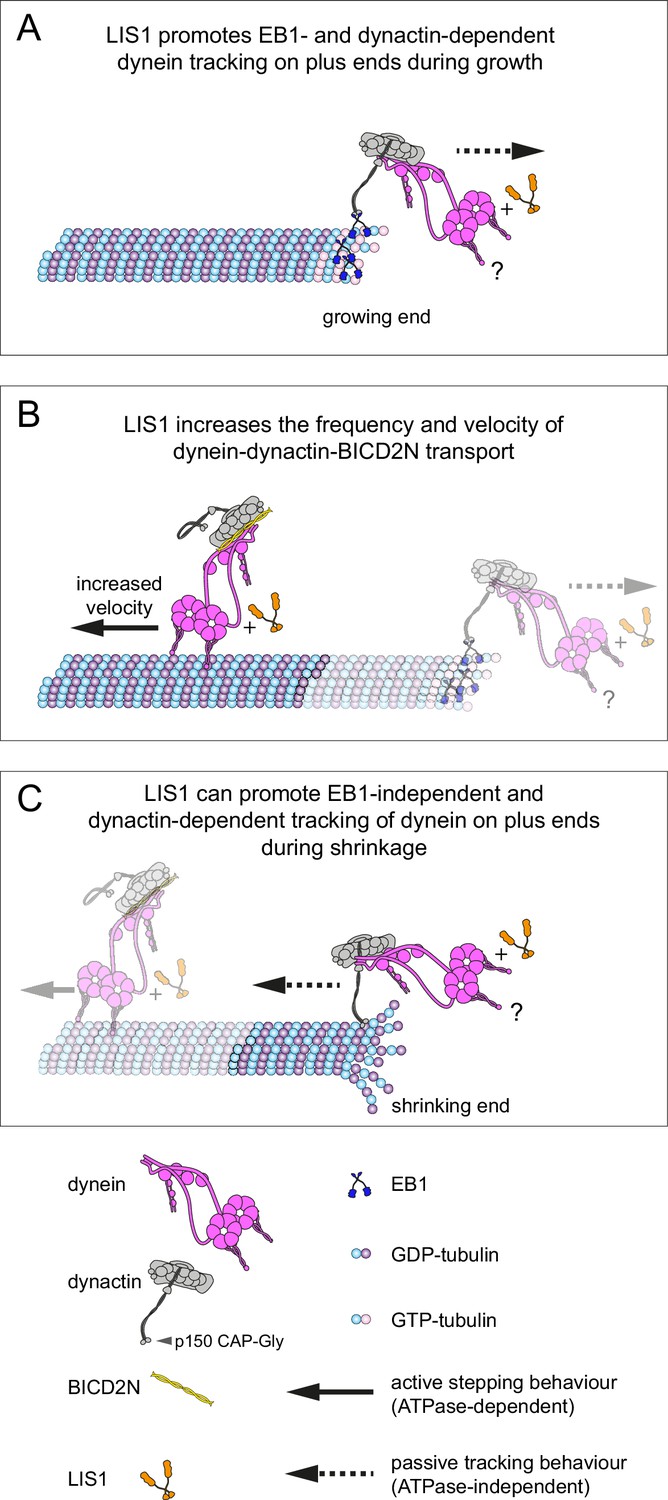
Model for the roles of LIS1 in regulating dynein behaviour on dynamic microtubules.
(A) LIS1 promotes EB1- and dynactin-dependent association of dynein with growing microtubule plus ends by increasing the frequency and duration of tracking events. Although BICD2N is not required for end tracking behaviour of dynein, it can associate with tracking complexes. (B) LIS1 increases the frequency of minus end-directed movements of dynein in the presence of dynactin and BICD2N. LIS1 also increases the velocity of minus end-directed dynein-dynactin-BICD2N complexes by associating with them. (C) The presence of LIS1 can increase the likelihood of dynein remaining associated with the microtubule upon encountering a shrinking plus end. (A, C) The tracking of dynein on both growing and shrinking microtubule plus ends appears to be mediated by indirect coupling of the dynein tail to these sites by dynactin. During growth phases, coupling of dynein to the plus end involves microtubule binding by EB1, which in turn uses its EEY/F and EB homology motifs to recruit the CAP-Gly of p150 (Honnappa et al., 2006). During shrinkage, the coupling is independent of EB1 and presumably involves the microtubule binding activity of dynactin, which also involves the CAP-Gly domain of p150. The microtubule-binding domains of dynein could conceivably stabilise the dynactin-dependent association of dynein with growing and shrinking plus ends (?). Note that LIS1 has not been placed in a specific position on the dynein-dynactin-BICD2N complex as previous studies have provided evidence for more than one binding site (see Discussion).
Author response image 1
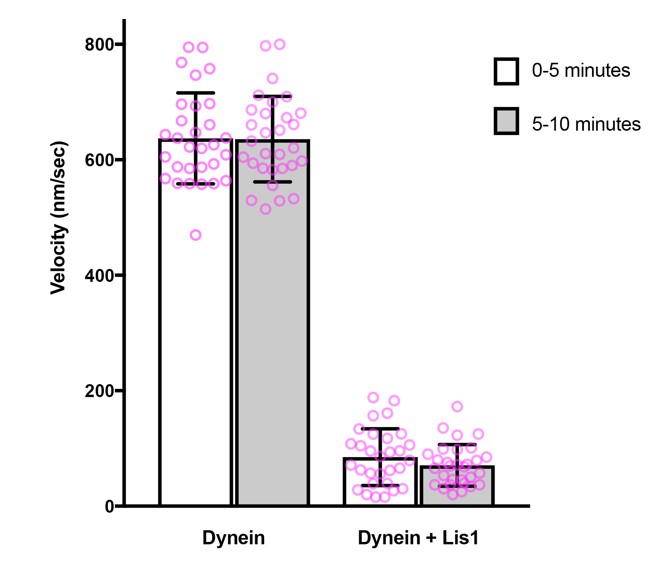
Comparison of microtubule gliding velocity during the first and second 5 minutes after the beginning of image acquisition.
Magenta circles: values for individual microtubules. Error bars: S.D.
Videos
Video 1
LIS1 inhibits microtubule gliding by surface-immobilised human dynein complexes.
Microtubules are labelled with HiLyte488-tubulin. Before addition of microtubules, glass surfaces were incubated with a solution of 30 nM dynein alone (left) or 30 nM dynein plus 6 μM LIS1 dimers and washed. Videos represents 5 min of real time; width of each frame is 54 μm.
Video 2
Microtubules do not stably associate with glass surfaces incubated with LIS1 alone.
Microtubules are labelled with HiLyte488-tubulin. Glass surfaces were pre-incubated with dynein storage buffer alone instead of dynein motors before the addition of 30 μM LIS1 and microtubules as described in the Materials and methods. Video represents 2 min of real time; width of each frame is 80 μm.
Download links
A two-part list of links to download the article, or parts of the article, in various formats.
Downloads (link to download the article as PDF)
Open citations (links to open the citations from this article in various online reference manager services)
Cite this article (links to download the citations from this article in formats compatible with various reference manager tools)
Lissencephaly-1 is a context-dependent regulator of the human dynein complex
eLife 6:e21768.
https://doi.org/10.7554/eLife.21768


