Impaired retrograde transport of axonal autophagosomes contributes to autophagic stress in Alzheimer’s disease neurons
- Rutgers, The State University of New Jersey, United States
Figures
Figure 1 with 1 supplement
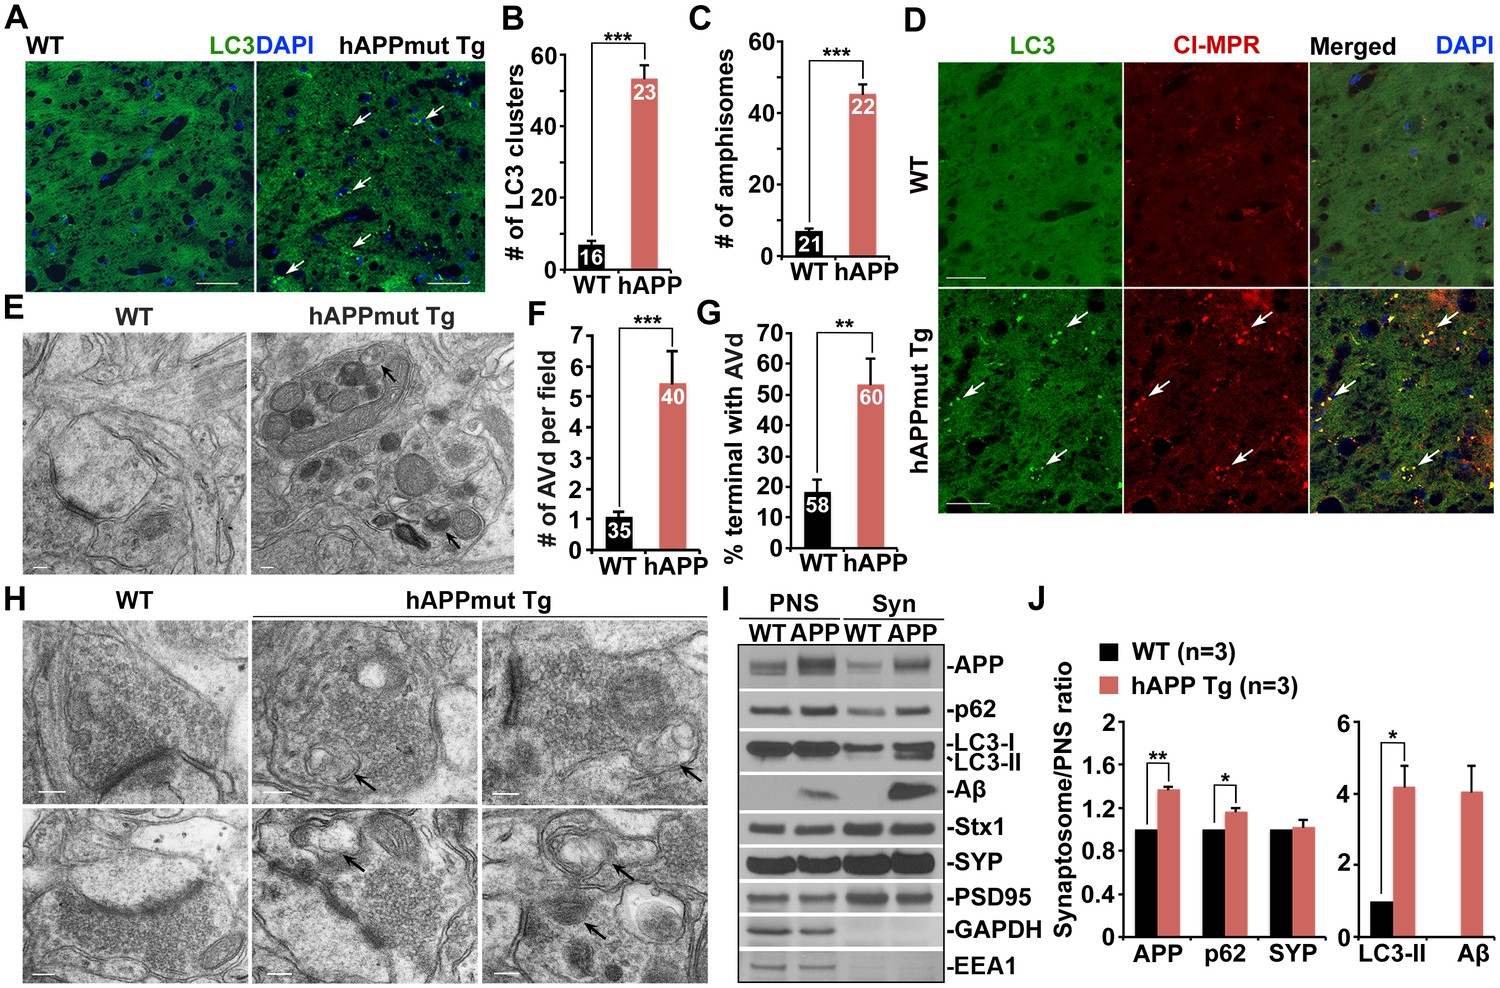
Autophagic accumulation in the distal axons of mutant hAPP Tg mice.
(A and B) Representative images (A) and quantitative analysis (B) showing accumulation of LC3-labeled autophagic vacuoles (AVs) in the hippocampal mossy fibers of eight-month mutant hAPP Tg mice. (C and D) Quantitative analysis (C) and representative images (D) showing amphisome retention in the hippocampal mossy fibers of hAPP mice. Note that LC3-labeled AV clusters were co-localized with cation-independent mannose 6-phosphate receptor (CI-MPR), a late endosome (LE) marker, suggesting that those AVs are amphisomes in nature following fusion with LEs. (E and F) Representative TEM images (E) and quantitative analysis (F) showing abnormal retention of AVd-like organelles within enlarged neurites in the hippocampal regions of mutant hAPP Tg mouse brains. Note that dystrophic/swollen neurites contained predominantly AVd-like structures marked by arrows, which was not readily observed in wild-type (WT) mice. The average number of AVd per EM field was quantified. (G and H) Quantitative analysis (G) and representative TEM images (H) showing aberrant accumulation of AVd-like structures (black arrows) at presynaptic terminals in hAPP mice. AVd-like structures, indicated by arrows, were not readily observed in WT mouse brains. Percentage of presynaptic terminals containing AVd was quantified. (I and J) Abnormal synaptic retention of LC3-II and p62 (autophagy markers), APP, and Aβ in mutant hAPP Tg mouse brains. Equal amounts (15 μg) of synapse-enriched synaptosomal preparations (Syn) and post-nuclear supernatants (PNS) from WT and hAPP mice were sequentially immunoblotted on the same membrane after stripping between each antibody application. The purity of synaptosomal fractions was confirmed by the absence of EEA1 and GAPDH. The synaptosome/PNS ratio in AD mice was compared to those in WT littermates. Data were quantified from three independent repeats. Stx1: syntaxin 1; SYP: synaptophysin Scale bars: 25 μm (A and D), 100 nm (E), and 200 nm (H). Data were quantified from a total number of imaging slice sections indicated on the top of bars (B and C) from three pairs of mice. The average numbers of AV clusters per section (320 μm × 320 μm) and per EM field (10 μm × 10 μm) were quantified (B and C). Error bars represent SEM. Student’s t test: ***p<0.001, **p<0.01, *p<0.05.
Figure 1—figure supplement 1
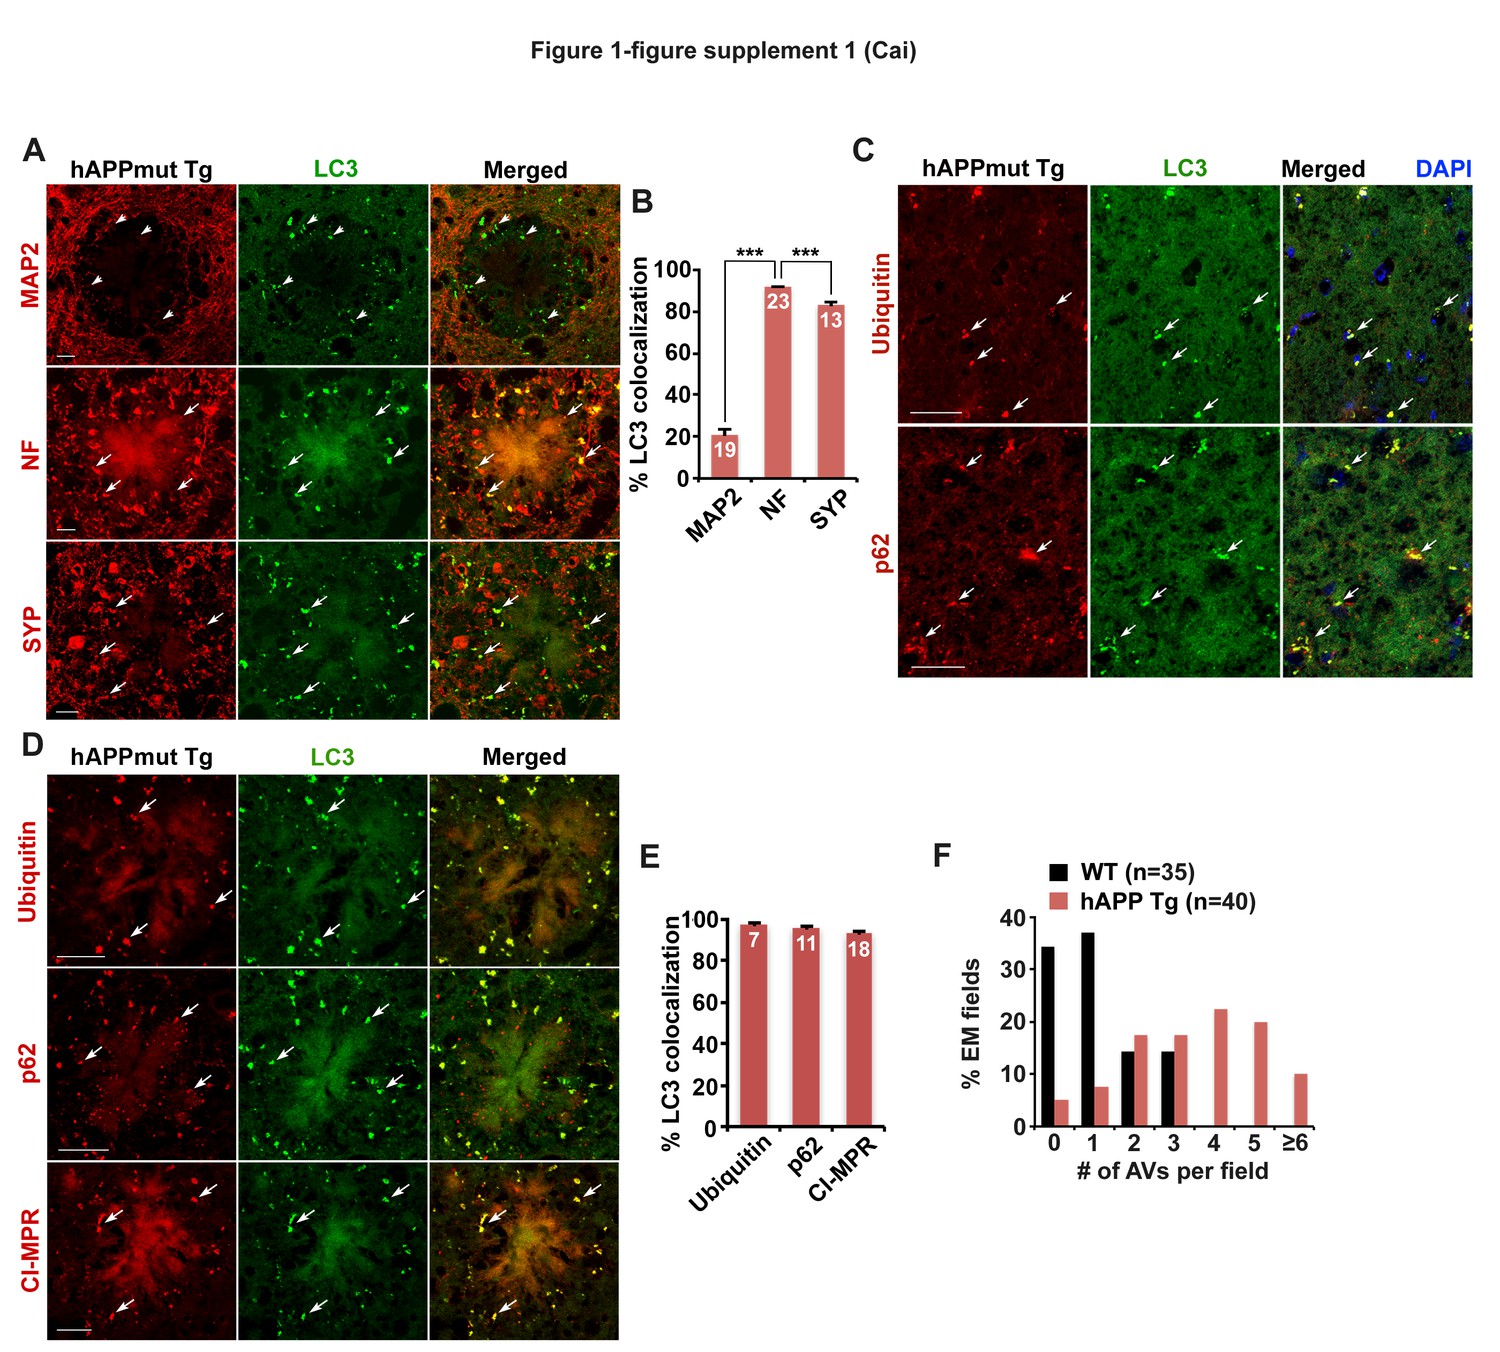
Axonal autophagic stress in mutant hAPP Tg mouse brains.
(A and B) Representative images (A) and quantitative analysis (B) showing that AVs predominantly accumulate in Neurofilament (NF)-labeled axons and synaptophagysin (SYP)-marked presynaptic terminals surrounding amyloid plaques in the hippocampal regions of mutant hAPP Tg mice. The percentage of LC3-labeled AV clusters co-localization with MAP2, NF, and SYP was quantified, respectively (B). (C–E) Representative images (C and D) and quantitative analysis (E) showing aberrant accumulation of LC3-marked amphisomes co-labeled by antibodies against Ubiquitin, p62, or CI-MPR in the hippocampal mossy fibers and within dystrophic axons around amyloid plaques of mutant hAPP Tg mice. The percentage of LC3-labeled amphisomes co-localization with Ubiquitin, p62, and CI-MPR was quantified, respectively (E). (F) The frequency of AVs per EM field in the hippocampal regions of WT and hAPP mice. Data were quantified from a total number of imaging slice sections (320 μm × 320 μm) indicated on the top of bars (B and E), or a total number of EM fields (10 μm × 10 μm) in parentheses (F). Scale bars: 10 μm (A) and 25 μm (C and D). Error bars: SEM. Student's t test: ***p<0.001.
Figure 2 with 1 supplement
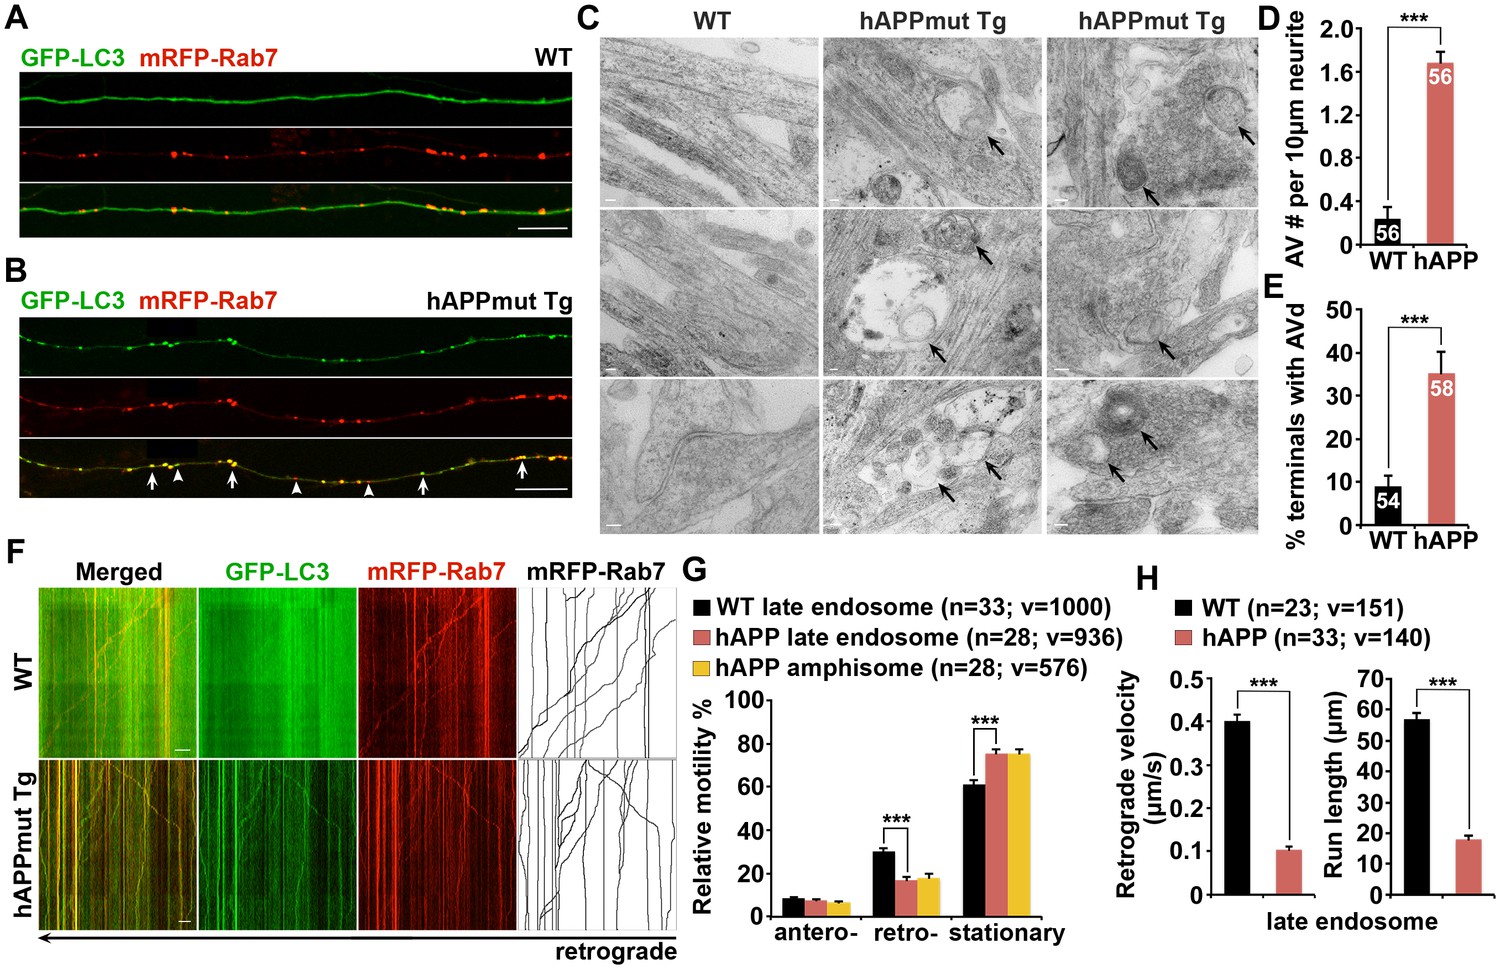
Impaired retrograde transport of axonal amphisomes in mutant hAPP Tg neurons.
(A and B) Axonal amphisomes predominantly accumulated in cultured cortical neurons derived from mutant hAPP Tg mice. Cortical neurons were co-transfected with GFP-LC3 and mRFP-Rab7, followed by imaging at DIV17-19. Images were taken from the distal axons of WT (A) and mutant hAPP Tg neurons (B). Late endosomes (LEs) are positive for Rab7 alone, whereas amphisomes are positive for both Rab7 and LC3. Arrow indicates amphisome co-labeled with LC3 and Rab7. Arrowhead points to AV or LE alone. (C–E) Representative TEM images (C) and quantitative analysis (D and E) showing aberrant accumulation of AVs in neuronal processes and presynaptic terminals of mutant hAPP Tg neurons. TEM showing retention of AVd-like organelles at the axonal terminals of hAPP neurons at DIV18-19. Arrows indicate AVd-like structures, which were not readily observed in WT neurons. Images were representative from 50–150 electron micrographs of neurons cultured from three pairs of WT and mutant hAPP mice. (F–H) Dual-channel kymographs showing impaired retrograde transport of amphisomes in hAPP neurons. Vertical lines represent stationary organelles. Slanted lines or curves to the right (negative slope) represent anterograde movement; to the left (positive slope) indicate retrograde movement. An organelle was considered stationary if it remained immotile (displacement ≤5 μm). GFP-LC3 was diffused and LEs predominantly moved toward the soma in WT neurons, whereas the majority of amphisomes (labeled by both LC3 and Rab7) remained stationary in the axons of hAPP neurons (F). Note that amphisomes and LEs share similarly reduced retrograde motility in the same axons of hAPP neurons. Relative motility of LC3-labeled AVs in hAPP neurons and LEs in WT neurons and hAPP neurons were examined (G). The average velocity and run length of LE retrograde transport in WT and hAPP neurons were quantified (H). Data were quantified from the total number of vesicles (v) in the total number of neurons (n) indicated in parentheses from more than four experiments. Scale bars: 100 nm (C), 5 μm (A and B), and 10 μm (F), and. Error bars represent SEM. Student’s t test: ***p<0.001, **p<0.01, *p<0.05.
Figure 2—figure supplement 1
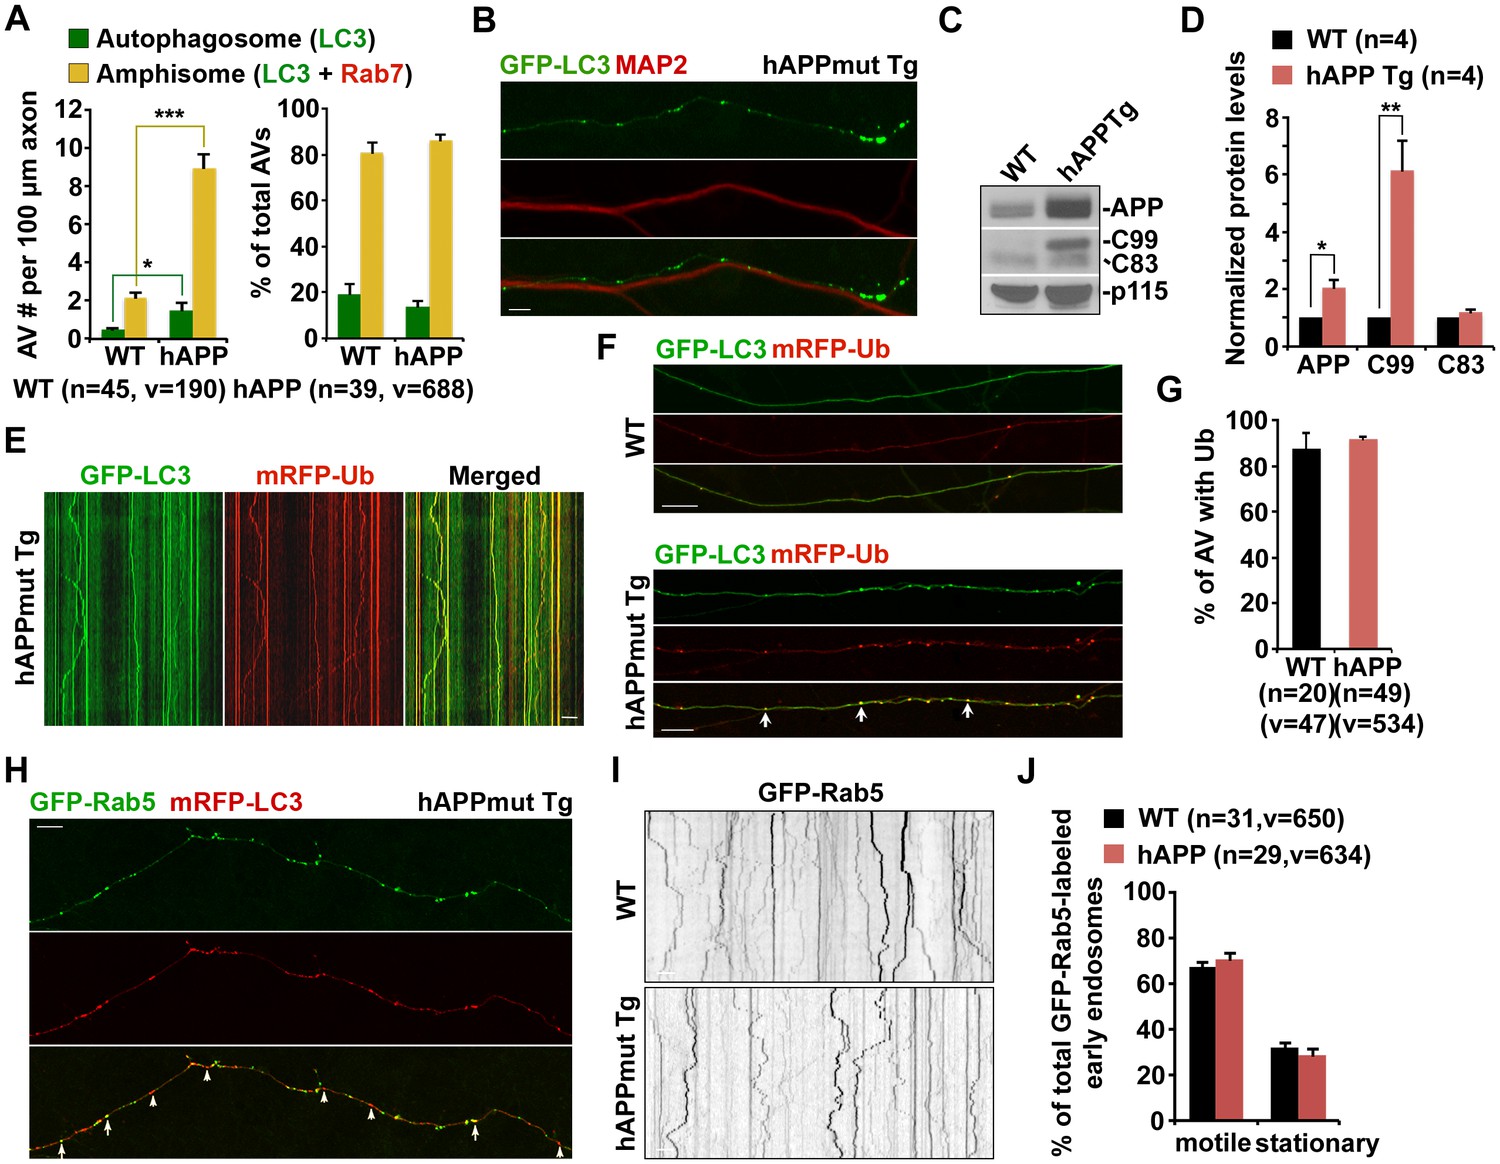
Axonal accumulation of amphisomes containing engulfed ubiquitinated cargoes in mutant hAPP Tg neurons.
(A) Increased density of axonal amphisomes following fusion with LEs was detected in hAPP neurons. hAPP neurons were comparable to WT neurons in the fusion of autophagosomes with LEs to form axonal amphisomes. (B) Aberrant accumulation of AVs in the MAP2-negative axon of mutant hAPP Tg neurons. (C and D) Representative blots (C) and quantitative analysis (D) showing increased levels of APP and C99 in mutant hAPP neurons. A total of 20 μg of cell lysates was sequentially detected on the same membrane. Relative protein levels were normalized by p115 and to that of neurons from WT littermates. (E–G) Accumulated AVs contained ubiquitinated cargos along the axons of hAPP neurons. Cortical neurons were co-transfected with GFP-LC3 and mRFP-Ubiquitin (Ub), followed by imaging at DIV17-19. Images were taken of the distal axons. Note that most of LC3-marked AVs were co-labeled with mRFP-Ub in WT and hAPP axons. Representative kymographs showing lack of movement of GFP-LC3 and mRFP-Ub along the axon of hAPP neurons (E). The percentage of AVs co-labeled by ubiquitin was quantified in WT and hAPP axons (G). (H) Rab5-marked early endosomes partially co-localized with AVs within the axon of mutant hAPP neurons. (I and J) Representative images and kymographs showing no significant change of early endosome trafficking in mutant hAPP axons. Note that early endosomes moved either a short distance or in an oscillatory pattern along axons of WT and hAPP neurons. Data were quantified from four independent repeats of four pairs of mice, and from the total number of vesicles (v) in the total number of axons (n) indicated in parentheses (A, D, G, and J). Scale bars: 10 μm. Error bars represent SEM. Student’s t test: ***p<0.001, **p<0.01, *p<0.05.
Figure 3 with 1 supplement
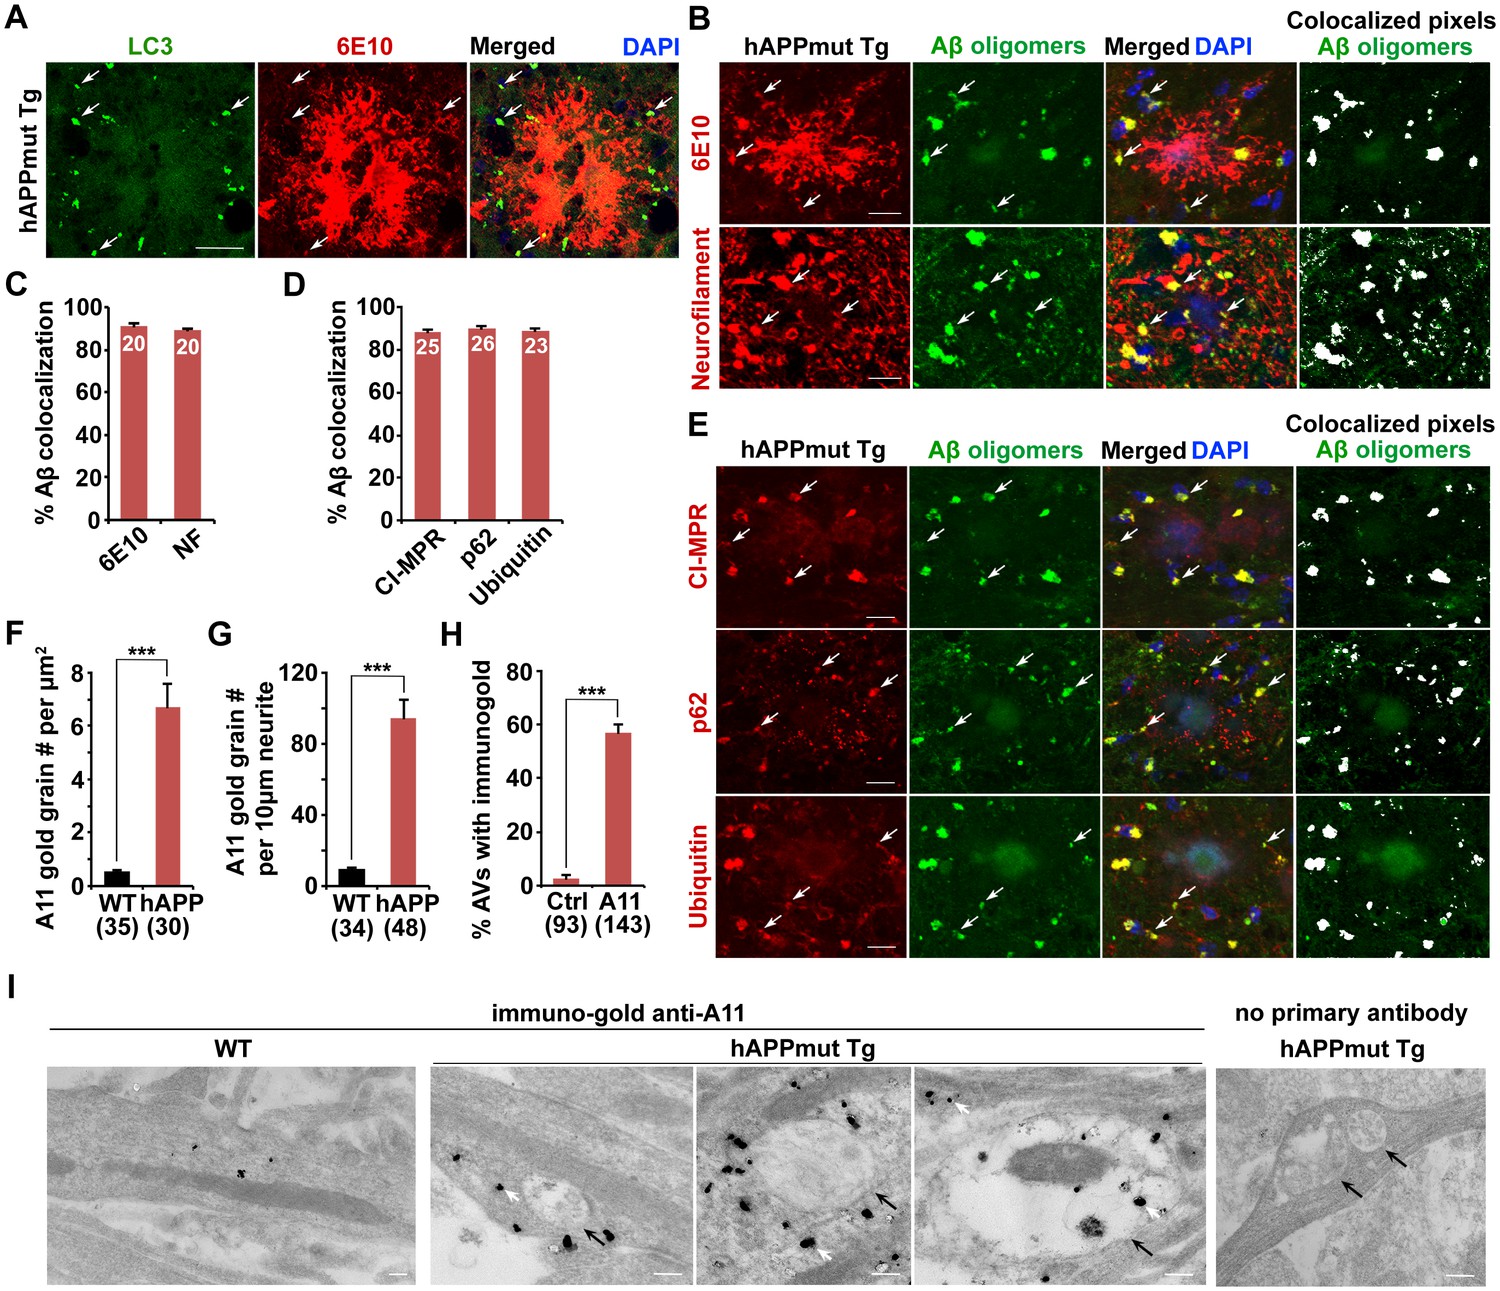
Association of soluble Aβ oligomers with amphisomes in the dystrophic axons of AD mice.
(A) AVs clustering within swollen/dystrophic neurites around an amyloid plaque enriched with 6E10 antibody-labeled APP, C99, or Aβ deposits. (B and C) Representative images (B) and quantitative analysis (C) showing that soluble Aβ oligomers labeled by anti-A11 antibody was concentrated within Neurofilament (NF)-labeled axons surrounding amyloid plaques in mutant hAPP Tg mice. The percentage of soluble Aβ co-localization with 6E10 antibody-labeled Aβ or NF was quantified, respectively. (D and E) Quantitative analysis (D) and representative images (E) showing the association of soluble Aβ oligomers with amphisomes within dystrophic axons around amyloid plaques in the hippocampal regions of mutant hAPP mice. The percentage of oligomeric Aβ co-localization with CI-MPR, p62, and Ubiquitin (Ub) was quantified, respectively. (F–I) Immuno-EM analysis (I) and quantification (F, G, and H) showing that soluble Aβ oligomers in the cytoplasm, marked by anti-A11 immuno-gold particles (white arrows), associated with or surround AVd-like structures (black arrows) within the neurites of cultured mutant hAPP Tg neurons. Note that anti-A11 immuno-gold particles were also present within the AVd-like structures containing organelles and small vesicles along hAPP neurites. Anti-A11 immuno-gold particles were detected in the cytoplasm of neurites in WT neurons. The average numbers of the A11 gold grains per EM field (10 μm × 10 μm) and per 10 μm neurite were quantified in WT and hAPP neurons, respectively. The percentage of AVd-like compartments surrounded by the gold particles was quantified in hAPP neurons or in the absence of the primary antibody. The co-localized pixels of individual markers with Aβ oligomers were indicated in white (B and E). Data were quantified from a total number of imaging slice sections (320 μm × 320 μm) indicated on the top of bars (C and D) and from a total number of EM fields (F), neurites (G), or AVs (H) indicated in parentheses from more than three experiments. Scale bars: 25 μm (A), 10 μm (B and E), and 200 nm (I). Error bars represent SEM. Student’s t test: ***p<0.001, **p<0.01, *p<0.05.
Figure 3—figure supplement 1
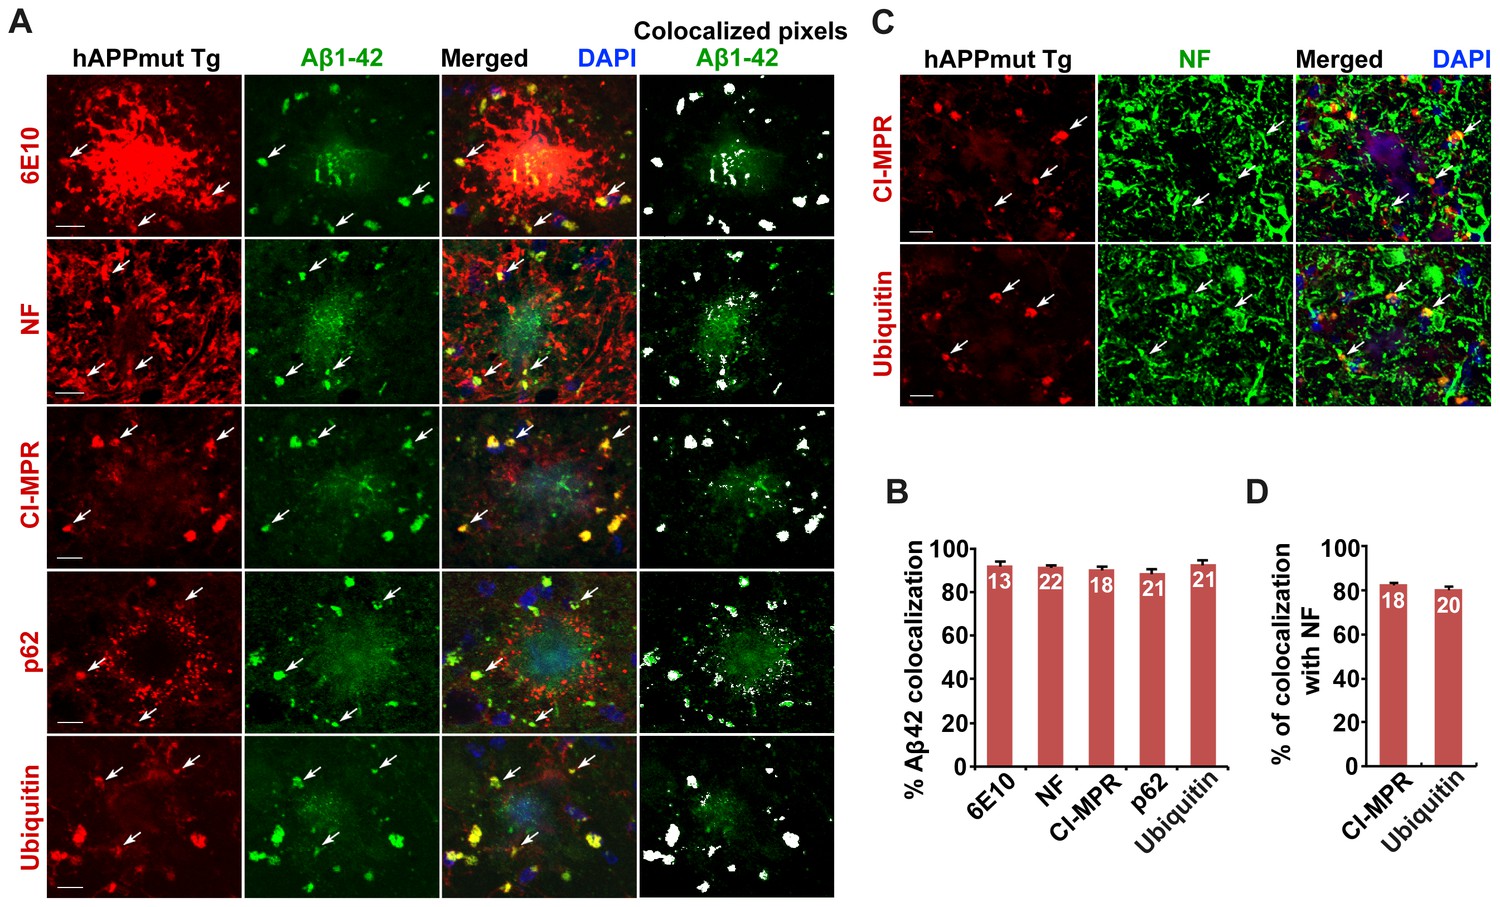
Association of soluble Aβ1-42 oligomers with amphisomes in the distal axons of mutant hAPP Tg mice.
(A and B) Representative images (A) and quantitative analysis (B) showing co-localization of amphisomes with soluble Aβ1-42 oligomers in NF-marked distal axons surrounding amyloid plaques in AD mouse brains. The percentage of Aβ1-42 co-localization with 6E10, neurofilament (NF), CI-MPR, p62, and Ubiquitin was quantified, respectively. The co-localized pixels of individual markers with Aβ1-42 were indicated in white (A). (C and D) Representative images (C) and quantitative analysis (D) showing accumulation of amphisomes in the NF-marked distal axons of mutant hAPP Tg neurons. The percentage of CI-MPR and Ub co-localization with NF was quantified, respectively. Scale bars: 10 μm. Error bars represent SEM.
Figure 4

Oligomeric Aβ42-mediated interruption of dynein-Snapin coupling and recruitment of dynein motors to amphisomes.
(A and B) Immunoisolation assays (A) and quantitative analysis (B) from three repeats showing reduced dynein attachment to amphisomes in sixteen-month mutant hAPP Tg mouse brains. Rab7-associated organelles were immunoisolated from light membrane fractions, followed by sequential immunoblotting on the same membranes with antibodies against the dynein intermediate chain (DIC), LC3, hAPP, Snapin, Rab7, and EEA1. Note that AD mouse brains exhibited reduced DIC and increased LC3-II levels in the purified amphisomal organelles. Data were quantified from three independent repeats of three pairs of mice. (C) Immunoprecipitation showing reduced Snapin-DIC coupling in COS7 cells expressing mutant hAPPswe, but not WT hAPP. (D) Direct interaction of Aβ1-42 with GST-DIC, but not GST-Snapin or GST. 6E10 antibody was used to detect Aβ. (E and F) GST-DIC specifically interacts with Aβ1-42, but not Aβ1-40 or scrambled Aβ. (G) Aβ1-42 interaction with DIC was increased as Aβ concentration was elevated from 0.5 μM to 4 μM in the presence of the same amount of GST-DIC. (H) Aβ1-42 interferes with DIC-Snapin coupling in a dose-dependent manner. Note that the DIC-Snapin interaction was competitively interrupted in the presence of as low as 0.2 μM Aβ1-42 when the same amount of Snapin and DIC was used. (I) The dot blot using anti-β amyloid antibody showed that GST-DIC bound to oligomeric Aβ. (J) Oligomeric Aβ1-42 interrupts dynein-Snapin coupling and the recruitment of dynein motors to LEs and amphisomes in mouse brains. Membranous organelles were pulled down from light membrane fractions (LMF) of mouse brains by GST-DIC in the presence or absence of 2 μM oligomeric Aβ1-42. Bead-bound membrane organelles were resolved by PAGE and sequentially detected with antibodies on the same membranes after stripping between applications of each antibody. Note that reduced tethering of dynein motors to LAMP-1 or Rab7-associated LEs and amphisomes in the presence of Aβ was specifically caused by impaired DIC-Snapin interaction because the dynein-dynactin (p150Glued) complex was not affected. The attachment of dynein motors to mitochondria showed no detectable change. TOM20: a mitochondrial outer membrane protein. The purity of the preparation pulled down by GST-DIC beads was confirmed by the absence of GAPDH. Results were representative from three independent repeats. (K) The DIC-Aβ complex was immunoprecipitated by anti-DIC antibody from mutant hAPP Tg mouse brains. Error bars represent SEM. Student’s t test: ***p<0.001, **p<0.01, *p<0.05.
Figure 5

Impaired dynein-Snapin coupling contributes to axonal autophagic stress in AD patient brains.
(A and B) Synaptic autophagic stress in AD patient brains. Equal amounts (15 μg) of synapse-enriched synaptosomal preparations (Syn) and post-nuclear supernatant (PNS) from human brains of control subjects and AD patients were sequentially immunoblotted on the same membrane after stripping between each antibody application. The purity of synaptosome fractions was confirmed by their relative enrichment of synaptic markers synaptophysin (SYP) and PSD95 compared to levels in PNS fractions, and by the absence of EEA1. The synaptosome/PNS ratio in AD brains were compared to those in control subjects. Data were quantified from four independent repeats. (C and D) Representative TEM images (C) and quantitative analysis (D) showing abnormal retention of AVd-like organelles (arrows) within enlarged neurites in patient brains. Note that dystrophic/swollen neurites contain predominantly late stage AVs (AVd). (E and F) Immunoprecipitation (E) and quantitative analysis (F) showing reduced Snapin-DIC coupling in AD patient brains. Data were quantified from three independent experiments. The average number of AV-like structures per EM field (10 μm × 10 μm) was quantified (D). Scale bars: 500 nm. Error bars: SEM. Student's t test: ***p<0.001, **p<0.01, *p<0.05.
Figure 6 with 1 supplement
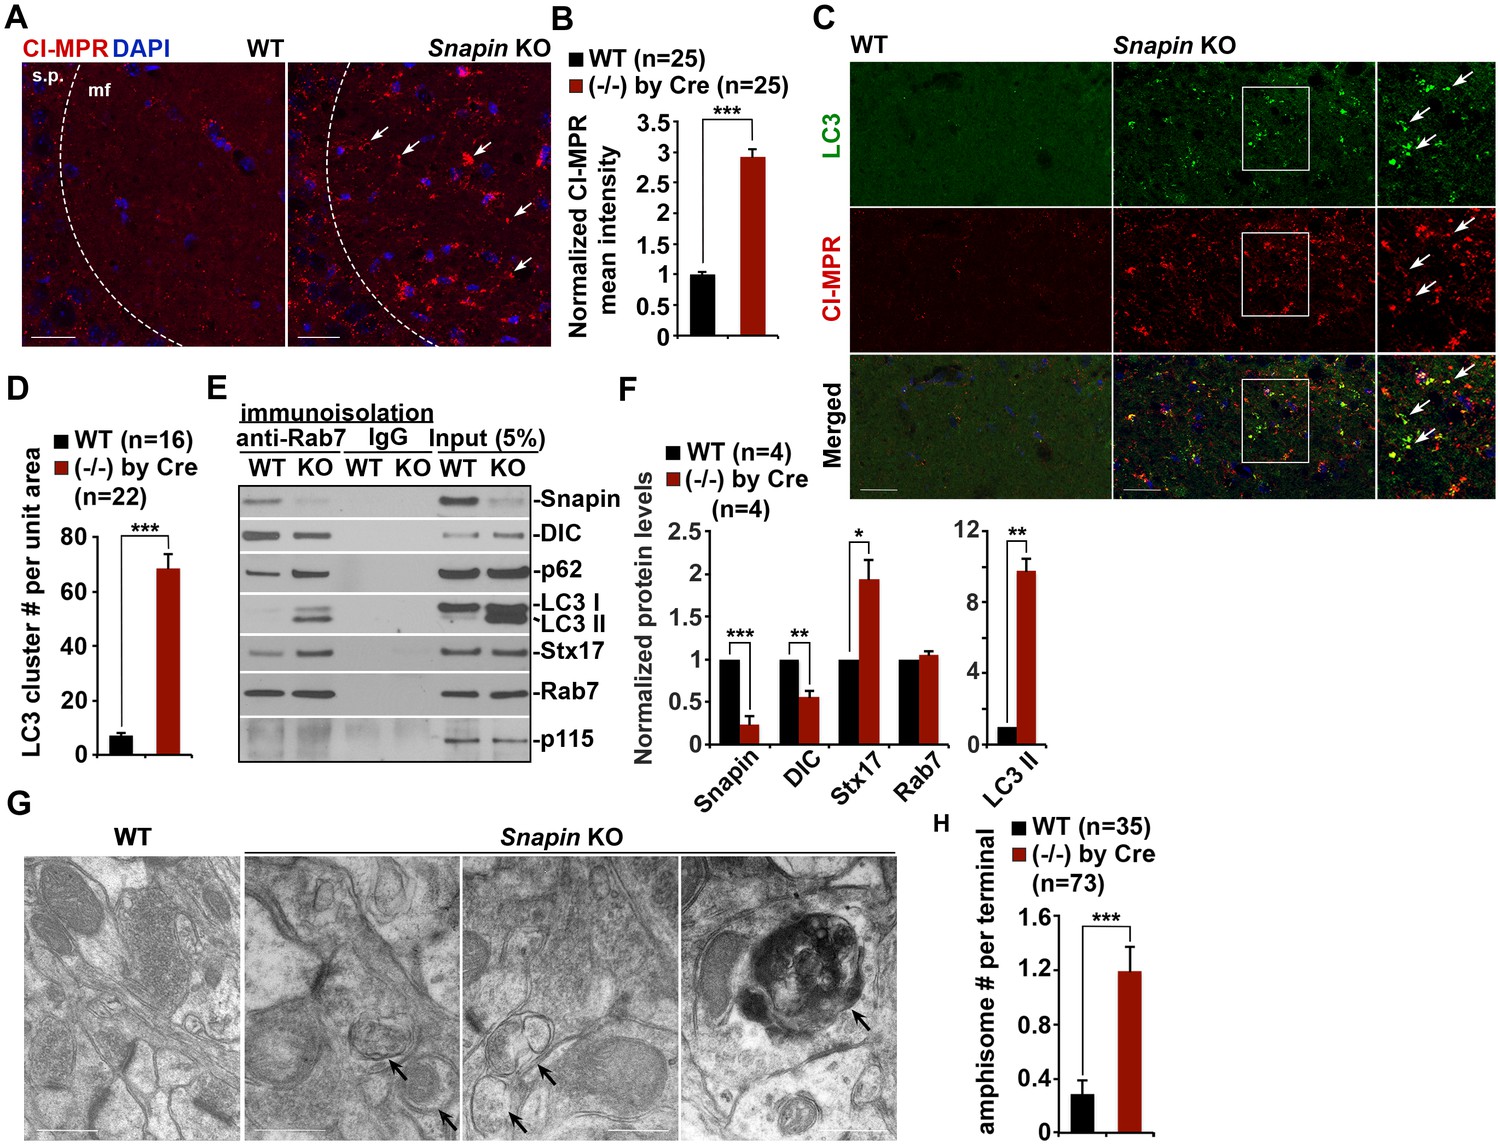
Snapin-deficient mouse brains recapitulate AD-associated autophagic stress in axons.
(A and B) LEs clustering (arrows) in the hippocampal mossy fibers of Snapin flox/flox conditional knockout (cKO) mice. The mean intensity of LE clusters in the mossy fibers (mf) of one-month Snapin mutant mice labeled with CI-MPR per section (320 μm × 320 μm) was quantified and compared with that of WT mice. s.p., stratum pyramidale (C and D) Aberrant accumulation of amphisomes in the mossy fibers of Snapin-deficient mice. Note that LC3-marked AVs were labeled with CI-MPR, suggesting that they were amphisomes in nature following fusion with LEs. The number of LC3 clusters per section (320 μm × 320 μm) was quantified. (E and F) Immunoisolation showing reduced dynein attachment to amphisomes. Rab7-associated organelles were immunoisolated with anti-Rab7-coated Dyna magnetic beads, followed by sequential immunoblotting on the same membranes after stripping between each antibody application. Note that purified Rab7 organelles were enriched with various AV markers including LC3-II, p62, and syntaxin 17 (Stx17) in Snapin cKO mouse brains. Data were quantified from four repeats. (G and H) Representative TEM images (G) and quantitative analysis (H) showing retention of AVd-like organelles at presynaptic terminals in Snapin mutant mice. Arrows indicate AVd-like structures, which were not readily detected in WT mice. Scale bars: 25 μm (A and C) and 500 nm (G). Data were quantified from a total number of imaging slice sections (B and D) or from a total number of electron micrographs (H) indicated in parentheses from three pairs of mice. Error bars represent SEM. Student’s t test: ***p<0.001, **p<0.01, *p<0.05.
Figure 6—figure supplement 1
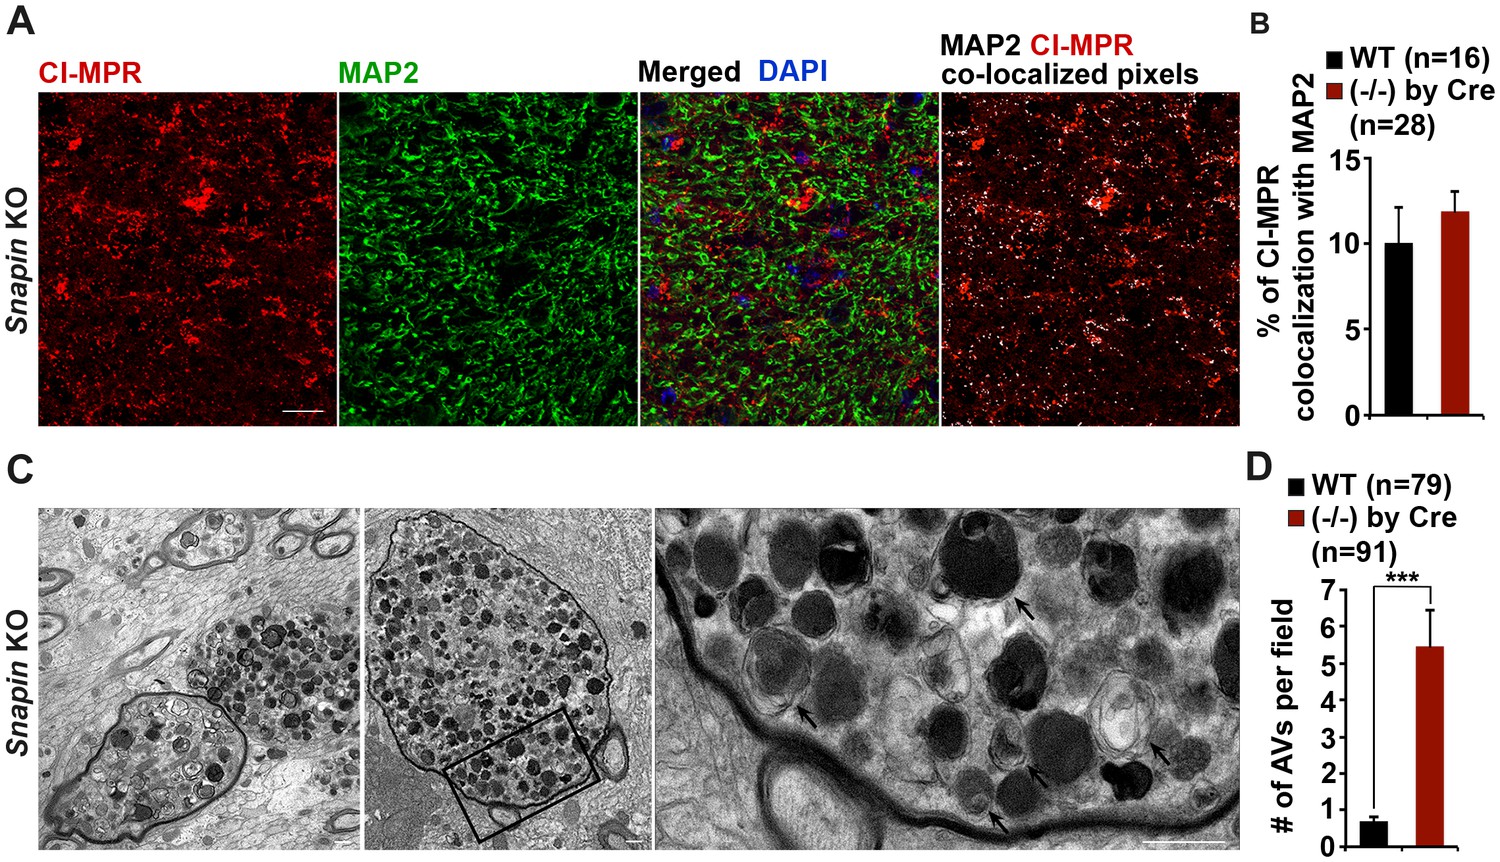
Axonal autophagic stress in the hippocampal regions of Snapin-deficient mice.
(A and B) Representative images (A) and quantitative analysis (B) showing that majority of CI-MPR-labeled LEs were not co-localized with MAP2-marked dendrites in Snapin mutant mouse brains. The percentage of co-localized pixels of CI-MPR with MAP2 (in white) was quantified. Data were quantified from a total number of imaging slice sections (320 μm × 320 μm) indicated in parentheses. (C and D) Representative TEM images (C) and quantitative analysis (D) showing massive accumulation of AVd-like organelles (arrows) within large swellings along axonal processes surrounded by myelin in Snapin mutant mouse brains. The average number of AVd per EM field was quantified. Data were quantified from a total number of EM fields (10 μm × 10 μm) indicated in parentheses. Scale bars: 25 μm (A) and 500 nm (C). Error bars represent SEM. Student’s t test: ***p<0.001.
Figure 7 with 1 supplement
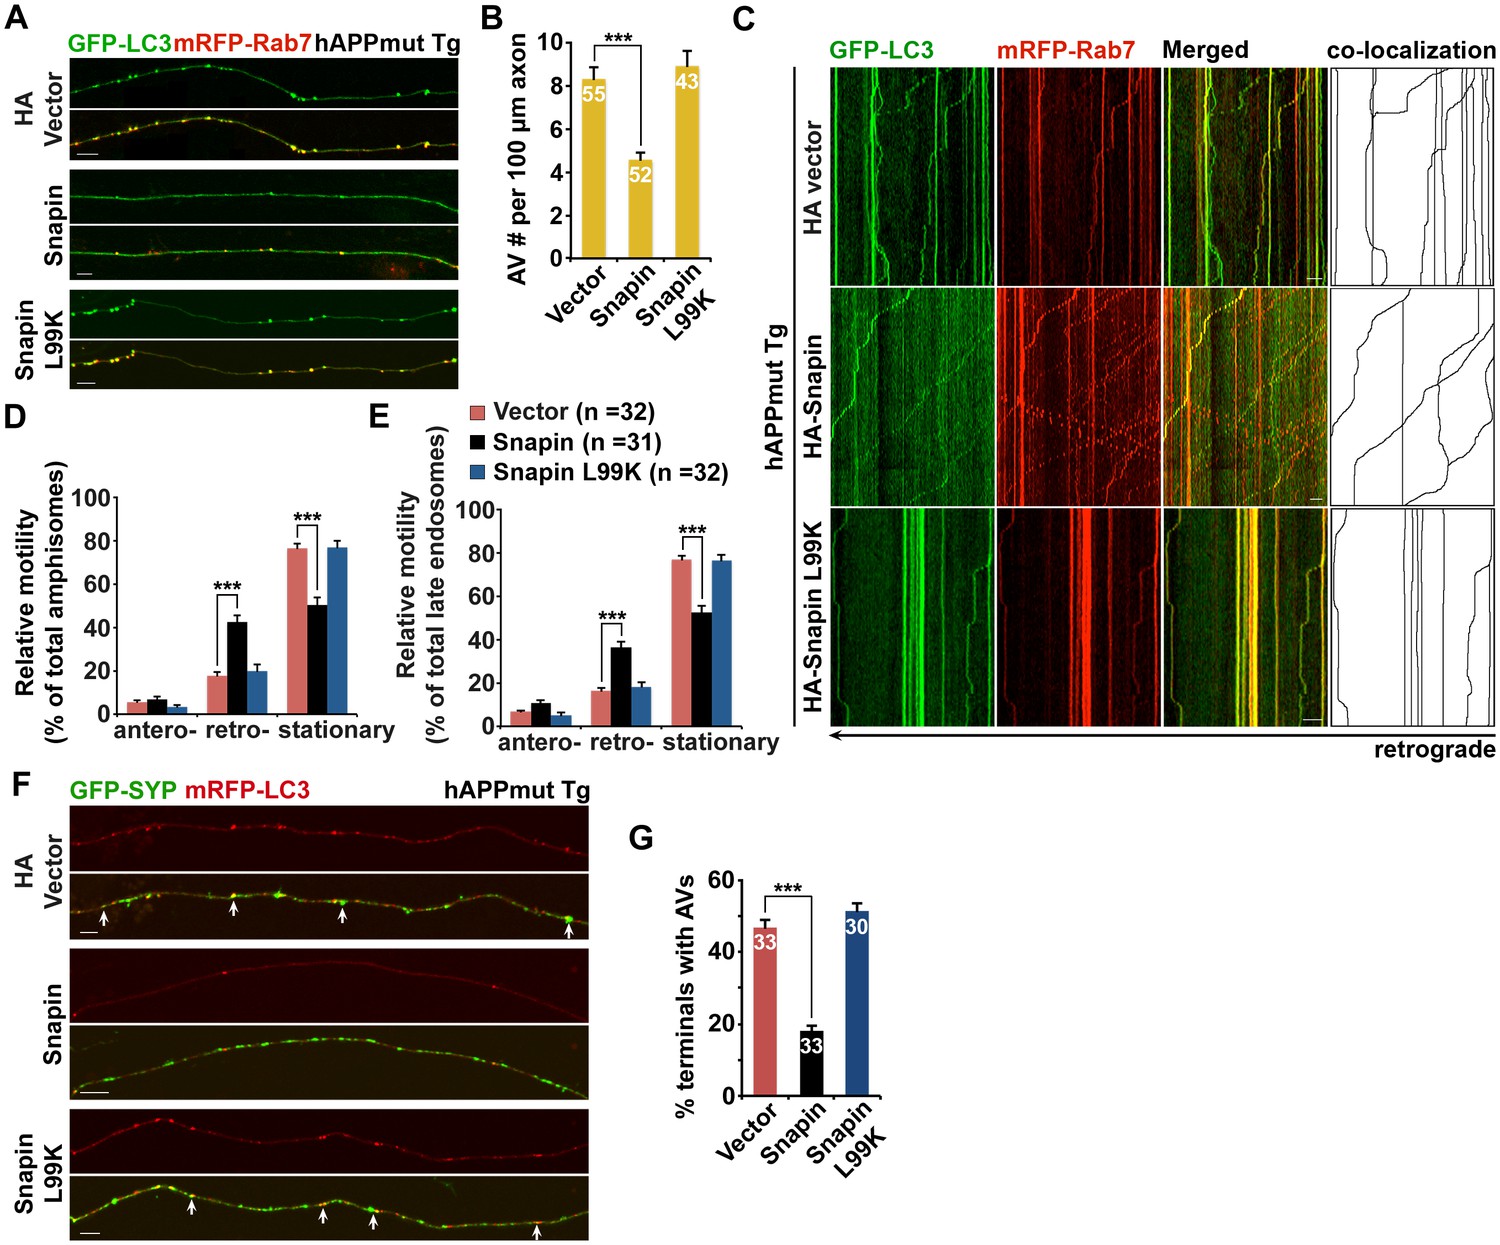
Elevated Snapin expression reduces axonal autophagic stress of mutant hAPP Tg neurons.
(A and B) Images (A) and quantitative analysis (B) showing that expressing Snapin, but not the Snapin-L99K mutant, reduces the density of axonal amphisomes in mutant hAPP Tg neurons. (C–E) Kymographs (C) and quantitative analysis (D and E) showing that impaired amphisome retrograde transport was rescued by expressing Snapin, but not Snapin-L99K. hAPP neurons were co-transfected with GFP-LC3 and mRFP-Rab7 along with HA-Snapin, HA-Snapin-L99K, or HA vector, followed by time-lapse imaging at DIV17-19. (F and G) Representative images (F) and quantitative analysis (G) showing reduced autophagic accumulation at presynaptic terminals after overexpression of Snapin, but not Snapin-L99K in hAPP neurons. Scale bars: 5 μm (A) and 10 μm (C and F). Data were quantified from a total number of neurons (n) indicated on the top of bars (B and G) or in parentheses (D and E) from more than four independent experiments. Error bars: SEM. Student's t test: ***p<0.001, **p<0.01, *p<0.05.
Figure 7—figure supplement 1
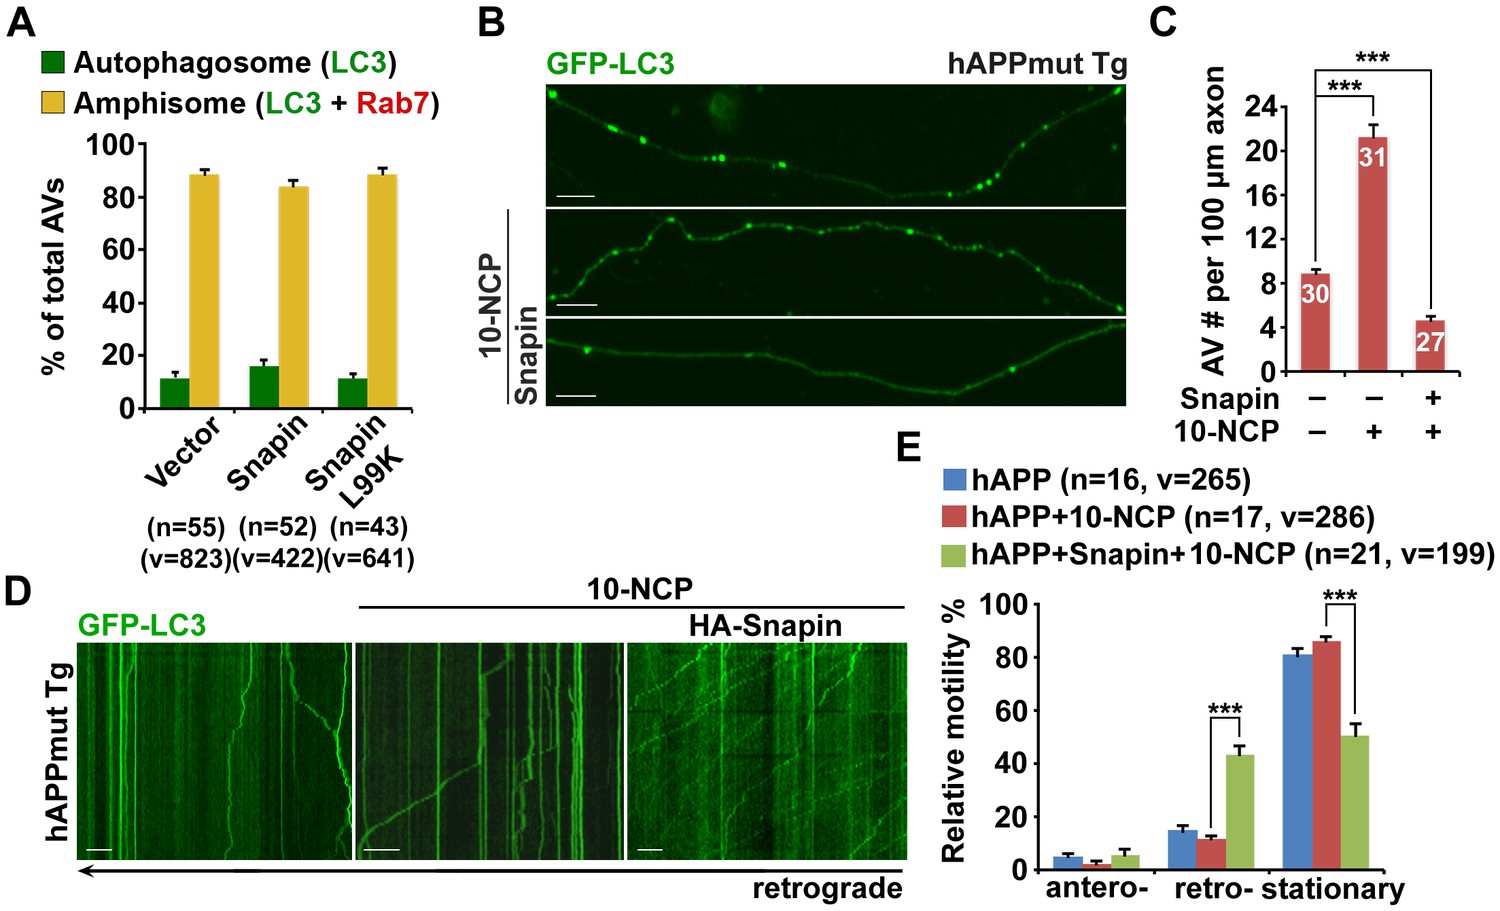
Snapin-mediated rescue effects on axonal autophagic stress under conditions of autophagy induction in AD neurons.
(A) Expression of Snapin or Snapin-L99K had no significant effect on the fusion of autophagosomes with LEs to form amphisomes. Data were quantified from a total number of vesicles (v) and a total number of neurons (n) indicated in parentheses (A) from more than four independent experiments. (B and C) Representative images (B) and quantitative analysis (C) showing that elevated Snapin expression reduced AV retention within hAPP axons in response to autophagy induction. Mutant hAPP Tg neurons were transfected with GFP-LC3 and HA-Snapin or HA vector, followed by treatment with 5 μM 10-NCP 24 hr before imaging at DIV18-20. (D and E) Quantitative analysis (E) and representative kymographs (D) showing that retrograde transport of AVs was enhanced in mutant hAPP axons expressing Snapin, but not vector control following 10-NCP treatment. Scale bars: 10 μm. Error bars represent SEM. Student’s t test: ***p<0.001, **p<0.01, *p<0.05.
Tables
Table 1
Demographic details of postmortem brain specimens from patients with AD and subjects without AD (specimens from the Harvard Tissue Resource Center and the Human Brain and Spinal Fluid Resource Center at UCLA).
| Case type | Age/sex | Postmortem interval (h) | Braak stage of AD brains |
|---|---|---|---|
Control | 75/F | 20.1 | 0 |
Control | 87/M | 9.3 | 0 |
Control | 47/M | 12.5 | 0 |
Control | 66/M | 22.5 | 0 |
AD | 65/M | 11.6 | Braak I |
AD | 72/M | 21.8 | Braak II |
AD | 86/M | 9.00 | Braak III |
AD | 86/M | 17.4 | Braak III |
AD | 60/F | 15.2 | Braak V |
AD | 86/F | 7.08 | Braak VI |
Download links
A two-part list of links to download the article, or parts of the article, in various formats.
Downloads (link to download the article as PDF)
Open citations (links to open the citations from this article in various online reference manager services)
Cite this article (links to download the citations from this article in formats compatible with various reference manager tools)
Impaired retrograde transport of axonal autophagosomes contributes to autophagic stress in Alzheimer’s disease neurons
eLife 6:e21776.
https://doi.org/10.7554/eLife.21776


