An efficient targeted nuclease strategy for high-resolution mapping of DNA binding sites
- Howard Hughes Medical Institute, Basic Sciences Division, Fred Hutchinson Cancer Research Center, United States
Figures
Figure 1 with 4 supplements
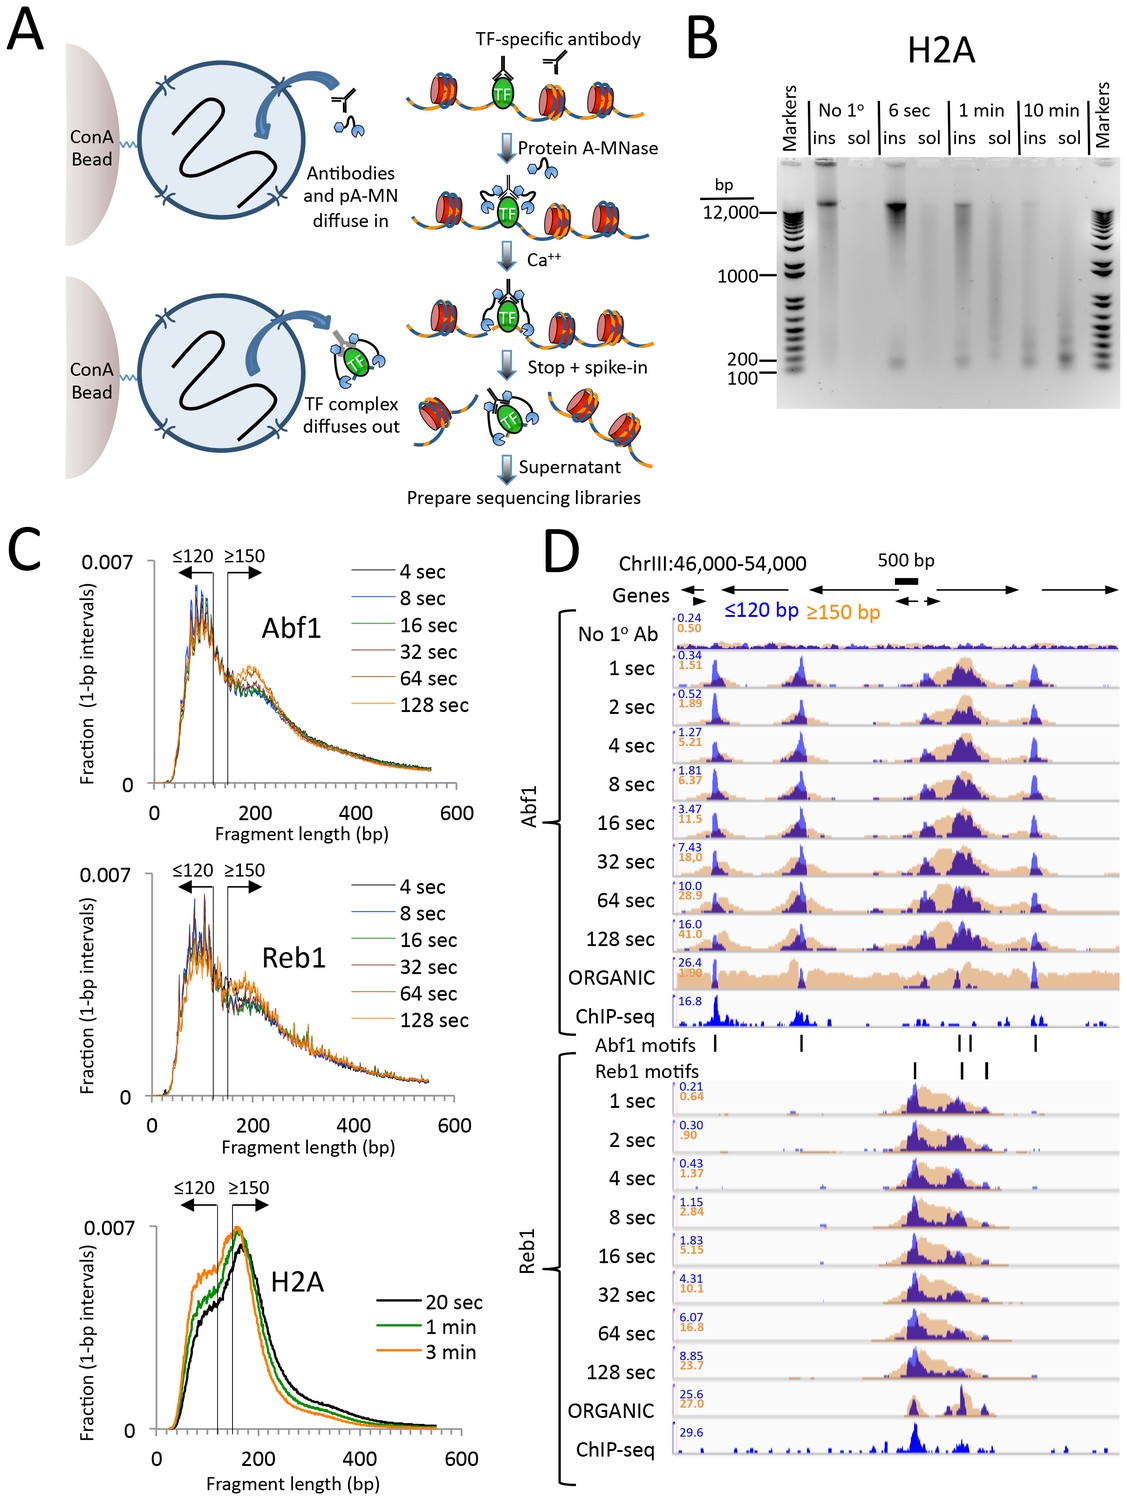
CUT&RUN produces limit digestion TF-DNA complexes.
(A) Schematic diagram of the CUT&RUN strategy. Nuclei attached to magnetic beads can be treated successively with an antibody (or optionally with a primary and secondary antibody) and Protein A-MNase (pA-MN), which diffuse in through the nuclear pores. After Ca++ addition to activate MNase cleavage, fragments are released and diffuse out of the nucleus. DNA extracted from the supernatant is used to prepare libraries for paired-end sequencing. (B) CUT&RUN cleaves and releases chromatin particles into the supernatant. S. cerevisiae nuclei in which the endogenous H2A genes were replaced with H2A-3XFLAG were subjected to CUT&RUN and incubated at 0°C in Ca++ for the indicated times. DNA extracted from both the insoluble (ins) and soluble (sol) fractions was electrophoresed on a 1% agarose gel. The No 1o Ab control was digested for 10 min in parallel but without having added the primary mouse anti-FLAG antibody. (C) Size distributions of mapped paired-end reads from sequencing of indicated TF samples. An H2A size distribution is included for comparison. Data are normalized such that the sum of all points at each length step in base pairs equals 1. (D) Time-course profiles for Abf1 and Reb1 samples (~2–3 million mapped paired-end reads per track) showing ≤120 bp (blue) and ≥150 bp (brown) fragment length classes, compared to ORGANIC ChIP-seq (~20–30 million mapped paired-end reads) and standard ChIP-seq (Paul et al., 2015) (~5 million Abf1 and ~126 million Reb1 mapped single-end 50 bp reads). A negative control track shows the result of leaving out the primary antibody (No 1o Ab). Within each TF and fragment size group, the Y-axis scale is autoscaled by IGV showing normalized counts and the fragment size classes are superimposed. Ticks mark the location of significant Abf1 (upper) and Reb1 (lower) motifs. This region was chosen as having the largest cluster of Abf1 motifs on Chromosome 3.
Figure 1—figure supplement 1
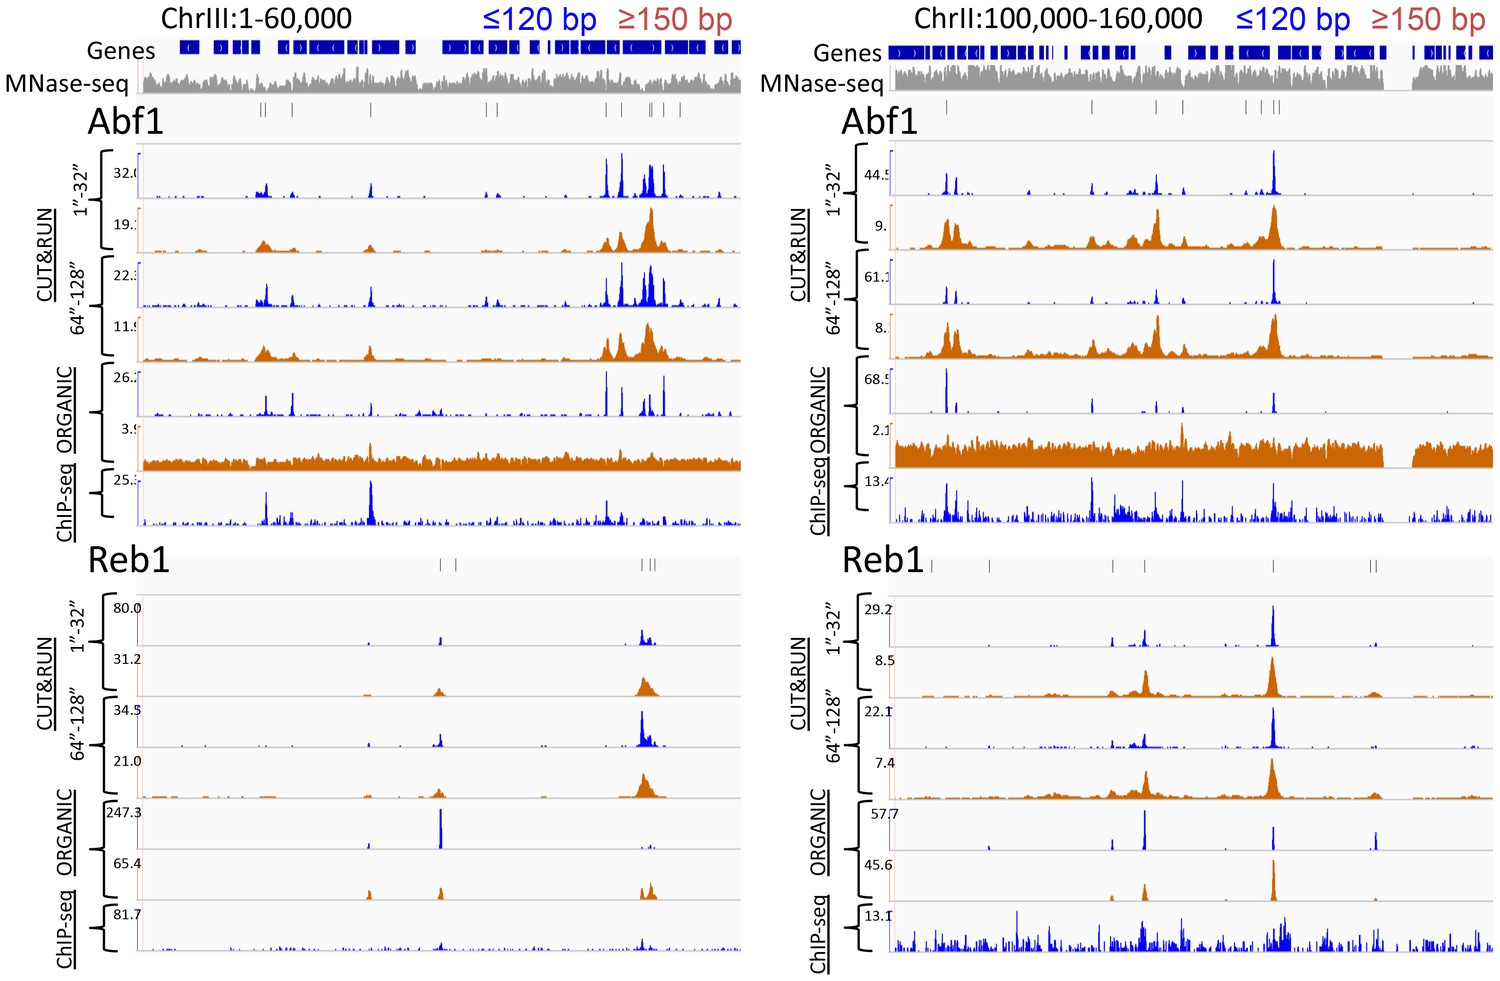
CUT&RUN and ORGANIC ChIP produce qualitatively similar TF occupancy profiles.
Representative examples of Abf1 and Reb1 profiles for CUT&RUN data pooled from the 1” to 32” and the 64” and 128” time-course samples and ORGANIC for ≤120 bp and ≥150 bp fragment lengths, and standard ChIP-seq. An MNase-seq profile is shown in grey. Ticks mark the location of significant Abf1 (upper) and Reb1 (lower) motifs. The Y-axis was autoscaled within each region by IGV.
Figure 1—figure supplement 2

Kinetics of CUT&RUN DNA release.
(A) Electrophoresis on a 1% agarose gel of DNA from the pellet fractions (10 µL per sample) over a 1–128 s digestion time series at 0°C for the two yeast TFs described in this study. As these sites are on average ~10 kb apart in the yeast genome a gradual decrease in fragment size can be observed with time of digestion from 1 s to 128 s for both Abf1 and Reb1. The average distance between CTCF sites in the human genome is too large to observe cleavages using a conventional gel assay. (B) Percent release of DNA based on Picogreen fluorescence measurements: [Supn]/([Supn]+[Pellet])*100. Total yield ~500 ng/sample.
Figure 1—figure supplement 3

Quantitative recovery of bound TFs in supernatants.
(A) A comparison of Abf1 and Reb1 profiles of CUT&RUN data from a single experiment as described in the legend to Figure 1D, except comparing the supernatant fraction (Soluble) to Total DNA after removal of large fragments on AMPure beads. (B) Expanded region of high TF occupancy in (A). (C) Heat map alignments of CUT&RUN ≤120 bp digestion data to motifs and ordering by TF occupancy was performed as described in the legend to Figure 2, except with log scaling and Contrast = 5, centered on 2.
Figure 1—figure supplement 4

Abf1 and Reb1 motifs based on CUT&RUN and ORGANIC ChIP-seq are similar.
The MEME motif-finding program was applied to (A–B) 1”−32” pooled CUT&RUN ≤120 bp data and (C) 600 mM Abf1 and (D) 80 mM Reb1 ORGANIC data, and log-odds sequence logos are shown. Note the close correspondence between motifs determined using CUT&RUN and ORGANIC. (E) Percentage of peak calls with motifs. For each ≤120 bp dataset, peaks were called using thresholds set to recover similar numbers of peaks (stringent ~650 and relaxed ~1100).
Figure 2 with 1 supplement

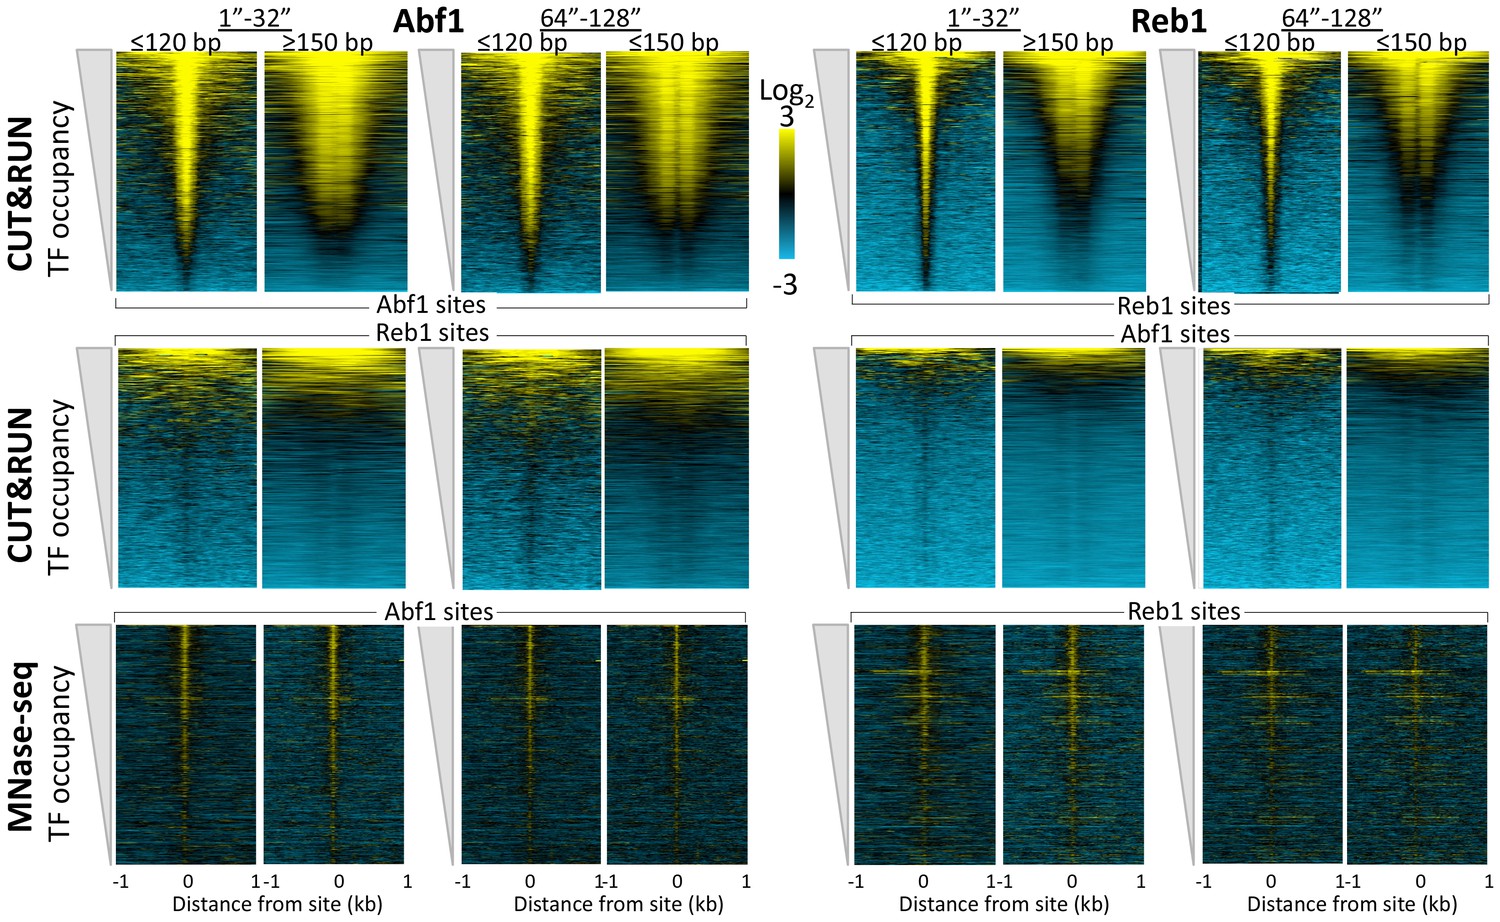
CUT&RUN accuracy and robustness compares favorably with ChIP-seq.
Abf1 (A) and Reb1 (B) heat maps of CUT&RUN datasets from a single experiment (20160630), pooling 1” to 32” time-course samples, and separating into ≤120 bp and ≥150 bp size classes (left). Also shown is the ORGANIC ChIP-seq ≤120 bp size class (middle) and standard ChIP-seq datasets (right). Abf1 has two DNA-binding domains spaced ~10 bp apart (Cho et al., 1995), whereas Reb1 has a single Myb-like DNA-binding domain (Morrow et al., 1990). Solubilization of Abf1 chromatin after MNase digestion required 600 mM NaCl to obtain the best trade-off between specificity and sensitivity, whereas for Reb1, 80 mM gave the best results (Kasinathan et al., 2014), and these are the datasets used for comparison. As in our previous comparison of ORGANIC to ChIP-exo and ChIP-chip (Kasinathan et al., 2014), we consider the set of all statistically significant Abf1 and Reb1 motifs as the ‘gold standard’ for judging sensitivity (occupancy of sites by the correct TF) and specificity (exclusion from sites of an incorrect TF). Aligned profiling data were centered and oriented over the motif for the same TF (top) and for the other TF (bottom) for display (removing 81 sites where Abf1 and Reb1 sites were within 50 bp of one another) and were ordered by average pixel density over the −1 kb to +1 kb span of the ≤120 bp datasets using Java Treeview with log2 scaling and contrast = 5. Ordering was performed independently for CUT&RUN (based on ≤120 bp fragments) and ChIP-seq, in which case the approximate fraction of sites occupied relative to flanking regions becomes evident, and comparison of the top panel (correct TF) to the bottom panel (incorrect TF) reflects the sensitivity/specificity tradeoff for a dataset. Sites were determined by MAST searching of the S. cerevisiae genome using the position-specific scoring matrices (PSSMs) based on ChIP-seq data (Figure 1—figure supplement 4), but similar results were obtained using MAST with PSSMs based on CUT&RUN data (not shown).
Figure 2—figure supplement 1
CUT&RUN reveals cleavage kinetics in situ.
A comparison of Abf1 (left) and Reb1 (right) heat maps of CUT&RUN data from a single experiment (20160630), pooling the 1” to 32” and the 64” and 128” time-course samples, and separated into ≤120 bp (left) and ≥150 bp (right) size classes. Alignments to motifs and ordering by TF occupancy was performed as described in the legend to Figure 3, except that Treeview was used with log scaling and contrast = 3. Note that with increased digestion time, more of the TFs are released, deepening the ‘hole’ of ≥150 bp fragments without any noticeable change in dynamic range. CUT&RUN shows a much higher dynamic range than MNase-seq for particle detection (compare top panels with bottom panels). MNase-seq data are from Henikoff et al., 2011.
Figure 3
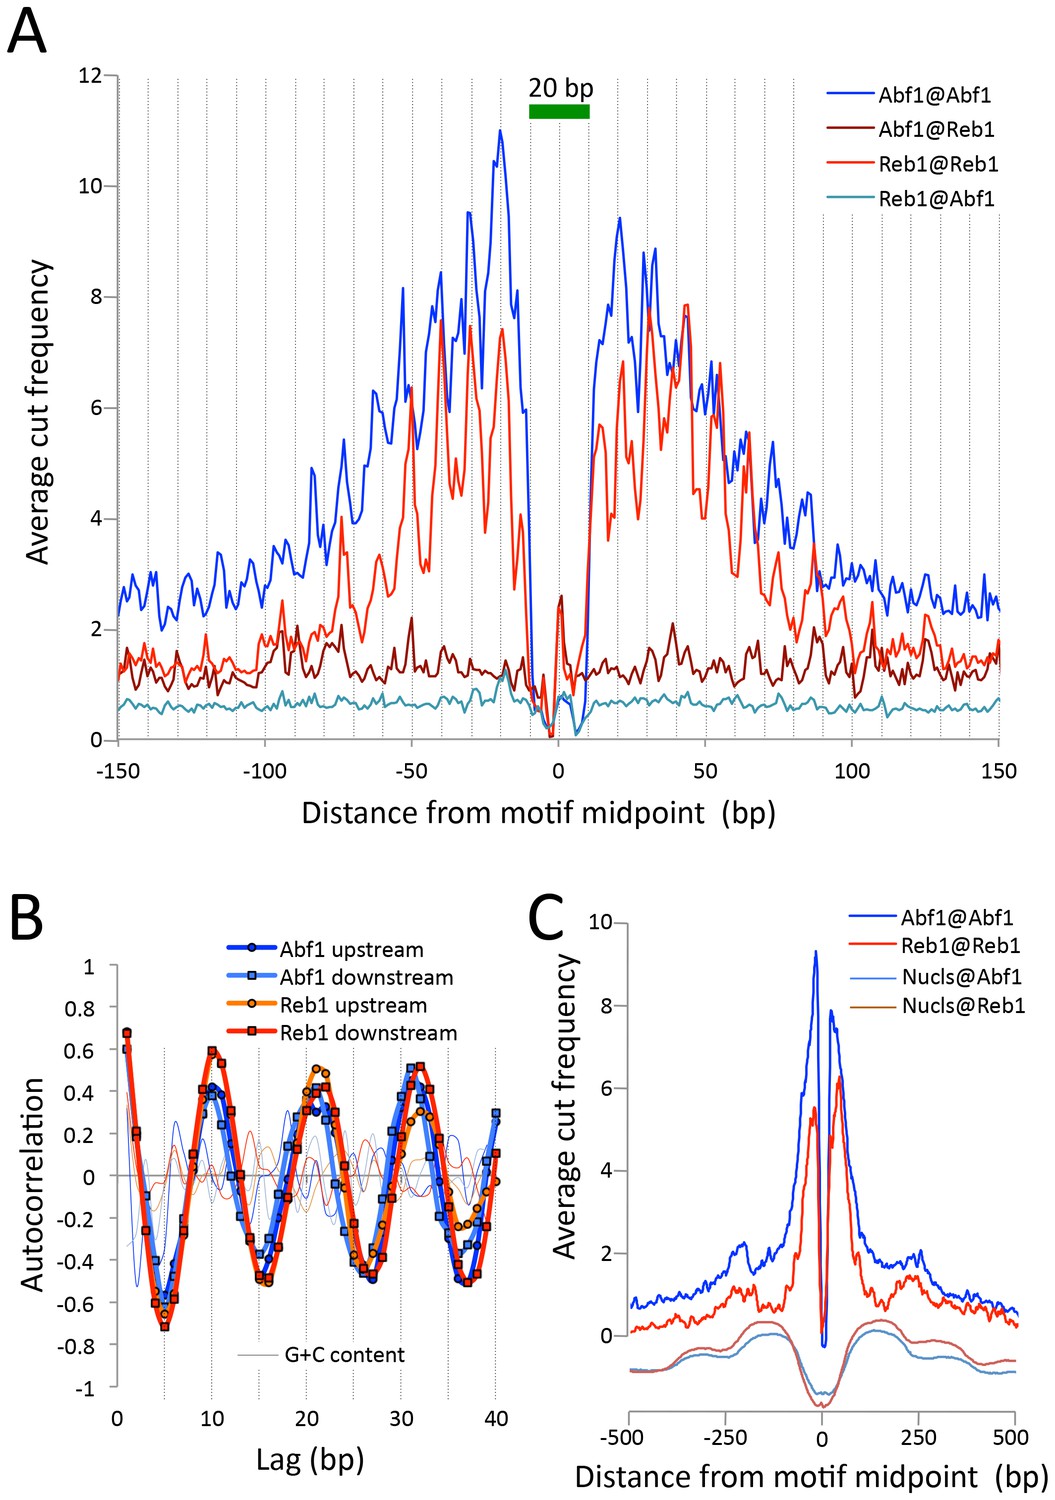
CUT&RUN maps TF binding sites at high resolution.
(A) Mapping of fragment ends reveals a deep ‘hole’ and steep ‘walls’ for Abf1 and Reb1 CUT&RUN datasets averaged at their oriented and aligned motifs genome-wide, plotting all normalized base-pair counts from combined 1”−32” datasets (Figure 2). Sawtooth patterns with an apparent ~10 bp periodicity on the upstream and downstream ‘slopes’ are confirmed by (B) autocorrelation analysis of the difference between the 1 bp resolution profile shown in (A) and the same profile smoothed with an 11 bp sliding window, which also shows that there is no corresponding periodicity in average G+C content (thin lines). (C) Same as (A), but subject to smoothing with an 11 bp sliding window and displayed at larger scale. The fact that the slopes around Reb1 show depressions at +150 and −150 likely reflects the presence of phased nucleosomes, shown below (Nucls, Y-axis arbitrary) based on the ≥150 bp size class from ORGANIC input data (Kasinathan et al., 2014).
Figure 4 with 2 supplements

CUT&RUN precisely maps large mobile chromatin complexes.
(A) Representative tracks showing a Mot1 CUT&RUN time-course experiment (average ~3 million paired-end reads per sample), including a no primary antibody (No 1o Ab) negative control, aligned with Mot1 ORGANIC data for two MNase digestion time points (2.5’ and 10’, average 22 million reads per sample) (Zentner and Henikoff, 2013). TBP sites shown as dotted lines reveal that Mot1 peaks are just upstream of TBP peak maxima. (B) Occupancy profiles for Sth1 CUT&RUN digestion over a 120-fold range, spike-in normalized, showing absolute quantitation. (C) Sth1 ORGANIC profiles (~15 million reads) show concordance with the CUT&RUN 5 s sample (~2 million reads). Note that the same CUT&RUN 5 s ≤120 bp profile is shown in both panels (B) and (C), but at different scales.
Figure 4—figure supplement 1
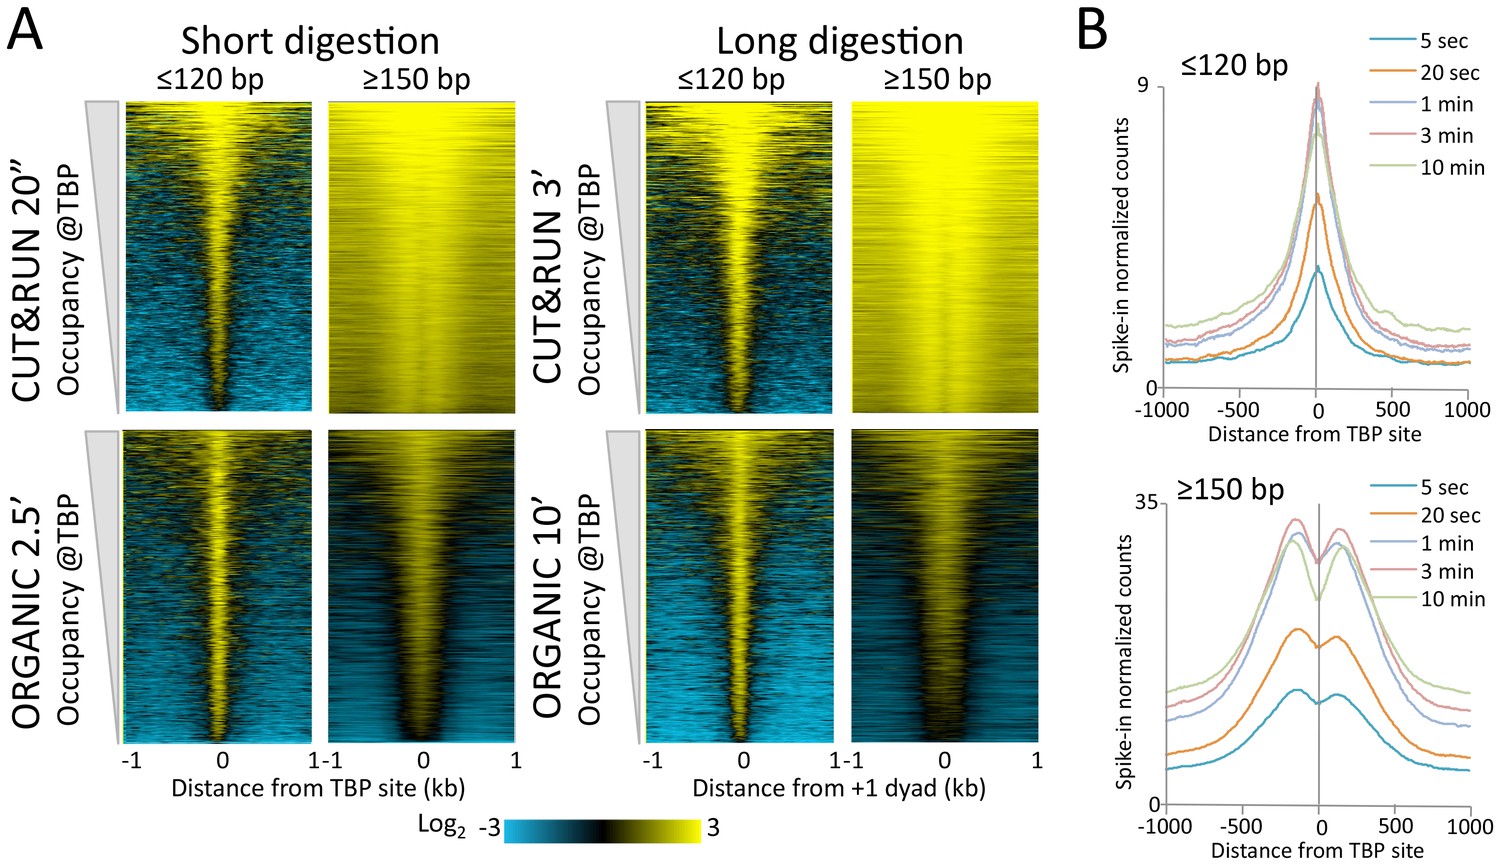
CUT&RUN and ORGANIC profiles for Mot1.
(A) Heat maps of two CUT&RUN and two ORGANIC time points aligned around TBP sites and ordered by increasing Mot1 occupancy over the 2 kb region surrounding each site. (B) Occupancy profiles for Mot1 CUT&RUN digestion over a 120-fold range, spike-in normalized, showing absolute quantitation.
Figure 4—figure supplement 2
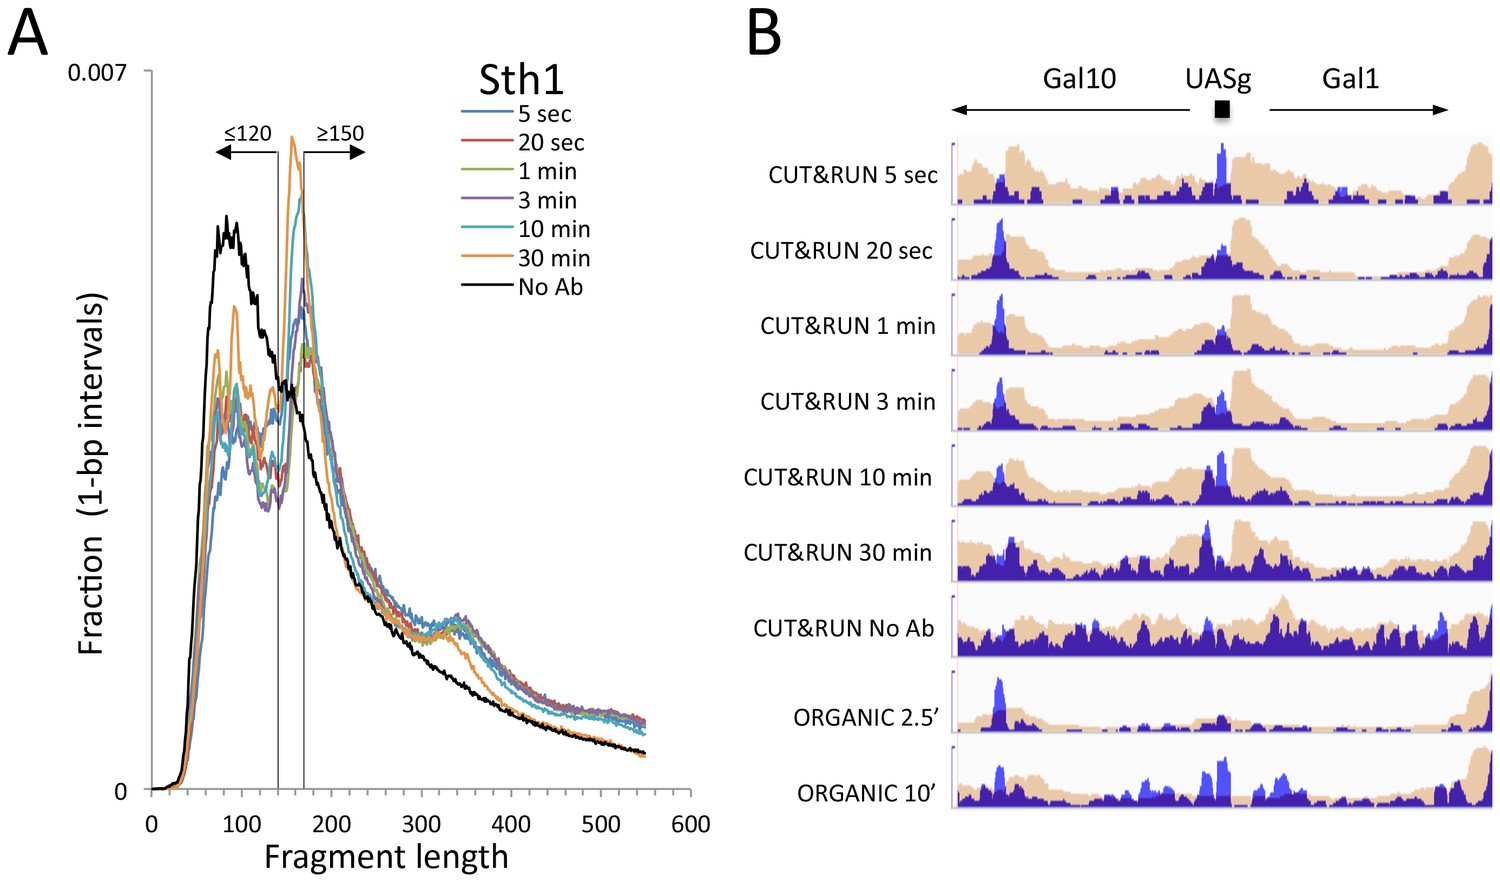
CUT&RUN and ORGANIC profiles for Sth1.
(A) Length distributions of Sth1 CUT&RUN AMPure-bead filtered total DNA fragments normalized such that there is equal areas under the curves. Uniform digestion and release is observed over the time-course. Data are combined from two biological replicates. No anti-FLAG primary antibody (No Ab) (B) Tracks of the Gal1-Gal4 region (ChrII:276,000–281,000) showing concordance with the mapping of RSC to the Gal4 UAS (UASg, Floer et al., 2010.
Figure 5 with 1 supplement
CUT&RUN maps the rare highly insoluble S. cerevisiae kinetochore complex.
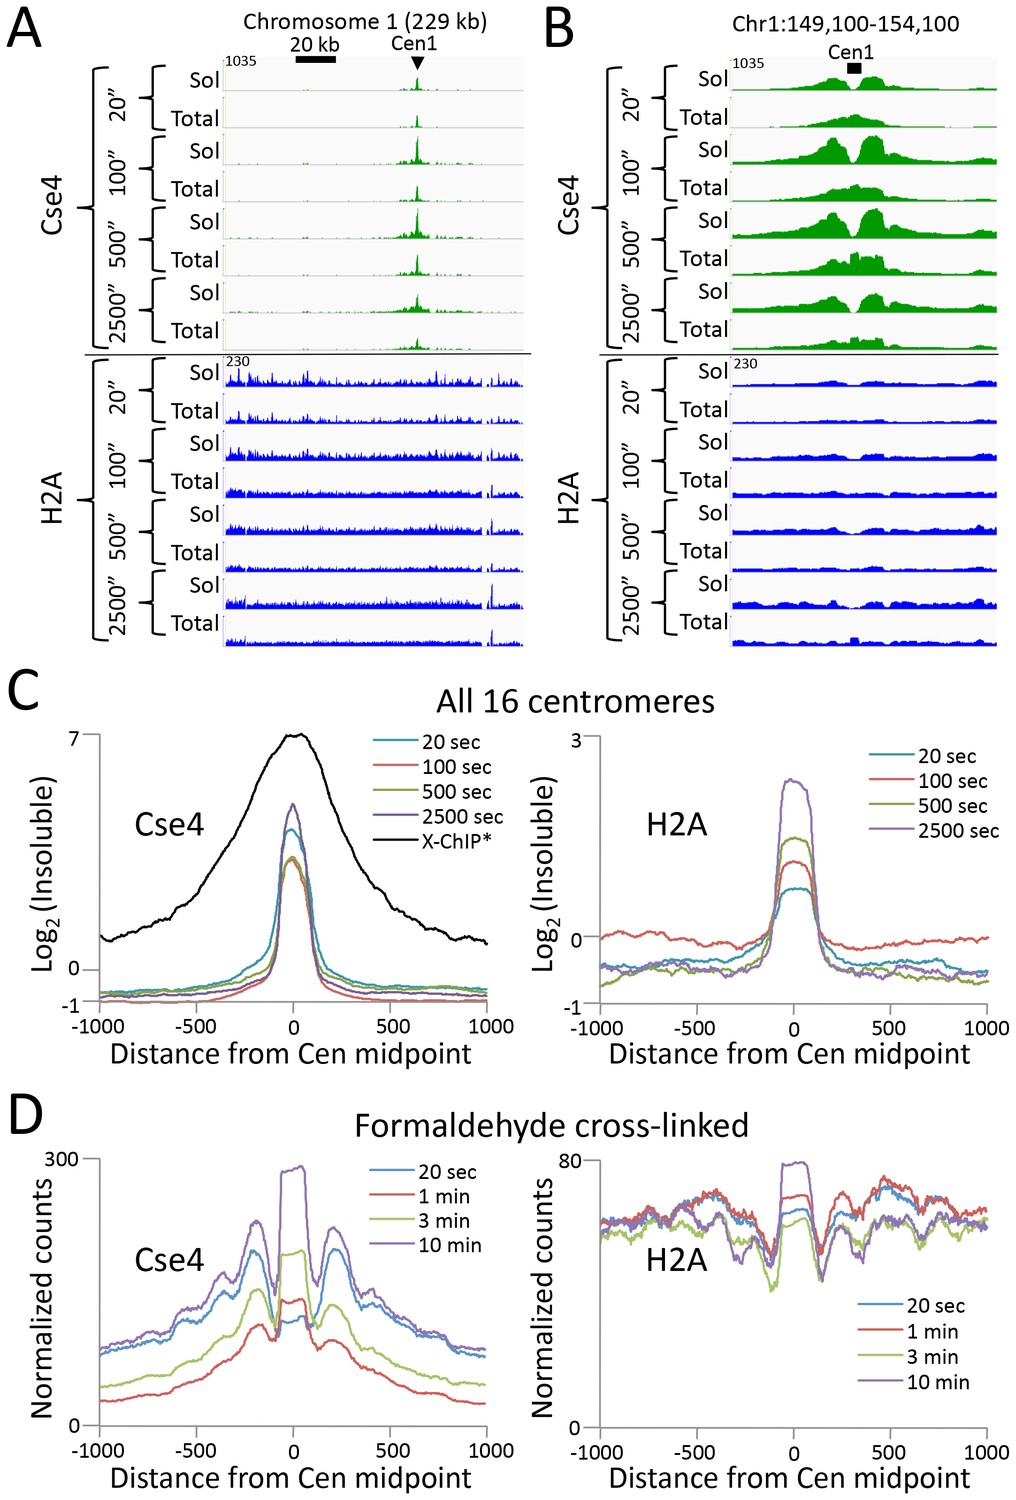
(A) After stopping digestion for the indicated times, samples were split in half and both the soluble fraction and total DNA were extracted. Large fragments were removed from total DNA with AMPure beads before library preparation. Normalized counts are shown for S. cerevisiae Centromere 1, where Cse4 and H2A tracks are on the same Y-axis scale. Similar maxima over centromeres was also seen genome-wide. (B) Same as (A) but zoomed in over the 5 kb interval at the centromere. (C) Occupancies of insoluble Cse4 and H2A, where we define log2(Insoluble) = log2(Total) – log2(Soluble) = log2(Total/Soluble) for the medians of all 16 S. cerevisiae centromeres aligned around their midpoints. A published X-ChIP-seq profile (Pekgöz Altunkaya et al., 2016) is shown on the same scale for comparison (left). Asterisk: log2(ChIP/Input) averaged over two replicates. (D) Normalized count profile of Cse4 and H2A CUT&RUN applied to formaldehyde cross-linked cells digested for the indicated times.
Figure 5—figure supplement 1
CUT&RUN maps the rare highly insoluble S. cerevisiae kinetochore complex.
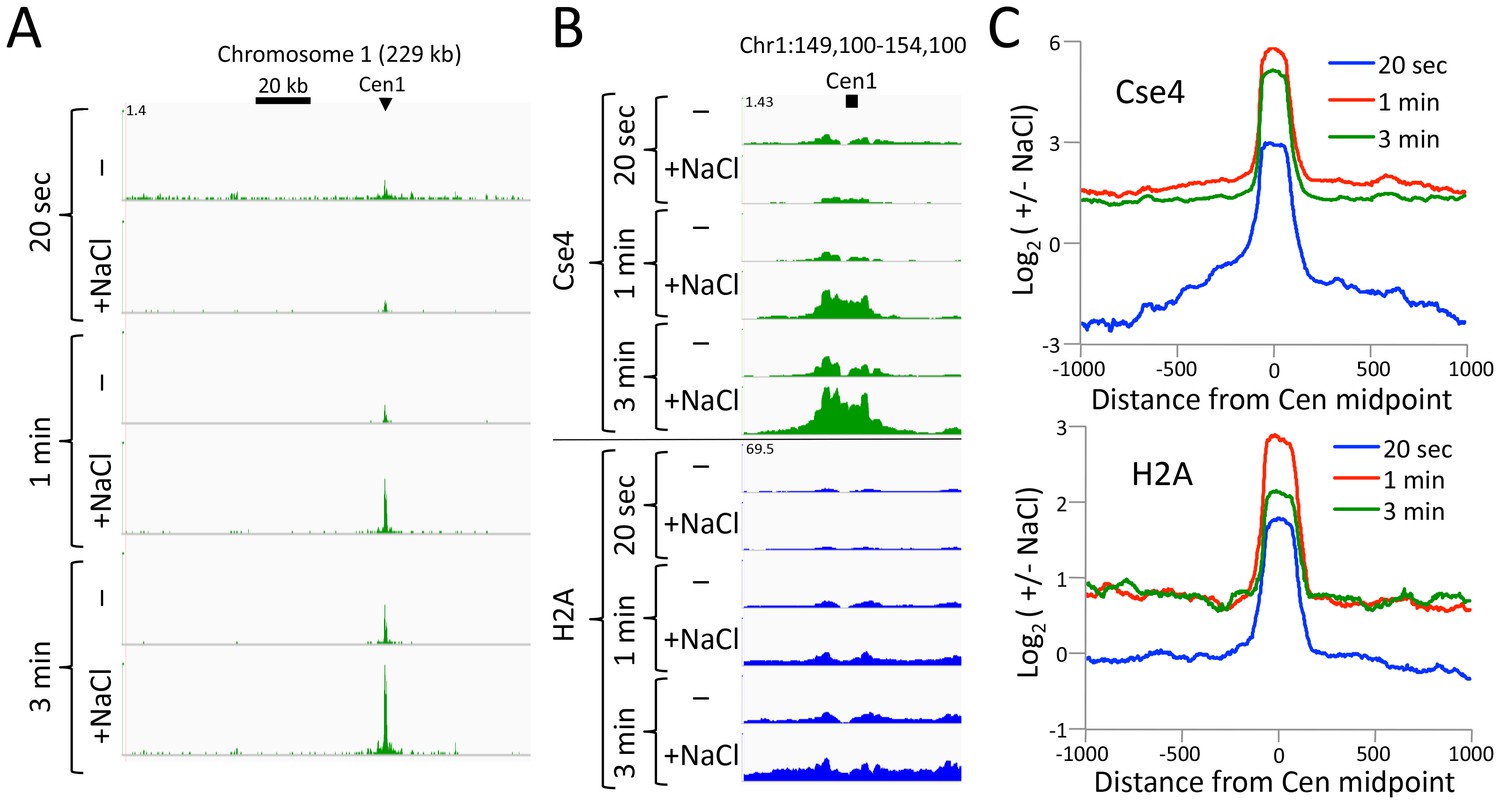
(A) After antibody and pA-MN addition, samples were split in half, pA-MN was activated with calcium, and the reaction stopped with either the standard 100 mM NaCl buffer (-) or a buffer containing 2 M NaCl (+). Tracks are displayed for Chromosome one using spike-in normalization to reflect absolute recovery. (B) Close-up views of Cse4 and log-ratios of Cse4 and H2A high-salt versus low-salt extracted fragments. (C) Log-ratios of high-salt versus low-salt extracted fragments for the medians of all 16 S. cerevisiae centromeres aligned around their midpoints.
Figure 6 with 4 supplements
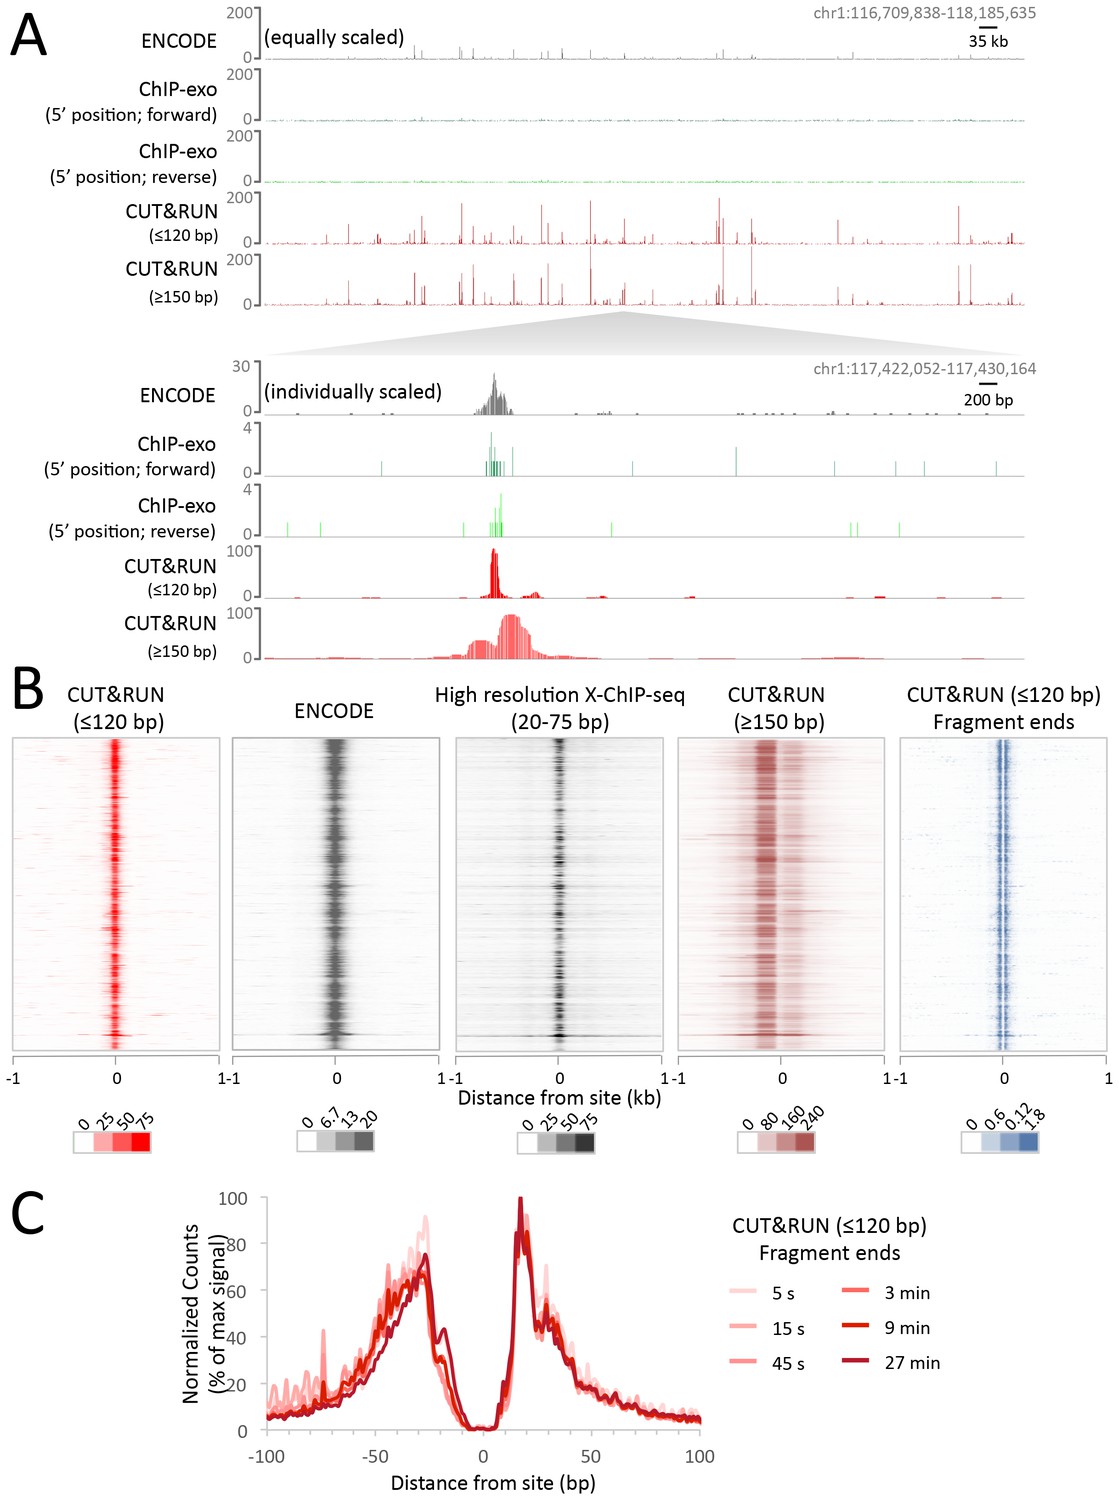
CUT&RUN maps high-resolution footprints of CTCF.
(A) Representative signal over a genomic locus for 10 million randomly sampled reads from ENCODE CTCF ChIP (GSM749690), CTCF ChIP-exo, and CUT&RUN. In the top panel, the y-axis is the same for all datasets indicating the higher dynamic range for CUT&RUN. In the bottom panel, the y-axis is individually set. (B) Heat maps of CUT&RUN pooled datasets (7.5 min to 45 min) separated into ≤120 bp (including fragment ends) and ≥150 bp size classes and of ENCODE X-ChIP-seq and high resolution X-ChIP-seq (Skene and Henikoff, 2015) for CTCF in human K562 cells. Sites were determined by an unbiased approach in which the data were centered and oriented on CTCF motifs that were found within DNaseI hypersensitive sites and ordered by genomic location. Asymmetric release of the upstream and downstream nucleosome likely comes from epitope location controlling access to nucleosomes either side of the motif. (C) Mean plots of end positions from ≤120 bp fragments resulting from a CUT&RUN digestion time-course centered over sites as above. Data are represented as a percentage of the maximum signal within the ±1 kb flanking region.
Figure 6—figure supplement 1
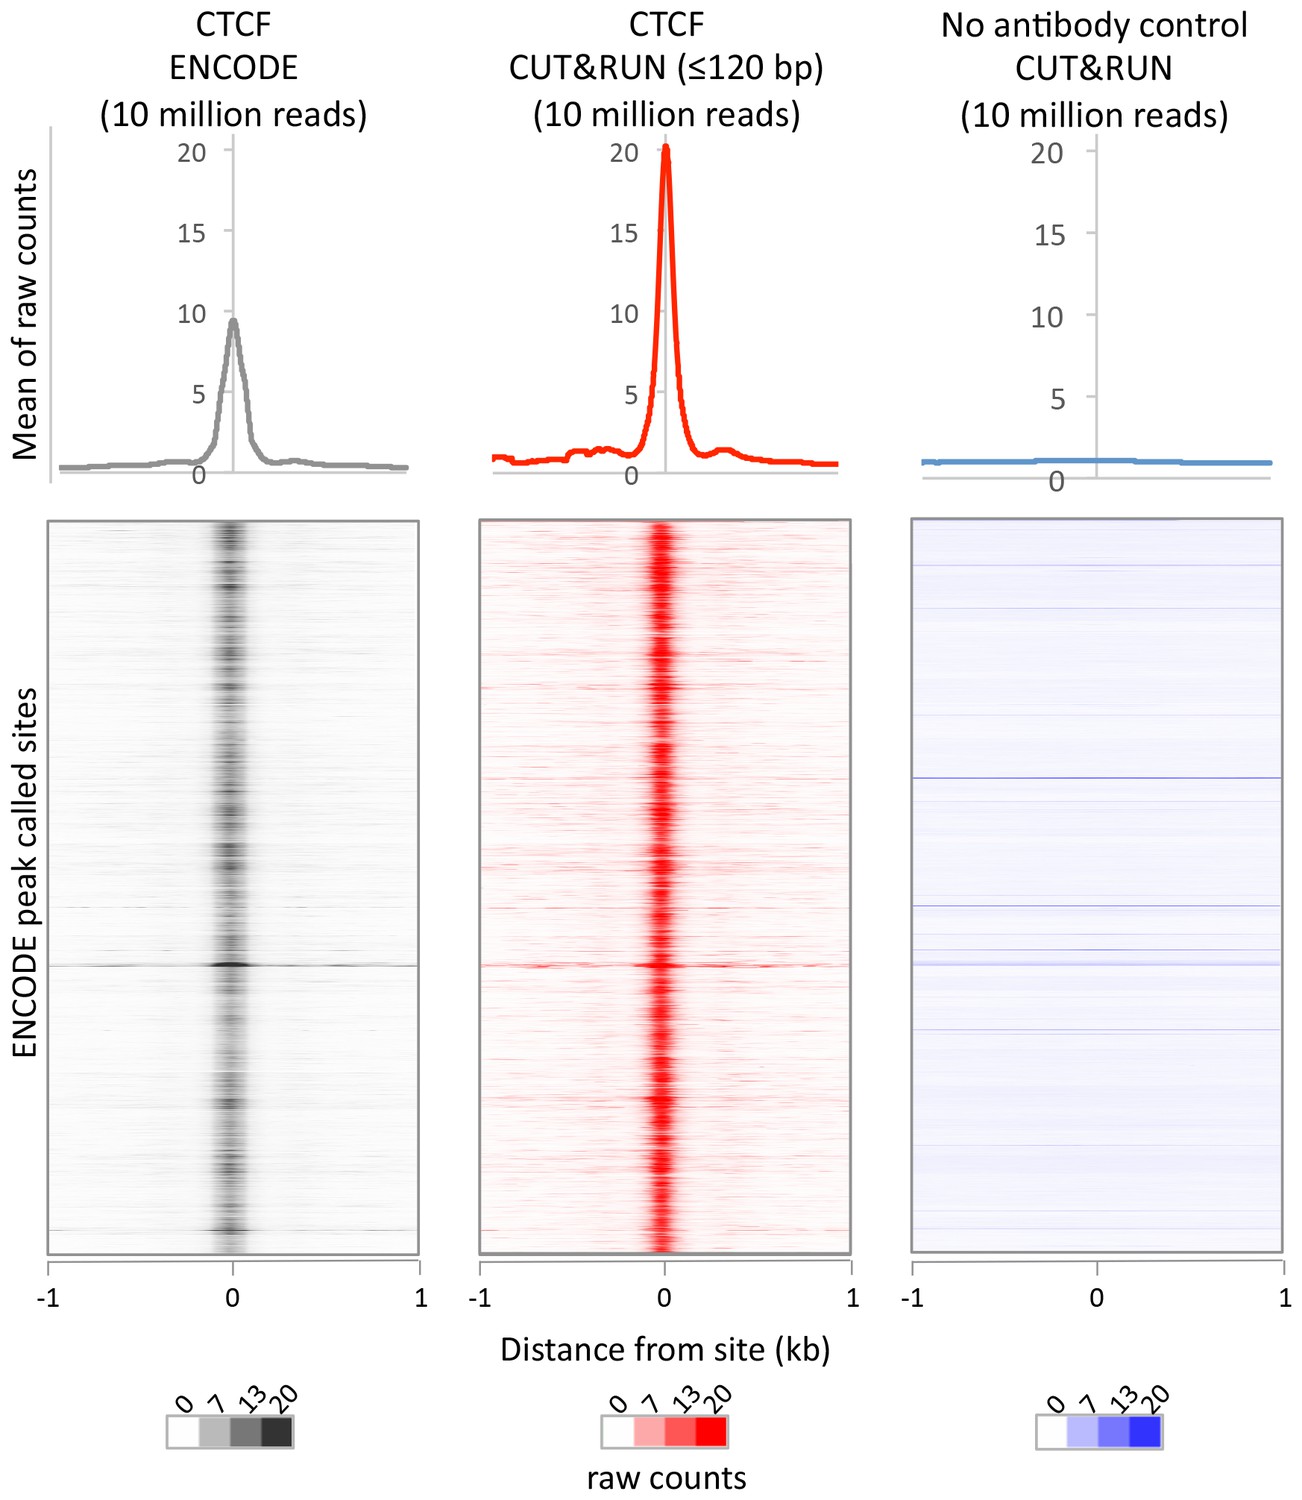
CUT&RUN recapitulates X-ChIP-seq but with higher dynamic range.
For a direct comparison of genome wide dynamic range at previously identified CTCF binding sites, 10 million reads were randomly selected from ENCODE CTCF X-ChIP-seq (GSM749690) and CUT&RUN datasets and plotted at ENCODE peak called sites (GSM749690_narrowPeak). The upper plot shows the mean average of raw counts over these sites and heat maps below are ordered by genomic location.
Figure 6—figure supplement 2
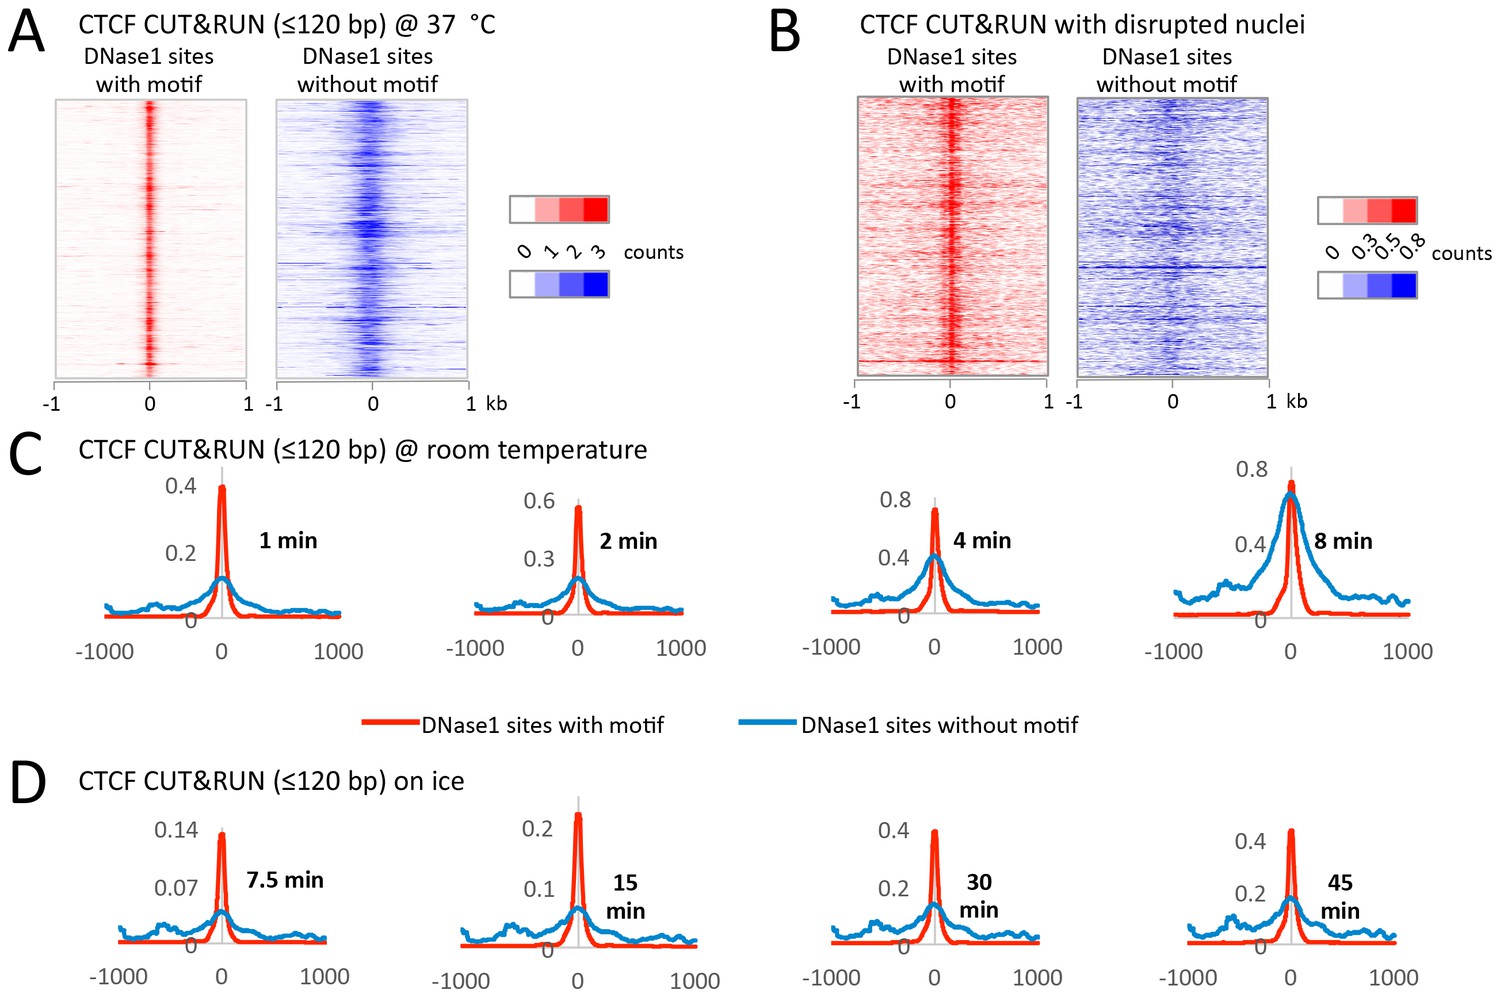
CUT&RUN has low background when performed on ice.
During protocol optimization, we performed the cleavage reactions over a range of temperatures. (A) We initially used 37°C as is often done for MNase reactions. Careful analysis of the data, however, showed that despite clearly mapping CTCF at its true sites with a low density genome-wide background, we also had a specific background at random DNase1 sites. We rationalized that specific background arose from the liberated chromatin complexes that are still bound by Protein A-MNase diffusing around the nucleus and cutting accessible regions of chromatin. (B) To test this hypothesis, after the CTCF antibody and Protein A-MNase had bound in situ, we disrupted the nuclear envelope with limited sonication to release the chromatin into the large reaction volume. When CUT&RUN was performed under disrupted conditions, we no longer observed this specific background. (C) We therefore tried to limit the diffusion of these chromatin complexes by performing the cleavage reaction at room temperature. We observed that the signal-to-noise ratio started low, but increased over time and by 8 min the noise was indistinguishable from the signal. (D) However, by keeping the reaction on ice the signal-to-noise ratio was hi and independent of time. Therefore, by controlling the temperature for the cleavage reaction, we can robustly maintain a low background.
Figure 6—figure supplement 3
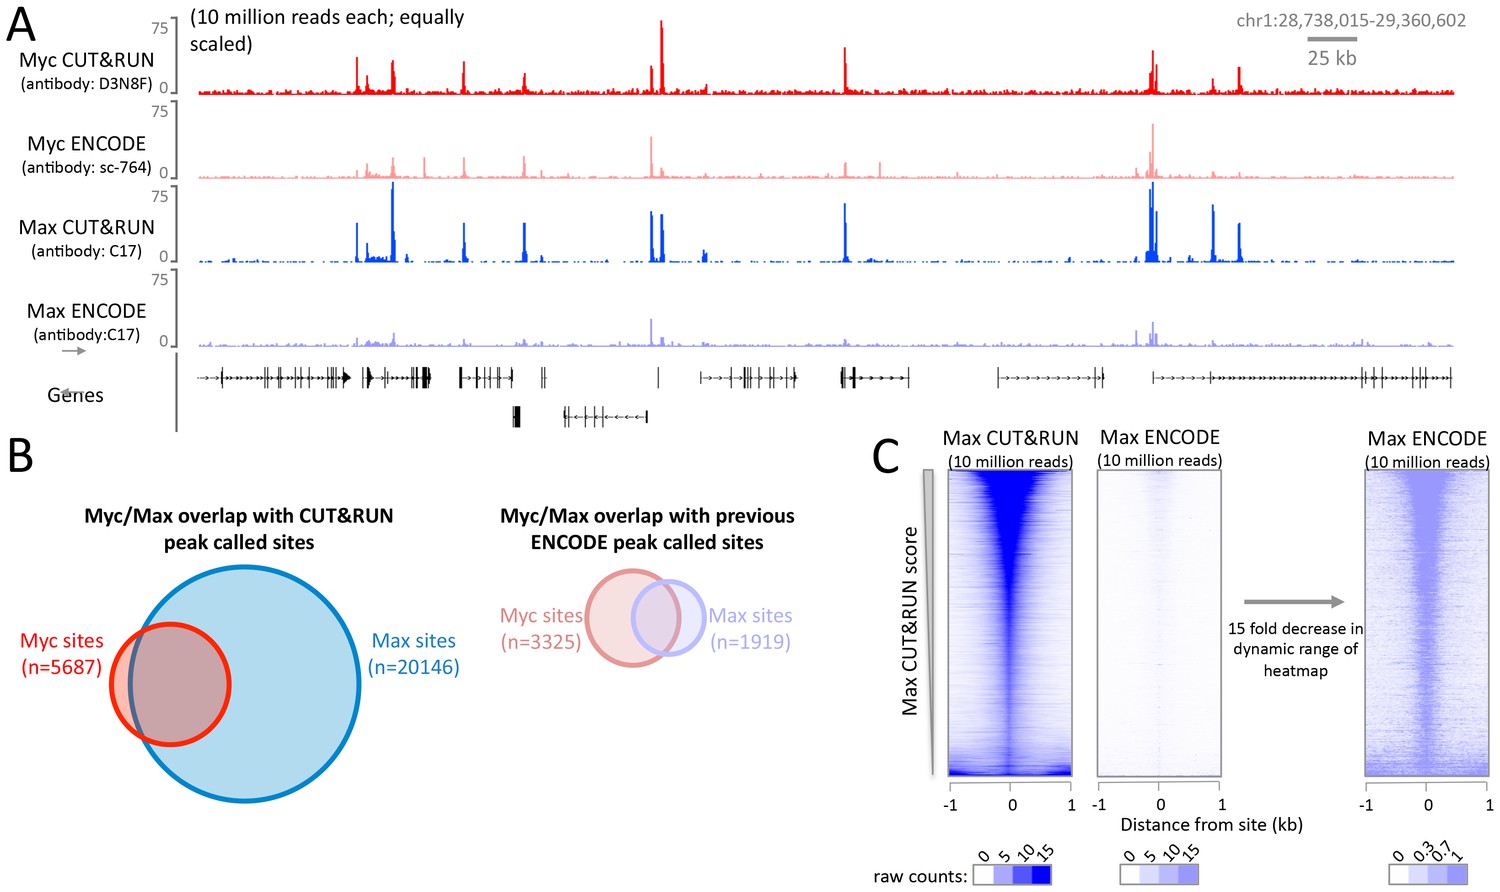
The high signal-to-noise ratio of CUT&RUN allows robust identification of DNA binding sites not possible with X-ChIP-seq.
CUT&RUN was performed for Myc and Max in K562 cells and compared to ENCODE X-ChIP-seq datasets (GSM935410; GSM935539). For each dataset 10 million reads were randomly selected and (A) a typical genomic region is shown. Note for Myc different antibodies were used and therefore quantitative comparison is not possible. (B) Proportional Venn diagrams displaying the overlap between Myc and Max peak called sites identified by CUT&RUN or previously by ENCODE. (C) Heat maps showing CUT&RUN and ENCODE X-ChIP-seq signal plotted at peak called sites identified by Max CUT&RUN (n = 20146). Sites were ranked by Max CUT&RUN score, note the change in the dynamic range of the heat maps.
Figure 6—figure supplement 4
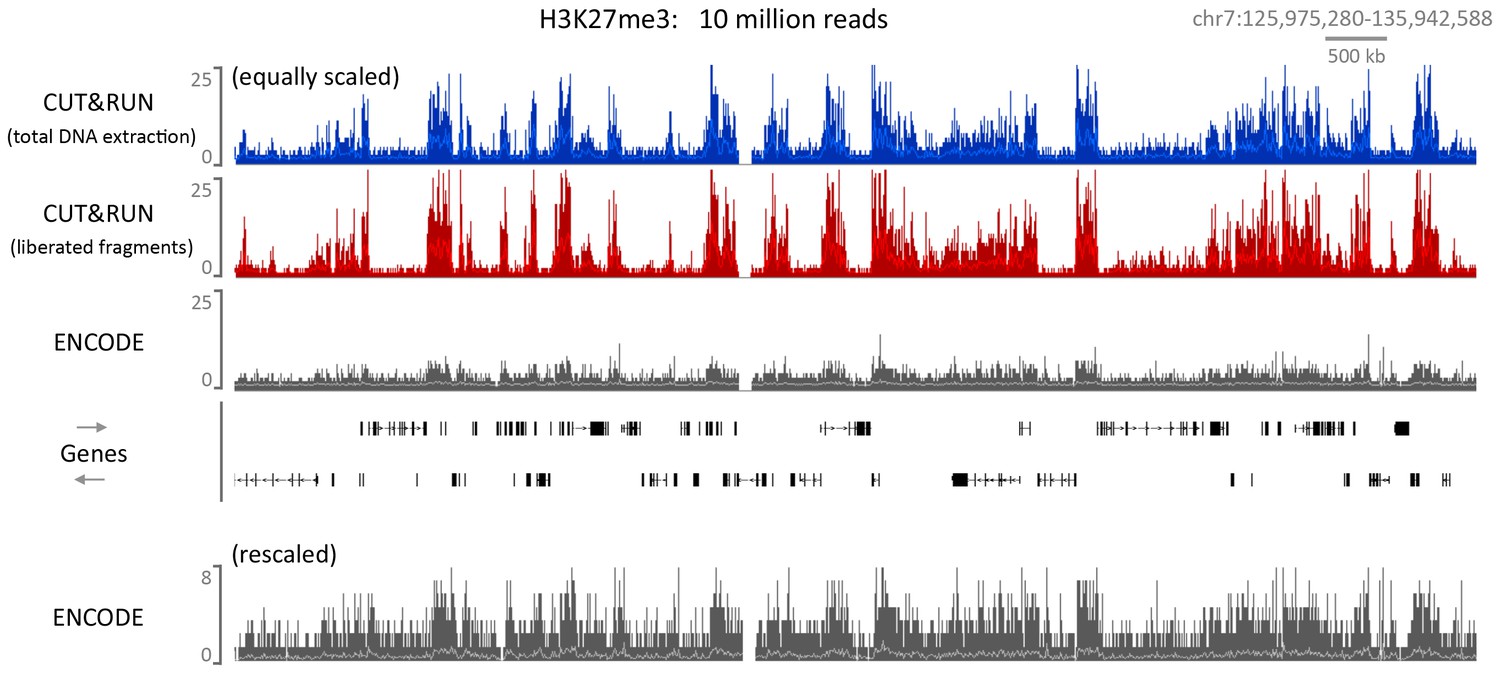
CUT&RUN can map compacted chromatin with a high dynamic range.
CUT&RUN was performed for H3K27me3 in K562 cells either by extracting all the DNA after digestion followed by size selection or allowing cut fragments to diffuse out of the nuclei. For comparison an ENCODE H3K27me3 X-ChIP-seq (GSM733658) dataset was analyzed. For each dataset 10 million reads were randomly selected and a typical genomic region is shown with the upper panels equally scaled and the lower panel rescaled for the ENCODE dataset.
Figure 7 with 2 supplements
CTCF directly binds a subset of CUT&RUN peaks despite a robust footprint at all sites.
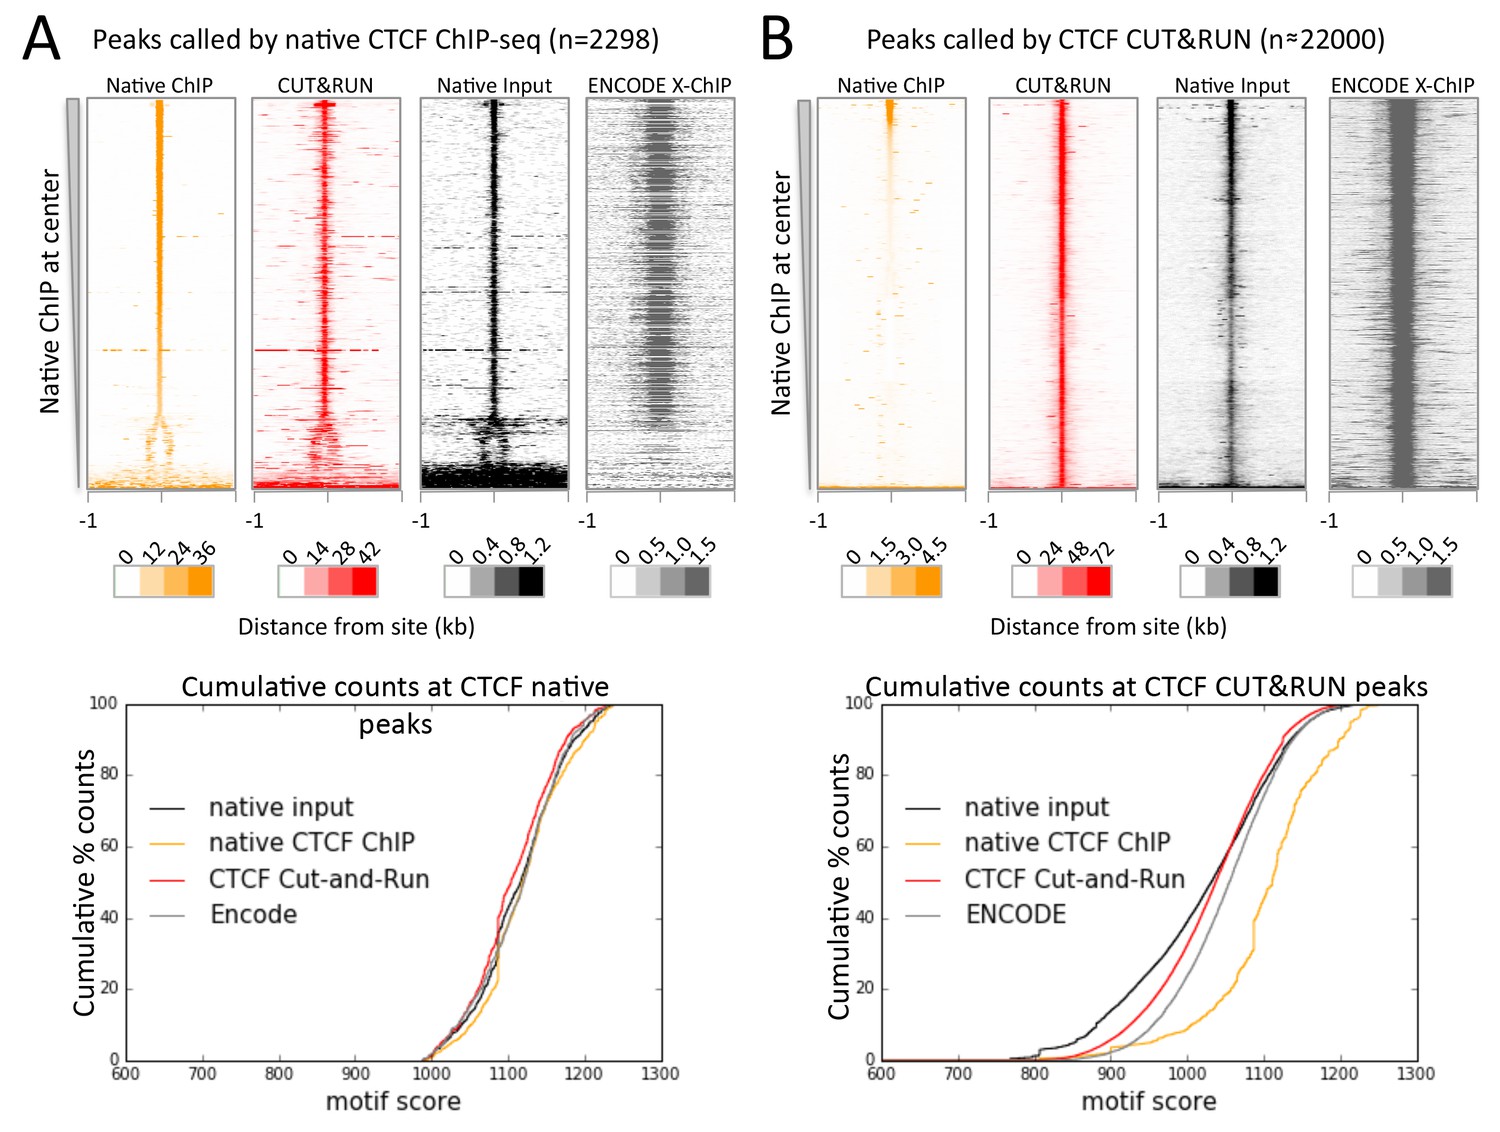
(A) Chromatin was fragmented and solubilized under native conditions and either directly sequenced as native input or CTCF bound chromatin was immunoprecipitated and sequenced. ENCODE X-ChIP-seq was analyzed for comparative purposes. Peaks of CTCF binding under native conditions were identified and centered on the best match to the CTCF motif (JASPAR database MA0139.1, http://jaspar.genereg.net/). Data were plotted over these sites (−1 to +1 kb) as heat maps for native ChIP DNA fragments (20–75 bp) and CUT&RUN (≤120 bp) and ordered by native CTCF ChIP occupancy (sum over the center region (−30 to +30 bp) minus the sum over the flanks (−1000 to −700 and +700 to+1000 bp). The graph below shows the cumulative percent of sequencing counts for the different techniques over peak-called sites (−30 to +30 bp) and ranked by similarity to the CTCF motif. This shows the high concordance between the chromatin profiling techniques at native ChIP peaks. Note that the dynamic range scales for Native ChIP and CUT&RUN are ~30–40 fold higher than those for Native Input and ENCODE X-ChIP, which was needed to show the input and ENCODE patterns. (B) Data plotted over CUT&RUN peak-called sites, with processing as per (A). The cumulative distribution shows the shift to lower motif scores for CUT&RUN sites (see Figure 7—figure supplement 2 and the separation between CUT&RUN and native ChIP.
Figure 7—figure supplement 1
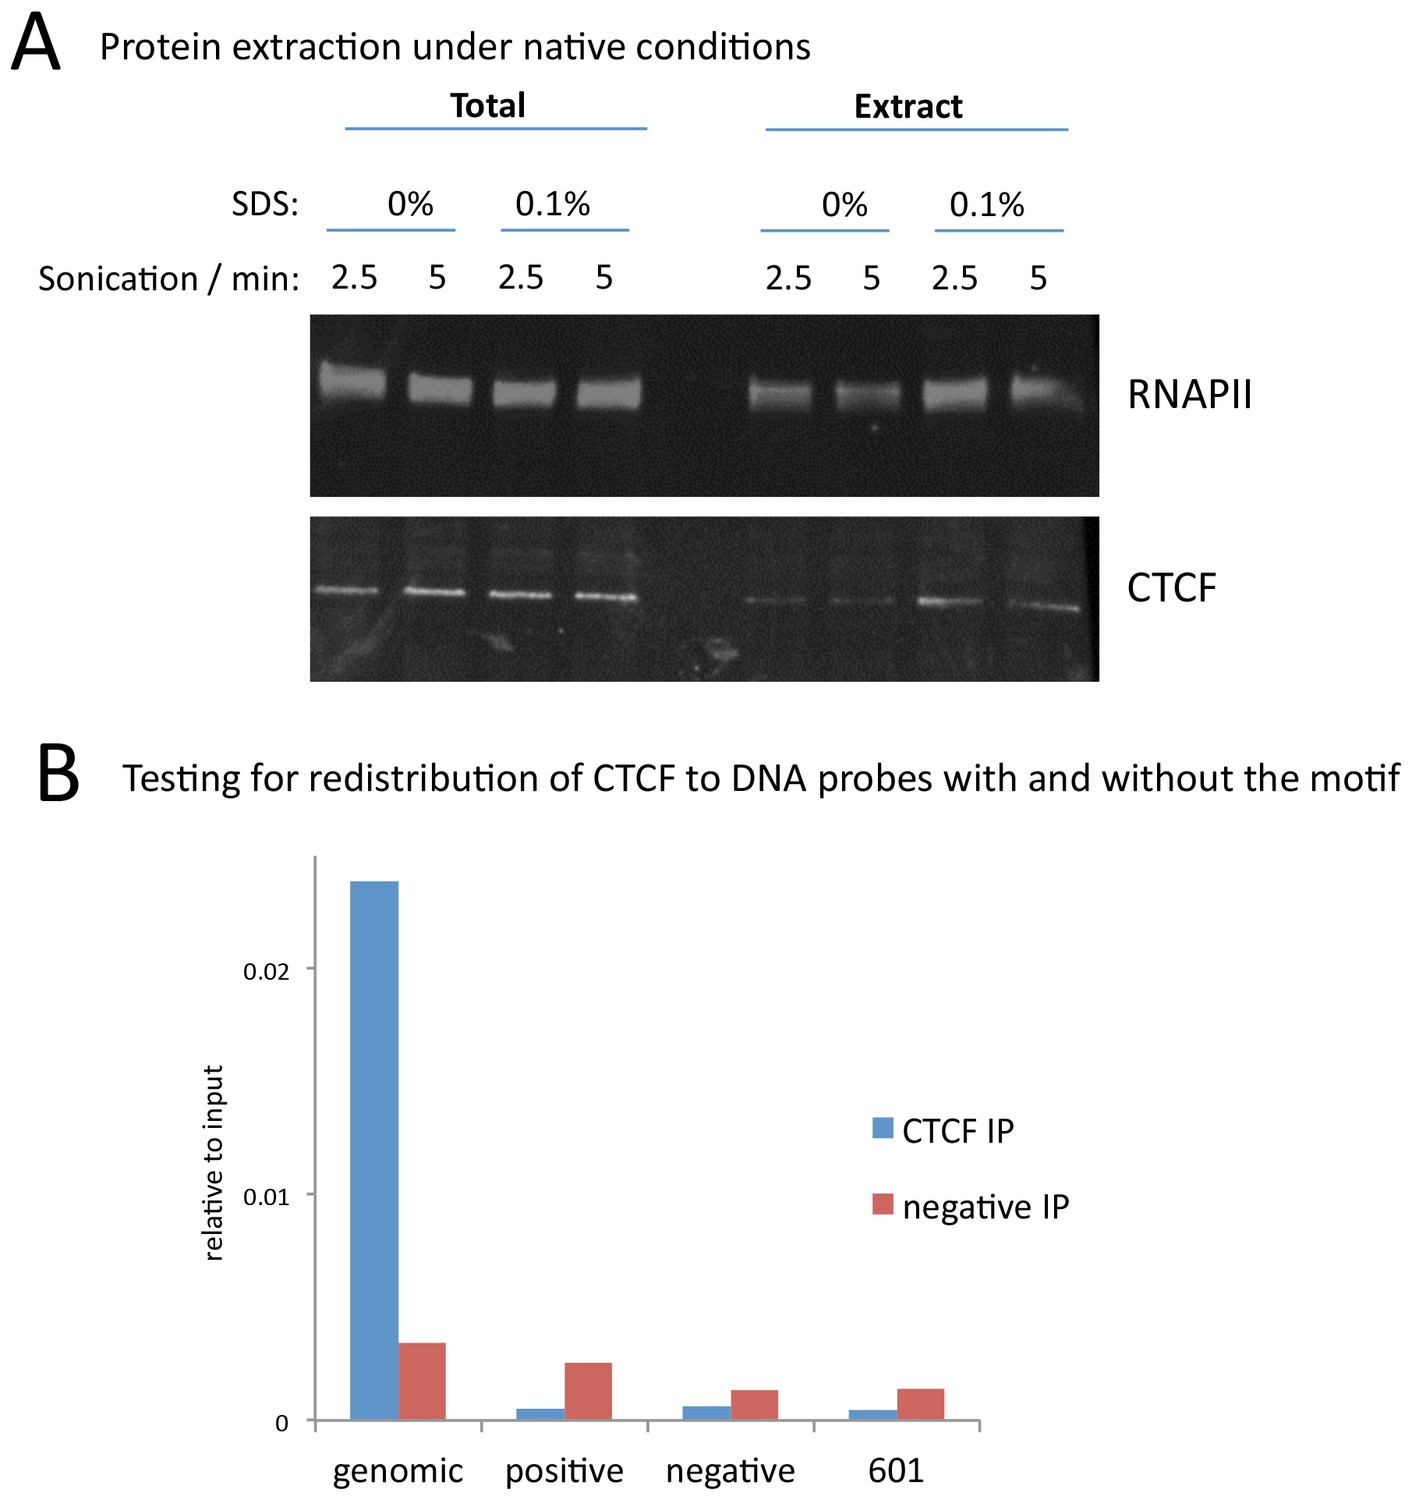
A modified native ChIP protocol allows complete protein extraction.
(A) Western blotting to test the extraction efficiency of RNA polymerase II (RNAPII) and CTCF under native conditions with varying SDS and sonication conditions. (B) To test for potential redistribution of CTCF under native conditions, extracts were incubated with 95 bp DNA probes with a high scoring motif (positive), or a shuffled sequence (negative), or the 601 nucleosome positioning sequence at 1000 copies per cell. Following the ChIP and DNA extraction, quantitative PCR was used to test for CTCF binding to a native peak in the genome (genomic) or to the DNA probes.
Figure 7—figure supplement 2

Peaks identified by CUT&RUN have a more diverse range of motif scores than peaks from native ChIP.
Peak calling was performed on native CTCF ChIP (false positives were removed that did not contain a clear peak) and CUT&RUN. The underlying DNA sequence was extended in both directions by 100 bp and the best match and score to the JASPAR position frequency matrix (MA0139.1) calculated. Histograms plot the distribution of motif scores.
Figure 8
CUT&RUN in combination with native ChIP can discern direct and indirect 3D contact sites.
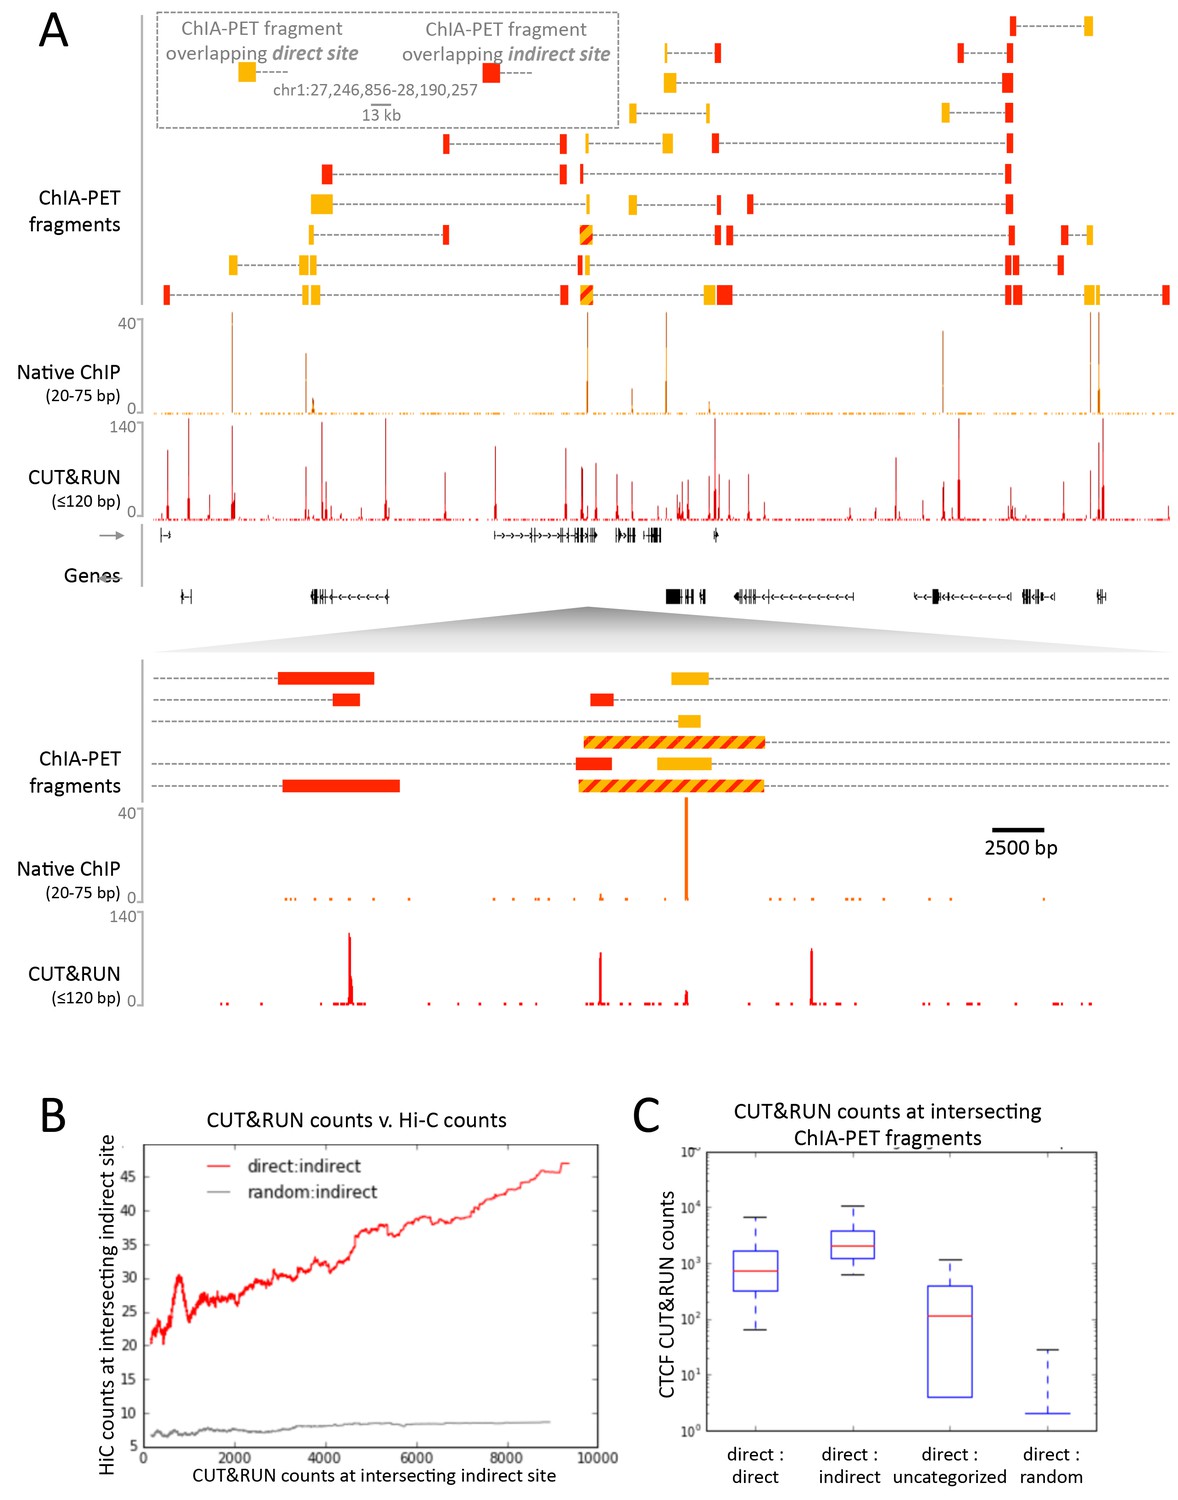
(A) Typical genomic region displaying CUT&RUN (≤120 bp), native ChIP (20–75 bp) data for CTCF and CTCF ChIA-PET fragments (GSM1872886; score ≥15). ChIA-PET fragments were ascribed as a direct interaction (overlapping a native ChIP peak) or an indirect interaction (overlapping a CUT&RUN peak only). (B) Peak called sites were separated into either direct (present in native ChIP) or indirect (only present in CUT&RUN). Hi-C fragments that intersect with direct sites or an equal number of random genomic locations were identified. The Hi-C interacting fragment was then intersected with the indirect sites and the CUT&RUN signal compared to Hi-C raw signal. Data were ranked by CUT&RUN score and plotted as a moving average with a window size of 1500. (C) ChIA-PET fragments that contained a direct site were identified and the interacting fragment intersected with direct peaks, indirect peaks or random locations as above. Interacting fragments that did not overlap with these sites were classed as uncategorized. Boxplots indicate the CUT&RUN score for the observed contacts at the interacting fragment.
Figure 9
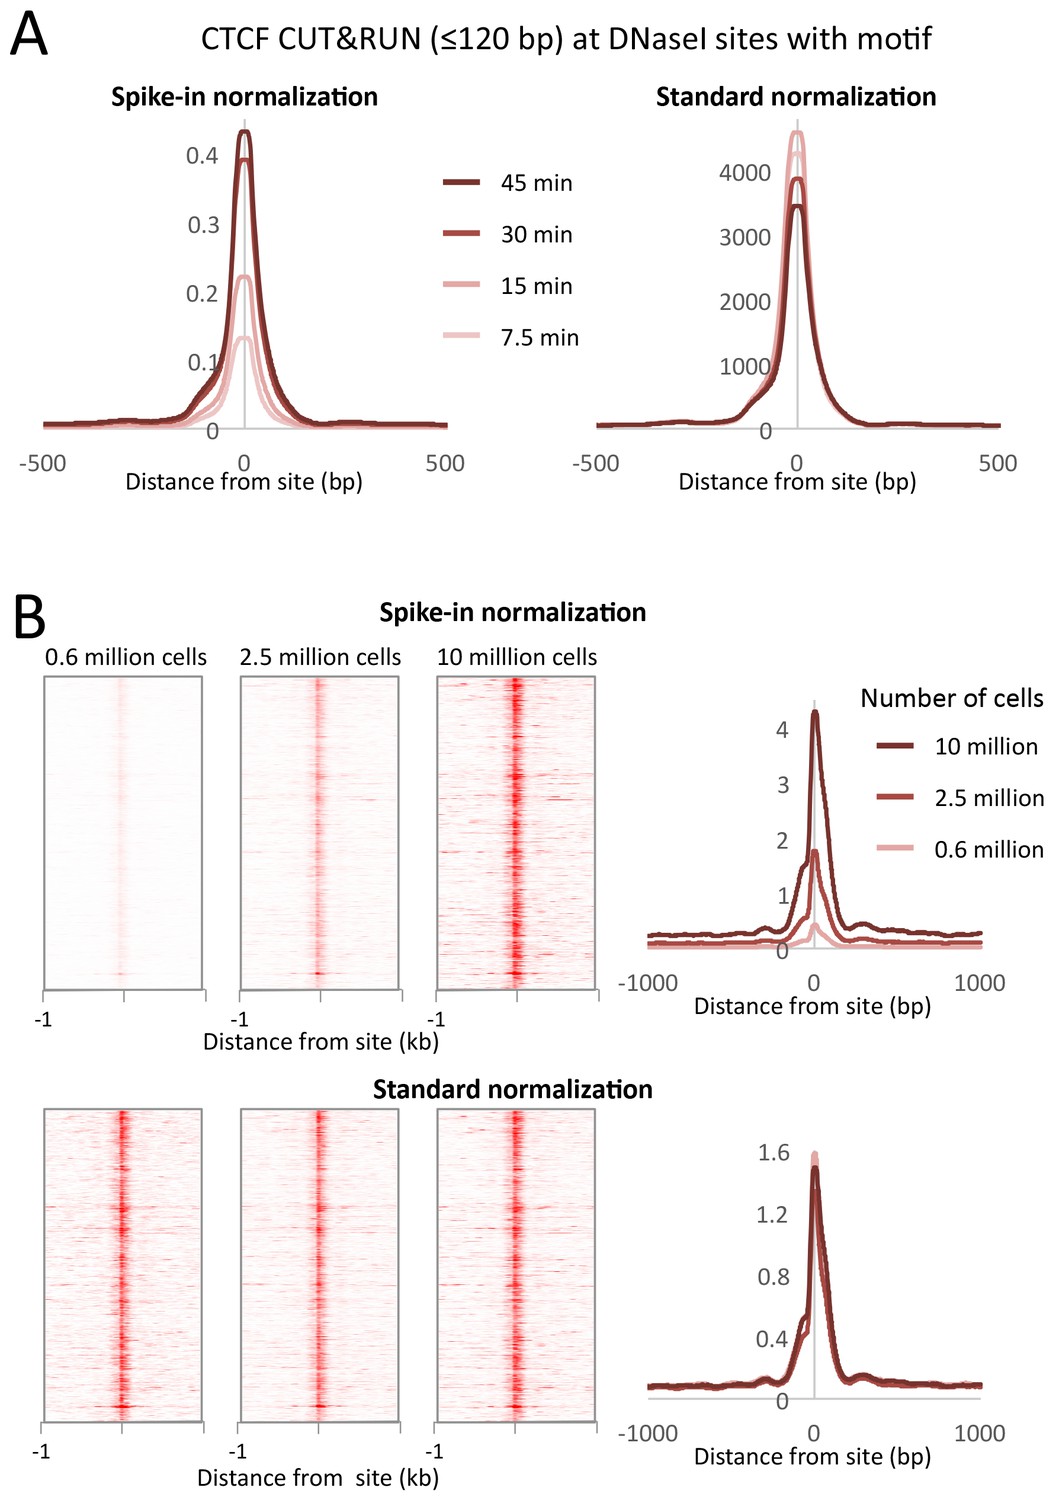
CUT&RUN allows simple quantification of protein-DNA interactions.
(A) A digestion timecourse of CUT&RUN was performed for CTCF in K562 cells. To allow quantification of released fragments, 1 ng of Drosophila DNA was added after the cleavage reaction. Mean plots of ≤120 bp sequenced fragments were centered over CTCF motifs found within DNaseI sites. Data were normalized either to the number of fly reads (Spike-in normalization) or to the total number of human reads (Standard normalization). (B) A titration of starting material was used to map CTCF binding genome-wide. Heat maps and mean plots were generated for the ≤120 bp sequenced fragments using Spike-in or Standard normalization. Data were centered over CTCF motifs found within DNaseI sites.
Download links
A two-part list of links to download the article, or parts of the article, in various formats.
Downloads (link to download the article as PDF)
Open citations (links to open the citations from this article in various online reference manager services)
Cite this article (links to download the citations from this article in formats compatible with various reference manager tools)
An efficient targeted nuclease strategy for high-resolution mapping of DNA binding sites
eLife 6:e21856.
https://doi.org/10.7554/eLife.21856


