DNA methylation directs genomic localization of Mbd2 and Mbd3 in embryonic stem cells
- University of Massachusetts Medical School, United States
Figures
Figure 1 with 2 supplements
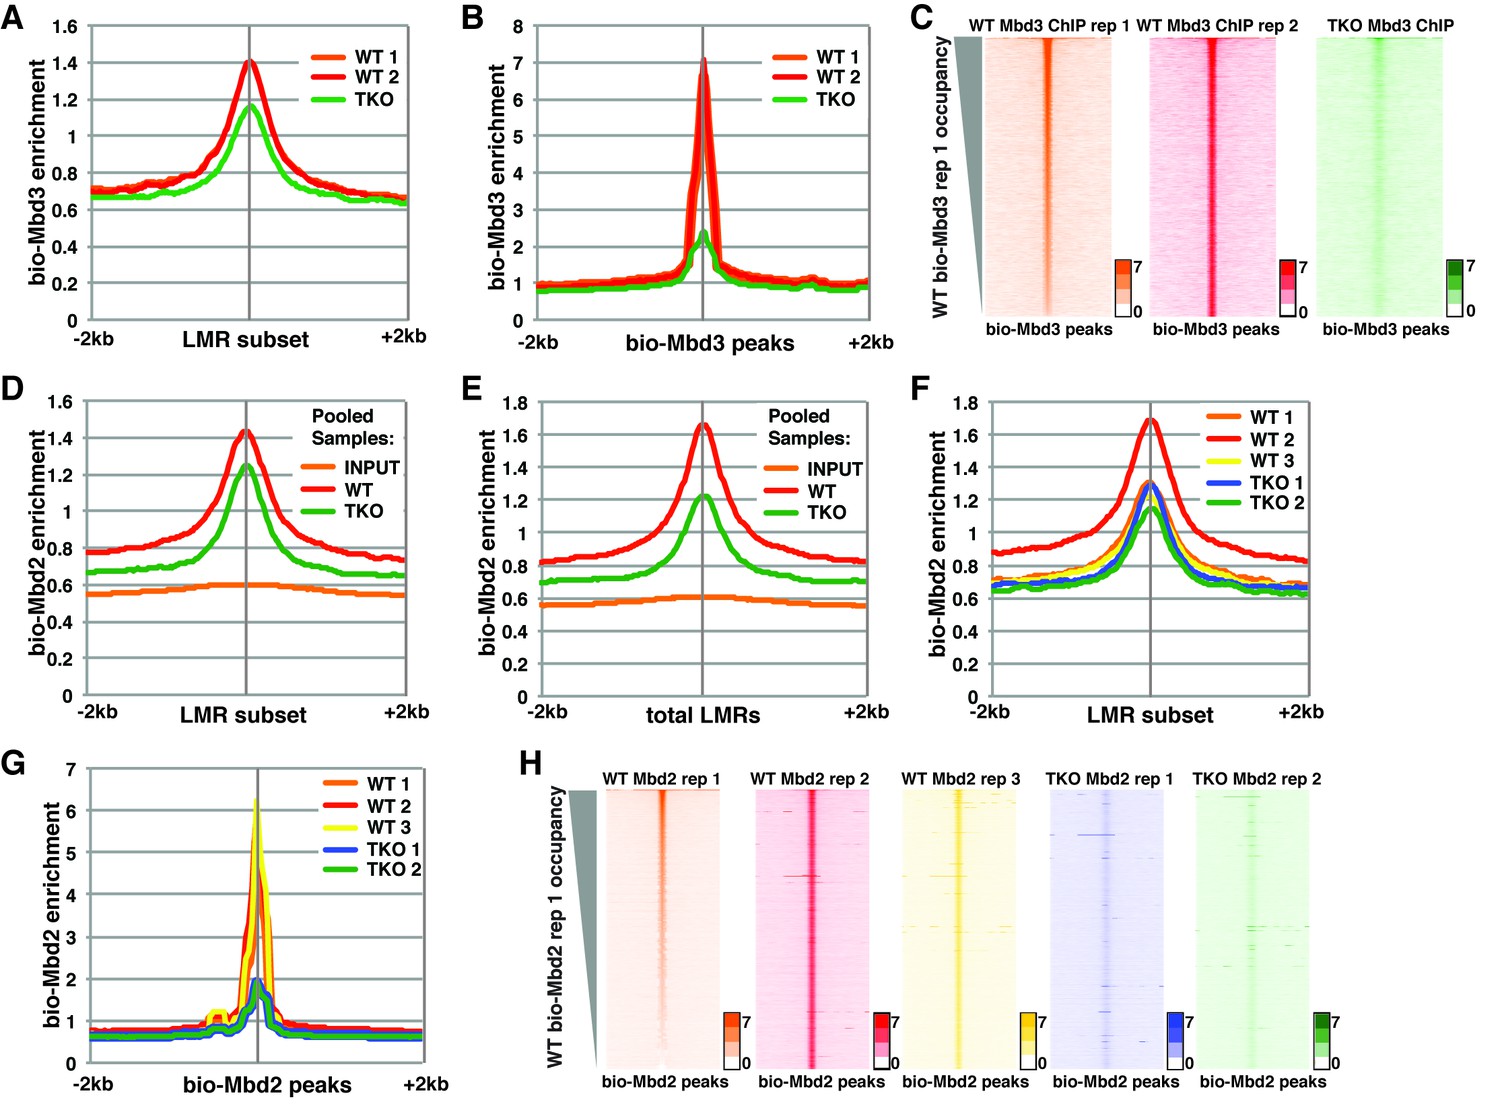
Analysis of bio-Mbd3 and bio-Mbd2 ChIP-seq datasets reveals methylation-dependent chromatin localization in ES cells.
Mbd3 and Mbd2 ChIP-seq datasets from (Baubec et al., 2013) were obtained from GEO (GSE39610; see Table 1). (A–C) Analysis of ChIP-seq data for biotin-tagged Mbd3 (bio-Mbd3) in WT or TKO cells. The two available WT replicates and one available TKO replicate were mapped over the LMR subset (adapted from Stadler et al. [2011]) ± 2 kb (A) or bio-Mbd3 peaks from WT cells ± 2 kb (B). (C) Heatmaps for bio-Mbd3 ChIP-seq in WT or TKO cells over bio-Mbd3 peaks ± 2 kb, sorted by bio-Mbd3 occupancy (high to low) in replicate 1 WT cells. (D–H) Analysis of ChIP-seq data for biotin-tagged Mbd2 (bio-Mbd2) in WT or TKO cells. (D–E) Data were analyzed as described in (Baubec et al., 2013) where replicates were pooled and mapped over LMRs that are > 150 bp and at least 3 kb away from other LMRs or unmethylated regions (LMR subset) (D) or all LMRs (E). (F–G) Biological replicates were analyzed separately and mapped over the LMR subset ± 2 kb (F) or bio-Mbd2 peaks from WT cells ± 2 kb (G). (H) Heatmaps for bio-Mbd2 ChIP-seq in WT or TKO cells over bio-Mbd2 peaks ± 2 kb, sorted by bio-Mbd2 occupancy in replicate 1 WT cells. Peaks of bio-Mbd3 and bio-Mbd2 were called as described in Supplemental Experimental Procedures.
Figure 1—figure supplement 1
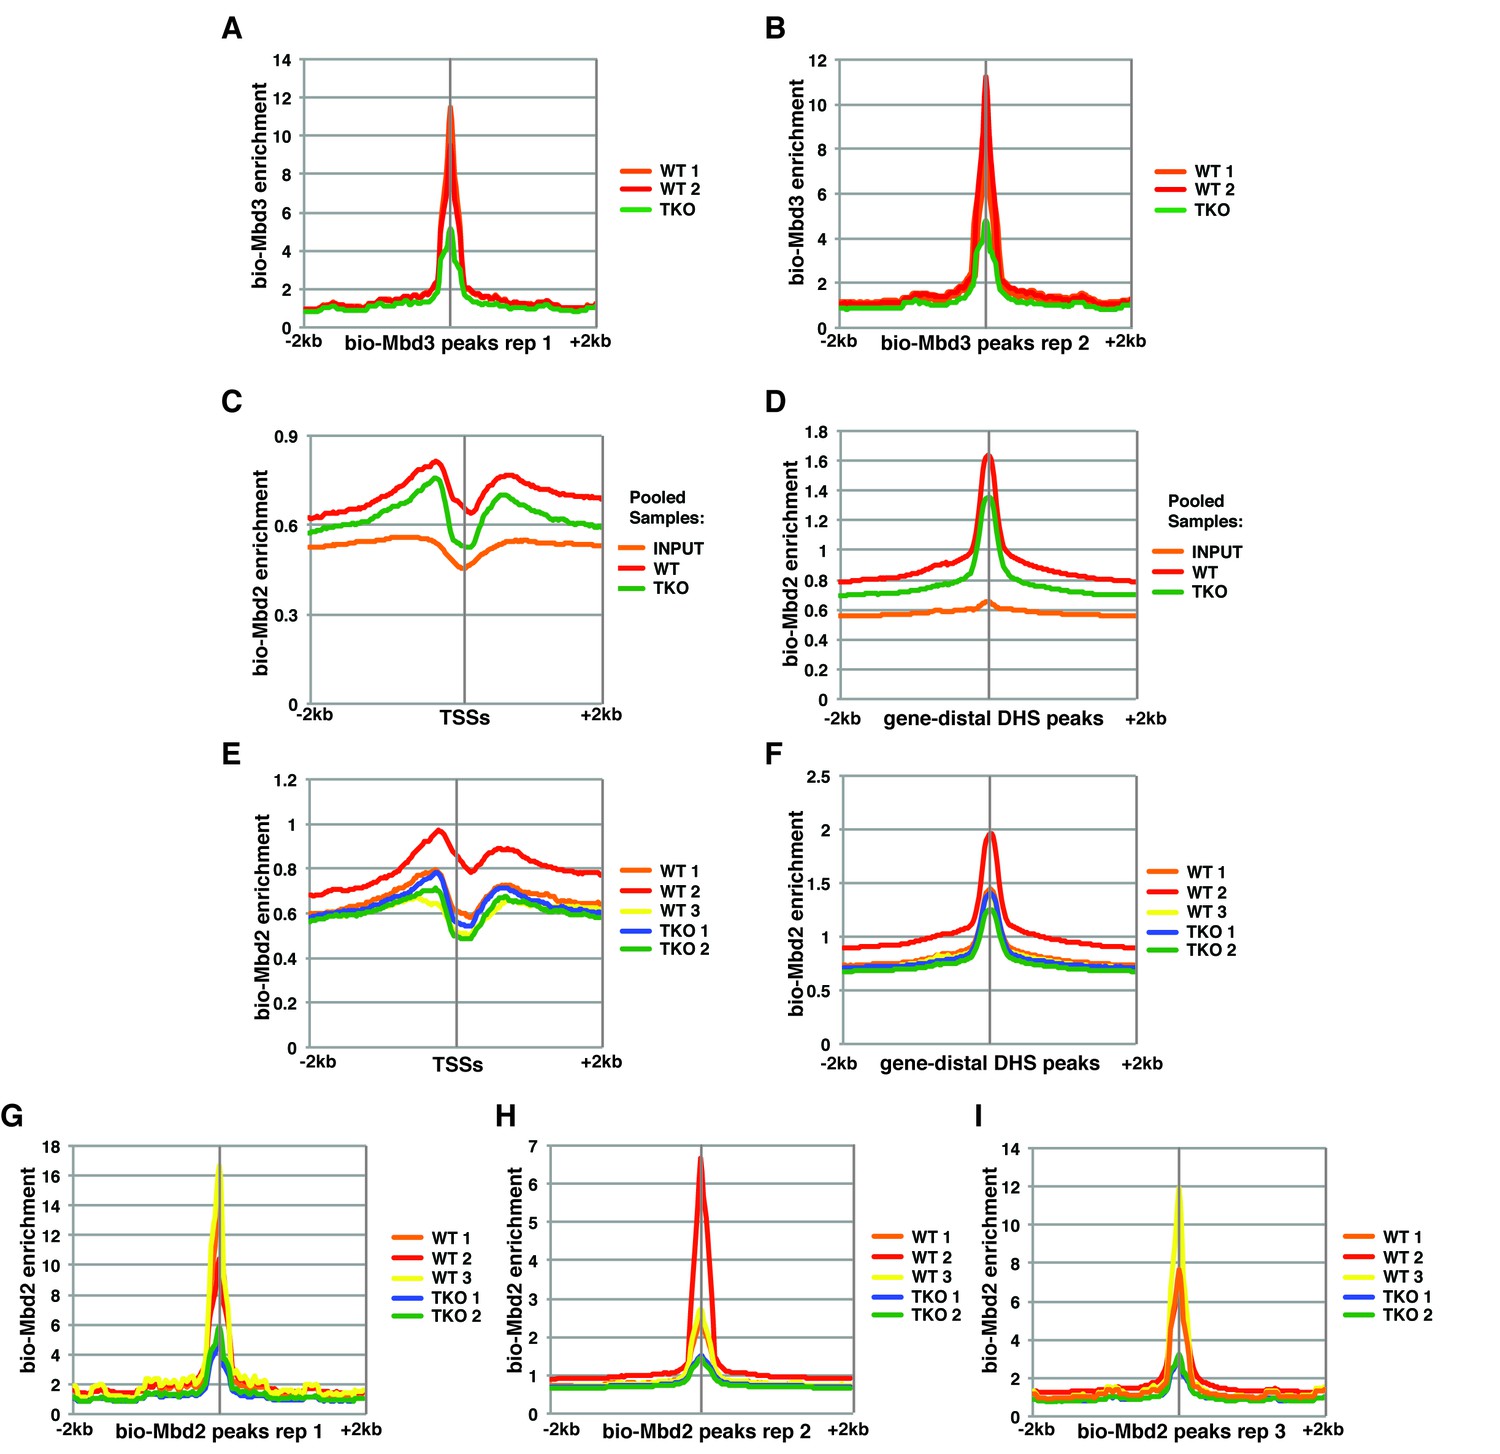
Variable bio-Mbd2 binding in WT cells over TSSs and gene-distal DHSs.
Analysis of ChIP-seq data for biotin-tagged Mbd3 (bio-Mbd3) or Mbd2 (bio-Mbd2) in WT or TKO cells. (A–B) Peaks were called from bio-Mbd3 ChIP in WT cells from replicate 1 (A) or replicate 2 (B) and aggregate bio-Mbd3 ChIP-seq enrichments from individual WT or TKO replicates were mapped over these peaks. (C–D) Data were analyzed as described in (Baubec et al., 2013) where bio-Mbd2 replicates were pooled and mapped over TSSs (C) or gene-distal DHSs (D) ± 2 kb. (E–F) Biological replicates of bio-Mbd2 were analyzed separately and mapped over TSSs (E) or gene-distal DHSs (F) ± 2 kb. (G–I) Peaks were called from bio-Mbd2 ChIP in WT cells from replicate 1 (G), replicate 2 (H), or replicate 3 (I) and bio-Mbd2 ChIP-seq data from all WT or TKO replicates were mapped over these peaks.
Figure 1—figure supplement 2
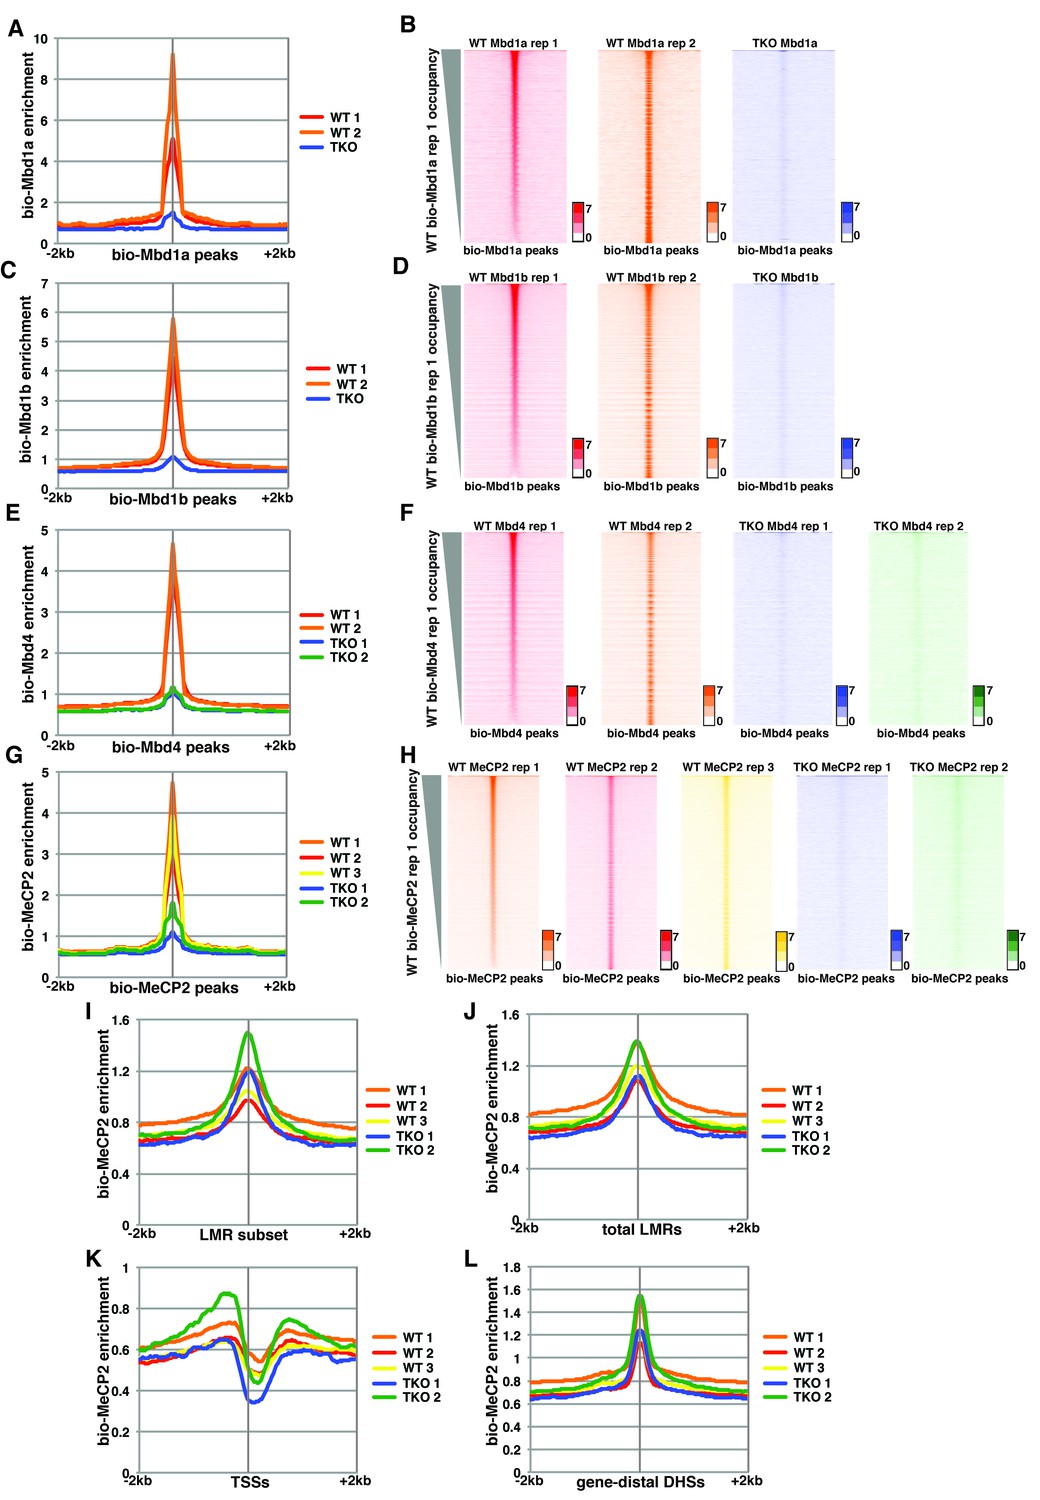
Variable bio-Mbd1 and bio-MeCP2 binding in WT cells.
Analysis of ChIP-seq data for biotin-tagged Mbd1a (bio-Mbd1a), Mbd1b (bio-Mbd1b), Mbd4 (bio-Mbd4), or MeCP2 (bio-MeCP2) in WT or TKO cells. (A–B) Analysis of ChIP-seq data for bio-Mbd1a in WT or TKO cells. The two available WT replicates and one available TKO replicate were mapped over bio-Mbd1a peaks from WT cells ± 2 kb (A). (B) Heatmaps for bio-Mbd1a ChIP-seq in WT or TKO cells over bio-Mbd1a peaks ± 2 kb, sorted by bio-Mbd1a occupancy (high to low) in replicate 1 WT cells. (C–D) Analysis of ChIP-seq data for bio-Mbd1b in WT or TKO cells with the two available WT replicates and two available TKO replicates were mapped over bio-Mbd1b peaks from WT cells ± 2 kb as in (A–B). (E–F) Analysis of ChIP-seq data for bio-Mbd4 in WT or TKO cells with the two available WT replicates and two available TKO replicates were mapped over bio-Mbd4 peaks from WT cells ± 2 kb as in (A–B). (G–H) Analysis of ChIP-seq data for bio-MeCP2 in WT or TKO cells with the two available WT replicates and two available TKO replicates were mapped over bio-MeCP2 peaks from WT cells ± 2 kb as in (A–B). (I–L) Analysis of ChIP-seq data for bio-MeCP2 in WT or TKO cells over the LMR subset (I) total LMRs (J), TSSs (K), or gene-distal DHSs (L) ± 2 kb.
Figure 2 with 4 supplements
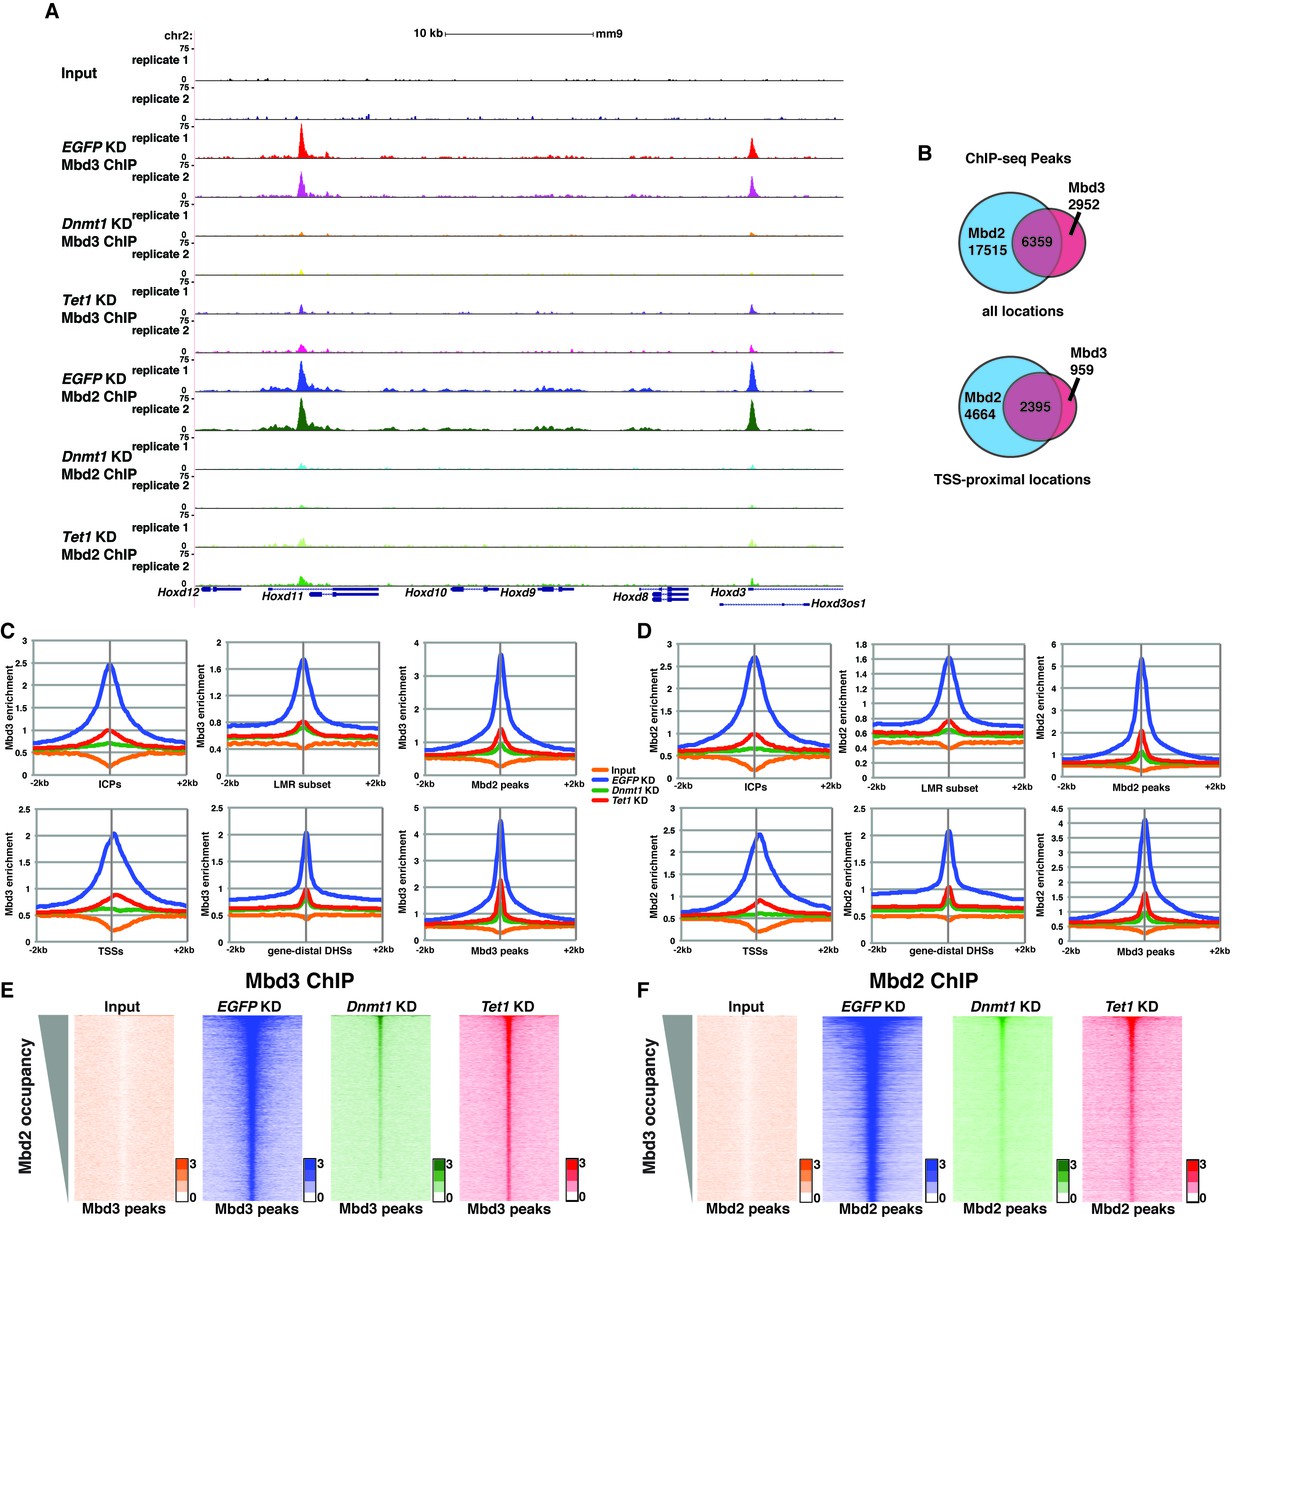
Dnmt1 and Tet1 are required for Mbd3 and Mbd2 binding in ES cells.
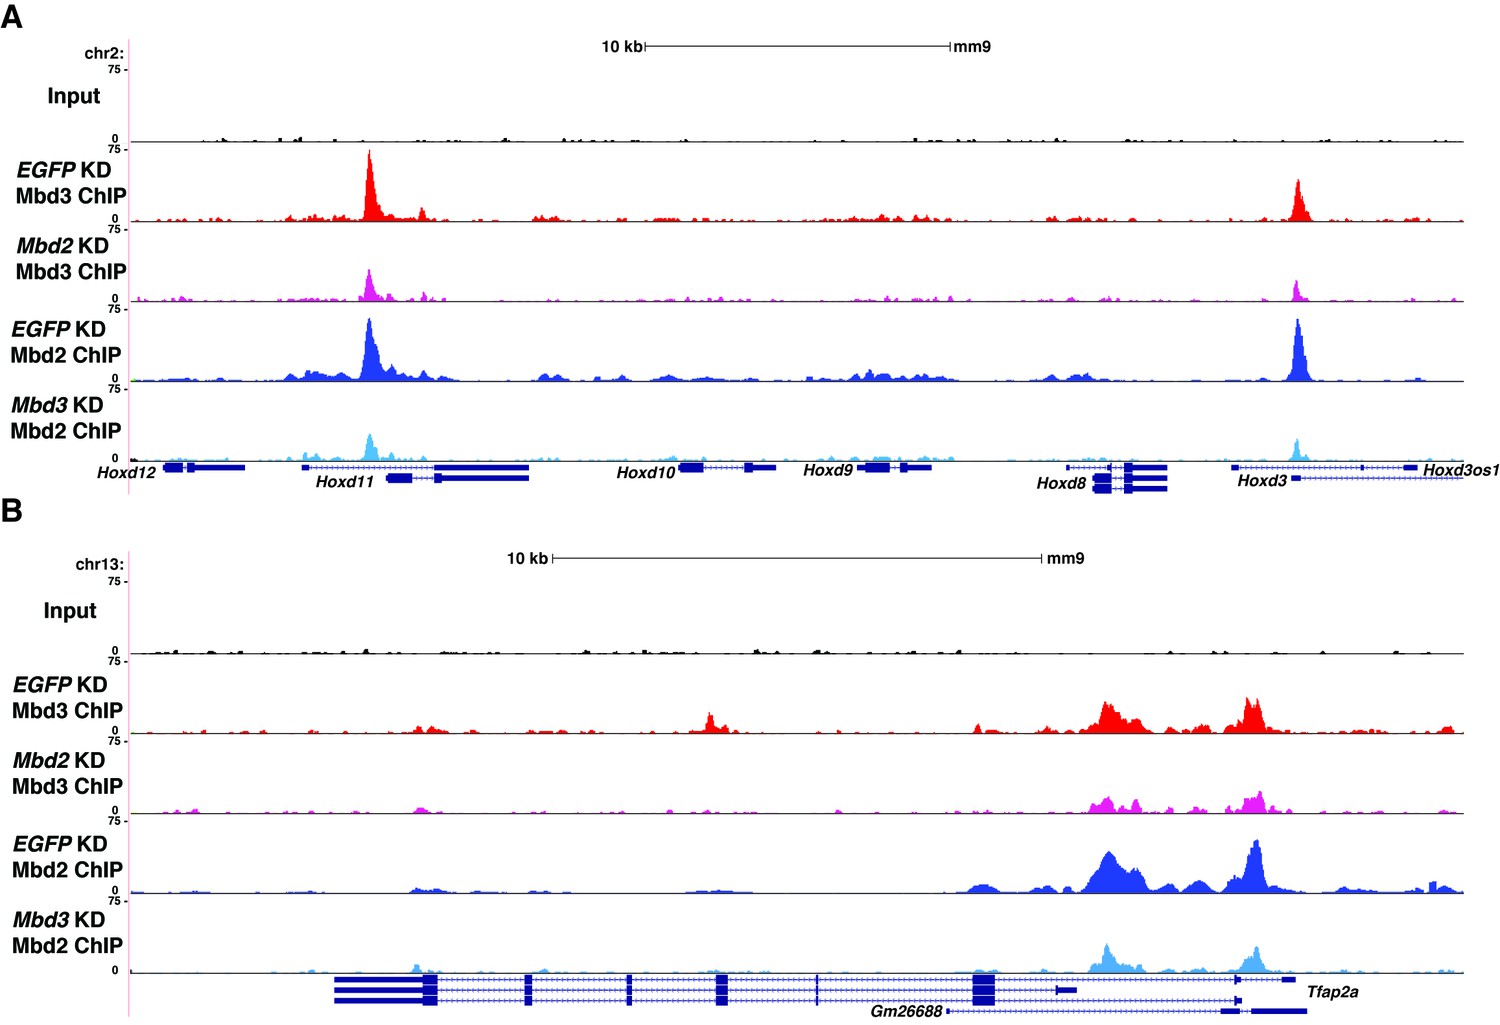
(A) Genome browser tracks of replicate ChIP-seq experiments examining endogenous Mbd3 or Mbd2 occupancy in control (EGFP KD), Dnmt1 KD, and Tet1 KD ES cells over indicated loci (Hoxd cluster). (B) Overlap of Mbd3 and Mbd2 binding. Shown are Venn diagrams delineating the overlap between all genomic locations (top panel) or TSS-proximal locations (−1 kb to +100 bp; bottom panel) bound by Mbd3 and Mbd2. (C–D) Aggregation plots of Mbd3 (C) or Mbd2 (D) ChIP-seq data showing occupancy over ICPs (top left panel, from [Weber et al., 2007]), annotated TSSs (bottom left panel), the LMR subset (top middle panel, from [Stadler et al., 2011]), gene-distal DHSs (bottom middle panel, from GSM1014154 with TSSs removed) Mbd2 peaks (top right panel, called from EGFP KD ChIP-seq experiments), and Mbd3 peaks (bottom right panel, called from EGFP KD ChIP-seq experiments) ± 2 kb in control (EGFP KD), Dnmt1 KD, or Tet1 KD ES cells. (E–F) Heatmaps of Mbd3 enrichment over Mbd3 binding sites sorted by Mbd2 occupancy (E) and Mbd2 enrichment over Mbd2 binding sites sorted by Mbd3 occupancy (F) in control (EGFP KD), Dnmt1 KD, or Tet1 KD ES cells. The profiles shown in aggregation plots and heatmaps represent the average of two biological replicates.
Figure 2—figure supplement 1
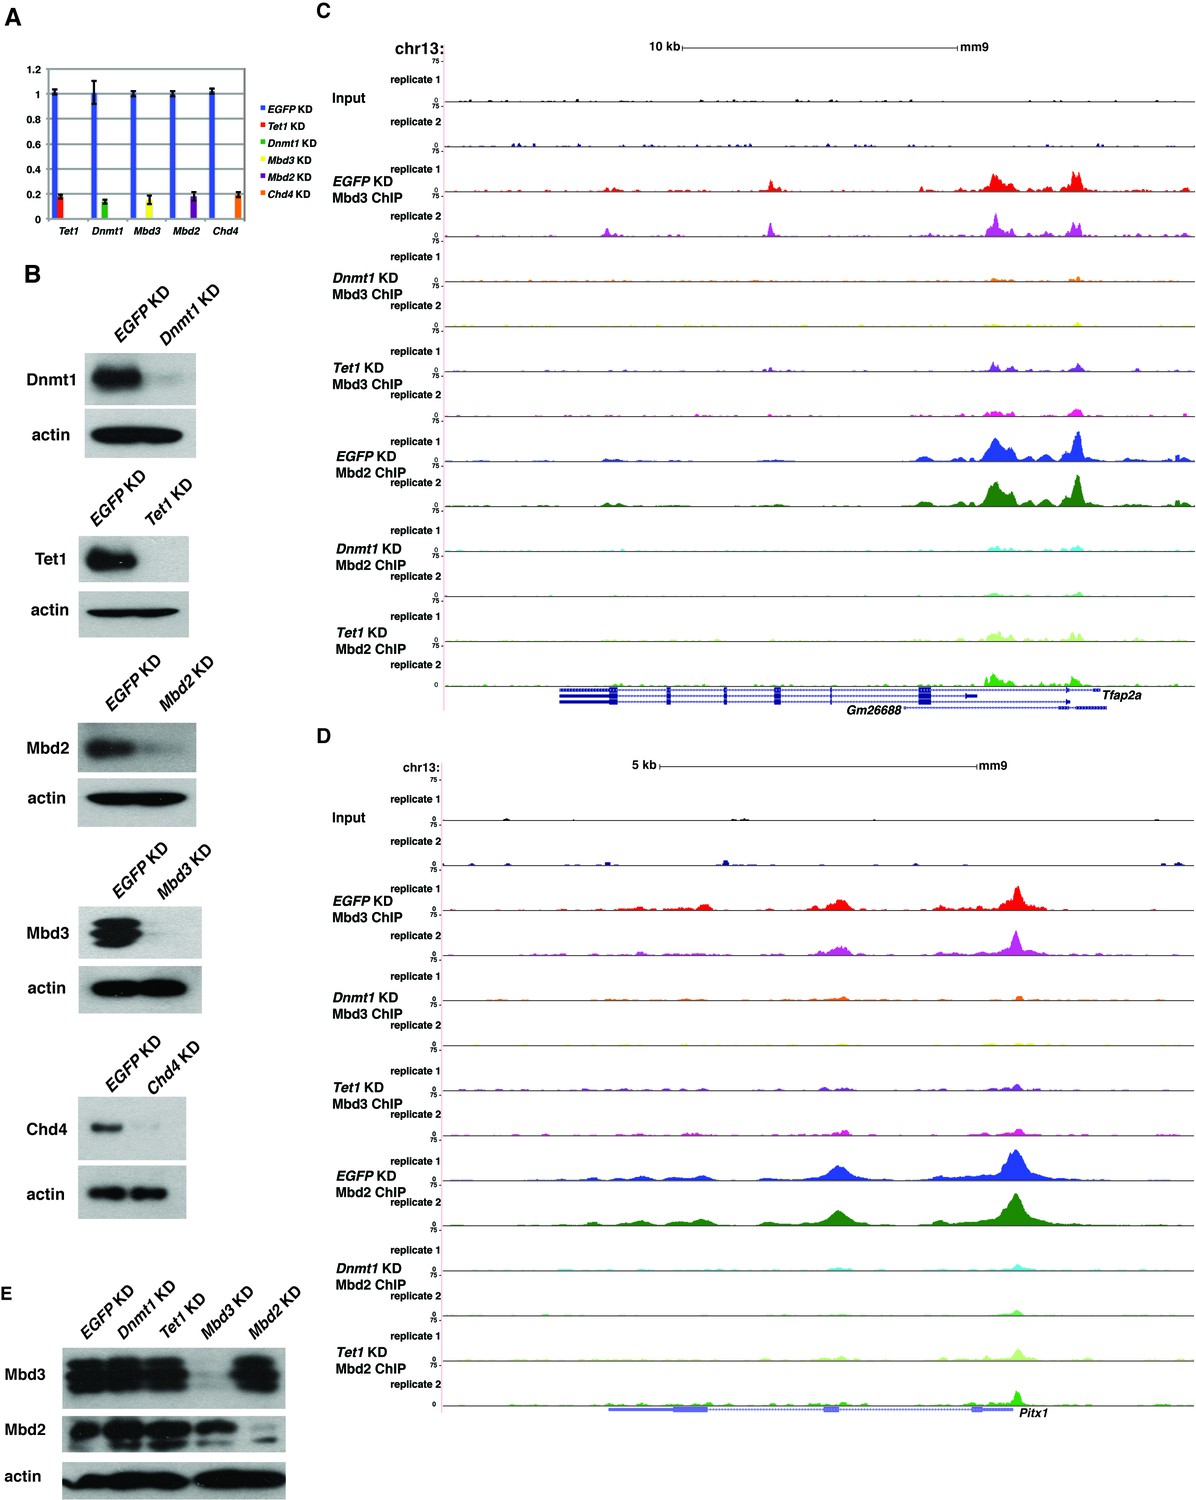
Loss of Dnmt1 and Tet1 results in reduced occupancy of both Mbd3 and Mbd2 in ES cells.
(A) Efficient KD of Dnmt1, Tet1, Mbd3, Mbd2, and Chd4 is confirmed by RT-qPCR with expression levels normalized to GAPDH and shown relative to control (EGFP) KD. Shown are the mean ± SD values of three biological replicates after acute (48 hr) KD. (B) Efficient KD of Dnmt1, Tet1, Mbd3, Mbd2, and Chd4 was confirmed by Western blotting, where β-actin serves as a loading control. (C–D) Genome browser tracks of replicate ChIP-seq experiments examining Mbd3 or Mbd2 occupancy in control (EGFP KD), Dnmt1 KD, and Tet1 KD ES cells over two example loci (Tfap2a (C) and Pitx1 (D)) show reduced occupancy of Mbd2 and Mbd3 in Dnmt1 KD and Tet1 KD cells over the promoter-proximal regions of each gene. (E) Western blotting of Mbd3 and Mbd2, where β-actin serves as a loading control, in control (EGFP KD), Dnmt1 KD, Tet1 KD, Mbd3 KD, and Mbd2 KD ES cells demonstrates that levels of Mbd3 and Mbd2 are only altered upon KD of Mbd3 or Mbd2, respectively.
Figure 2—figure supplement 2
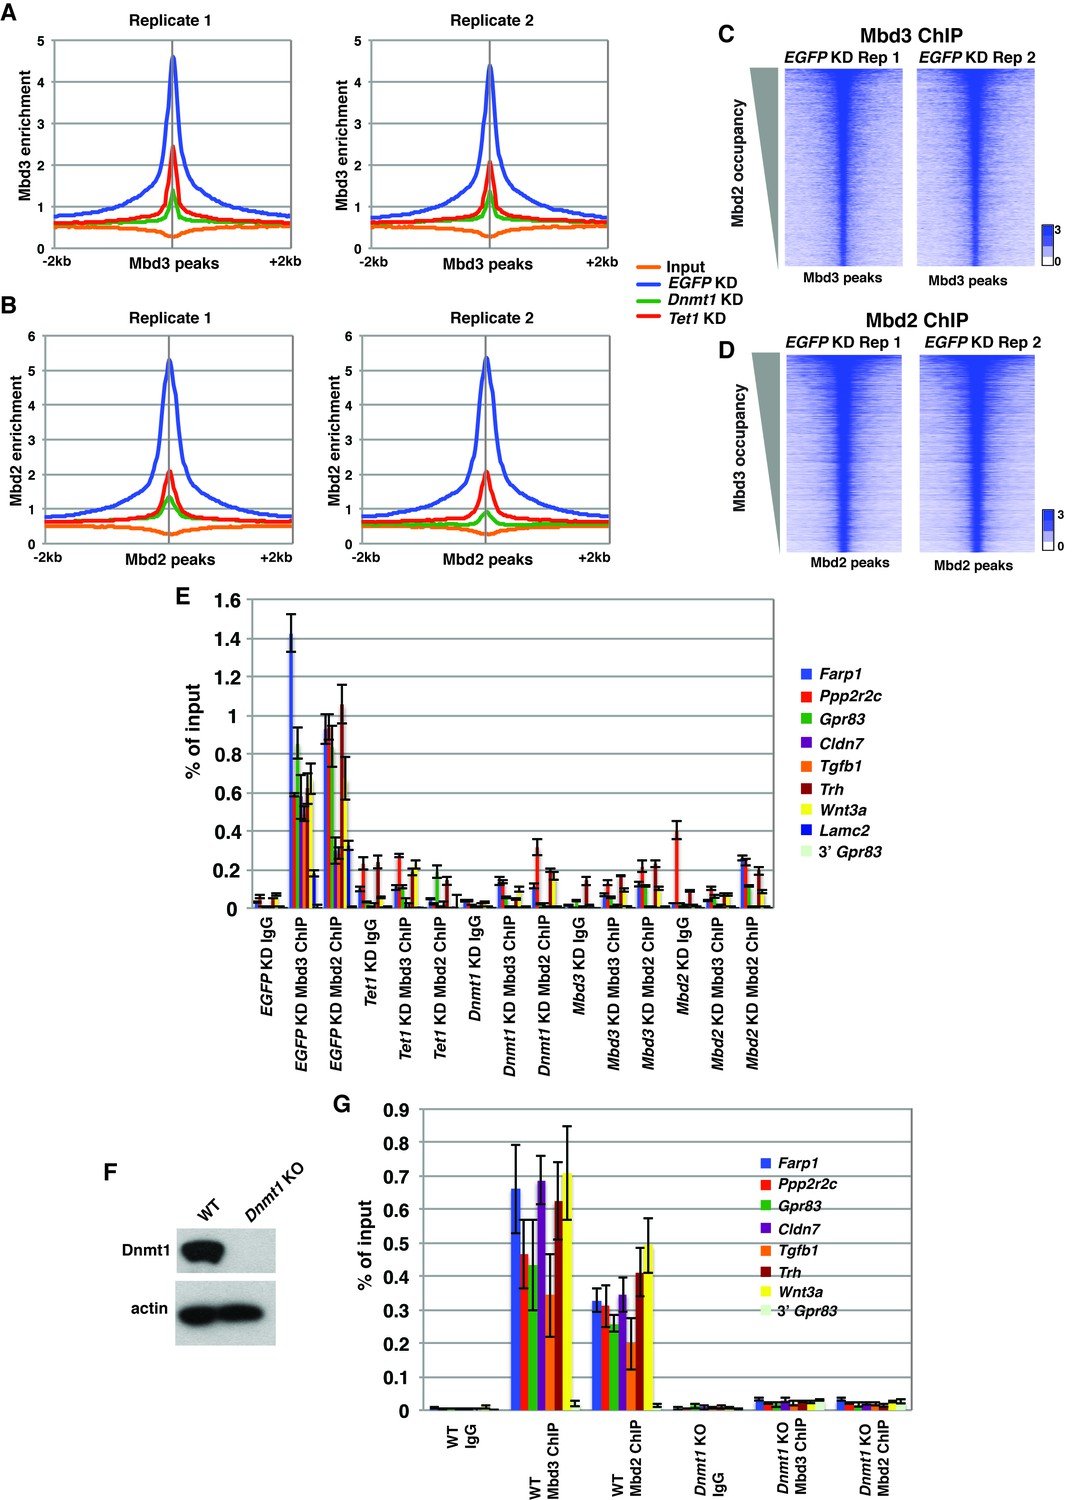
Validation of endogenous Mbd3 and Mbd2 ChIP-seq experiments.
(A–B) Biological replicates of Mbd3 (A) and Mbd2 (B) ChIP-seq experiments demonstrate similar results. Shown are aggregation plots of Mbd3 (A) or Mbd2 (B) ChIP-seq datasets over Mbd3 peaks (A) or Mbd2 peaks (B) ± 2 kb in control (EGFP) KD, Tet1 KD, and Dnmt1 KD ES cells. (C–D) Heatmaps of biological replicates of Mbd3 (C) and Mbd2 (D) ChIP-seq experiments demonstrate similar results when compared gene-by-gene. Shown are heatmaps of Mbd3 (C) or Mbd2 (D) ChIP-seq dataset over Mbd3 peaks ranked by Mbd2 occupancy (C) or Mbd2 peaks ranked by Mbd3 occupancy (D) ± 2 kb. (E) Validation of changes in occupancy of Mbd3 and Mbd2. ChIP-qPCR was performed on Mbd3 or Mbd2 in control (EGFP) KD, Tet1 KD, Dnmt1 KD, Mbd3 KD, and Mbd2 KD ES cells. Mbd3 or Mbd2 levels are expressed as a fraction of input. Shown are the mean ± SD values of three biological replicates. (F) Western blot showing loss of Dnmt1 protein expression in Dnmt1 KO ES cells. β-actin serves as a loading control. (G) Validation of changes in occupancy of Mbd3 and Mbd2 in Dnmt1 KO cells. ChIP-qPCR was performed as indicated in control (WT) and Dnmt1 KO ES cells.
Figure 2—figure supplement 3
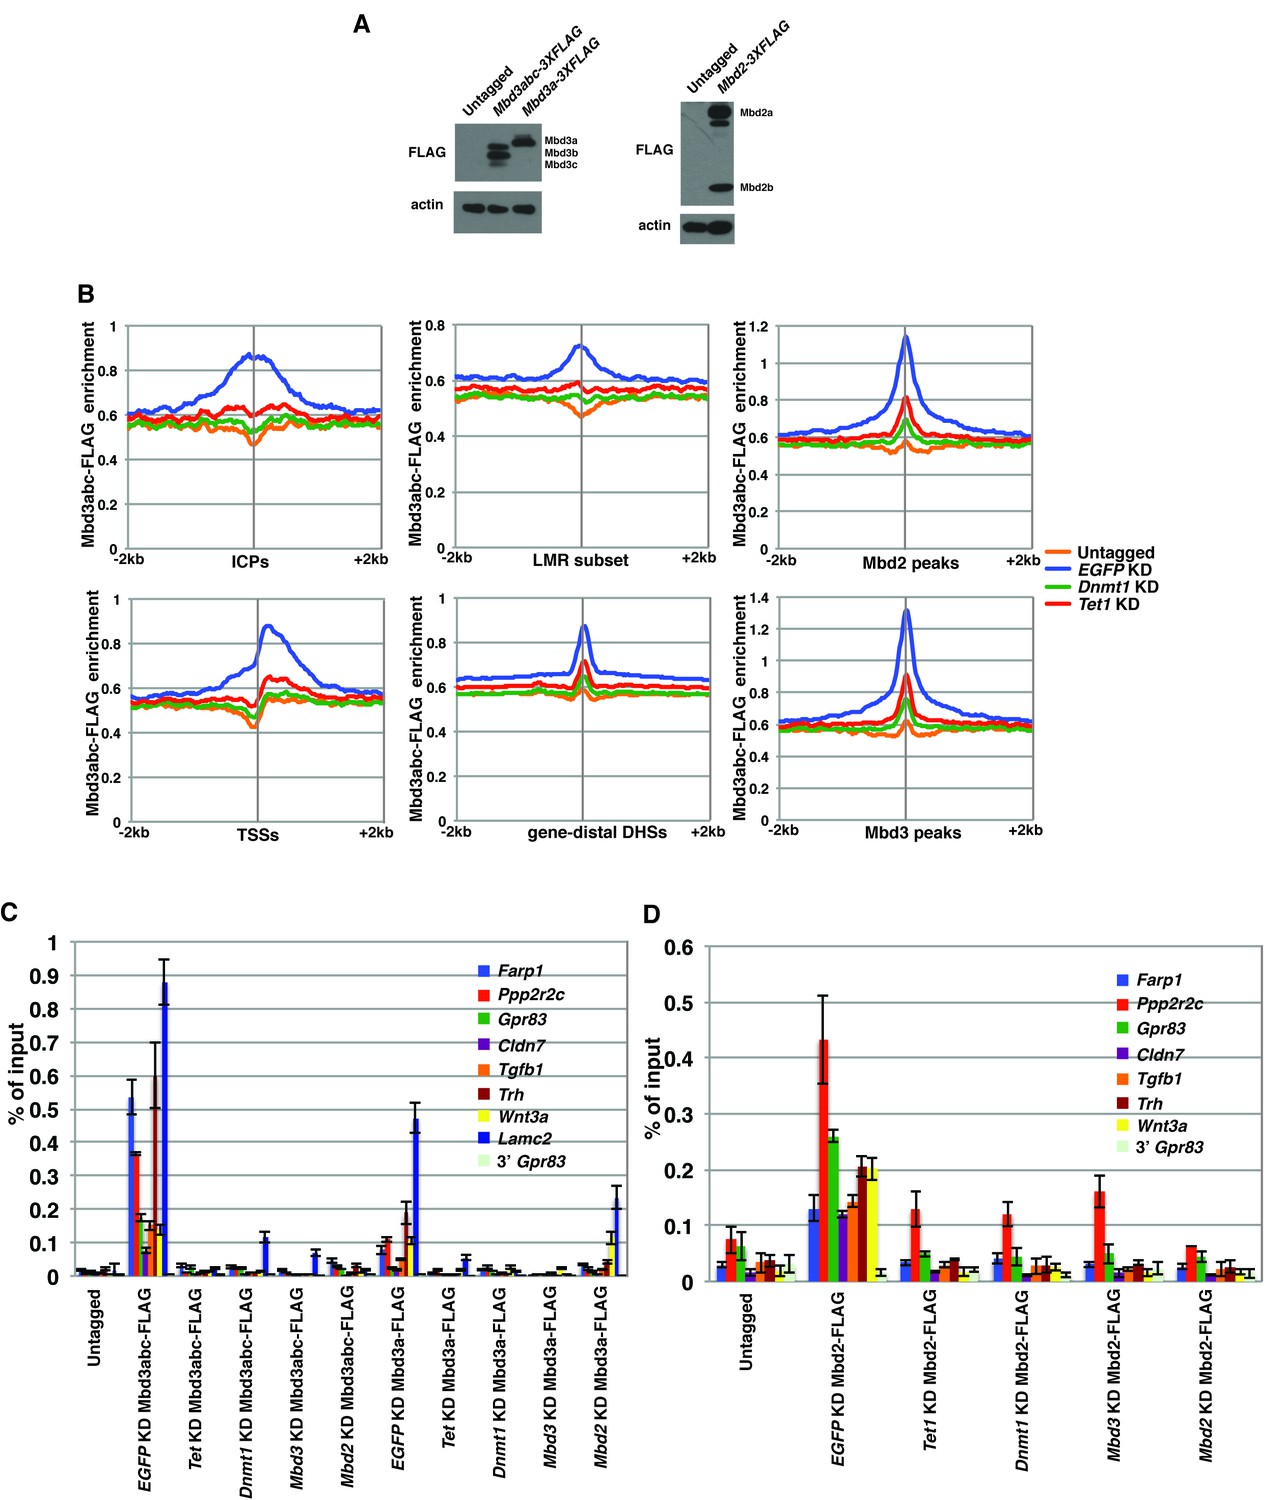
FLAG ChIPs confirm Dnmt1 and Tet1 are required for Mbd3 and Mbd2 occupancies.
(A) Western blots showing expression in Mbd3abc-3XFLAG, Mbd3a-3XFLAG, and Mbd2-3XFLAG ES cell lines. β-actin serves as a loading control. (B) Aggregation plots of Mbd3abc-3XFLAG ChIP-seq over ICPs (top left panel), annotated TSSs (bottom left panel), the LMR subset (top middle panel), gene-distal DHSs (bottom middle panel) Mbd2 peaks (top right panel), and Mbd3 peaks (bottom right panel) ± 2 kb in Untagged, EGFP KD, Dnmt1 KD, and Tet1 KD ES cells. (C) Validation of changes in occupancy of Mbd3. ChIP-qPCR was performed on Mbd3a-3XFLAG and Mbd3abc-3XFLAG in Untagged, EGFP KD, Tet1 KD, Dnmt1 KD, Mbd3 KD, and Mbd2 KD ES cells. FLAG levels are expressed as a fraction of input. Shown are the mean ± SD values of three biological replicates. (D) Validation of changes in occupancy of Mbd2. ChIP-qPCR was performed on Mbd2-3XFLAG in control (EGFP) KD, Tet1 KD, Dnmt1 KD, Mbd3 KD, and Mbd2 KD ES cells. Shown as in (C).
Figure 2—figure supplement 4
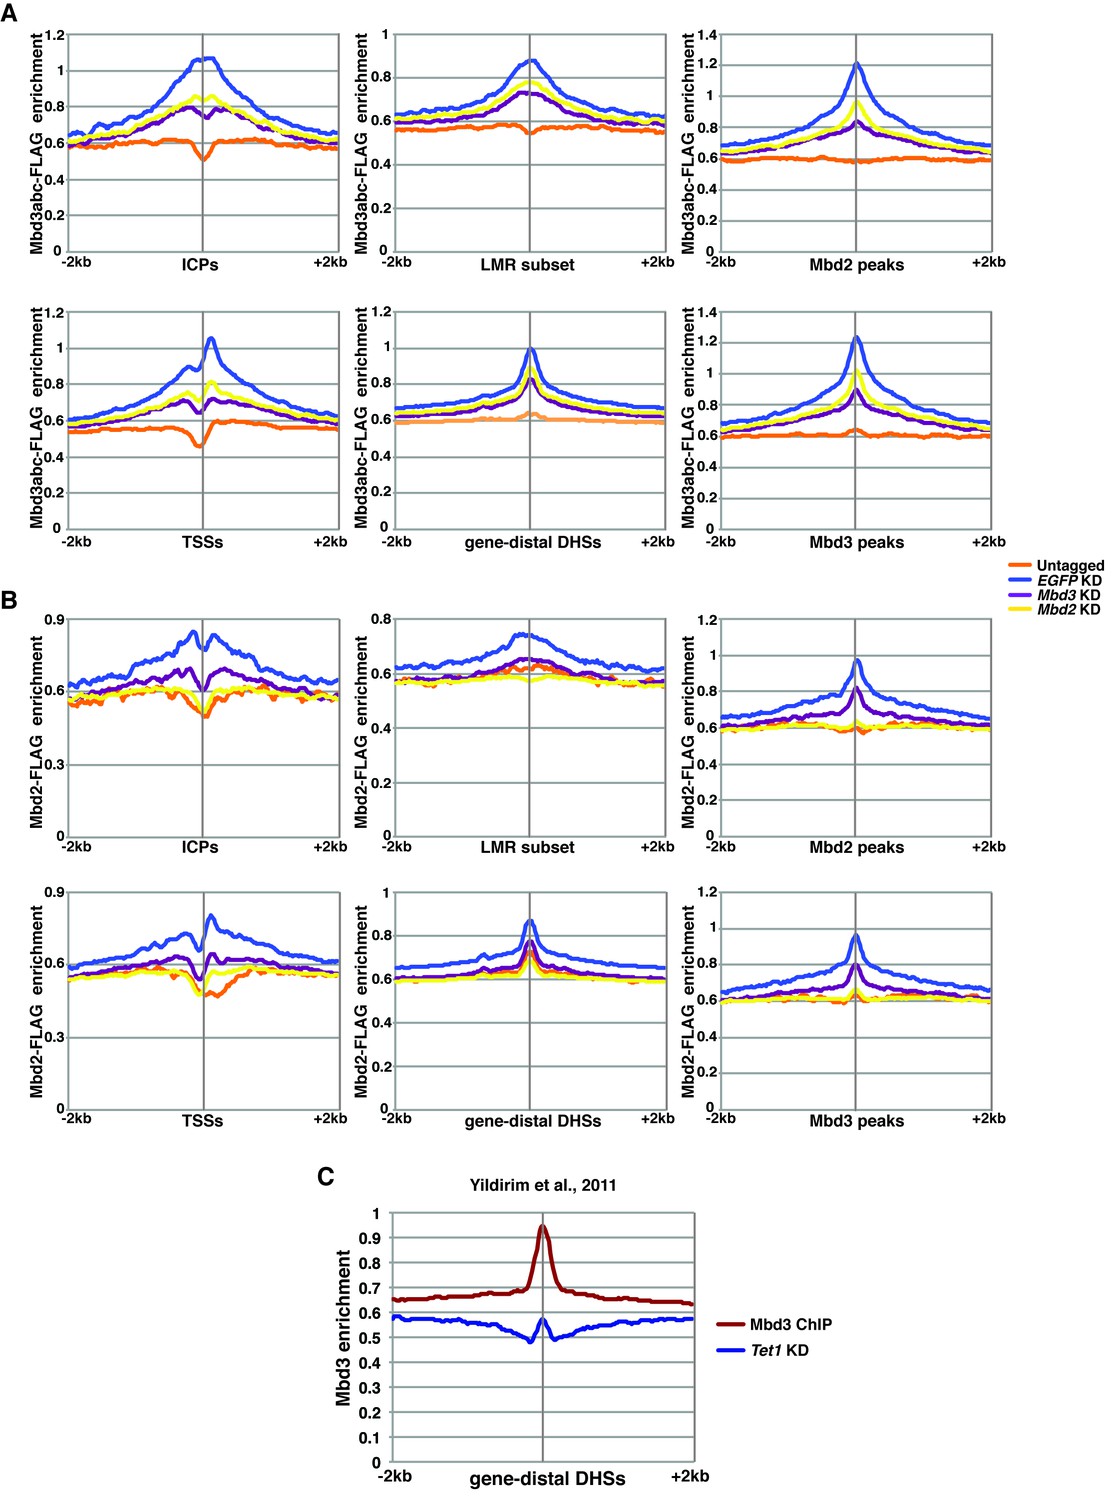
ChIP-seq experiments using MBD-FLAG fusions.
(A–B) Aggregation plots of Mbd3abc-3XFLAG (A) or Mbd2-3XFLAG (B) ChIP-seq over ICPs (top left panel), annotated TSSs (bottom left panel), the LMR subset (top middle panel), gene-distal DHSs (bottom middle panel), Mbd2 peaks (top right panel), and Mbd3 peaks (bottom right panel) ± 2 kb in Untagged, EGFP KD, Mbd3 KD, and Mbd2 KD ES cells. (C) Aggregation plot of Mbd3 ChIP-seq from (Yildirim et al., 2011) over gene-distal DHSs.
Figure 3 with 1 supplement
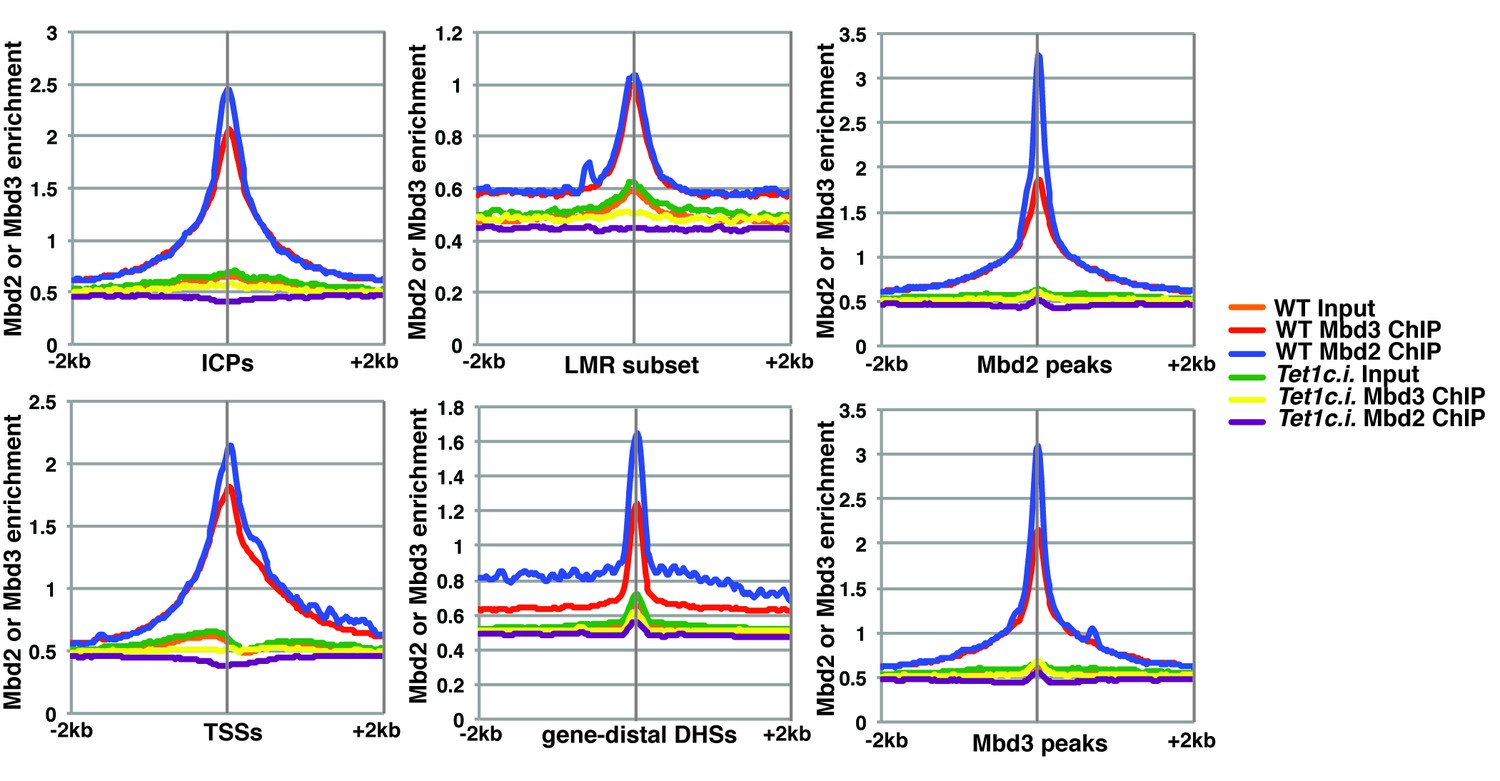
The catalytic activity of Tet1 is required for occupancy of Mbd3 and Mbd2 in ES cells.
Aggregation plots of Mbd3 or Mbd2 ChIP-seq showing association over ICPs (top left panel), annotated TSSs (bottom left panel), the LMR subset (top middle panel), gene-distal DHSs (bottom middle panel), Mbd2 peaks (top right panel), and Mbd3 peaks (bottom right panel) ± 2 kb in wild-type (WT) and Tet1 catalytically inactive (Tet1c.i.) ES cells. Aggregation plots represent the average of two biological replicates.
Figure 3—figure supplement 1
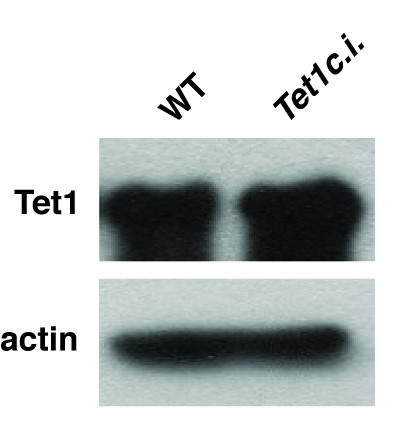
Catalytic mutation in Tet1 does not alter total protein levels.
Western blot showing expression of Tet1 in Tet1c.i. ES cell line. β-actin serves as a loading control.
Figure 4 with 1 supplement

Dnmt1, Mbd3, and Mbd2 are required for 5mC and 5hmC in ES cells.
(A–B) Aggregation plots of 5mC (A) or 5hmC (B) enrichment over ICPs (top left panel), annotated TSSs (bottom left panel), the LMR subset (top middle panel), gene-distal DHSs (bottom middle panel) Mbd2 peaks (top right panel), and Mbd3 peaks (bottom right panel) ± 2 kb in control (EGFP KD), Dnmt1 KD, Mbd3 KD, or Mbd2 KD ES cells. Aggregation plots represent the average of two biological replicates. (C–D) Dot blot of bulk 5mC (C) and 5hmC (D) levels in EGFP KD, Dnmt1 KD, Mbd3 KD, or Mbd2 KD ES cells. Left panel shows 5mC or 5hmC levels and right panel shows methylene blue staining, which serves as a loading control. (E) Thin layer chromatography separation of radioactively end-labeled bases from MspI digested genomic DNA. Quantification of 5mC or 5hmC is expressed relative to T in each KD. Levels in EGFP KD are set to 100%. (F) Restriction enzyme digest of genomic DNA from EGFP KD, Dnmt1 KD, Mbd3 KD, or Mbd2 KD ES cells using an enzyme blocked by CpG methylation/hydroxymethylation (HpaII) or a CpG methylation insensitive enzyme (MspI) that cuts the same site (CCGG).
Figure 4—figure supplement 1
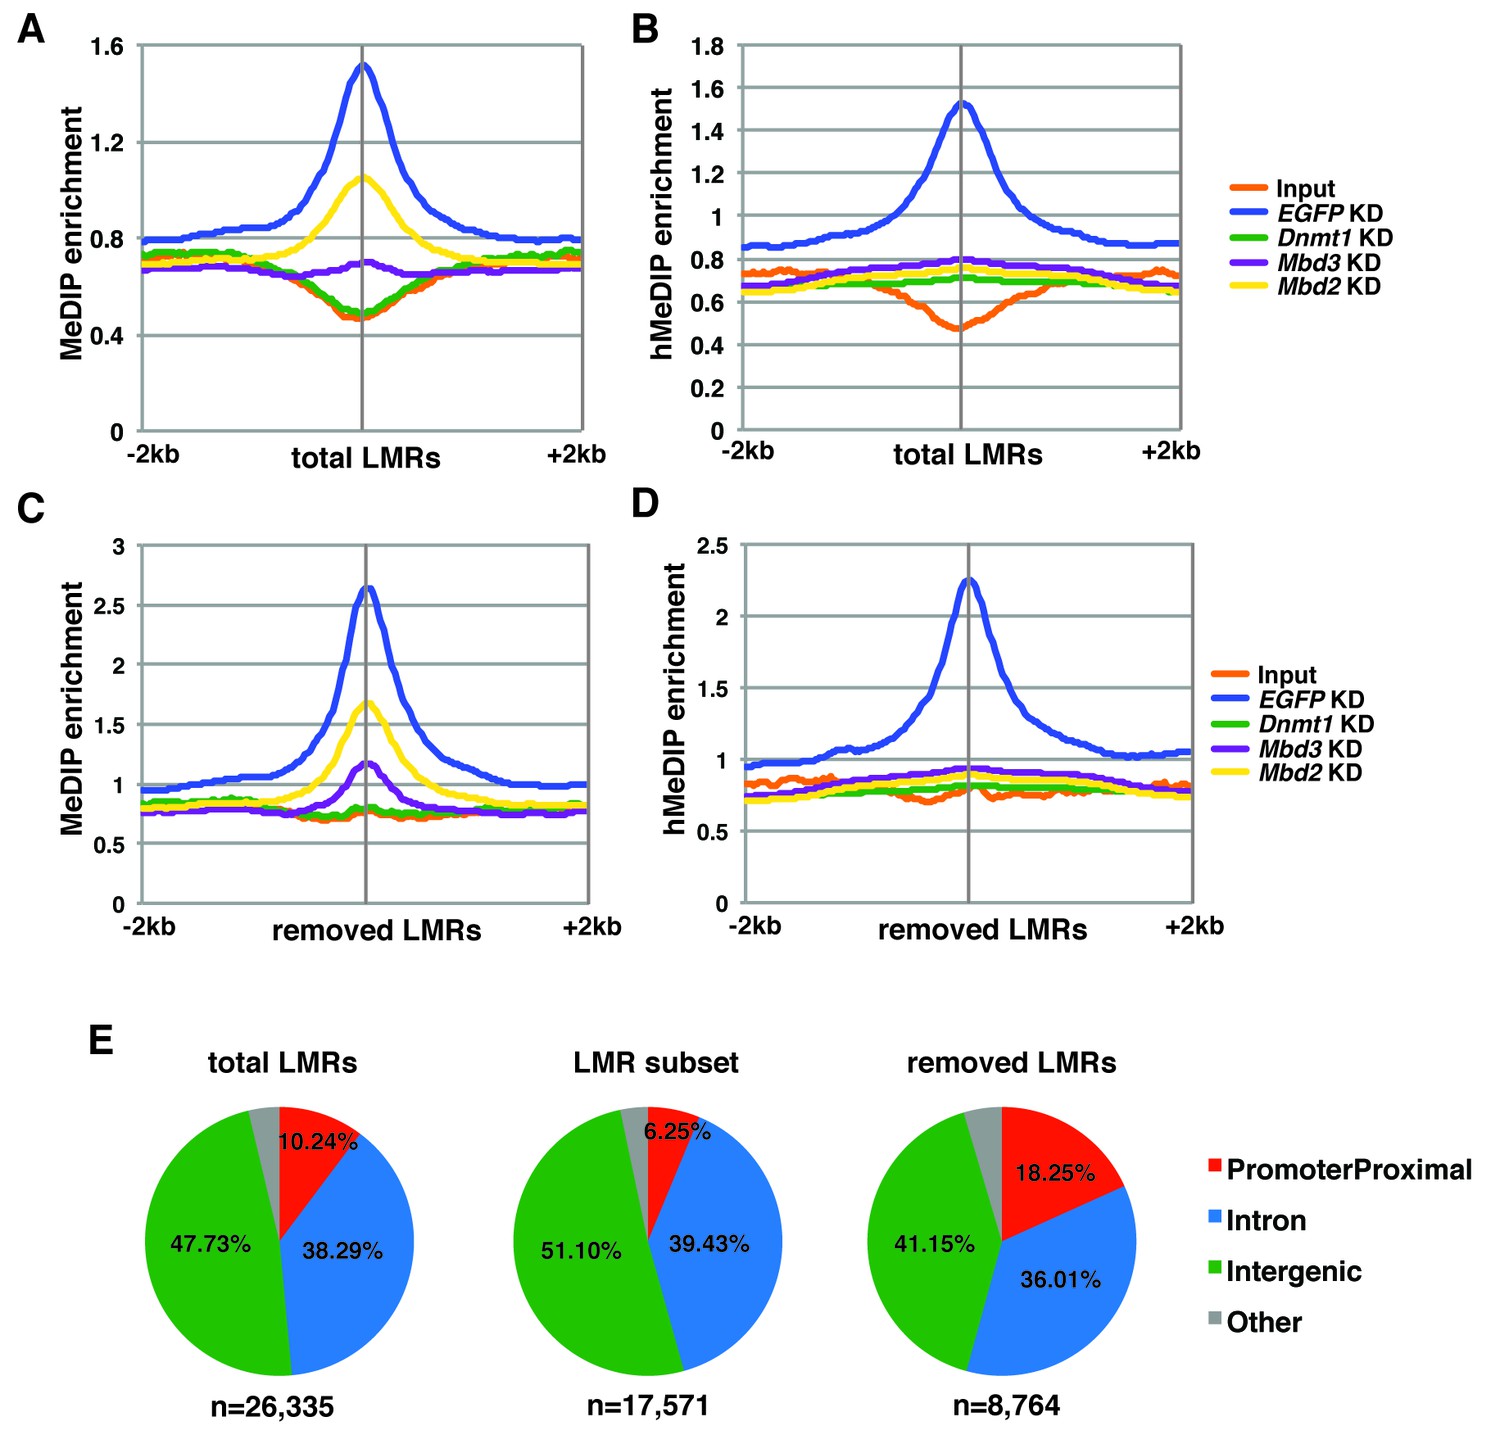
5mC and 5hmC levels over total and removed LMRs.
(A–B) Aggregation plots of 5mC (A) or 5hmC (B) enrichment over total LMRs ± 2 kb in control (EGFP) KD, Dnmt1 KD, Mbd3 KD, and Mbd2 KD ES cells. (C–D) Aggregation plots of 5mC (C) or 5hmC (D) enrichment over removed LMRs ± 2 kb in control (EGFP) KD, Dnmt1 KD, Mbd3 KD, and Mbd2 KD ES cells. (E) Pie charts showing the genomic locations of LMRs in all LMRs defined by Stadler et al. (total LMRs), the subset of LMRs taken by Baubec et al. (LMR subset) and the remaining LMRs which were removed by this subset (removed LMRs).
Figure 5 with 2 supplements
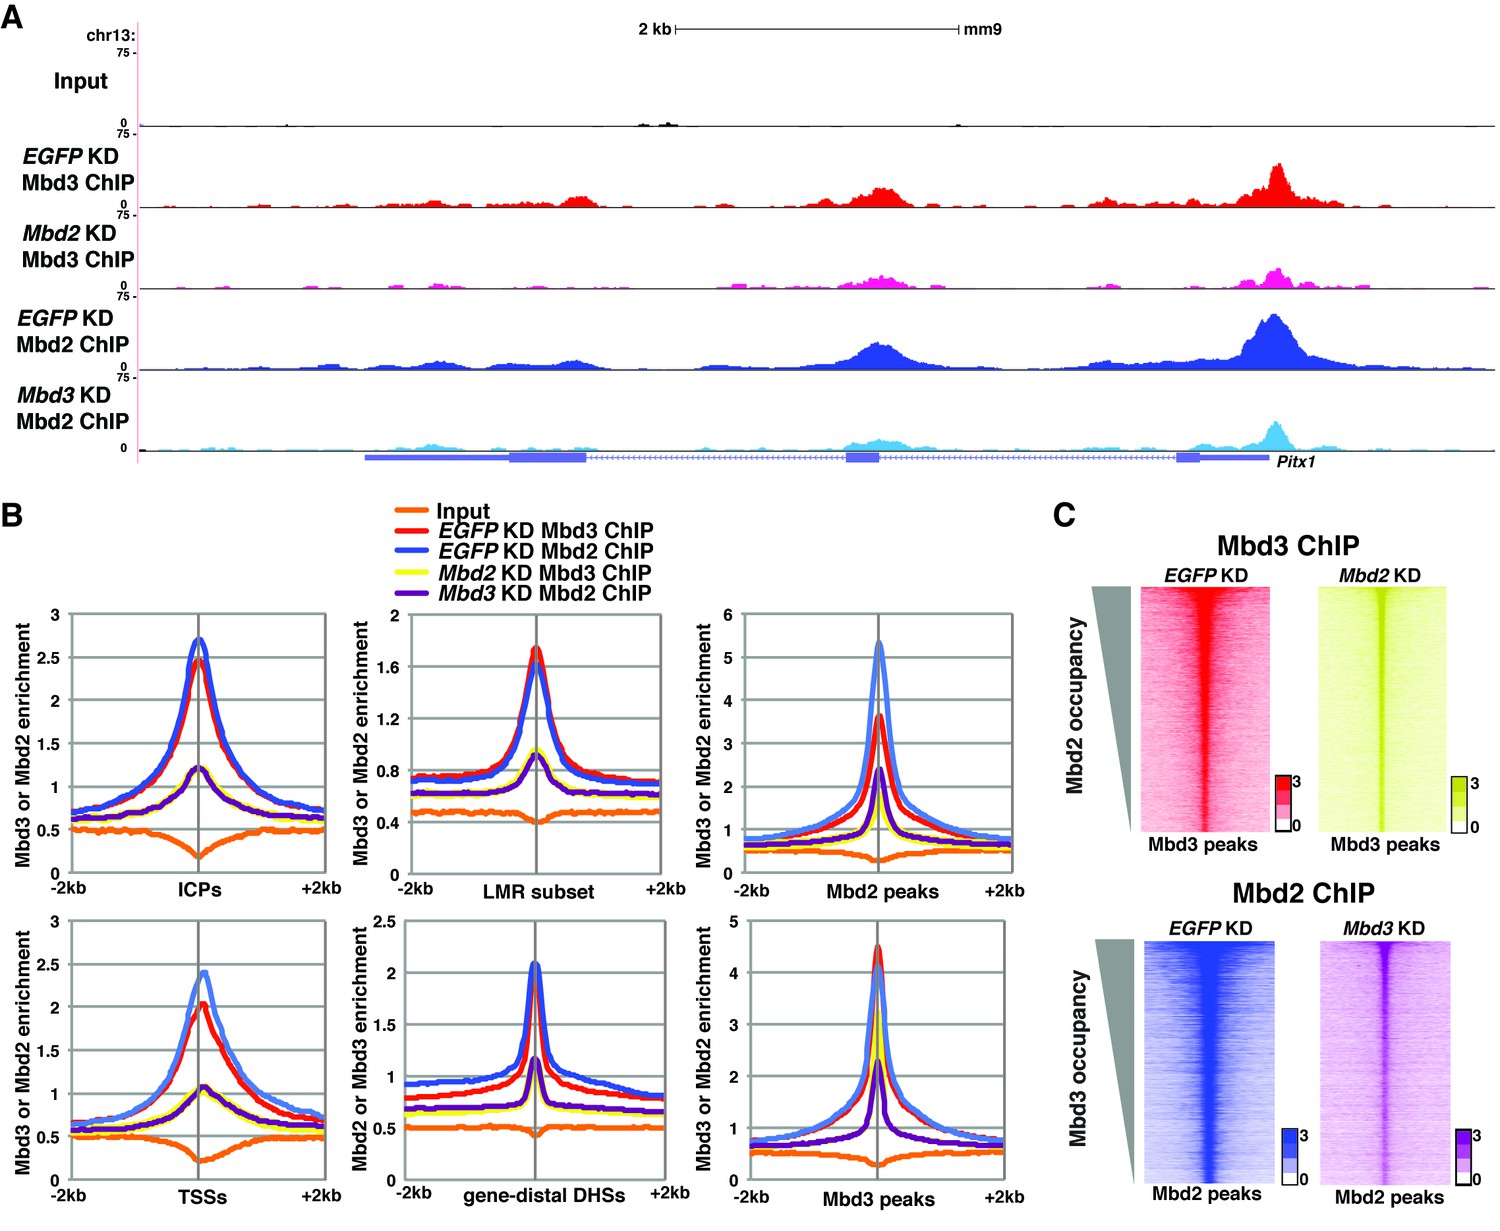
Mbd3 and Mbd2 are required for each other’s binding in ES cells.
(A) Genome browser tracks of ChIP-seq experiments examining Mbd3 or Mbd2 occupancy in control (EGFP KD), Mbd2 KD, or Mbd3 KD ES cells over one example locus (Pitx1). (B) Aggregation plots of Mbd3 or Mbd2 ChIP-seq data showing occupancy over ICPs (top left panel), annotated TSSs (bottom left panel), LMR subset (top middle panel), gene-distal DHSs (bottom middle panel), Mbd2 peaks (top right panel), and Mbd3 peaks (bottom right panel) ± 2 kb in control (EGFP KD), Mbd3 KD, or Mbd2 KD ES cells. (C) Heatmaps of Mbd3 enrichment over Mbd3 binding sites ± 2 kb sorted by Mbd2 occupancy (top panel) and Mbd2 enrichment over Mbd2 binding sites ± 2 kb sorted by Mbd3 occupancy (bottom panel) in control (EGFP KD), Mbd2 KD, or Mbd3 KD ES cells. The profiles shown in the browser tracks, aggregation plots, and heatmaps represent the average of two biological replicates.
Figure 5—figure supplement 1
Interplay between Mbd3 and Mbd2.
(A–B) Genome browser tracks of replicate ChIP-seq experiments examining Mbd3 or Mbd2 occupancy in control (EGFP KD), Mbd2 KD, or Mbd3 KD ES cells over example loci (Hoxd cluster (A) and Tfap2a (B)) show reduced occupancy of Mbd3 in Mbd2 KD cells and of Mbd2 in Mbd3 KD cells over the promoter-proximal regions of Hoxd3, Hoxd11, and Tfap2a.
Figure 5—figure supplement 2
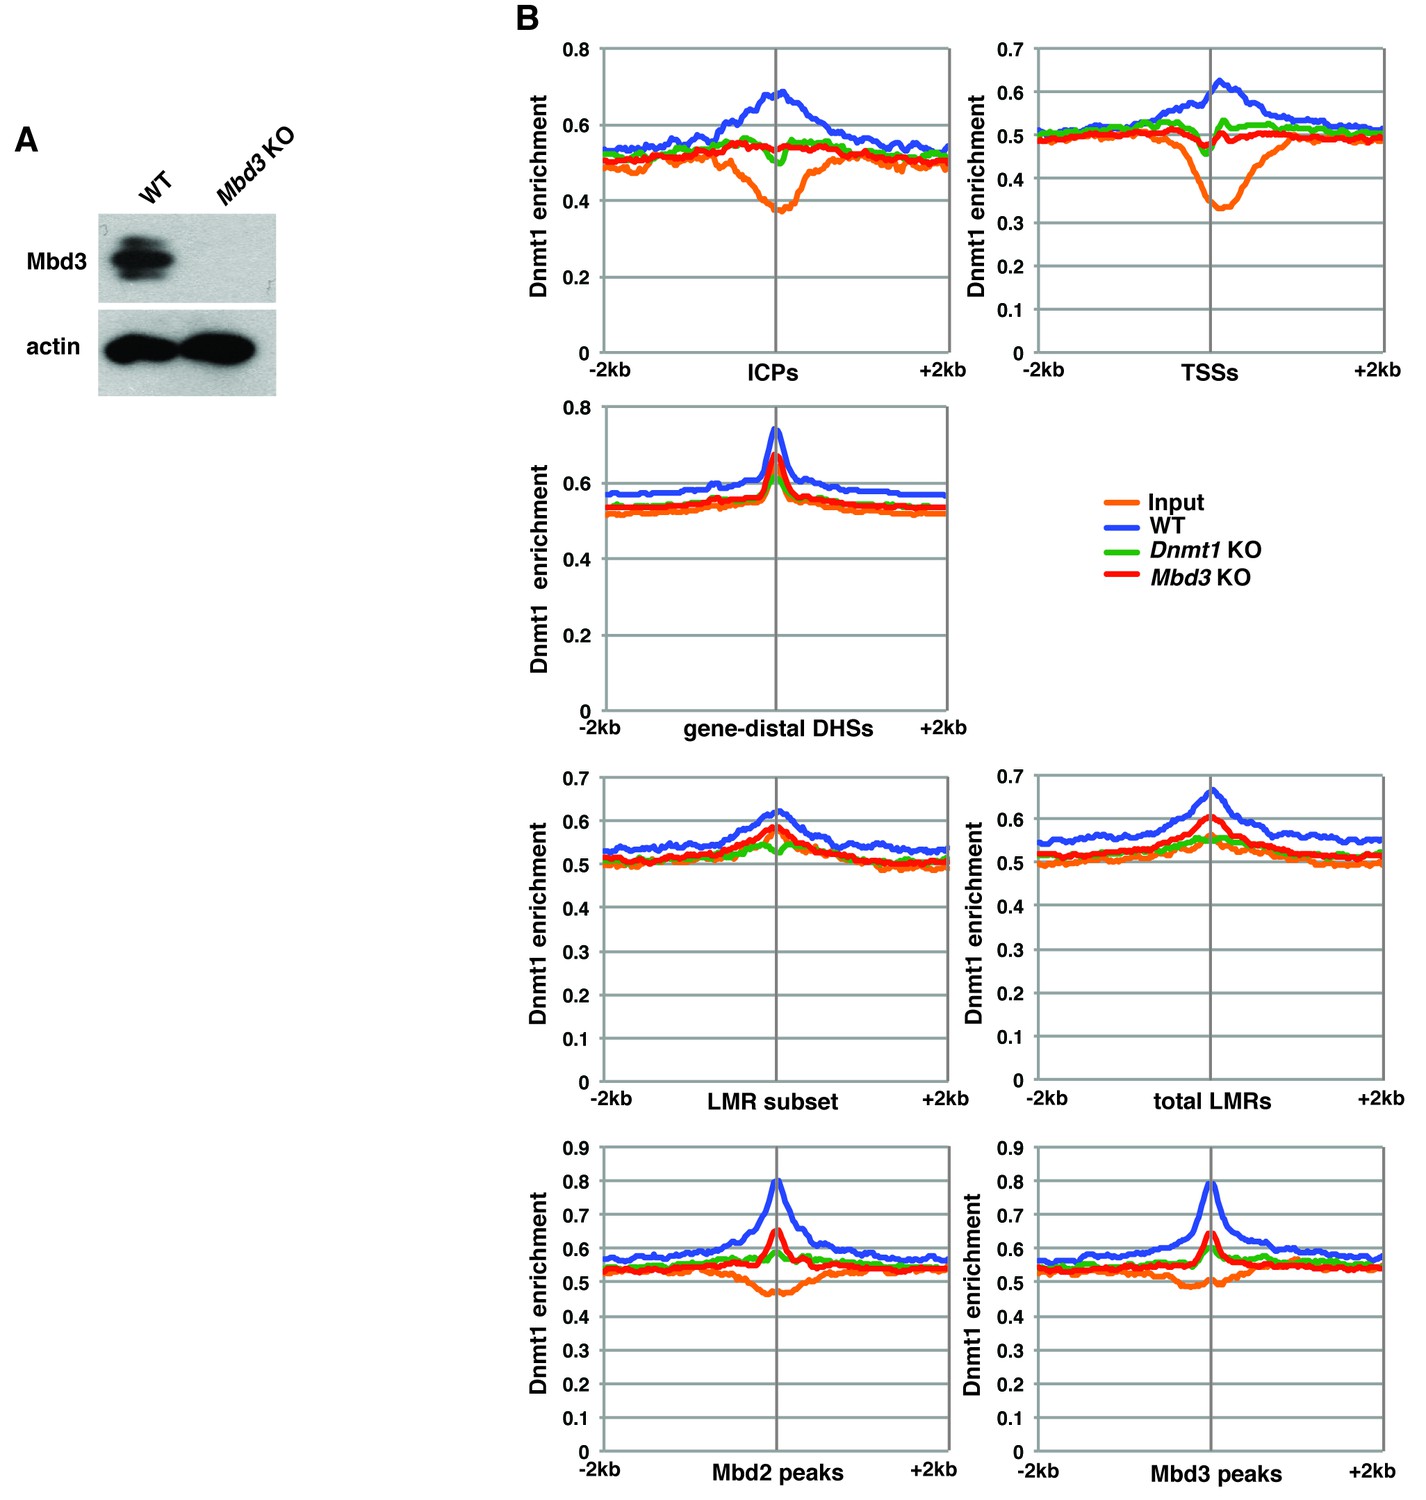
Mbd3 is required for Dnmt1 occupancy in ES cells.
(A) Western blot showing loss of Mbd3 expression in Mbd3 KO ES cell line. β-actin serves as a loading control. (B) Aggregation plots of Dnmt1 ChIP-seq over ICPs, annotated TSSs, gene-distal DHSs, the LMR subset, total LMRs, Mbd2 peaks, and Mbd3 peaks ± 2 kb in wild-type (WT), Dnmt1 KO, and Mbd3 KO ES cells.
Figure 6 with 1 supplement
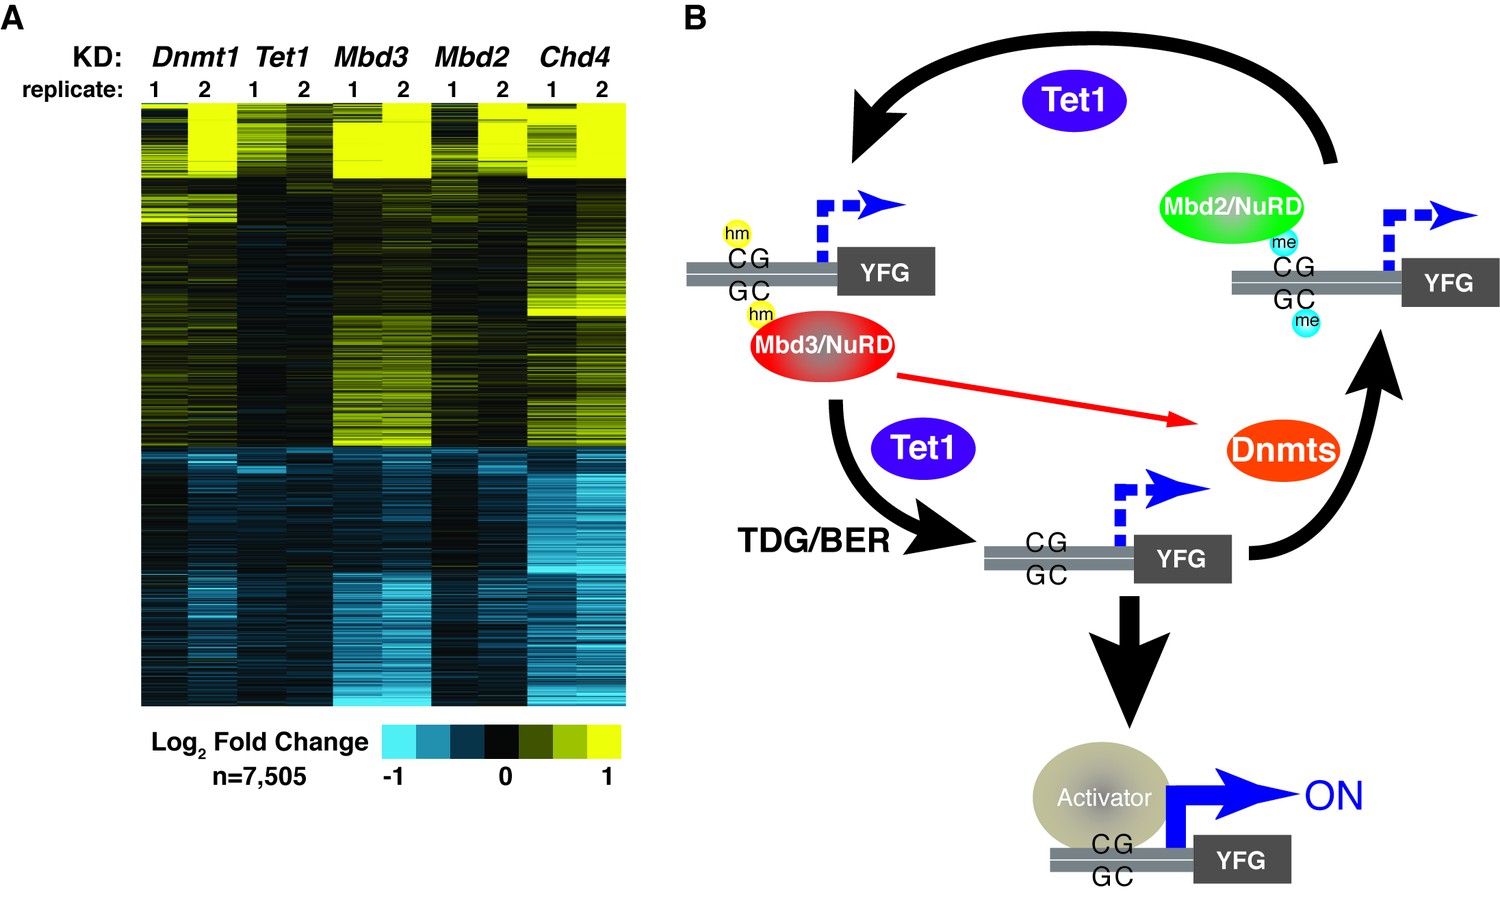
KD of DNA methylation/hydroxymethylation machinery or its readers results in similar effects on gene expression.
(A) K-means clustering (k = 3) of genes misregulated (adjusted p<0.05) upon Dnmt1 KD, Tet1 KD, Mbd3 KD, Mbd2 KD, or Chd4 KD. Upregulated genes are indicated in yellow and downregulated genes are indicated in blue. (B) Model for interdependent regulatory mechanism mediated by DNA methylation/hydroxymethylation and readers of 5mC/5hmC. The DNA methylation/hydroxymethylation machinery (Dnmt1 and Tet1) and its readers (Mbd3 and Mbd2) form a regulatory loop where disruption of one factor results in altered methylation patterns and MBD binding. Binding of a gene activator to unmethylated site, loss of methylation by another mechanism, or loss of a reader of 5mC/5hmC can break the regulatory loop. YFG (your favorite gene) indicates a generic gene body.
Figure 6−figure supplement 1
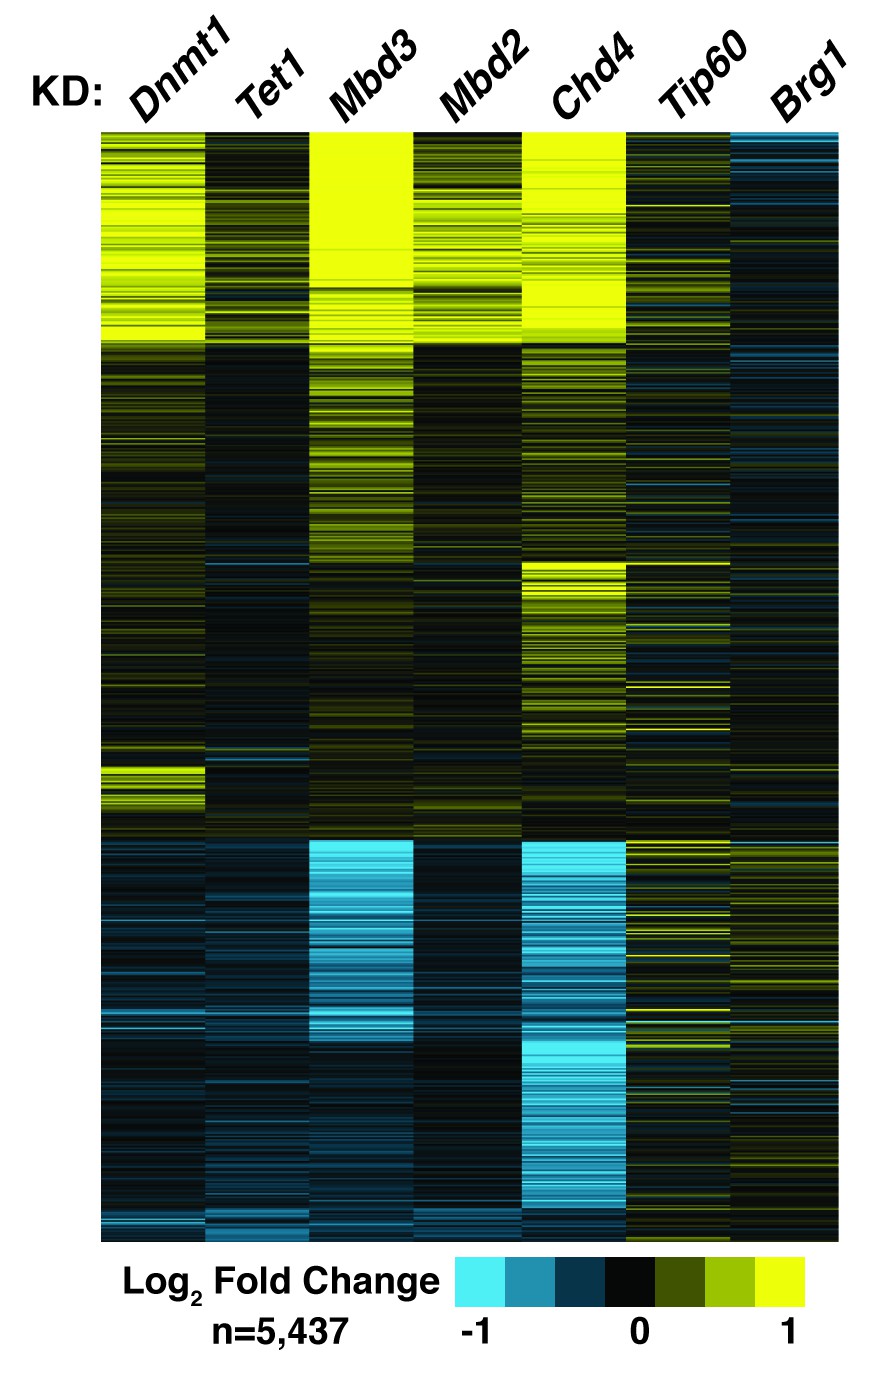
Dnmt1 KD, Tet1 KD, Mbd3 KD, Mbd2 KD, or Chd4 KD have correlated effects on gene expression.
Genes misregulated (adjusted p<0.05) upon Dnmt1 KD, Tet1 KD, Mbd3 KD, Mbd2 KD, Chd4 KD, Tip60 KD, or Brg1 KD. Tip60 KD and Brg1 KD expression data were downloaded from GSE31008. Dnmt1 KD, Tet1 KD, Mbd3 KD, Mbd2 KD, or Chd4 KD expression data were averaged from biological duplicate datasets. Upregulated genes are indicated in yellow and downregulated genes are indicated in blue.
Tables
Table 1
Related to Figure 1. SRA file numbers for re-analyzed Baubec et al. (2013) datasets.
Name | SRA file number | Number of mapped reads (Bowtie, up to three mismatches) |
|---|---|---|
WT Mbd3 ChIP replicate 1 | SRR696667 | 11,601,021 |
WT Mbd3 ChIP replicate 2 | SRR696673 | 14,166,151 |
TKO Mbd3 ChIP | SRR769560 | 34,666,789 |
WT Mbd2 ChIP replicate 1 | SRR527128 | 9,441,721 |
WT Mbd2 ChIP replicate 2 | SRR527129 | 15,116,380 |
WT Mbd2 ChIP replicate 3 | SRR696658 | 12,545,659 |
TKO Mbd2 ChIP replicate 1 | SRR527161 | 24,282,816 |
TKO Mbd2 ChIP replicate 2 | SRR696682 | 7,605,171 |
WT Mbd1a ChIP replicate 1 | SRR527126 | 11,566,092 |
WT Mbd1a ChIP replicate 2 | SRR527127 | 19,528,778 |
TKO Mbd1a ChIP | SRR527159 | 22,070,693 |
WT Mbd1b ChIP replicate 1 | SRR527147 | 14,320,842 |
WT Mbd1b ChIP replicate 2 | SRR527148 | 22,371,797 |
TKO Mbd1b ChIP | SRR527160 | 7,503,068 |
WT Mbd4 ChIP replicate 1 | SRR527131 | 13,864,108 |
WT Mbd4 ChIP replicate 2 | SRR527132 | 23,655,753 |
TKO Mbd4 ChIP replicate 1 | SRR669321 | 13,670,155 |
TKO Mbd4 ChIP replicate 2 | SRR669322 | 11,251,853 |
WT MeCP2 ChIP replicate 1 | SRR527133 | 19,229,199 |
WT MeCP2 ChIP replicate 2 | SRR527134 | 11,771,499 |
WT MeCP2 ChIP replicate 3 | SRR696681 | 12,118,572 |
TKO MeCP2 ChIP replicate 1 | SRR527162 | 17,003,233 |
TKO MeCP2 ChIP replicate 2 | SRR696683 | 28,586,006 |
Table 2
Related to Figure 2—figure supplement 1–3. Primer list for qPCR.
Gene | Forward | Reverse |
|---|---|---|
Dnmt1 | TGTTCTGTCGTCTGCAACCT | GCCATCTCTTTCCAAGTCTTT |
Tet1 | TCACAGGCACAGGTTACAAAAG | TCCTTACATTTTCAAGGGGATG |
Mbd3 | GGCCACAGGGATGTCTTTTACT | CTTGACCTGGTTGGAAGAATCA |
Mbd2 | AACCAAATTCACGAACCACC | CCTTGTAGCCTCTTCTCCCA |
Chd4 | AAGTTTGCAGAGATGGAAGAGC | GGTCGTAGTCCTGAATCTCCAC |
Farp1 | AACTGCAAGTCATTCTAAATCTCG | GGTATTCAATGCCAGAGACACA |
Ppp2r2c | CGAATTATCCAGCTCTGCCTTA | TGGAGGAGAGACTTAGGGGTGT |
Gpr83 | GAGCCACCTTACTGTAGGGAATG | CACGCTCACCAGCTTTCTGTA |
Cldn7 | ACCTTTGGAAGAGCAGTCAGTG | CCTTCTCCATCCACACACTTTC |
Tgfb1 | AAGTCAGAGACGTGGGGACTTCTTG | AGTCTTCGCGGGAGGCGGGGT |
Trh | TAATGCCTCTGACCTGGGATC | CCCACATCCTAATTCCAAAGTG |
Table 3
Related to Figure 6−figure supplement 1. Correlation coefficients for pairwise combinations of factor KD. Tip60 KD (a histone acetyltransferase with repressive functions in ES cells) and Brg1 KD (an ATP-dependent chromatin remodeling enzyme) are included for comparison.
Dnmt1 | Tet1 | Mbd3 | Mbd2 | Chd4 | Tip60 | Brg1 | KD: |
|---|---|---|---|---|---|---|---|
1.0 | 0.508 | 0.693 | 0.612 | 0.645 | -0.033 | 0.051 | Dnmt1 |
1.0 | 0.441 | 0.551 | 0.475 | -0.003 | 0.104 | Tet1 | |
1.0 | 0.712 | 0.831 | -0.101 | 0.308 | Mbd3 | ||
1.0 | 0.656 | -0.027 | 0.033 | Mbd2 | |||
1.0 | -0.094 | 0.269 | Chd4 | ||||
1.0 | 0.199 | Tip60 | |||||
1.0 | Brg1 |
Download links
A two-part list of links to download the article, or parts of the article, in various formats.
Downloads (link to download the article as PDF)
Open citations (links to open the citations from this article in various online reference manager services)
Cite this article (links to download the citations from this article in formats compatible with various reference manager tools)
DNA methylation directs genomic localization of Mbd2 and Mbd3 in embryonic stem cells
eLife 5:e21964.
https://doi.org/10.7554/eLife.21964


