Intracellular growth of Mycobacterium tuberculosis after macrophage cell death leads to serial killing of host cells
- KwaZulu-Natal Research Institute for TB-HIV, South Africa
- University of KwaZulu-Natal, South Africa
- Max Planck Institute for Infection Biology, Germany
- Massachusetts General Hospital, United States
- Nelson R Mandela School of Medicine, University of KwaZulu-Natal, South Africa
- Inkosi Albert Luthuli Central Hospital, South Africa
Figures
Figure 1 with 5 supplements

Number of Mtb internalized determines probability of macrophage death.
The death frequency for 720 infected MDM was graphed over time as a function of the sum of Mtb internalized (raw data provided in Figure 1—source data 1). To obtain death frequencies, MDM were divided into 10 groups according to the number of Mtb internalized. The frequency of dead cells was determined at 10 movie frame (1.7 hr) intervals for each group (x-axis), and plotted against the mean sum of Mtb internalized for the group (y-axis). Interpolation between points was performed to obtain a surface. The color scale represents the frequency of cell death from low (blue) to high (red).
-
Figure 1—source data 1
Intracellular Mtb fluorescence through time, Movie frames of Mtb phagocytosis, and MDM frame of death, if it occurs, for IFNγ untreated MDM.
- https://doi.org/10.7554/eLife.22028.005
Figure 1—figure supplement 1
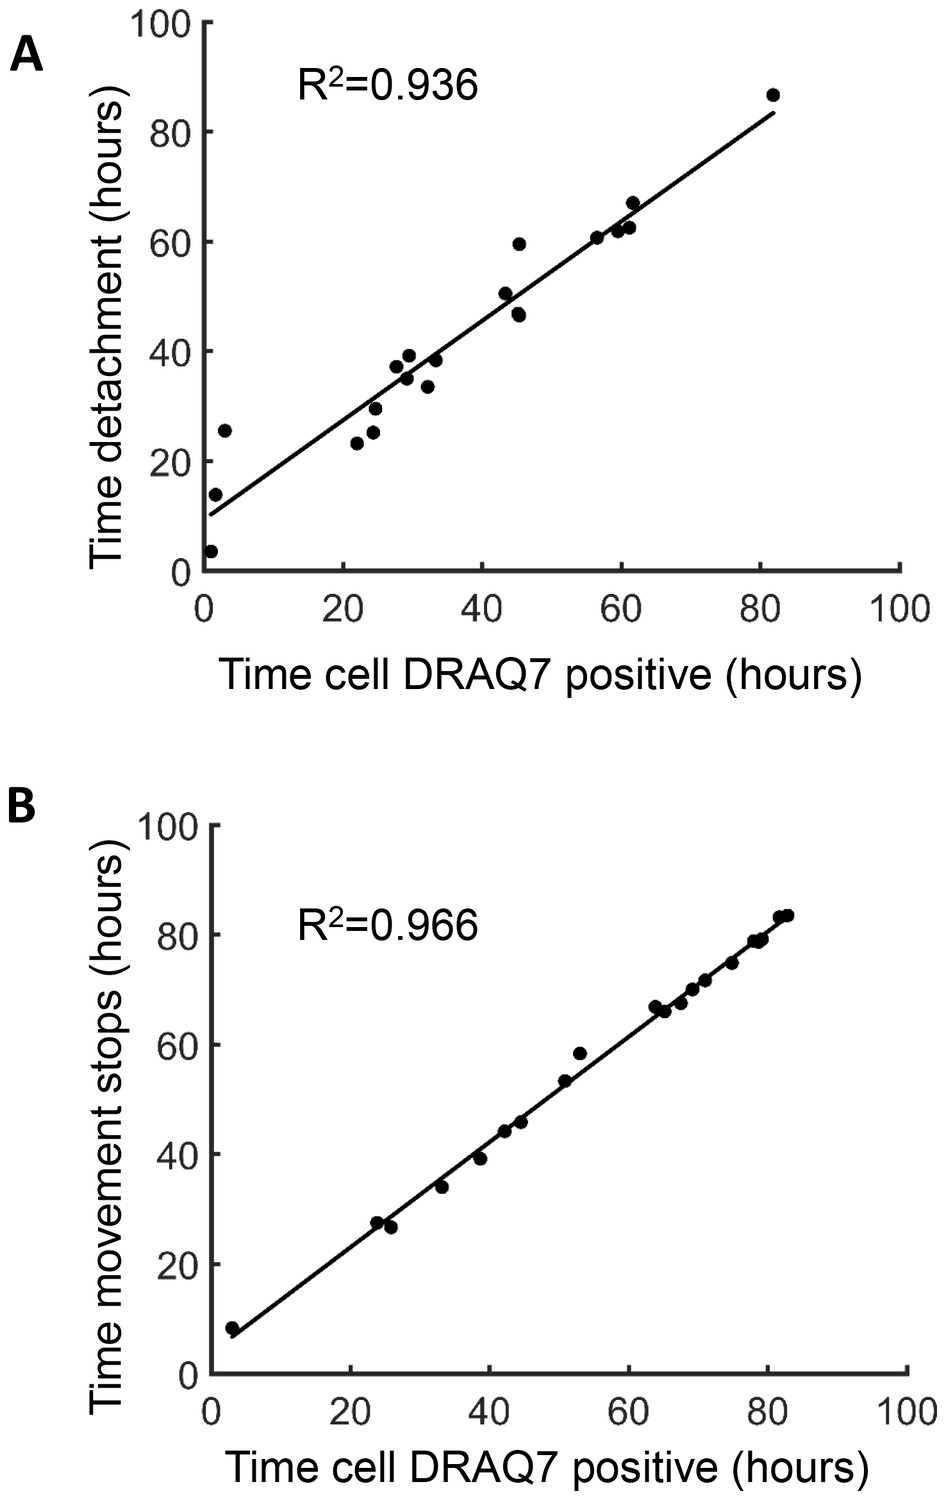
Measures of cell death.
Time of cell death induced by Mtb and determined by macrophage dynamics was correlated to macrophage death as determined by the uptake of the dead cell stain DRAQ7. Time of DRAQ7 uptake was correlated with time of macrophage detachment (A) or time of cessation of movement of internal cellular structures (B).
Figure 1—figure supplement 2
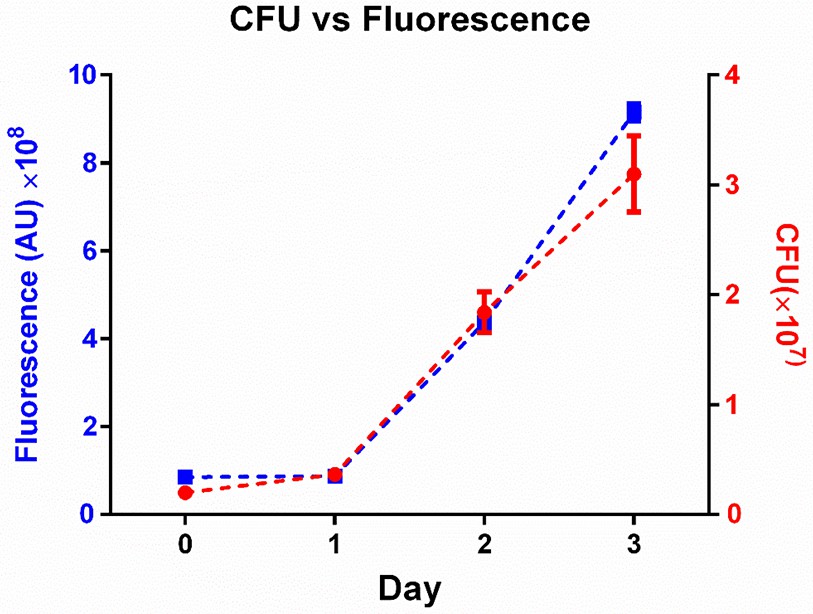
Fluorescence as a measure of Mtb numbers.
we tracked the increase in Mtb by fluorescence (blue squares) versus by colony forming units (CFU, red circles) over three days of growth in culture. Means and standard deviations of triplicates. One of two independent experiments.
Figure 1—figure supplement 3
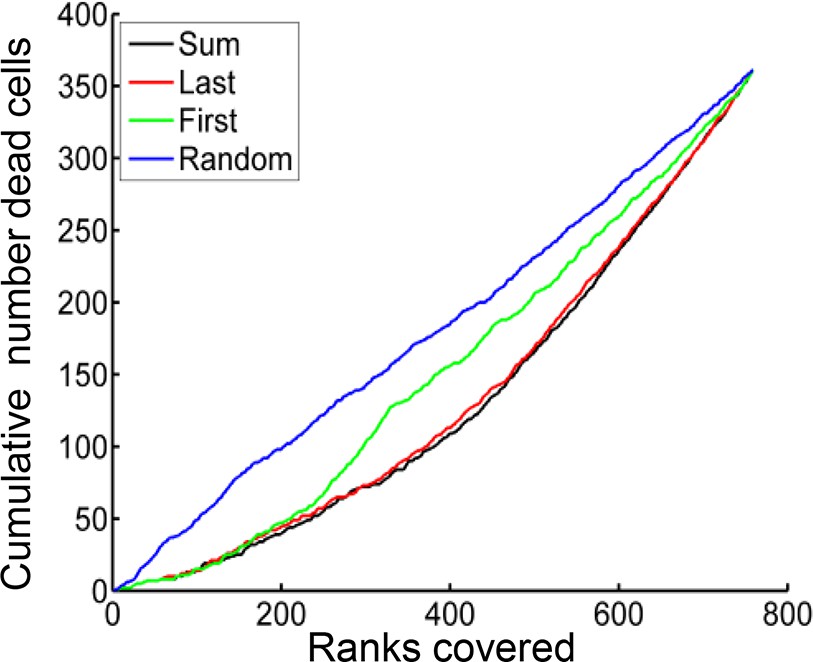
MDMs were ranked according to the sum of Mtb internalized (black), number of Mtb in the last aggregate internalized (red), number of Mtb in the first aggregate internalized (green), or randomly (blue).
Ranks (x-axis) were then plotted against the cumulative number of dead cells present up to each rank (y-axis). Ranking according to the sum of Mtb internalized gave the best separation between the top 50% and the bottom 50% of ranks (ratio top/bottom = 2.6), followed by a number of Mtb in the last clump internalized (2.4), number of Mtb in the first clump (1.4), or randomized ranking (1.0). All values were significant relative to the randomized ranking (p<0.0001), as determined from 10,000 randomizations.
Figure 1—figure supplement 4
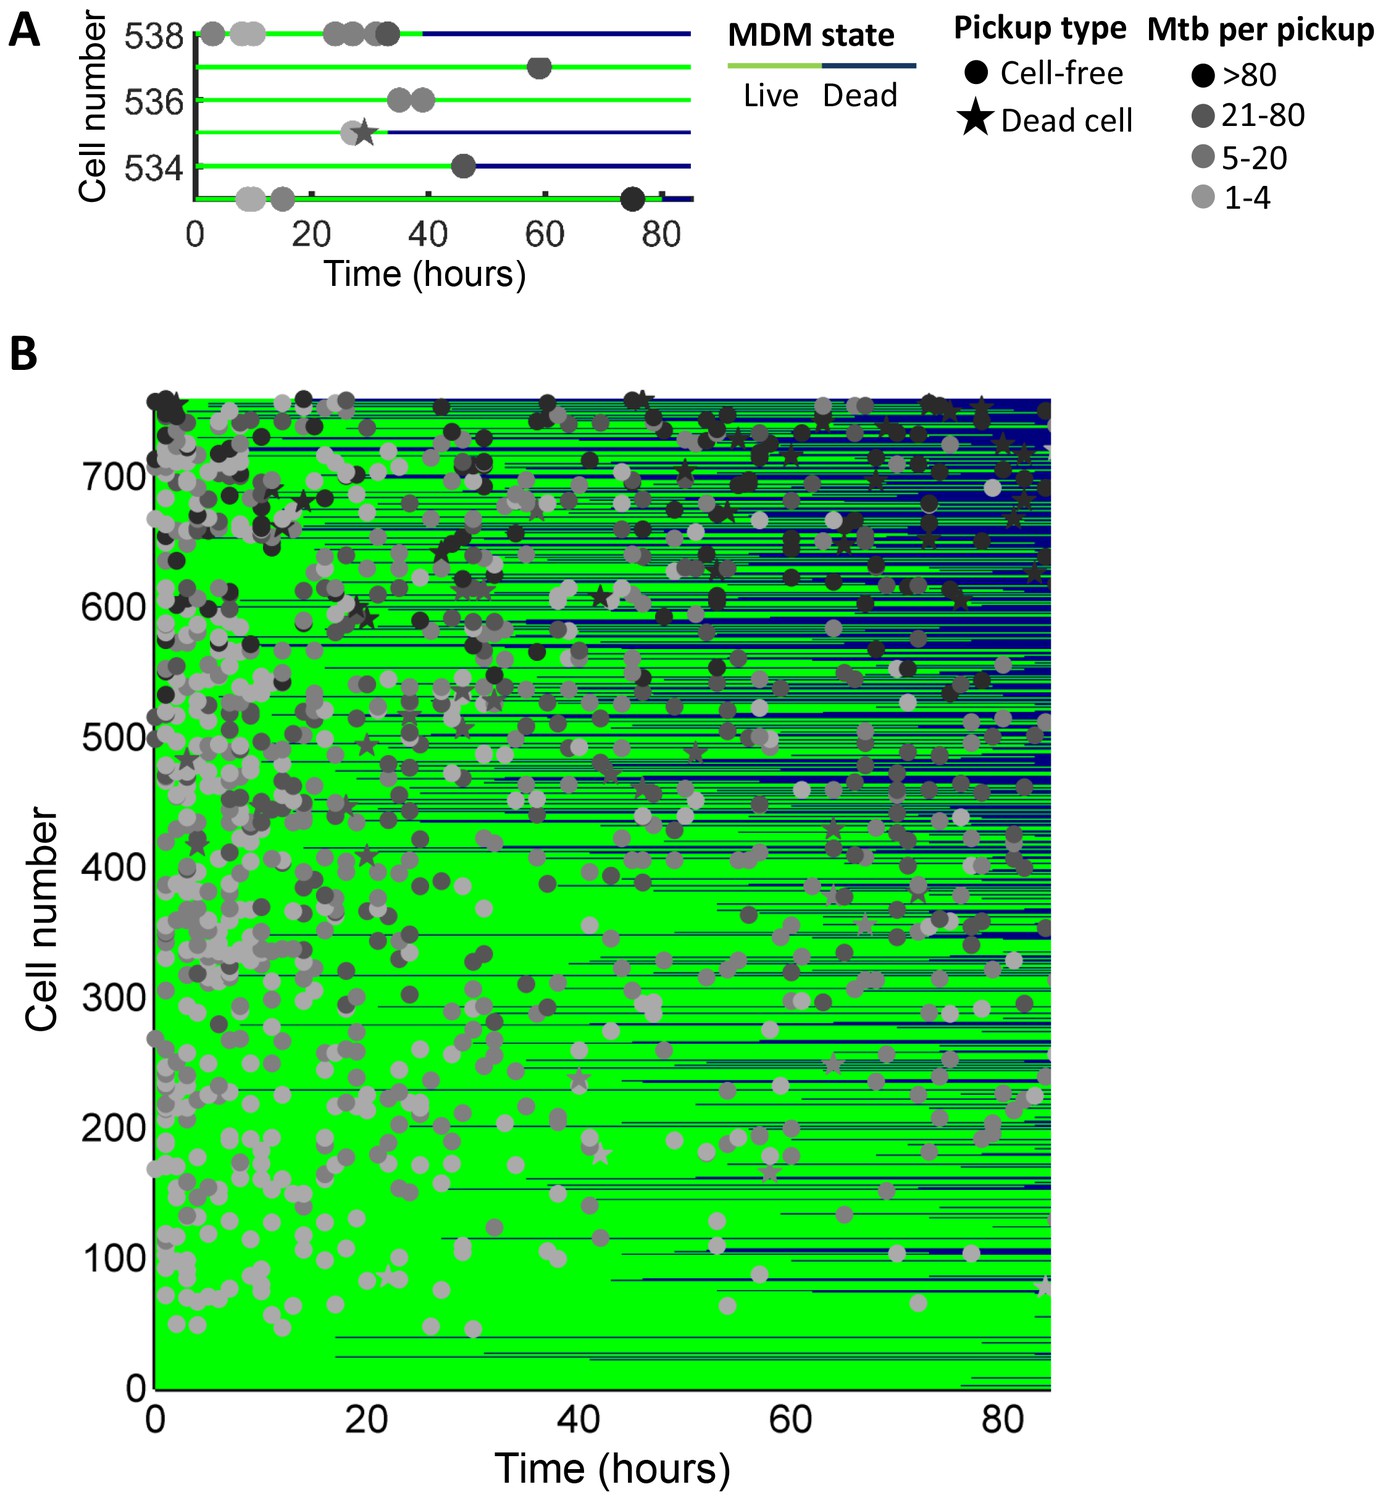
Outcomes of macrophage-Mtb interactions.
(A) A subset of cells is shown as an example. Macrophages were numbered on the y-axis based on the sum of Mtb internalized, with cells internalizing the largest number at the top of the chart. The fate of each macrophage over time is represented by one line which intersects the y-axis at the rank of the cell. The time of macrophage death, if it occurred, is at the point where the line changes from green to dark blue. The timing and number of bacteria per pickup event is indicated by the x-axis location and shade of the marker, respectively. Pickups of cell-free Mtb are marked as circles, and pickups of dead infected cells as stars. (B) The full dataset of 759 cells from five independent imaging experiments. For cells which died and detached, the dark blue line was extended from the point of cell death to movie end.
Figure 1—figure supplement 5
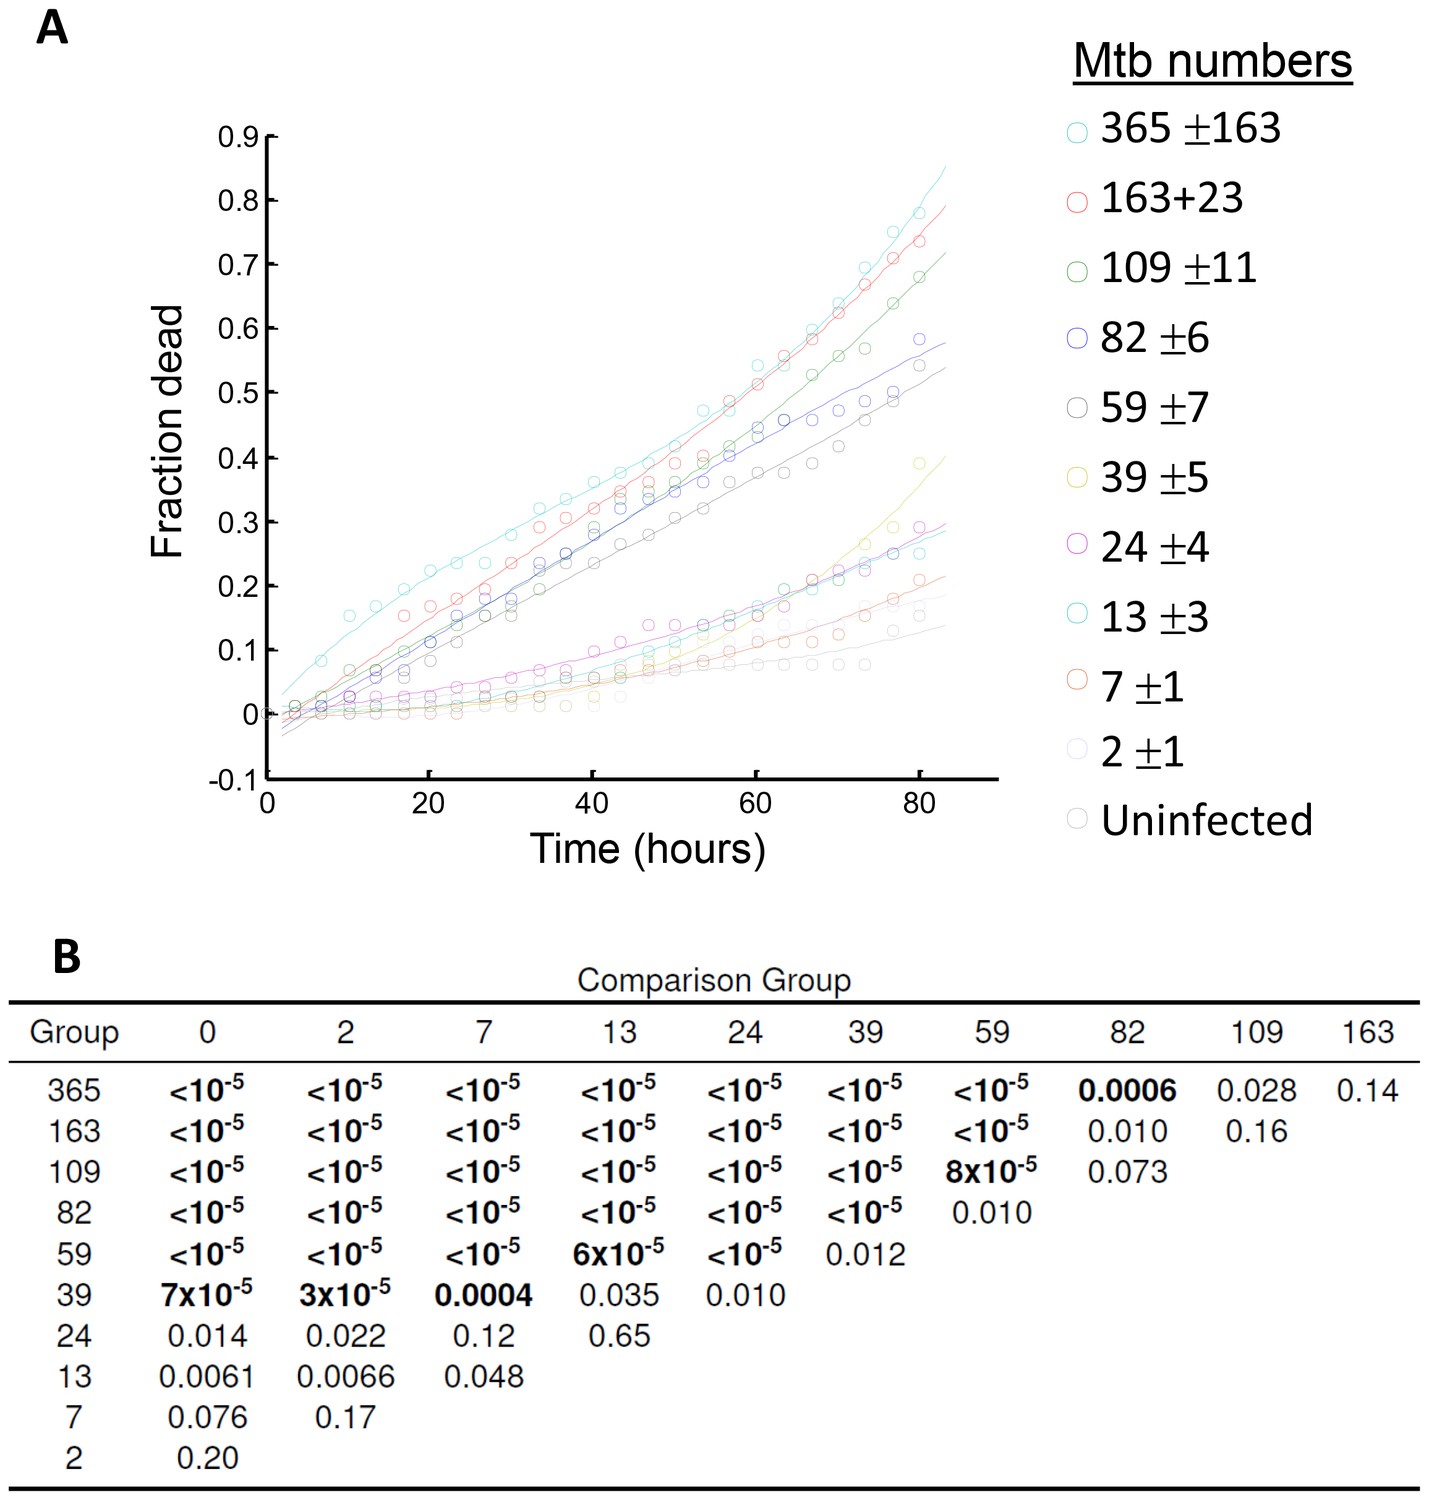
Analysis of differences between macrophages grouped by the sum of Mtb internalized.
(A) Fraction of cells which died over time in each of the 10 infected cell groups (n = 72, group mean and standard deviation of Mtb per macrophage shown in the legend on the right), and the uninfected bystander group (n = 39). Lines are cubic fits as a guide to the eye. (B) Table of p-values for differences between groups as determined by bootstrap. The fraction of cells in each group was compared to the fraction of dead cells in infected groups with lower mean Mtb internalized, or to bystanders. Each group was resampled by drawing either 72 cells (for comparison to infected groups) or 39 cells (for comparison to bystanders), with replacement, 100,000 times. The p-value was calculated as the number of times the resampled fraction of dead cells at the end of the movie was lower than in the comparison group, divided by 100,000 (code provided as Source code 2). As the threshold for statistical significance, we used α/n = 0.005, where α = 0.05 for single comparisons was adjusted for n = 10 comparisons by the Bonferroni method. Table shows the groups in the first column and the comparison groups in the first row. p-values which passed the significance threshold are shown in bold.
Figure 2
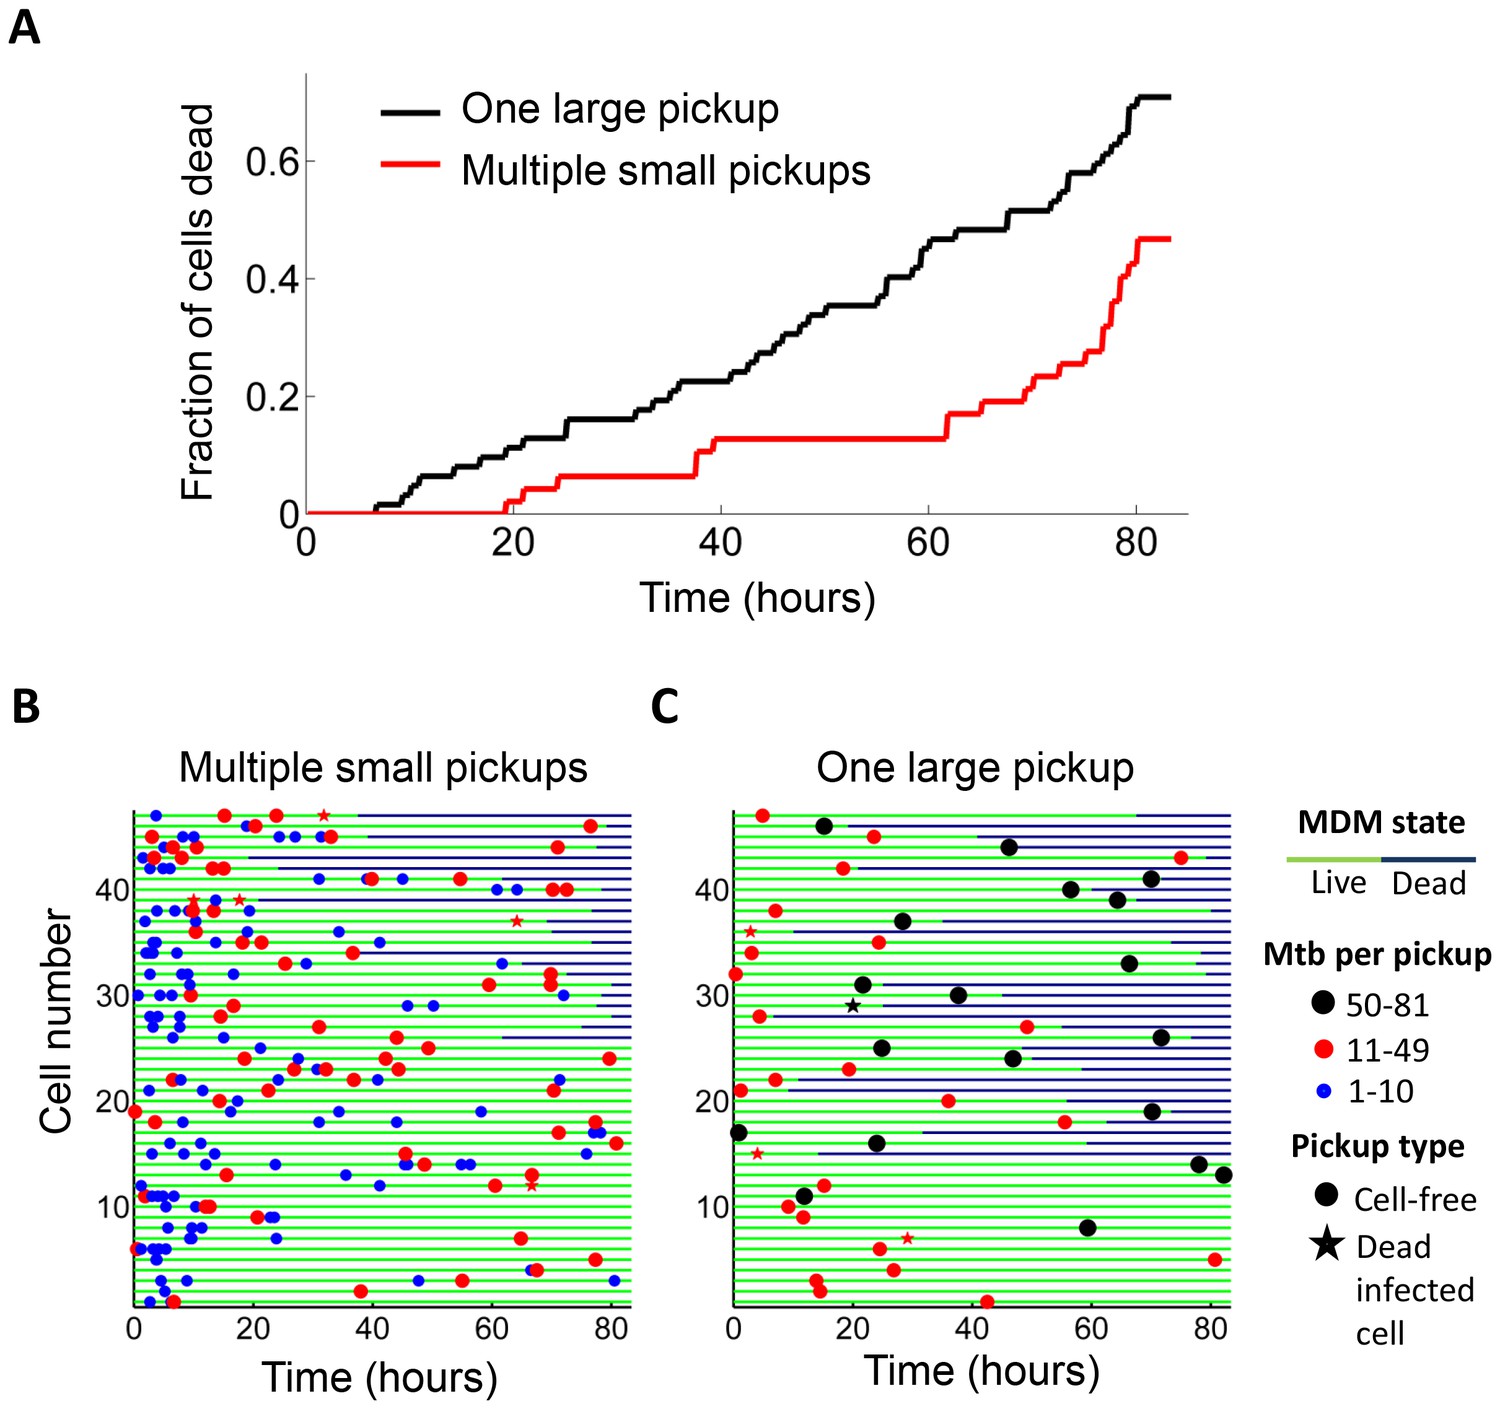
Internalization of single large aggregates is more cytotoxic than several smaller aggregates.
(A) Fraction of dead MDM after phagocytosing one large aggregate of Mtb (black line) or multiple small aggregates (red line) with a similar cumulative sum of Mtb to the single internalizations, but with all aggregates being smaller than 50 bacilli each. The frequency of cell death was 47% for multiple internalizations (n = 47) and 71% for single internalizations (n = 62, p=5×10⁻⁴ by bootstrap). Individual cell fates are shown in (B) for cells internalizing multiple small aggregates, and (C) for cells internalizing a similar number of Mtb as single aggregates. The blue circles are internalizations of aggregates of 10 or fewer Mtb, red circles are clumps of 11–49 Mtb, and black circles are 50–81 Mtb. Line color changes from green to dark blue at time of death. Stars indicate internalizations of dead infected cells. An equal number of cells is shown in (B) and (C) to facilitate comparison. Mean number of Mtb phagocytosed was 49.6 ± 18.9 for MDM internalizing multiple small Mtb clumps, and 49.4 ± 14.3 for MDM internalizing a single large clump.
Figure 3
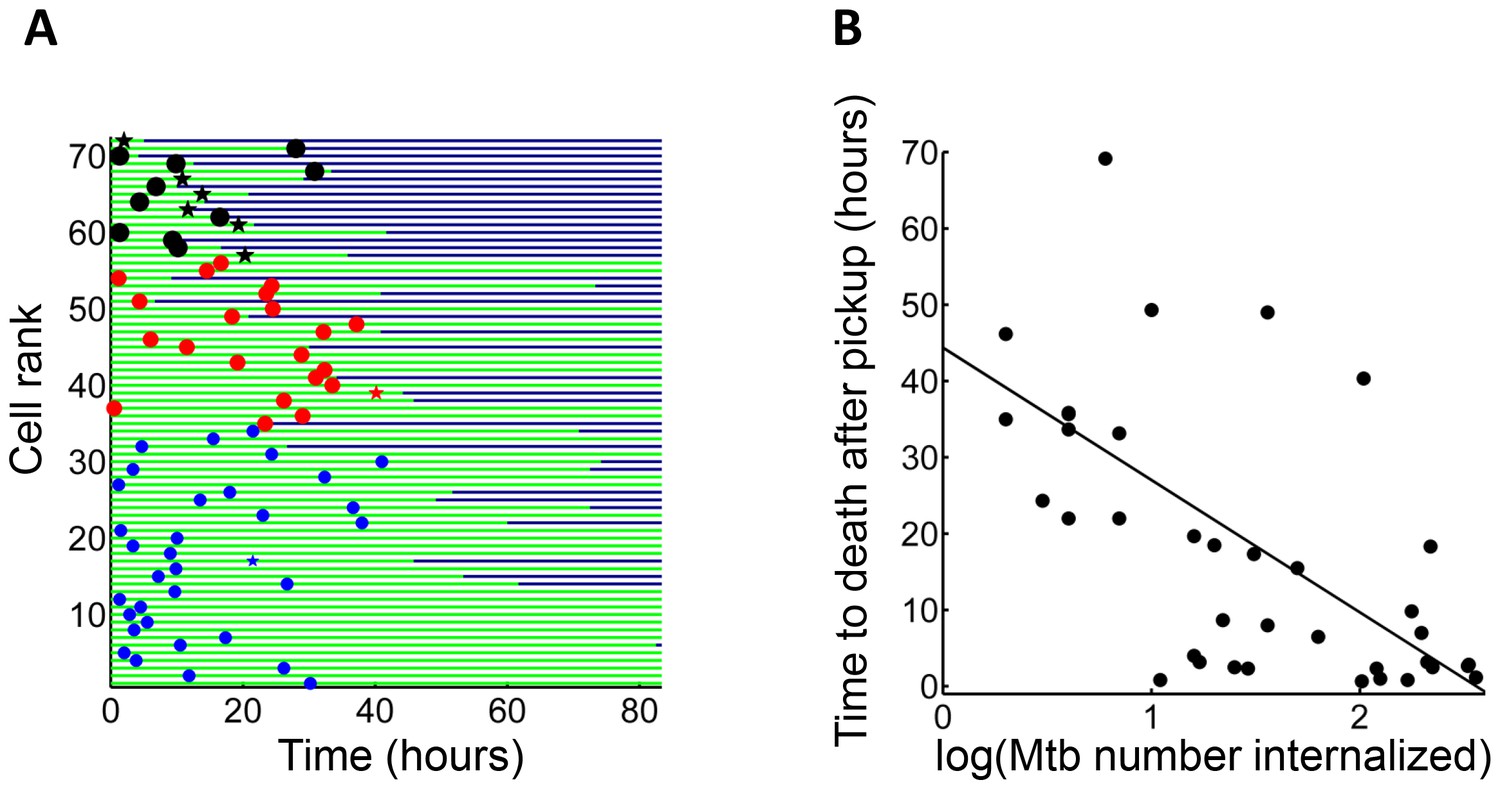
Mtb aggregate size determines timing of macrophage death.
(A) MDMs which internalized exactly one clump before the halfway point of the movie were ranked based on the amount of Mtb internalized (n = 72 cells). The blue circles are internalizations of aggregates of 10 or fewer Mtb, red circles are clumps of 11–49 Mtb, and black circles are >50 Mtb. Line color changes from green to dark blue at time of death. Stars indicate internalizations of dead infected cells. (B) Time differences between internalization and death for cells that died as a function of log transformed bacterial number. R2 = 0.56, p=4×10⁻⁸(n = 39).
Figure 4

Mtb induced macrophage death does not resemble apoptosis.
(A) Cell death was caused by internalization of Mtb clumps (top row, Mtb in red), the pyroptosis inducers Nigericin+LPS (middle row), or the apoptosis inducer cisplatin (bottom row). Time of cell death was determined by the cessation of internal movement, and loss of membrane integrity by entry of the fluorescent dye DRAQ7 (green). (B) Quantitation of time of cell death and loss of membrane integrity. Black line is the Pearson correlation of within cell image pixels from one time-lapse frame to the next. Cell death as determined by cessation of internal cell movement is indicated by greater than threshold jump in pixel correlation (red vertical line). Loss of membrane integrity as detected by DRAQ7 is shown by the green line, (normalized to maximum signal) with blue vertical line representing time DRAQ7 levels cross an experimentally determined threshold. In the case of Mtb-induced cell death, the blue and red lines are superimposed. Each graph represents the cell shown in (A). (C) Median time difference (red line, with an interquartile range shown as blue box) between cell death and loss of membrane integrity for cells killed by Mtb (n = 119), 20 µM nigericin and 1 µg/ml LPS (n = 29) or 50 µM cisplatin (n = 76). ****p<0.001 by Kruskal-Wallis rank sum test corrected for multiple hypotheses.
Figure 5 with 1 supplement
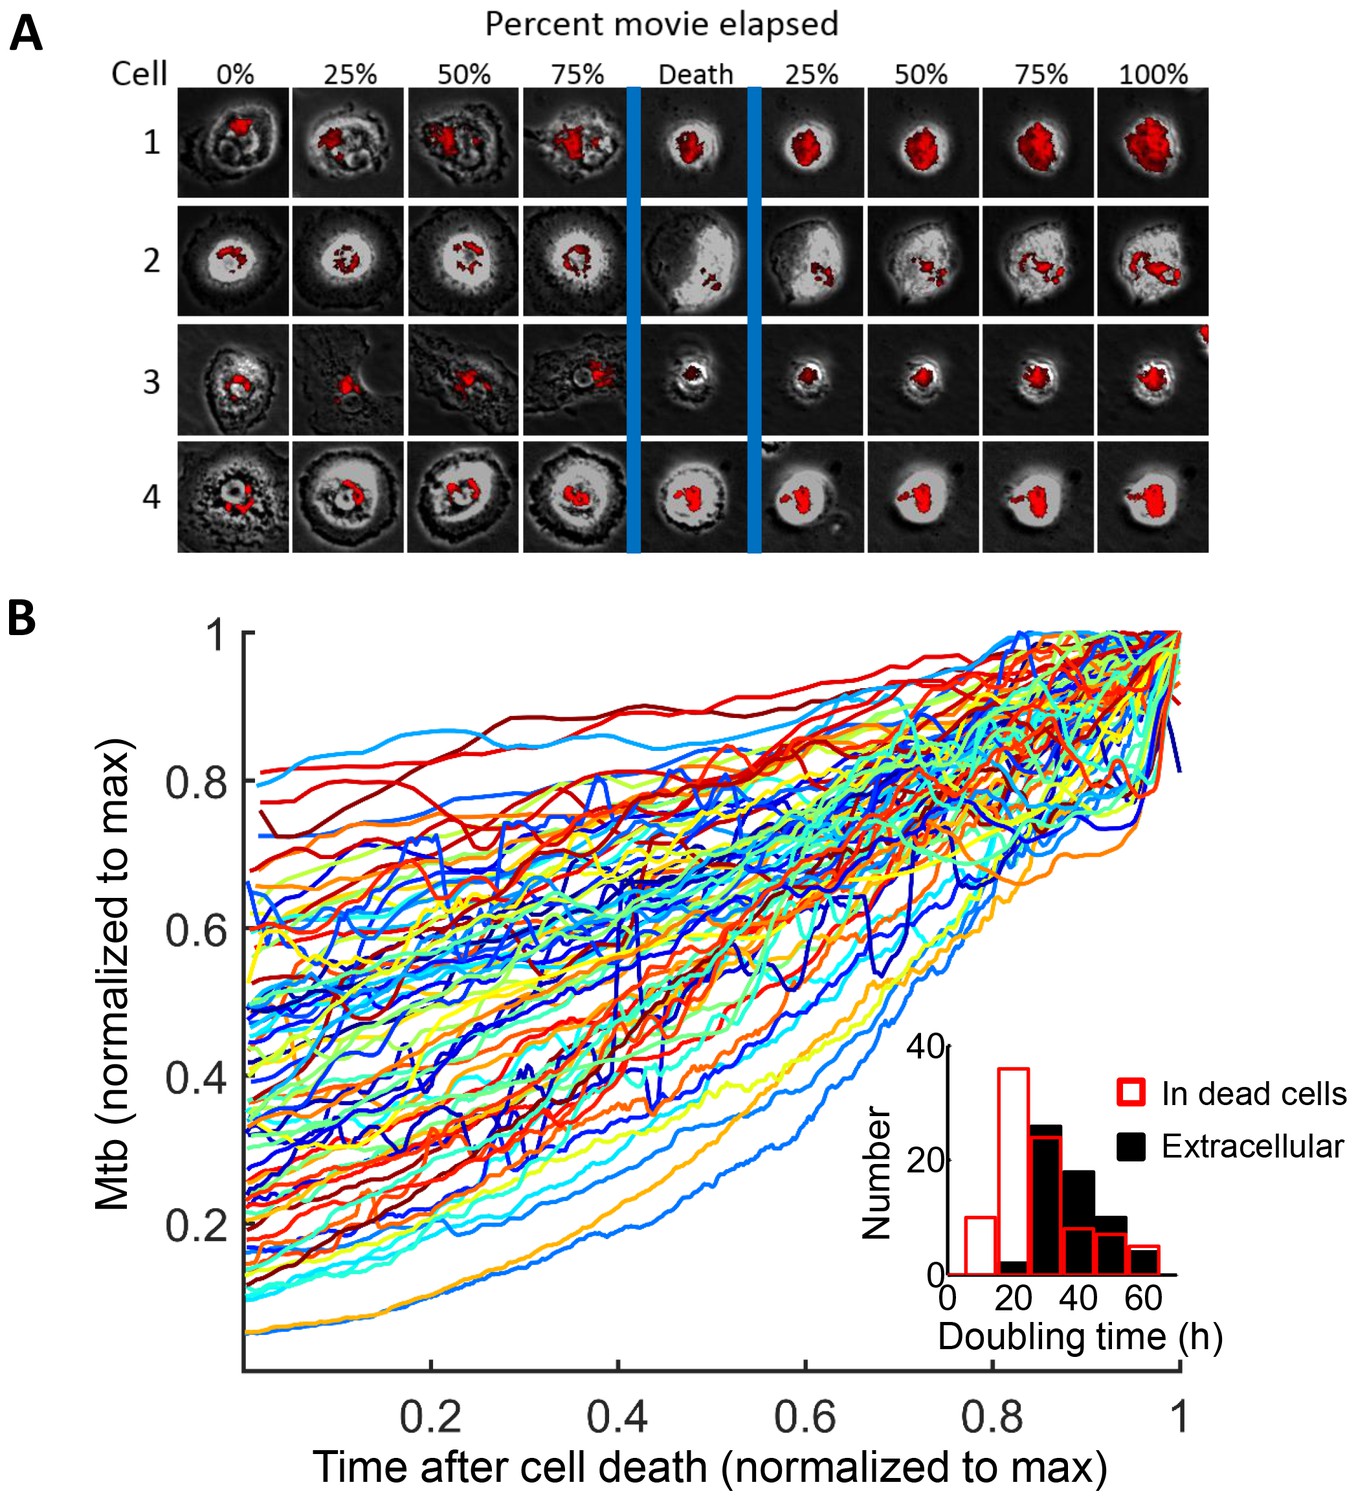
Mtb grows robustly inside dead macrophages.
(A) In silico synchronized images of representative macrophages infected with Mtb and imaged before and after death. Each horizontal set of images represents the same macrophage over time, with the cell death event at the center image. On the left of the cell death event are images of the cell at regular intervals before cell death as a percentage of time the cell was imaged alive. On the right are images at regular intervals after death a percentage of time the cell was imaged dead. (B) Traces of Mtb growth in dead cells. Each trace represents the number of Mtb within the same dead MDM and is normalized to its maximum Mtb number and maximum length of time the dead cell was imaged before detachment or movie end. Minimum time for imaging dead cells was 10 hr. In total, 92 dead macrophages were analyzed, with 90 showing positive exponential slopes. The median doubling time for cells with positive slopes was 24.7 hr over five independent experiments. Inset: Doubling times of Mtb in dead cells excluding the two negative values (red, n = 90) and in the extracellular medium (black, n = 60). The median extracellular doubling time was 36.1 hr.
Figure 5—figure supplement 1
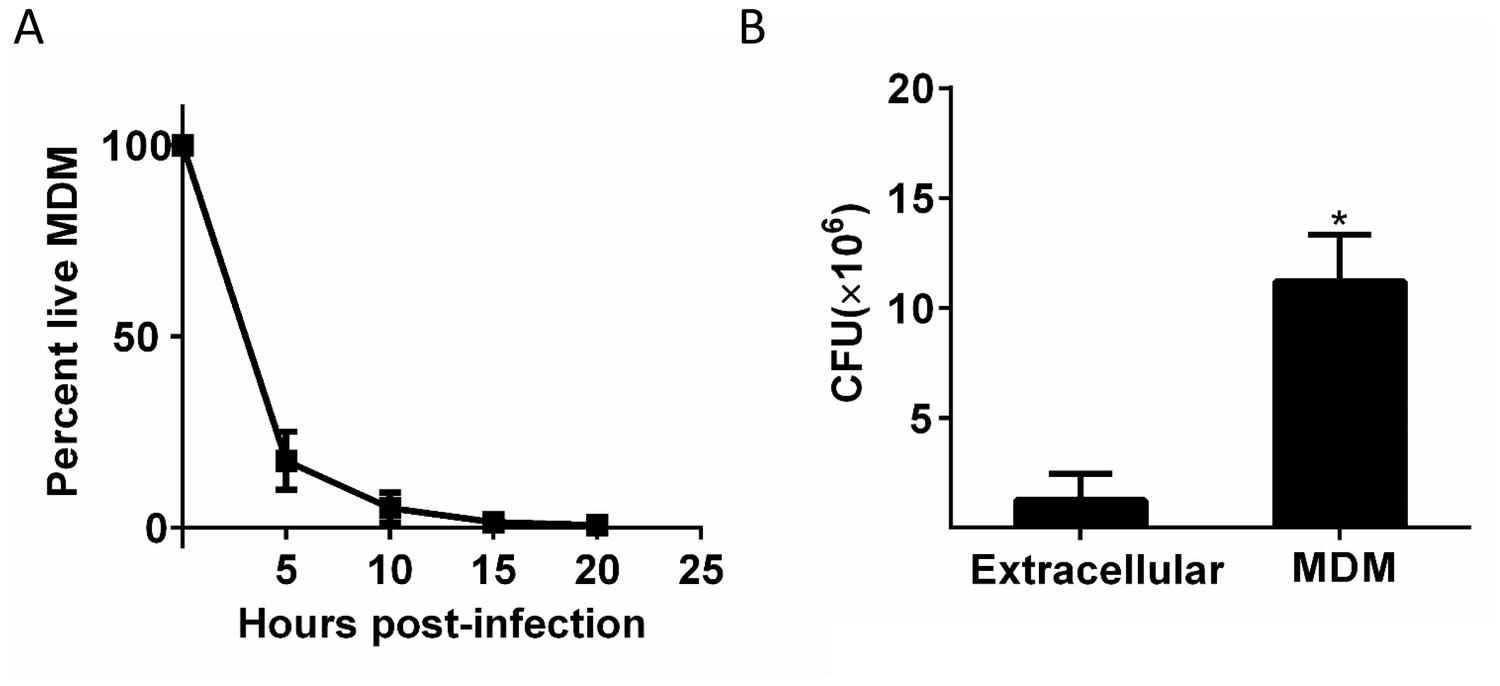
Differences in growth measured by CFU between Mtb in dead cells and extracellular Mtb.
(A) A homogeneous population of Mtb in dead cells was produced by infecting at a high multiplicity per cell (MOI = 30 according to CFU). (B) the same input dose of concentrated Mtb culture was either grown with MDM or cell-free in MDM medium for three days and assayed by CFU. Mean and standard deviation of two replicates. *p=0.029 Student’s t-test.
Figure 6
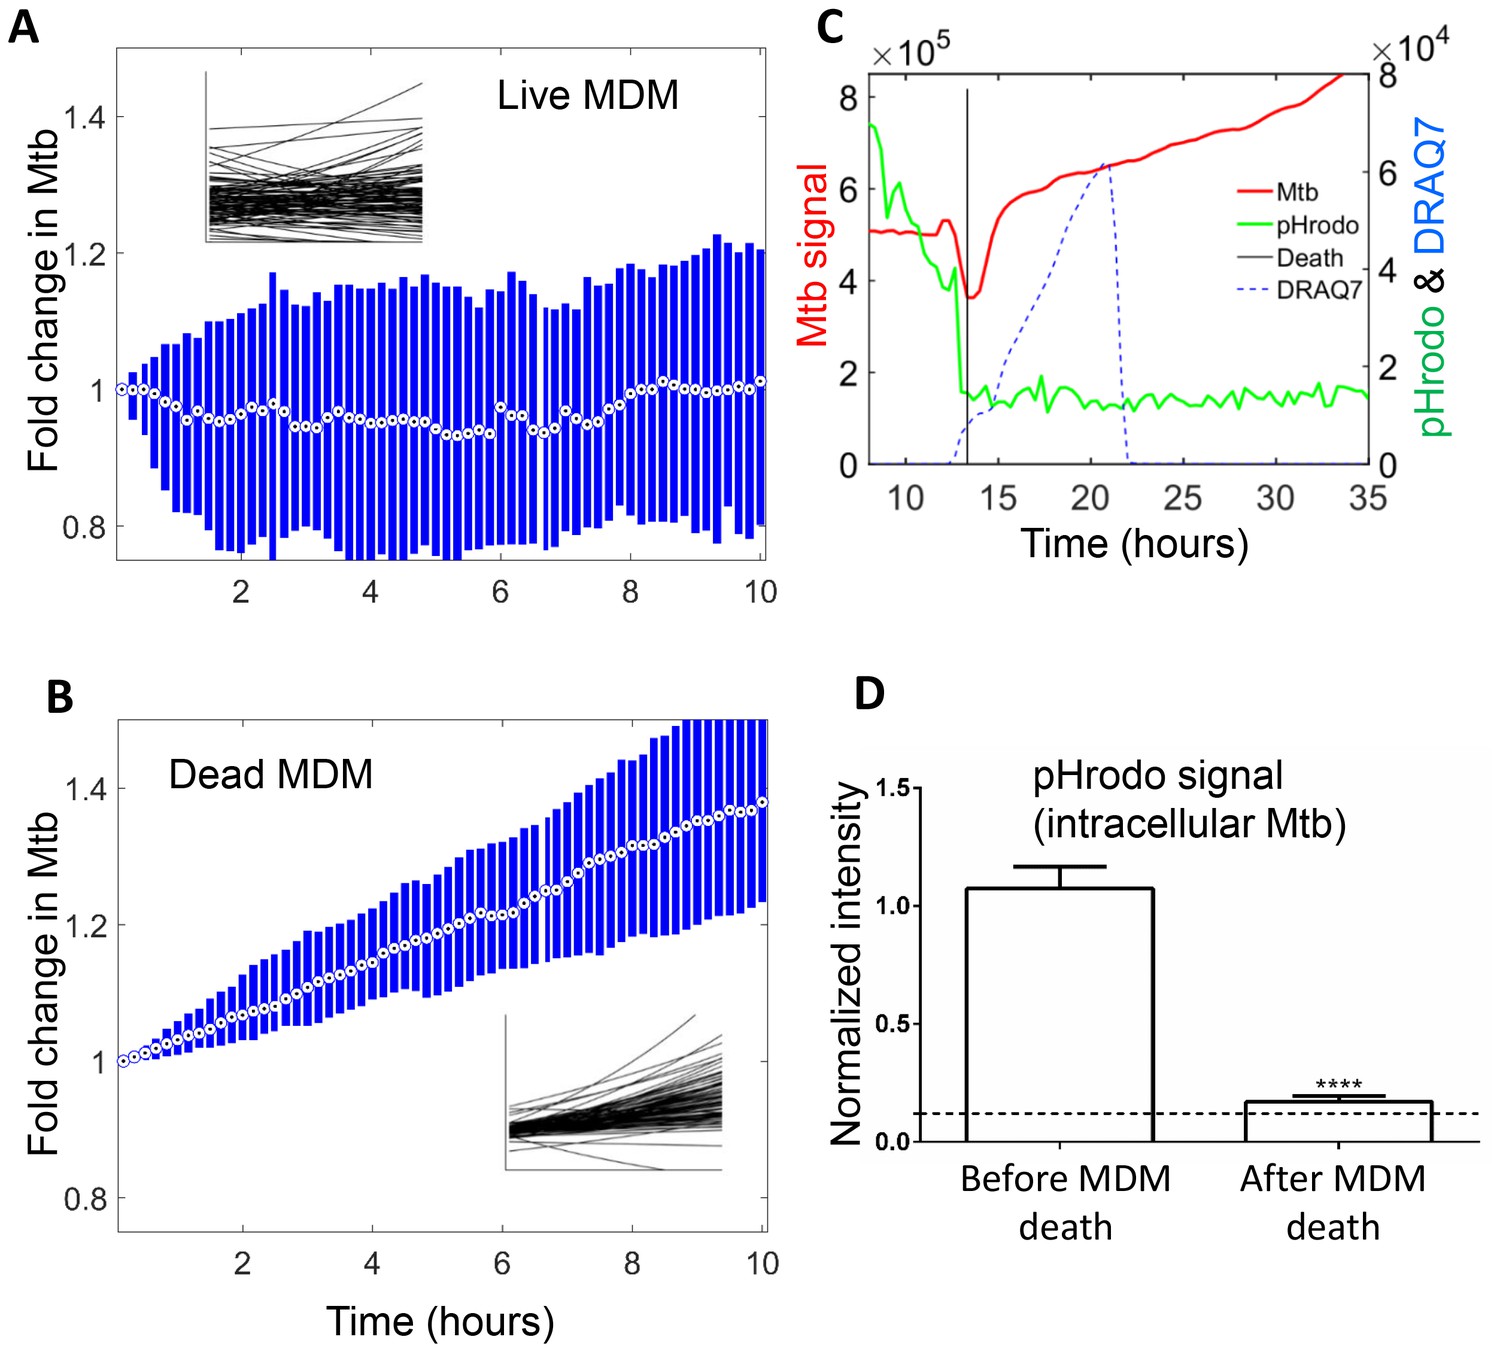
Mtb growth in macrophages before and after macrophage death.
Median (circle with dot) and interquartile range (blue rectangle) of Mtb signal in live (A) and dead cells (B). Insets show exponential fits of Mtb dynamics in the individual live (n = 101) or dead (n = 92) macrophages. X and y-scales on insets same as on main panels. The median doubling time of Mtb was >100 hr in live cells, 21.2 hr in dead cells. (C) MDMs were infected with Mtb-mCherry labelled with pHrodo Green, which fluoresces in low pH. Mtb (red line), pHrodo (green line) and DRAQ7 (dashed blue line) signals of a representative MDM tracked by time-lapse microscopy is shown. The time of cell death, as determined by DRAQ7 entry, is indicated as a vertical black line (raw data provided in Figure 6—source data 1). (D) pHrodo signal was quantified 3 hr before and following death of each cell. Means and standard error of cells (n = 74 cells) combined from two independent experiments. The dashed horizontal line represents signal threshold. ****p<0.0001, paired t-test of pHrodo signal before and after cell death.
-
Figure 6—source data 1
pHrodo signal over time.
- https://doi.org/10.7554/eLife.22028.021
Figure 7
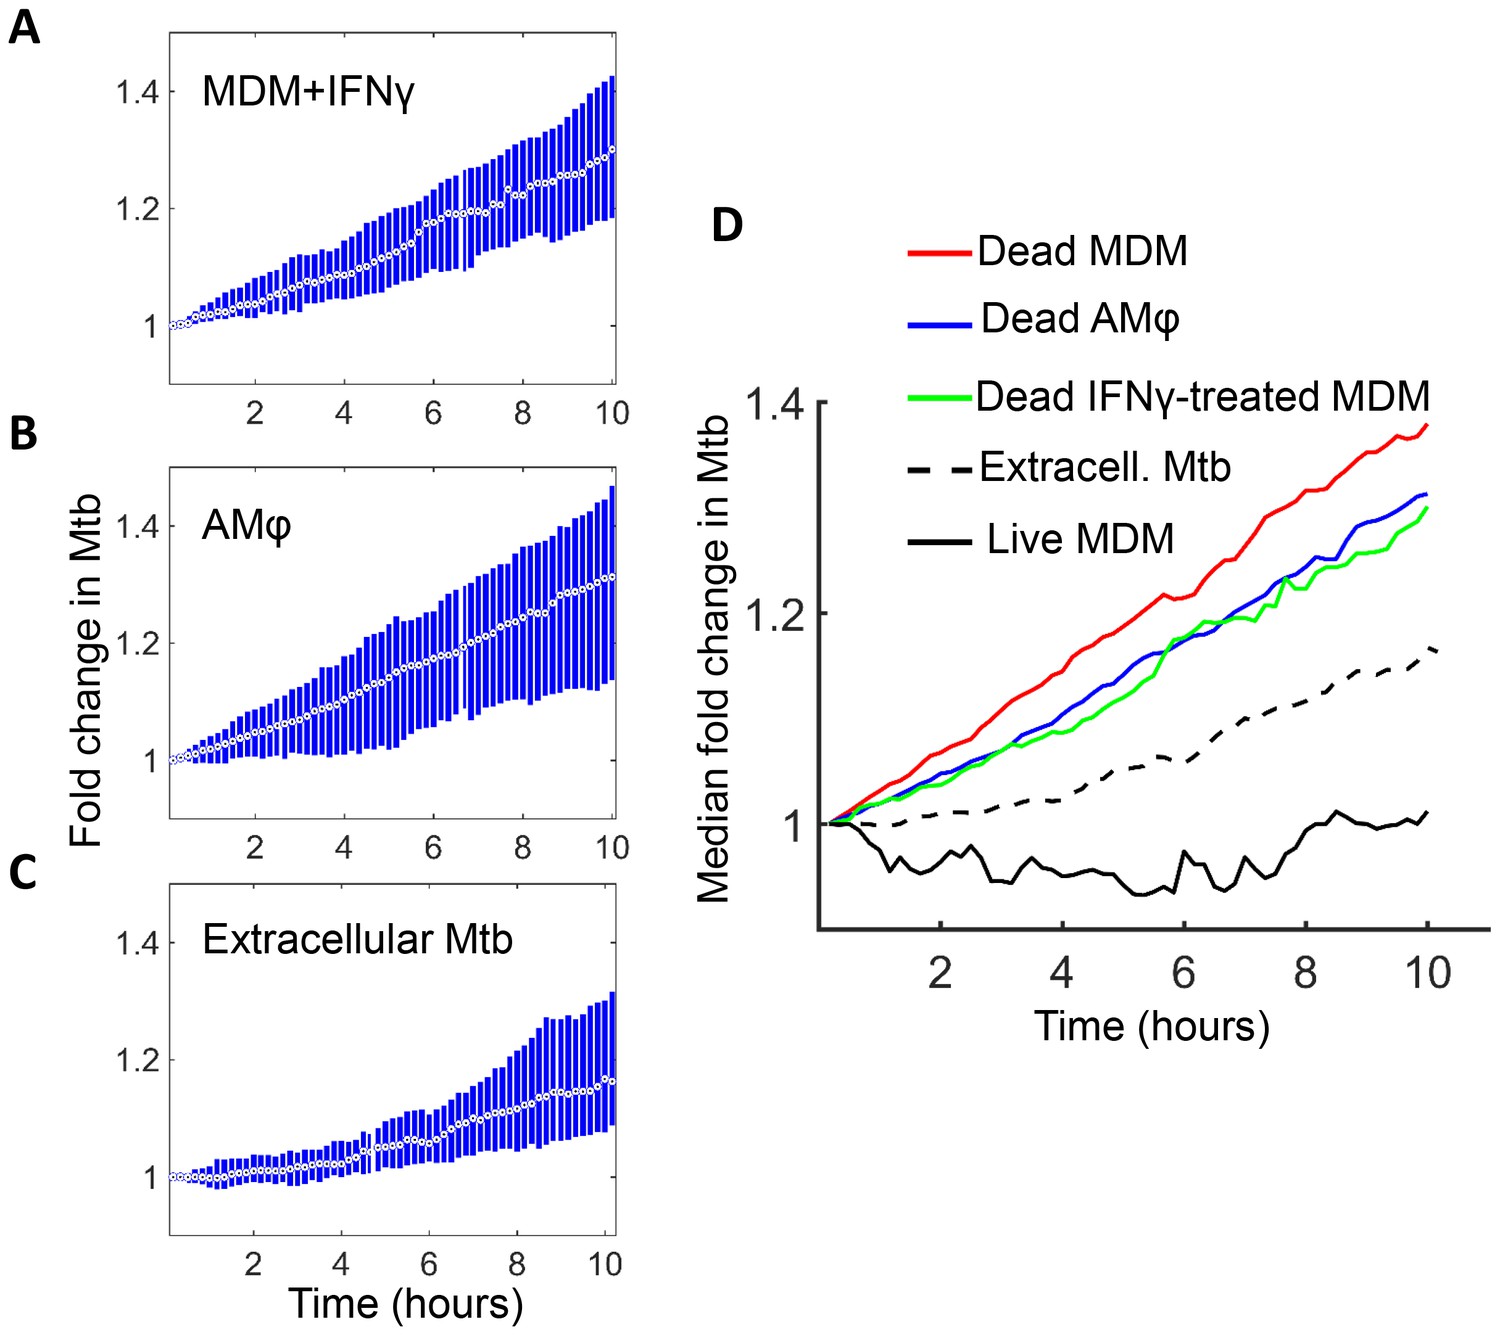
Mtb grows in IFNγ treated MDM and alveolar macrophages after cell death.
(A) MDM was exposed to IFNγ for 18 hr, then infected with Mtb and imaged (raw data provided in Figure 7—source data 1). Shown is the median fold change (circle with dot) and interquartile range (blue rectangle) of Mtb in dead infected cells. (B) Median fold change and interquartile range of Mtb in dead infected human alveolar macrophages (AMφ) isolated from bronchoalveolar lavage and infected in vitro (raw data provided in Figure 7—source data 2). (C) Median fold change in Mtb number in extracellular aggregates of Mtb over a 10 hr timespan (raw data provided in Figure 7—source data 3). (D) Combined plot of median values for all Mtb growth conditions. The number of dead cells or extracellular clumps analyzed: n = 49 (IFNγ treated MDM), n = 220 (alveolar macrophages), n = 60 (extracellular clumps). Non-IFNγ treated live and dead MDM numbers are as in Figure 6.
-
Figure 7—source data 1
Intracellular Mtb fluorescence through time in dead IFNγ treated MDM.
- https://doi.org/10.7554/eLife.22028.024
-
Figure 7—source data 2
Intracellular Mtb fluorescence through time in dead alveolar macrophages.
- https://doi.org/10.7554/eLife.22028.025
-
Figure 7—source data 3
Extracellular Mtb fluorescence through time.
- https://doi.org/10.7554/eLife.22028.026
Figure 8 with 1 supplement
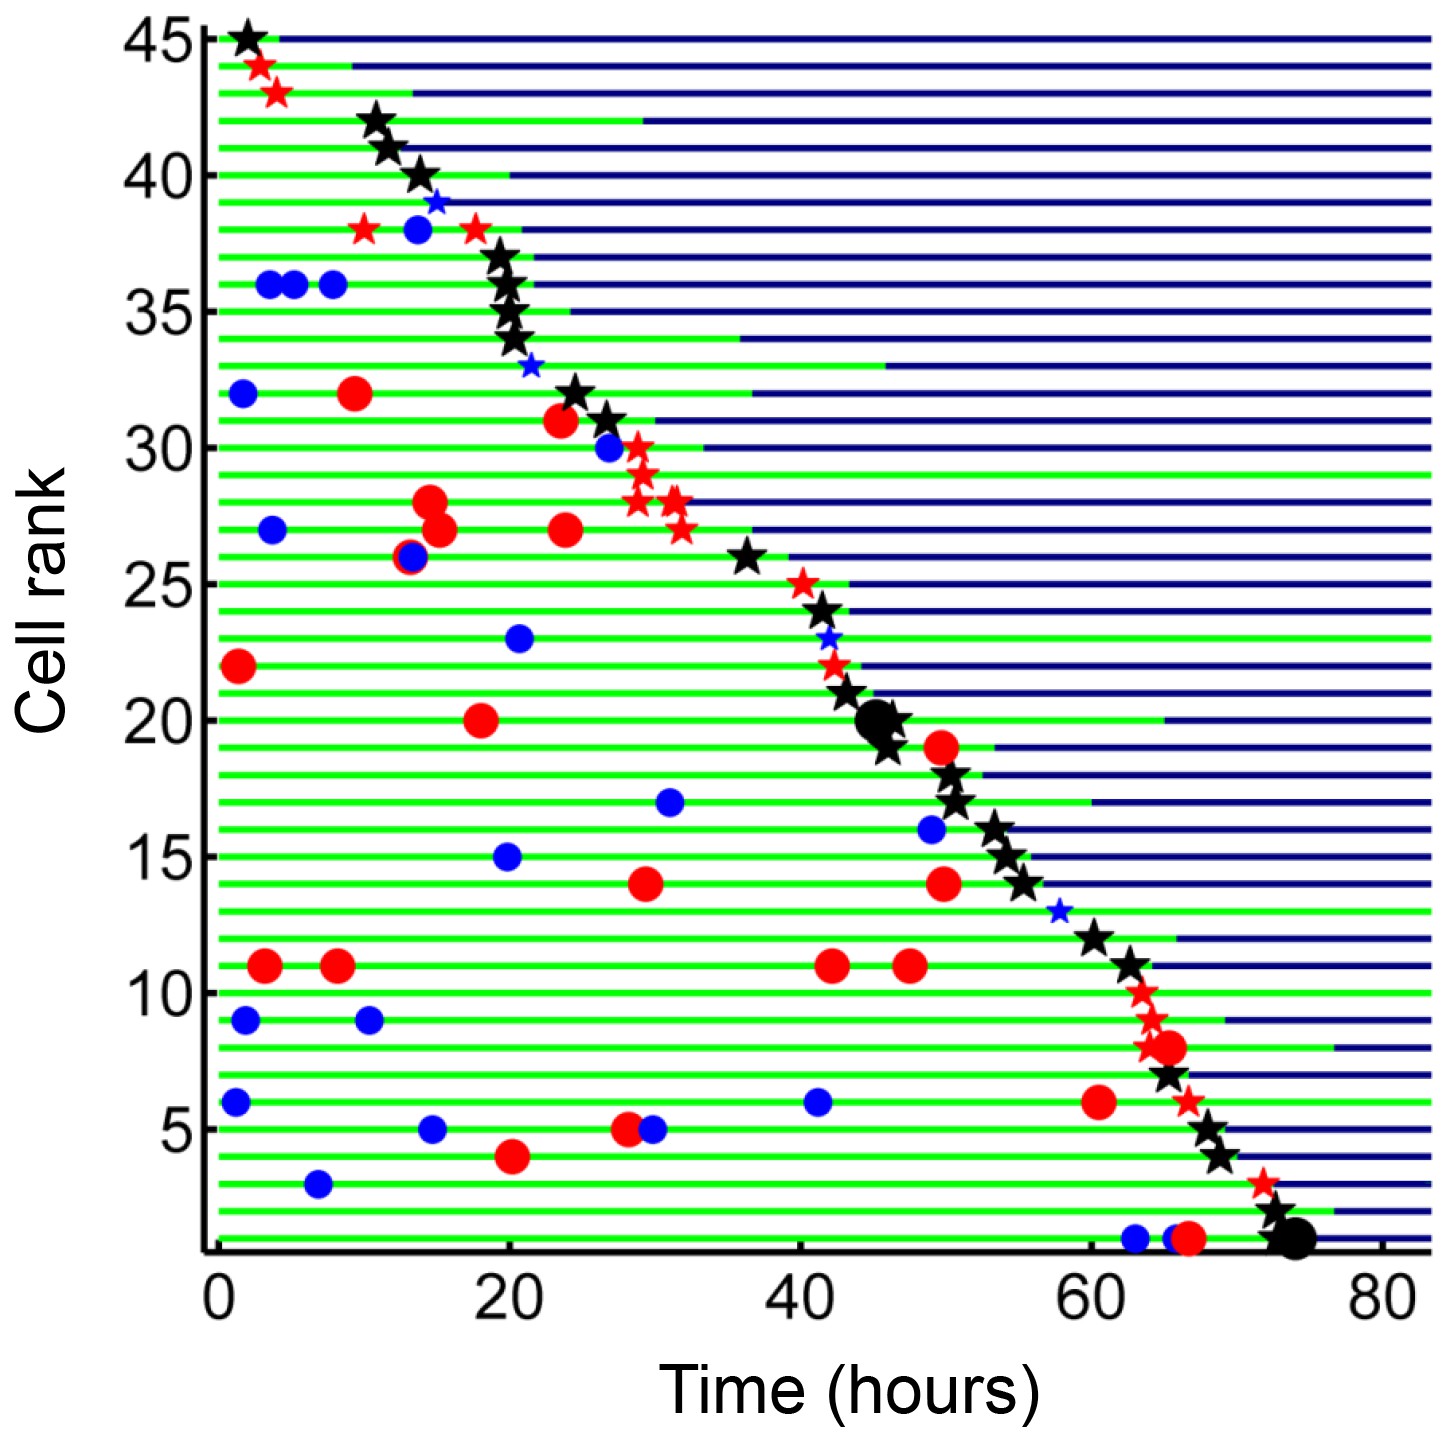
Internalization of dead infected cells leads to rapid cell death.
Cells are ranked according to the time of last pickup, with cells ranked highest internalizing earliest. The frequency of cell death was 89%. The blue circles are internalizations of aggregates of 10 or fewer Mtb, red circles are clumps of 11–49 Mtb, and black circles are >50 Mtb. Line color changes from green to dark blue at time of death. Stars are internalizations of dead infected cells.
Figure 8—figure supplement 1
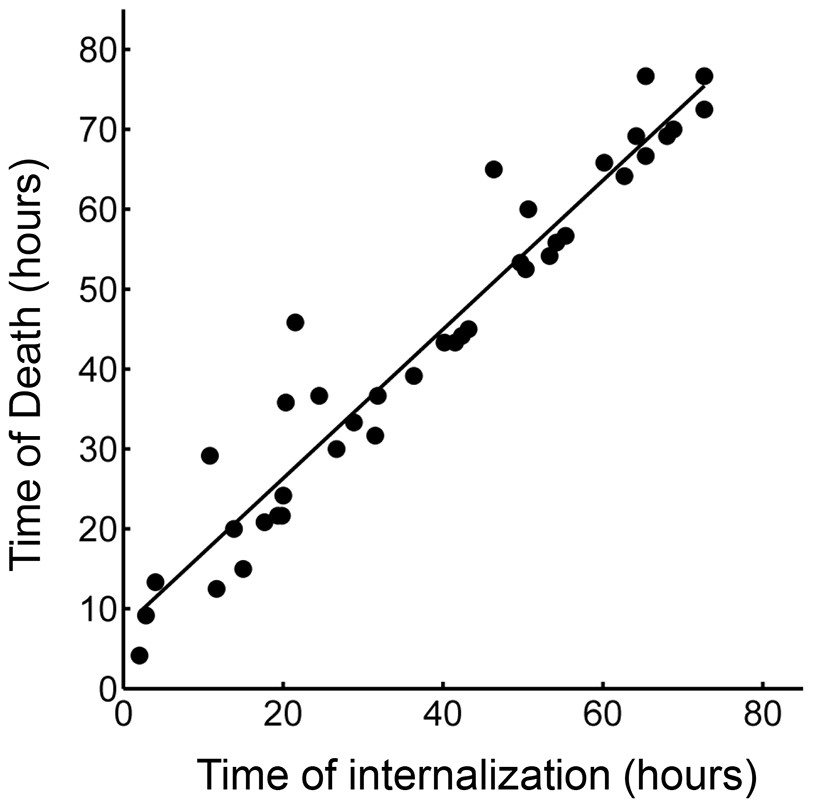
Correlation of time of last pickup and time to death in the cells internalizing a dead infected cell.
R2 = 0.93 (p=8×10⁻²³), with a median time to cell death of 3.2 hr (interquartile range 1.5 to 6 hr).
Figure 9 with 1 supplement
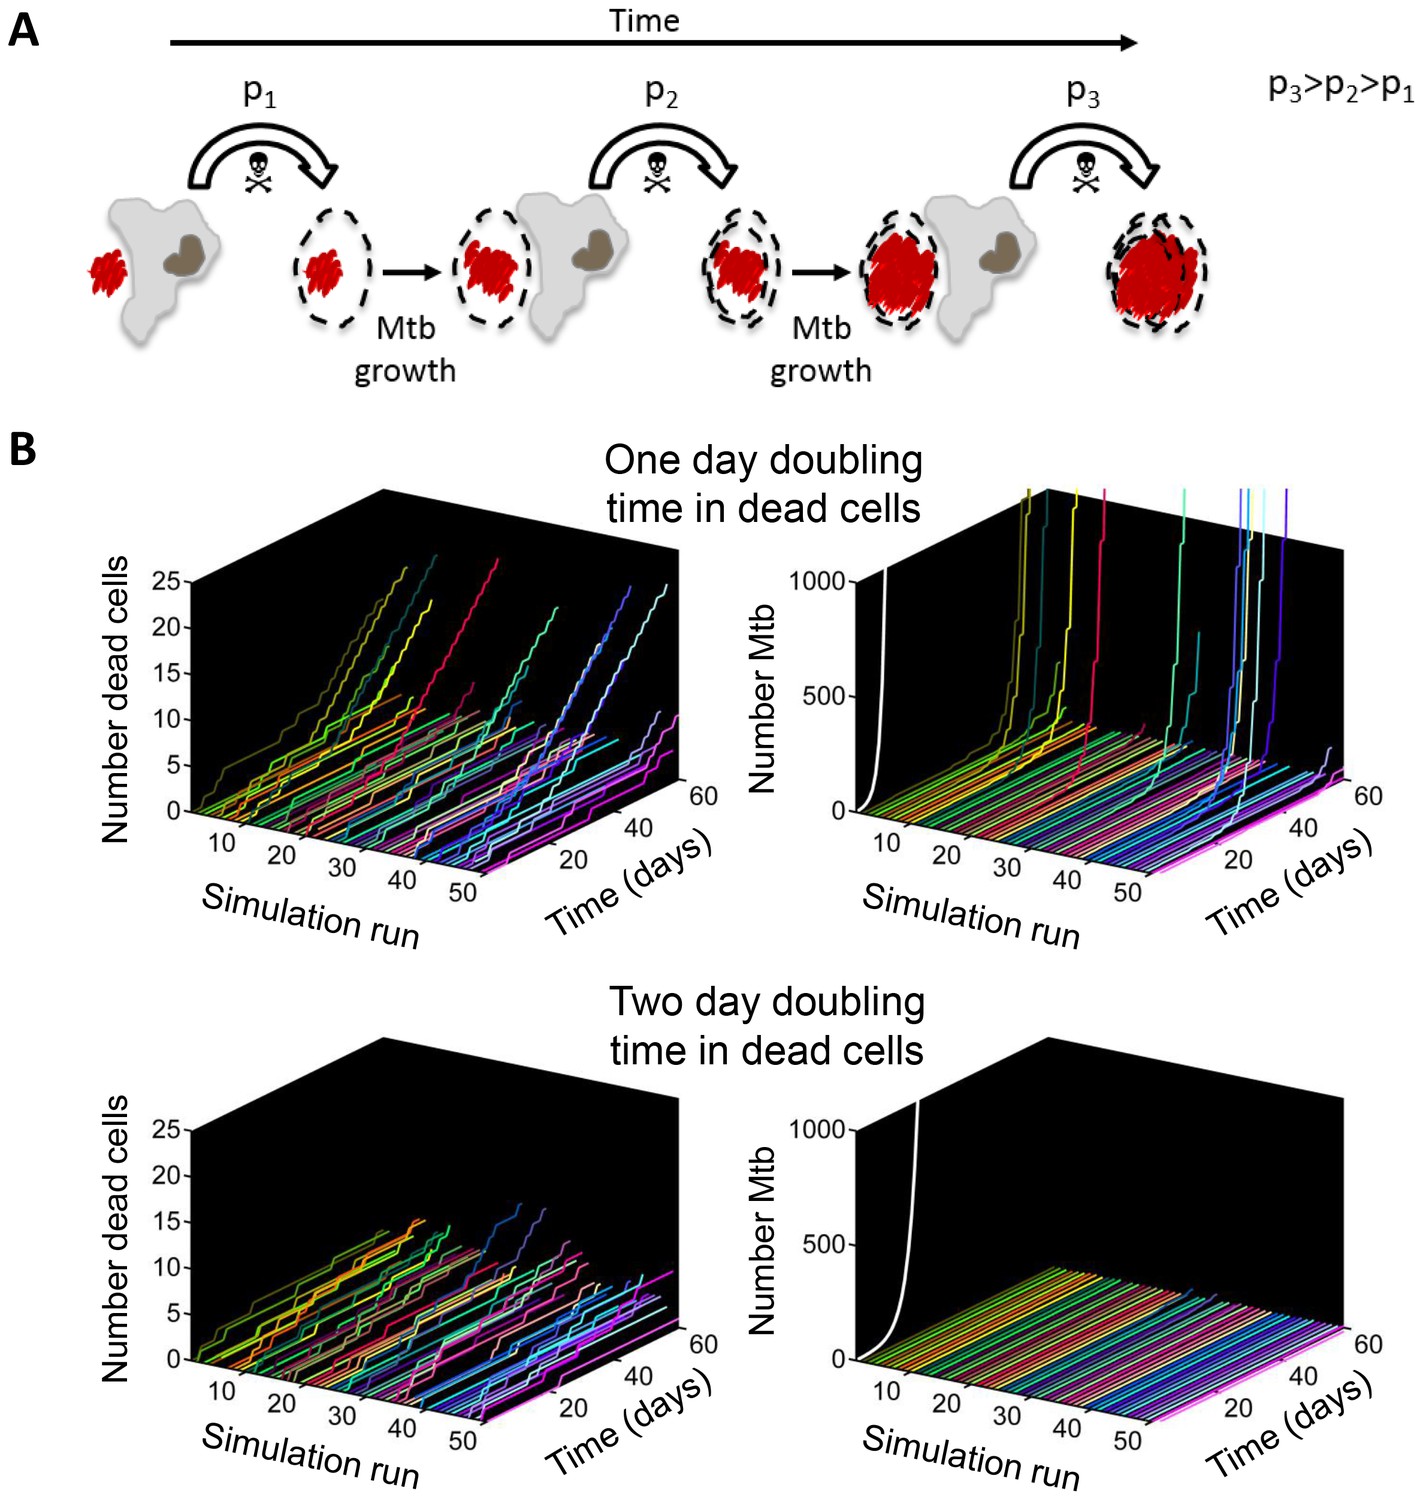
Positive feedback in Mtb infection.
(A) Schematic of the positive feedback loop. Mtb are in red, live cells are in grey and dead cells are outlined by dashed borders. Time is from left to right. Probabilities of death at time points 1, 2, and three for macrophages internalizing dead infected cells are represented by p1, p2, and p3, where p3>p2>p1 due to Mtb growth in the dead cells. (B) Results of numerical simulations of the number of dead host cells over time and the corresponding numbers of accumulated Mtb given a one day (top panels) or two day (bottom panels) doubling time inside dead infected host cells. Each line represents an independent simulation (numbered on the x-axis), time in days is on the z-axis, and the cumulative number of dead cells or number of Mtb is on the y-axis. Each run was initiated with the internalization of one bacillus inside a dead cell. White line represents Mtb extracellular growth given a one or two day doubling time. The fraction of simulations reaching 1000 or more Mtb within 60 days was 0.21 for a one day doubling time and 0.0003 for a two day doubling time (code provided as Source code 3).
Figure 9—figure supplement 1
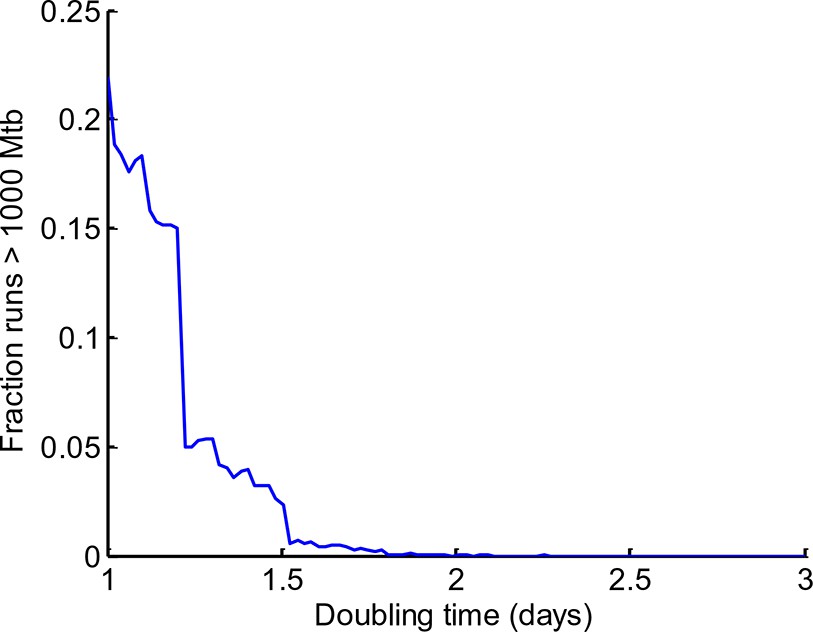
Sensitivity of Mtb expansion to doubling time in dead cells.
The stochastic simulation described in Figure 9 was repeated for doubling times ranging from 1 to 3 days, with 10,000 iterations per doubling time value. The fraction of iterations where Mtb expanded by more than three orders of magnitude (from 1 to >1000 bacilli) was calculated for each doubling time (y-axis).
Author response image 1
Videos
Video 1
Macrophage internalization of Mtb aggregates.
Mtb infections of human macrophages were imaged by time-lapse microscopy at a resolution of 10 min between image acquisitions. Macrophage borders and locations were tracked using a custom-written, Matlab based image analysis code (Source code 1). The left panel of the montage is a movie of macrophage infection. The border of the analyzed macrophage is shown as a green outline. RFP-expressing Mtb are shown in red. Mtb internalized by the cell is marked by blue ellipses. Time is hours:minutes. Scale bar is 20 µm. The graph on right shows the fluorescence signal converted to bacterial numbers in the analyzed macrophage. Timing of internalizations of Mtb clumps containing varying numbers of bacilli as detected from the movie are shown as vertical red lines on the graph. Macrophage death is marked by a vertical black line of x’s appearing at the point of cell death.
Video 2
Death of an Mtb-infected macrophage.
MDMs were infected with Mtb H37Rv-RFP (red) and imaged in the presence of the viability dye DRAQ7 (green). The entry of DRAQ7 corresponds to the time of cell death. Scale bar is 20 µm.
Video 3
Pyroptotic death of macrophages.
Macrophages were sensitized with 1 µg/ml LPS for 3 hr, then treated with 20 µM nigericin to induce pyroptosis. Cells were imaged in the presence of DRAQ7 (green).
Video 4
Cisplatin-Induced cell death.
Macrophages were treated with 50 µM cisplatin and imaged in the presence of DRAQ7 (green). Scale bar is 20 µm.
Video 5
Mtb grows inside a dead macrophage treated with IFNγ prior to infection.
The left panel of the montage is a movie of macrophage infection at a resolution of 10 min between image acquisitions. The border of the analyzed macrophage is shown as a green outline, and the presence of DRAQ7 is shown in blue. RFP-expressing Mtb are in red. Time is hours:minutes. Scale bar is 20 µm. The graph on right shows the fluorescence signal converted to bacterial numbers in the analyzed macrophage. Timing of macrophage death was determined by the lack of internal movement and confirmed by a DRAQ7 entry (vertical line of x’s).
Video 6
Loss of phagosome acidification upon Mtb induced host cell death.
Mtb were stained with the pH detection dye pHrodo at 100 µM and used to infect MDM in the presence of the cell death indicator dye DRAQ7. pHrodo fluorescence is shown in green, mCherry-expressing Mtb in red, and DRAQ7 fluorescence in blue. Time is hours:minutes. Scale bar is 20 µm.
Video 7
Cell death cascade following phagocytosis of a dead infected macrophage.
The borders of four macrophages are shown as green, yellow, magenta, or blue outlines. RFP-expressing Mtb are shown in red. Time is hours:minutes. Scale bar is 20 µm.
Additional files
-
Source Code 1
Source code 1- Image analysis script.
- https://doi.org/10.7554/eLife.22028.032
-
Source Code 2
Bootstrap script used Figure 1—figure supplement 5B.
- https://doi.org/10.7554/eLife.22028.033
-
Source Code 3
Figure 9B simulation.
- https://doi.org/10.7554/eLife.22028.034
Download links
A two-part list of links to download the article, or parts of the article, in various formats.
Downloads (link to download the article as PDF)
Open citations (links to open the citations from this article in various online reference manager services)
Cite this article (links to download the citations from this article in formats compatible with various reference manager tools)
Intracellular growth of Mycobacterium tuberculosis after macrophage cell death leads to serial killing of host cells
eLife 6:e22028.
https://doi.org/10.7554/eLife.22028


