Point of View: Is cell size a spandrel?
- Harvard University, United States
Figures
Figure 1
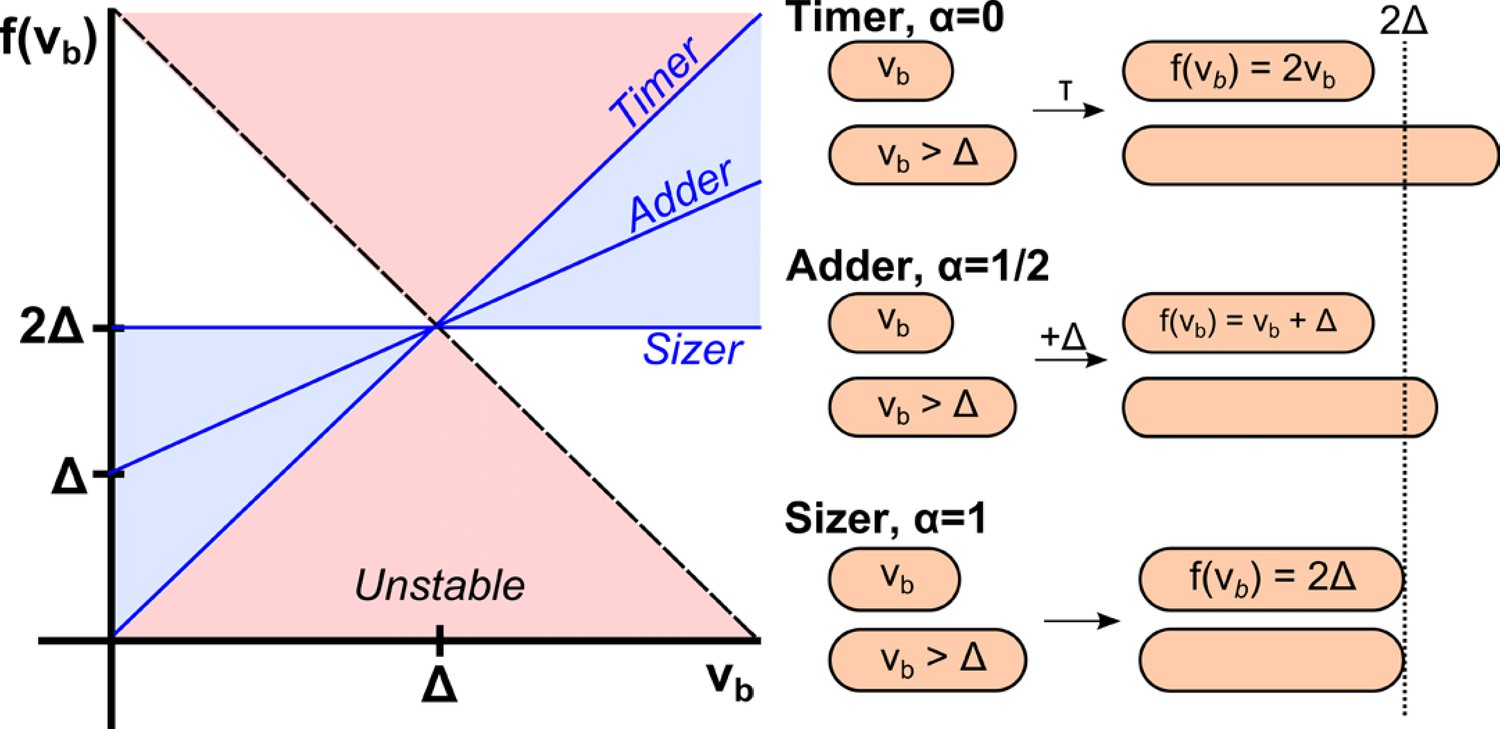
Phenomenological models for cell size control in bacteria.
This graph shows how the size at division, , depends on the size at birth (x-axis) in three different models. The parameter is related to the slope of the function, and can continuously interpolate across different models. Its value can be determined from single-cell level correlations (Amir, 2014; see Marantan and Amir, 2016 for a recent generalization of this phase diagram). As increases from 0 to 1, the correlations between mother and daughter cell sizes become weaker, yet the size distribution becomes narrower. The prevailing model for a critical size at initiation is effectively a ‘sizer’, and is inconsistent with recent experimental data supporting an ‘adder’.
Figure 2
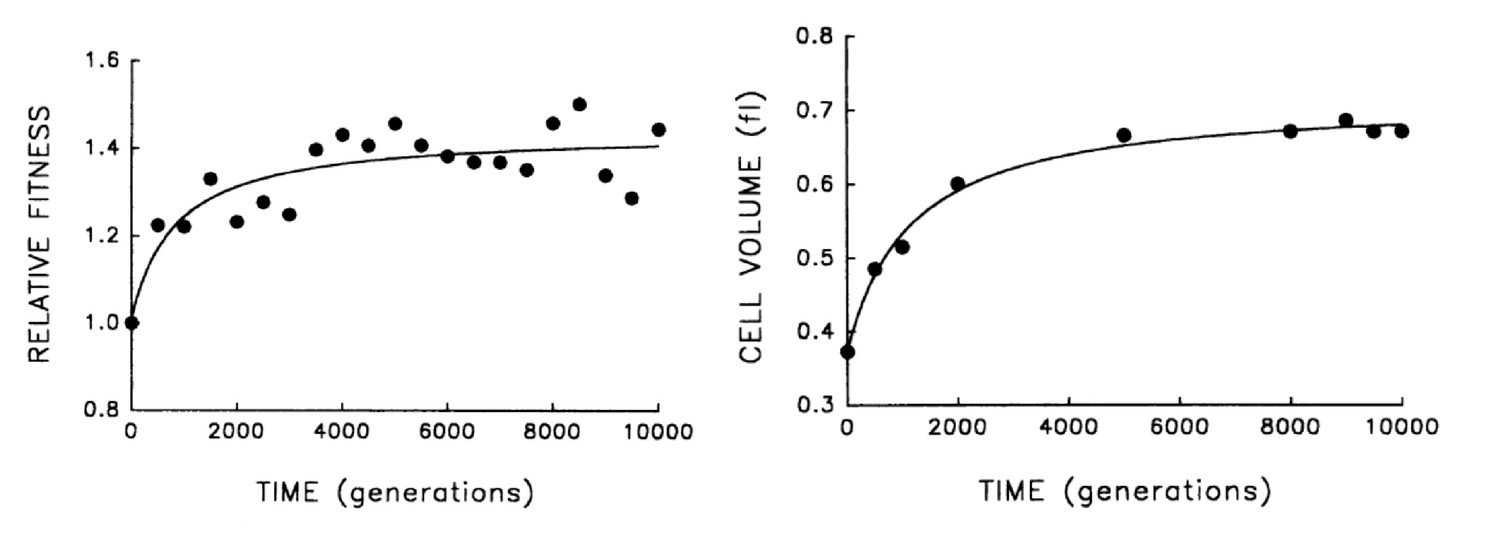
Bacterial evolution and growth regulation.
E. coli cells evolving in a culture tube show both increasing fitness over time as well as increasing size. This can be naturally explained by a simple, specific regulation strategy, consistent with additional experiments. Figure adapted from Lenski and Travisano, 1994, with permission.
Download links
A two-part list of links to download the article, or parts of the article, in various formats.
Downloads (link to download the article as PDF)
Open citations (links to open the citations from this article in various online reference manager services)
Cite this article (links to download the citations from this article in formats compatible with various reference manager tools)
Point of View: Is cell size a spandrel?
eLife 6:e22186.
https://doi.org/10.7554/eLife.22186


