Fundamental bound on the persistence and capacity of short-term memory stored as graded persistent activity
- University of California, Berkeley, United States
- Hebrew University, Israel
- University of Oxford, United Kingdom
- University of Texas at Austin, United States
Figures
Figure 1 with 1 supplement
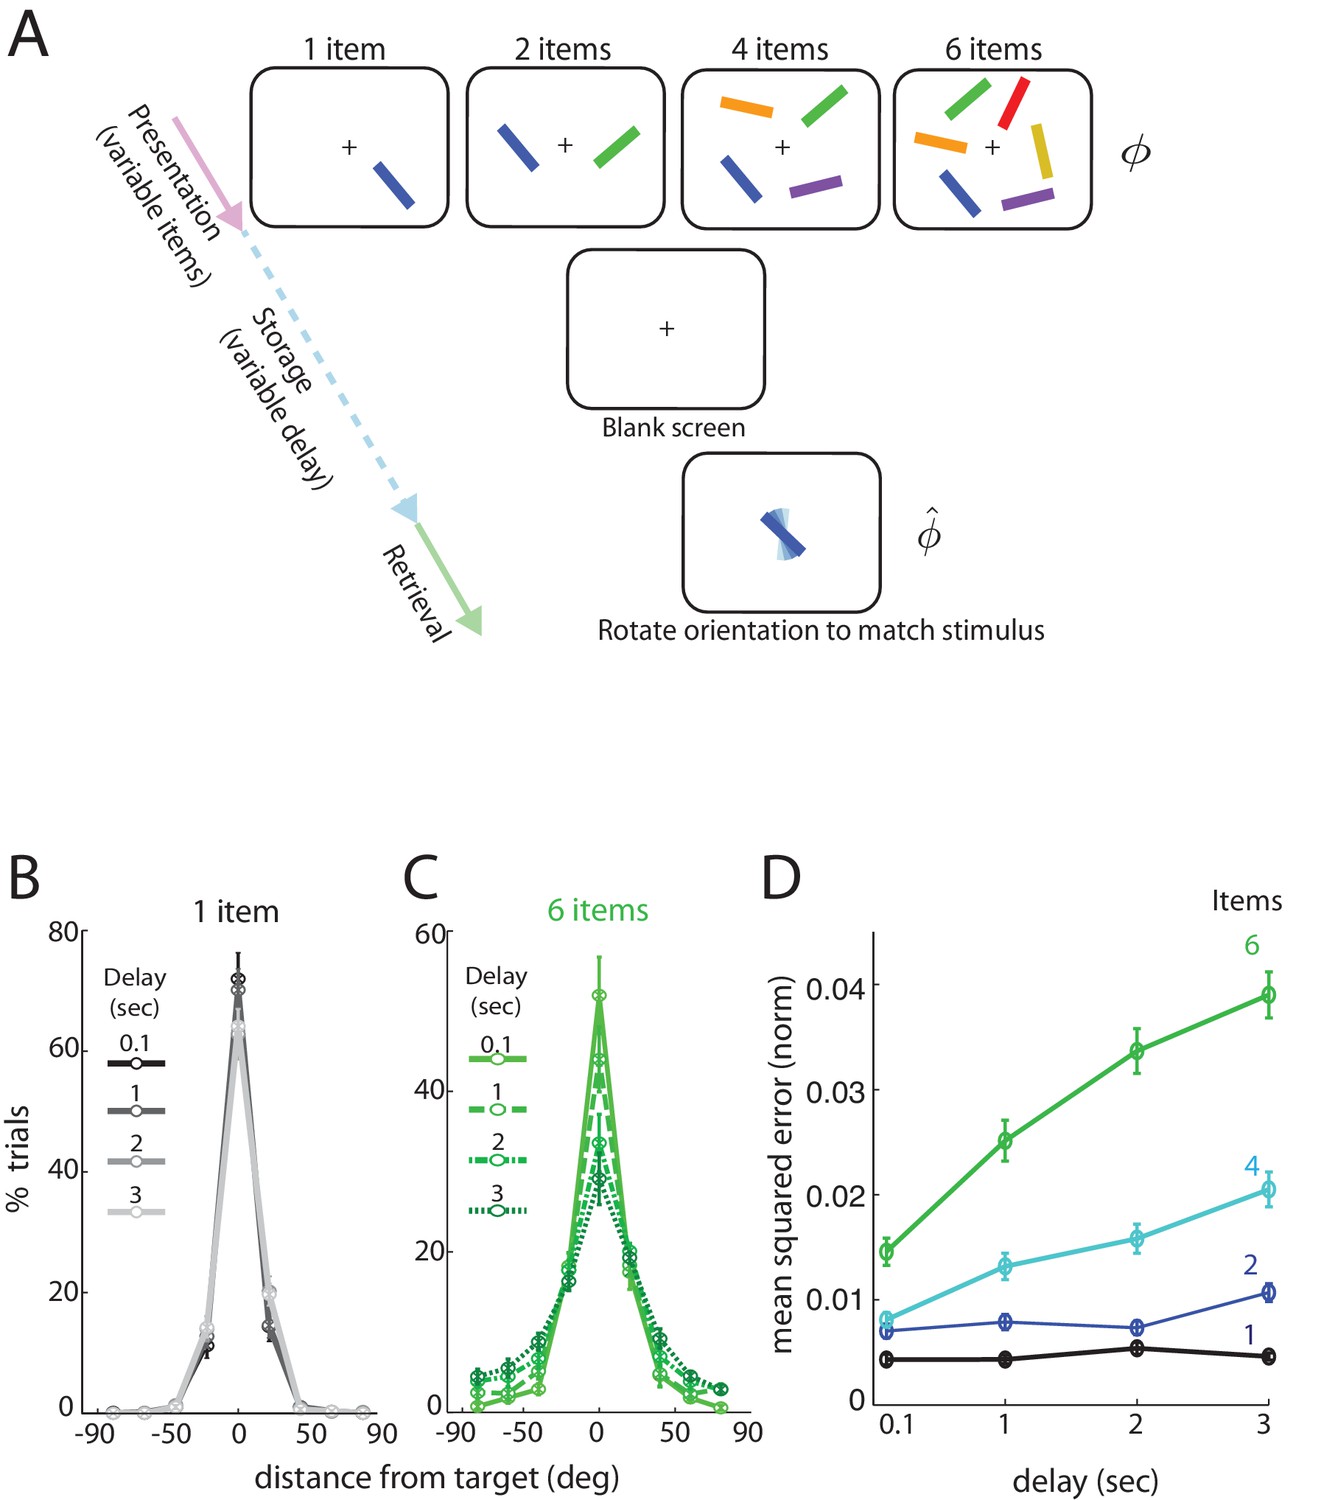
Human performance on an analog delayed orientation matching task with variable item number and storage duration.
(A) Setup of a delayed orientation estimation task to probe human short-term memory. A variable number of bars with different colors and uniformly randomly drawn orientations are presented for 500 msec. Following a variable delay, the subjects are asked to adjust the orientation of a cue bar, by using a dial, to match the remembered orientation of the bar of the same color from the presentation. (B) Distribution of responses for one item, plotted so the target orientation is centered at zero. Different shades and line styles represent different delays. Note that responses did not vary significantly with storage duration. (C) Distribution of responses for six items varies with storage duration. (D) Mean squared error of recall on the task of Figure 1A (averaged across subjects and trials, and normalized by , the square of the range of the stored variable), as item number and delay duration are systematically varied. Error bars denote SEM across participants.
-
Figure 1—source data 1
Experiment data used in the manuscript.
Subjects view a display with several () differently colored and oriented bars that are subsequently removed for the storage (delay) period. Following the storage period, subjects were cued by one of the colored bars in the display, now randomly oriented, and asked to rotate it to its remembered orientation. Bar orientations in the display were drawn randomly from the uniform distribution over all angles (thus the range of orientations lies in the circular interval ) and the report of the subject was recorded as an analog value. (See also [Pertzov et al., 2017]).
- https://doi.org/10.7554/eLife.22225.004
Figure 1—figure supplement 1
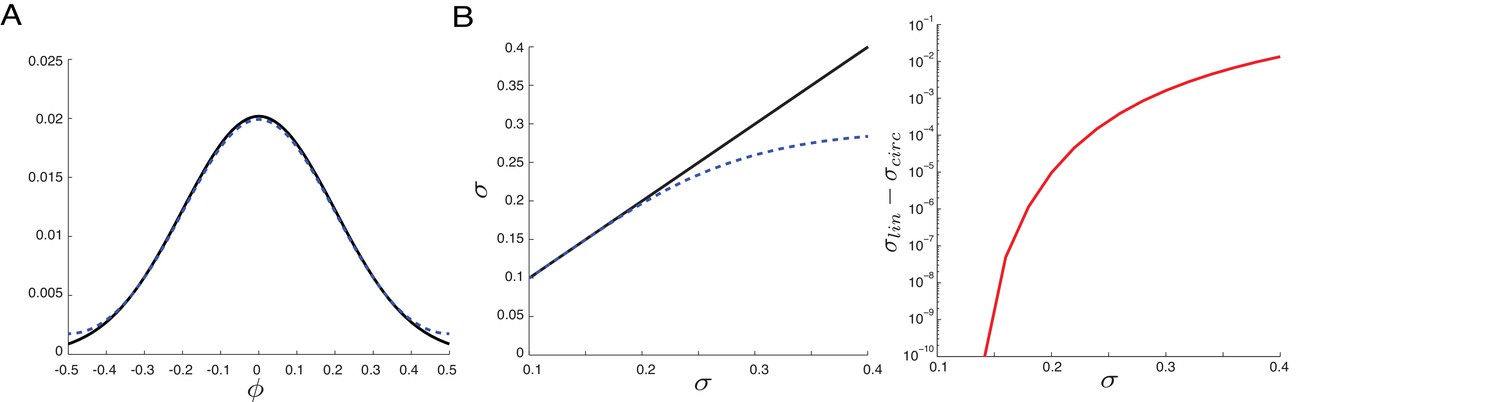
Similar variance statistics for bounded versus unbounded domains over range relevant for performance data.
Circular nature of memory variable is unimportant in computing response statistics. (A) A normal distribution with standard deviation over an unbounded domain (solid black curve), together with the corresponding wrapped normal distribution (dashed blue), wrapped around the circular interval . Note the strong similarity of these two distributions: the wrapped normal barely deviates from the corresponding normal distribution for this value of standard deviation (corresponding to a variance of ). (B) Left: the computed standard deviation of the distributions in (A), as a function of the standard deviation of the unbounded normal distribution used to generate both the distributions (solid black: normal; dashed blue: wrapped normal). Right: The difference of the two curves from plot at top. Note that the computed standard deviation in the wrapped normal distribution only departs substantially (by more than 5%) from that of the normal distribution around or . All the responses in the experiments, both the across-subject averages reported in the main paper as well as the individual performance averages reported in the Appendix, exhibit a MSE (normalized by squared range) smaller than . Thus, there is little effect of the boundedness of the angular variable in the results, even though the range of the coded variable is only radians.
Figure 2
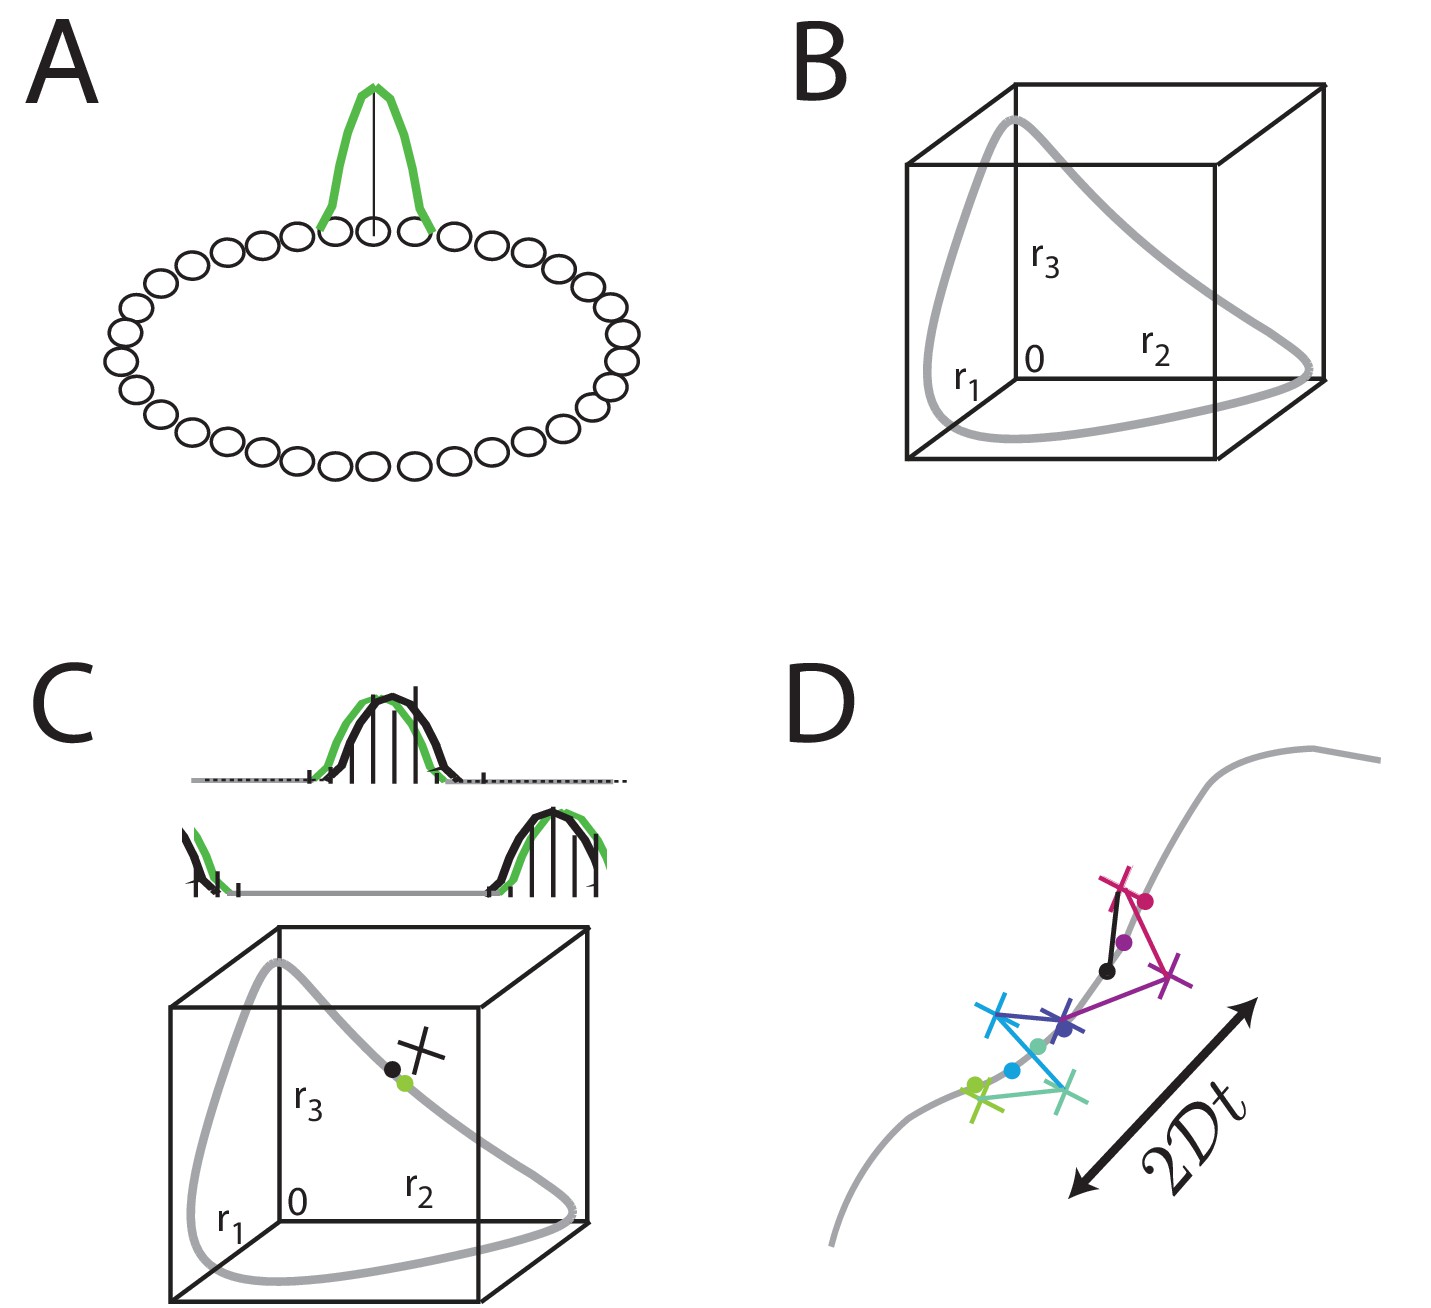
Analog persistent activity networks and information decay over time.
(A) In a ring network, each neuron excites its immediate neighbors and inhibits all the rest (weight profiles not shown). A single bump of activity (green) is a steady state of such a network of such a network, as are all its translations around the ring. (B) A ‘state-space’ view of activity in the ring network: each axis represents the activity of one neuron in the network; if there are neurons in the network, this state-space plot is -dimensional. Any point inside the state space represents some possible instantaneous configuration of activity in the neurons. The grey curve represents the set of steady states, which traces a 1-dimensional manifold because the stable states are just translations of a canonical activity bump along a single dimension. (C) Top: Grey: a schematic non-noisy activity bump; black vertical lines: schematic spikes emitted by neurons after the state is initialized according to the grey curve. Black curve: A best-fit activity profile for the emitted spikes is shifted relative to the original grey bump simply because of the stochastic spikes. Bottom: the state space view of (B), with the addition of the state corresponding to the non-noisy initial activity bump (grey filled circle), the noisy spiking state (black cross), and the projection of the noisy spiking state to the best-fit or closest non-noisy activity profile (black filled circle). (D) Over longer periods of time, activity fluctuations seen in (C) drive a diffusive drift (random walk) along the manifold of stable states, with a squared error that grows linearly with time.
Figure 3 with 4 supplements
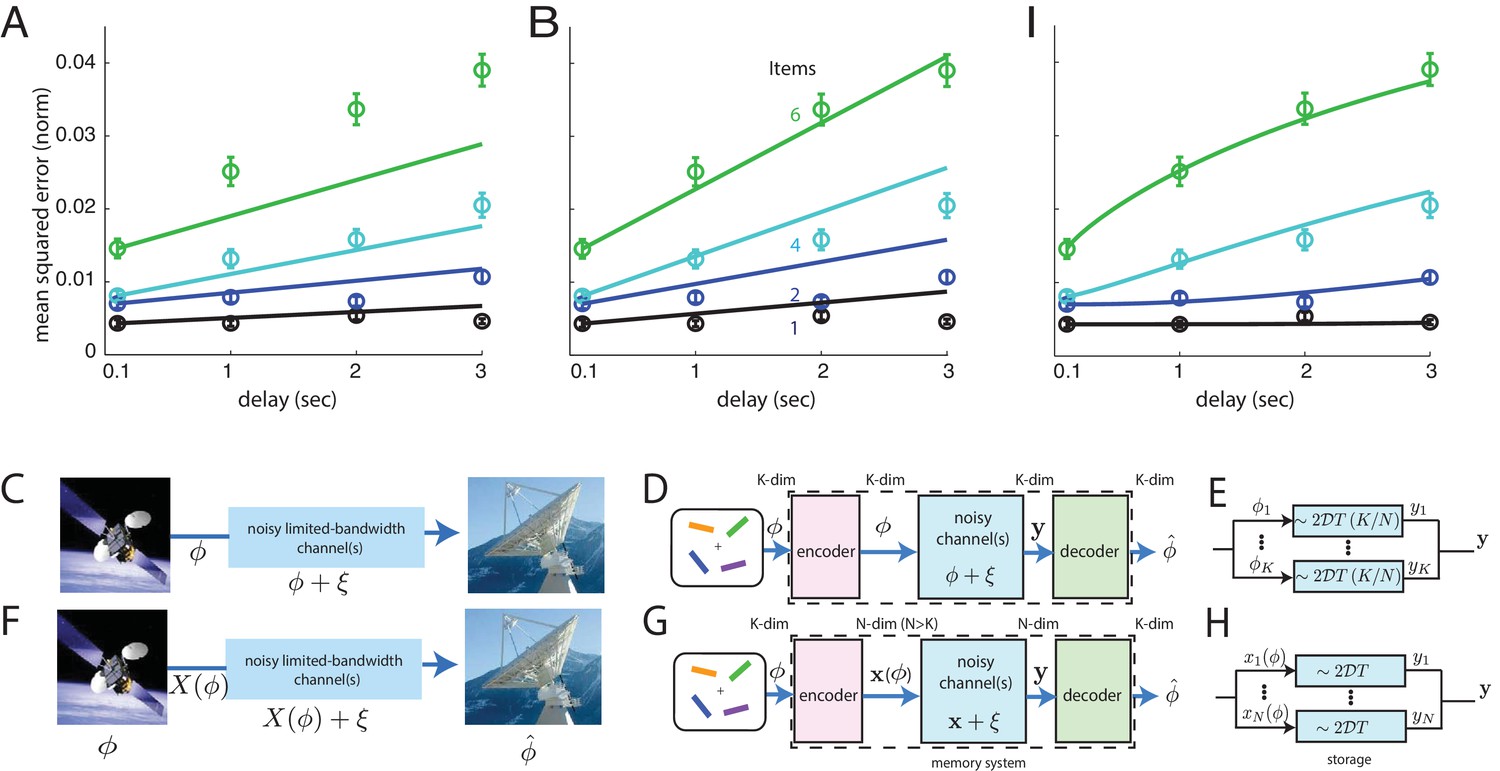
Comparison of direct and coded storage models using persistent activity networks with human memory performance.
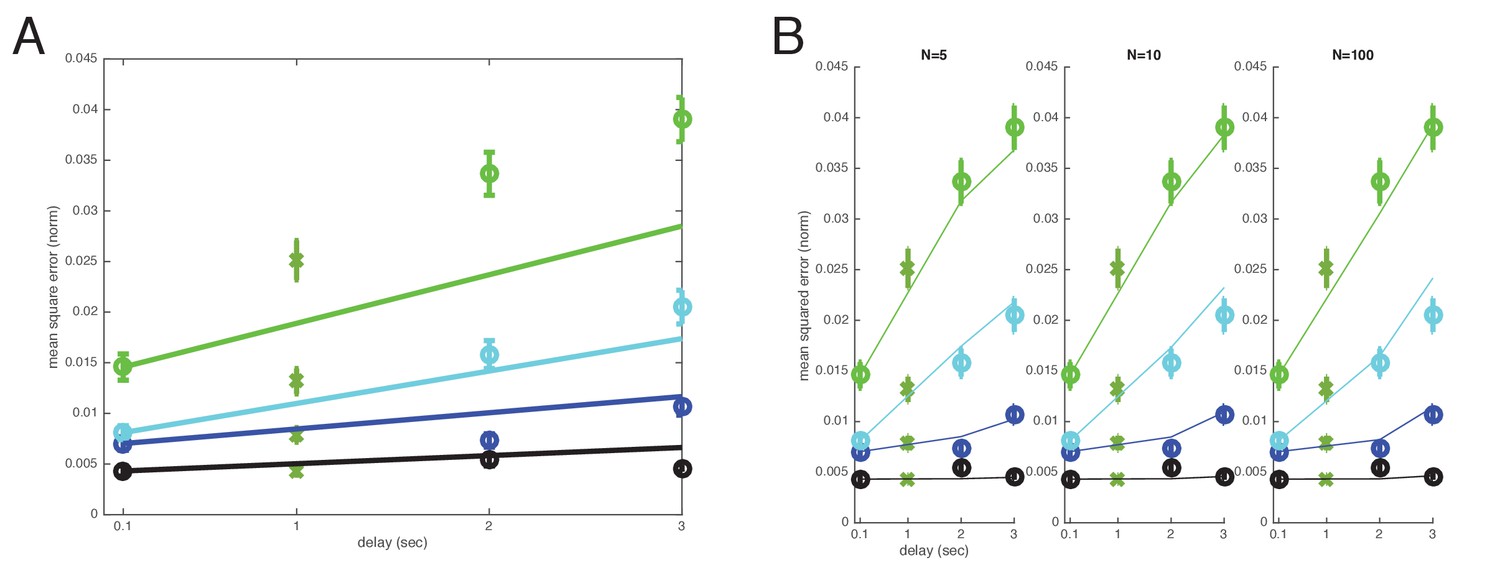
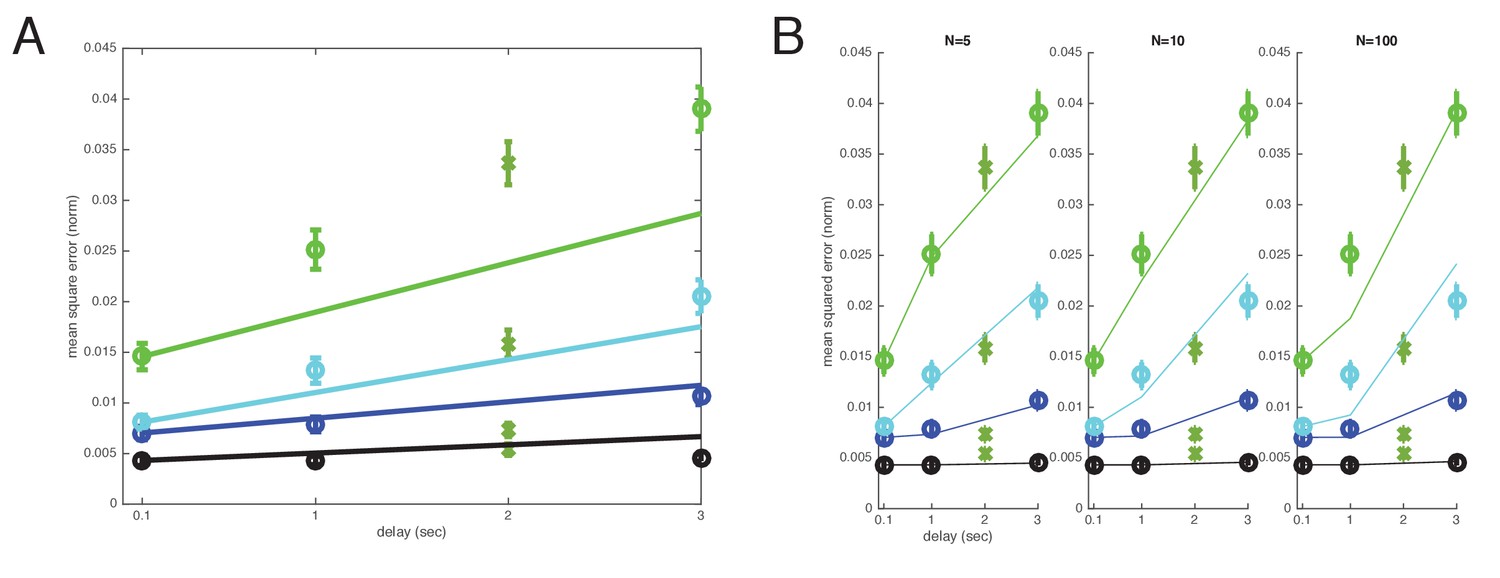
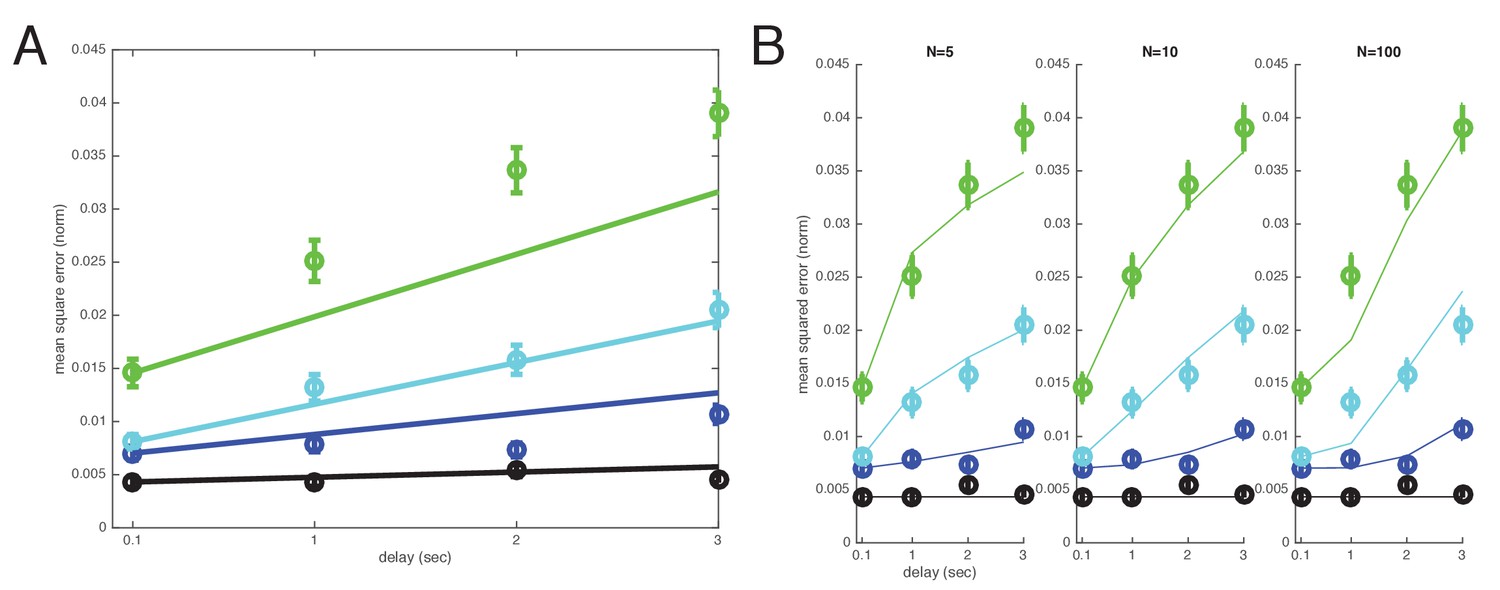
(A) Lines: predictions from the direct storage model for human memory. The theory specifies all curves with a single free parameter, after shifting each curve to the measured value of performance at the shortest delay interval of 100 ms. Fits performed by weighted least squares (weights are inverse SEM). (B) Similar to (A), but parameters fit by ordinary least-squares to only the 6-item curve; note the discrepancy in the 1- and 2-item fits. (C–E) Information () is directly transmitted (or stored) in a noisy channel, and at the end an estimate of of is recovered. (C) A scenario involving space-to-earth communication. (D) The scenario for direct storage in noisy memory banks (the nosy channels); the encoder and decoder are simply the identity transformation in the case of direct storage and hence do nothing. (E) The pieces of information in the -dimensional vector are each represented in one of continuous attractor neural networks of size neurons each. Each attractor representation accumulates squared error linearly over time and inversely with . (F–H) Same as (C–E), but here information is first encoded () with appropriate structure and redundancy to combat the channel noise. A good encoder-decoder pair can return an estimate that has lower error than the direct strategy, even with similar resource use, mitigating the effects of channel noise for high-fidelity information preservation. (H) The -dimensional is encoded as the (-dimensional) codeword , each entry of which is stored in one of persistent activity networks. Squared error in the channel grows linearly with time as before; however, the resources used to build channels of quality from before are redirected into building channels of poorer quality (assuming ). The decoder estimates from -dimensional output . (I) Same as (A), but the model lines are the lower-bound on mean-squared error obtained from an information-theoretic model of memory with good coding. (Model fit by weighted least-squares; the theory specifies all curves with two free parameters, after shifting each curve to the measured value of performance at the shortest delay interval of 100 ms).
Figure 3—figure supplement 1
Cross-validated comparison of the direct and well-coded storage models after leaving out s datapoints.
The A) direct and B) well-coded storage models are fit to the data, excluding the datapoints at time (s). This is a leave-one-out or jackknife cross-validation procedure. The well-coded model predicts the withheld datapoints with smaller error than the uncoded/direct coding model. Direct model: Sum of weighted least-squares error (WLS error): 103.3984; sum of squares error: 0.022888; squared error on held-out ms point: 0.0043414. Well-coded model (with minimum error near ): WLS error: 11.3172; sum of squares error: 0.0016302; squared error on held-out ms point: 0.0011631. BIC score: Delta BIC = BIC(direct model all items WLS) - BIC(coded model all items WLS): 11.4039, in favor of the well-coded model.
Figure 3—figure supplement 2
Cross-validated comparison of the direct and well-coded storage models after leaving out s datapoints.
The A) direct and B) well-coded storage models are fit to the data, excluding the datapoints at time (s). This is a leave-one-out or jackknife cross-validation procedure. The well-coded model predicts the withheld datapoints with smaller error than the uncoded/direct coding model. Direct model: WLS error: 79.2137; sum of squares error: 0.015975; squared error on held-out ms point: 0.010418. Well-coded model (with minimum error near ): WLS error: 2.9575; sum of squares error: 0.0007505; squared error on held-out ms point: 0.00083856. BIC scores: Delta BIC = BIC(direct model all items WLS) - BIC(coded model all items WLS): 32.4666, in favor of well-coded model.
Figure 3—figure supplement 3
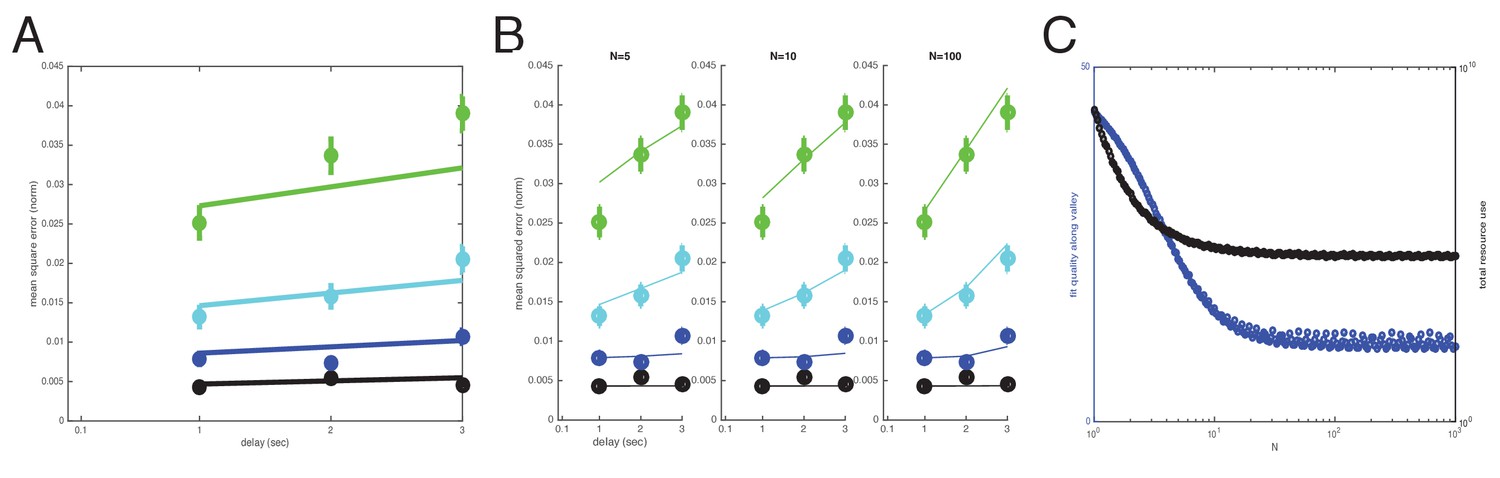
Comparison of models after removal of the shortest (100 ms) delay time-point under the argument that it represents a different memory process (iconic memory).
The ms point is now used as the baseline level to analyze the time degradation of stored memory, instead of the ms point, which is deleted altogether from the analysis. The argument for this analysis is that ms might overlap with the process of iconic memory and should not be used in a comparison across the longer-latency short-term memory interval datapoints. The (A) direct model and (B) well-coded model, where (C) fit-quality plateaus to a nearly asymptotic constant with increasing (but the asymptotic value is nearly achieved by ). Direct model: WLS error: 37.317; sum of squares error: 0.0080949. Well-coded model (no minimum in error in interior of range; asymptotic decay of error with , with near-asymptotic value reached by ; here, we use , but similar results including BIC scores for : WLS error: 12.493; sum of squares error: 0.0019871. Delta BIC = BIC(direct model all items WLS) - BIC(coded model all items WLS): 24.8239, in favor of the well-coded model.
Figure 3—figure supplement 4
Redefining item numbers as (instead of ) to take into account the memorization of item color in addition to orientation.
1. Fits with direct storage model and (B) well-coded model. For the well-coded model, fit quality reaches a minimum around N = 10. Direct model: WLS error: 80.4649; sum of squares error: 0.016218. Well-coded model (with minimum error near ): WLS error: 12.4617; sum of squares error: 0.0016035. Delta BIC = BIC(direct model all items WLS) - BIC(coded model all items WLS): 68.0032 in favor of the coded model.
Figure 4 with 2 supplements
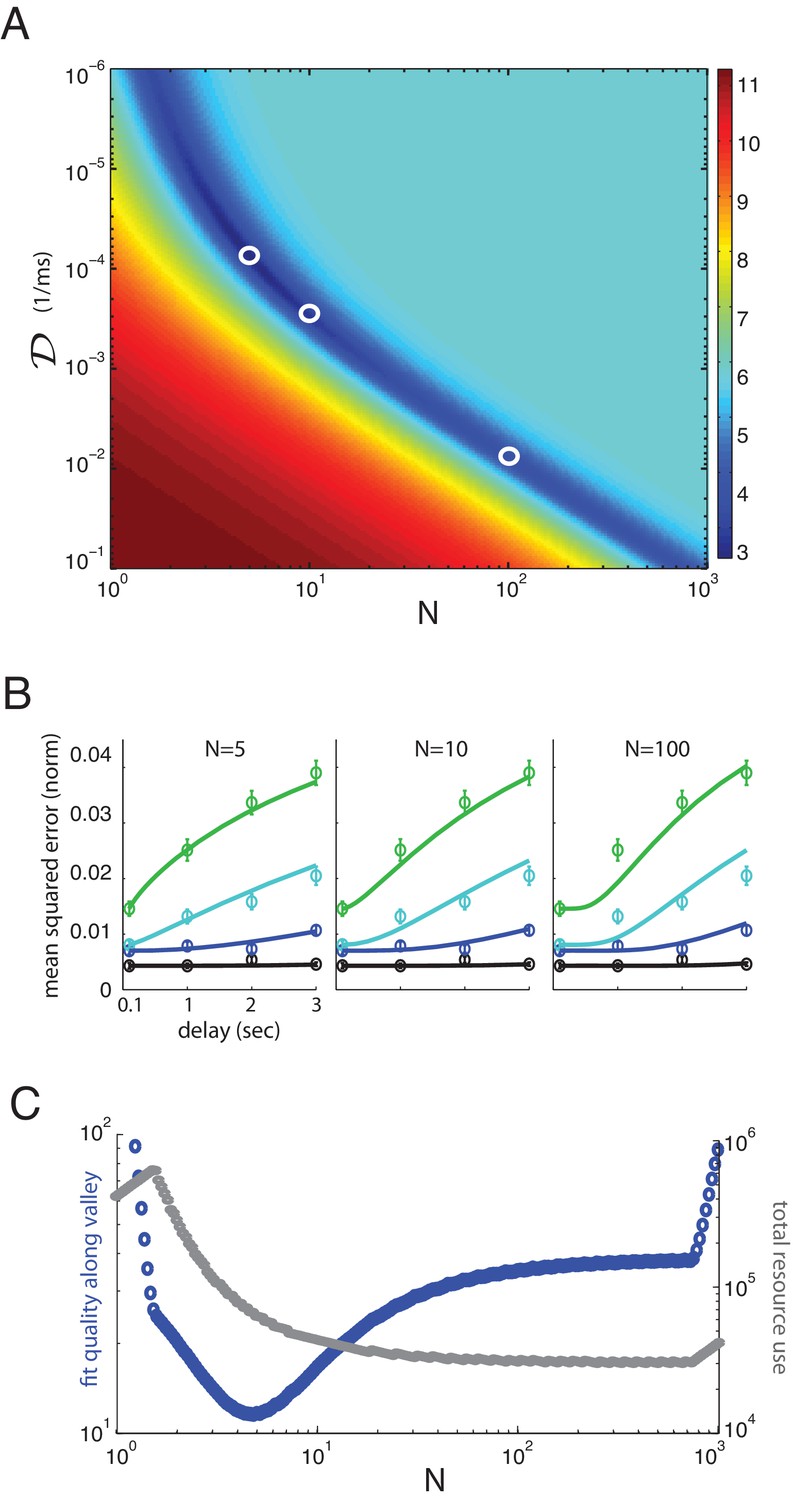
Multiplicity of reasonable parametric solutions for the well-coded storage model, with networks providing the best fits to human performance.
(A) The weighted least-squares error (colorbar indicating size of error on right) of the well-coded model fit to psychophysics data as a function of the two fit parameters, and . The deep blue valley running near the diagonal of the parameter space constitutes a set of reasonable fits to the data. (B) Three fits to the data using parameters along the valley, sampled at and . These three parameter sets are indicated by white circles in (A). (C) Blue curve: the weighted least-squares error in the fit between data and theory along the bottom of the valley seen in (A). Gray curve: the total resource use for the corresponding points along the valley.
Figure 4—figure supplement 1
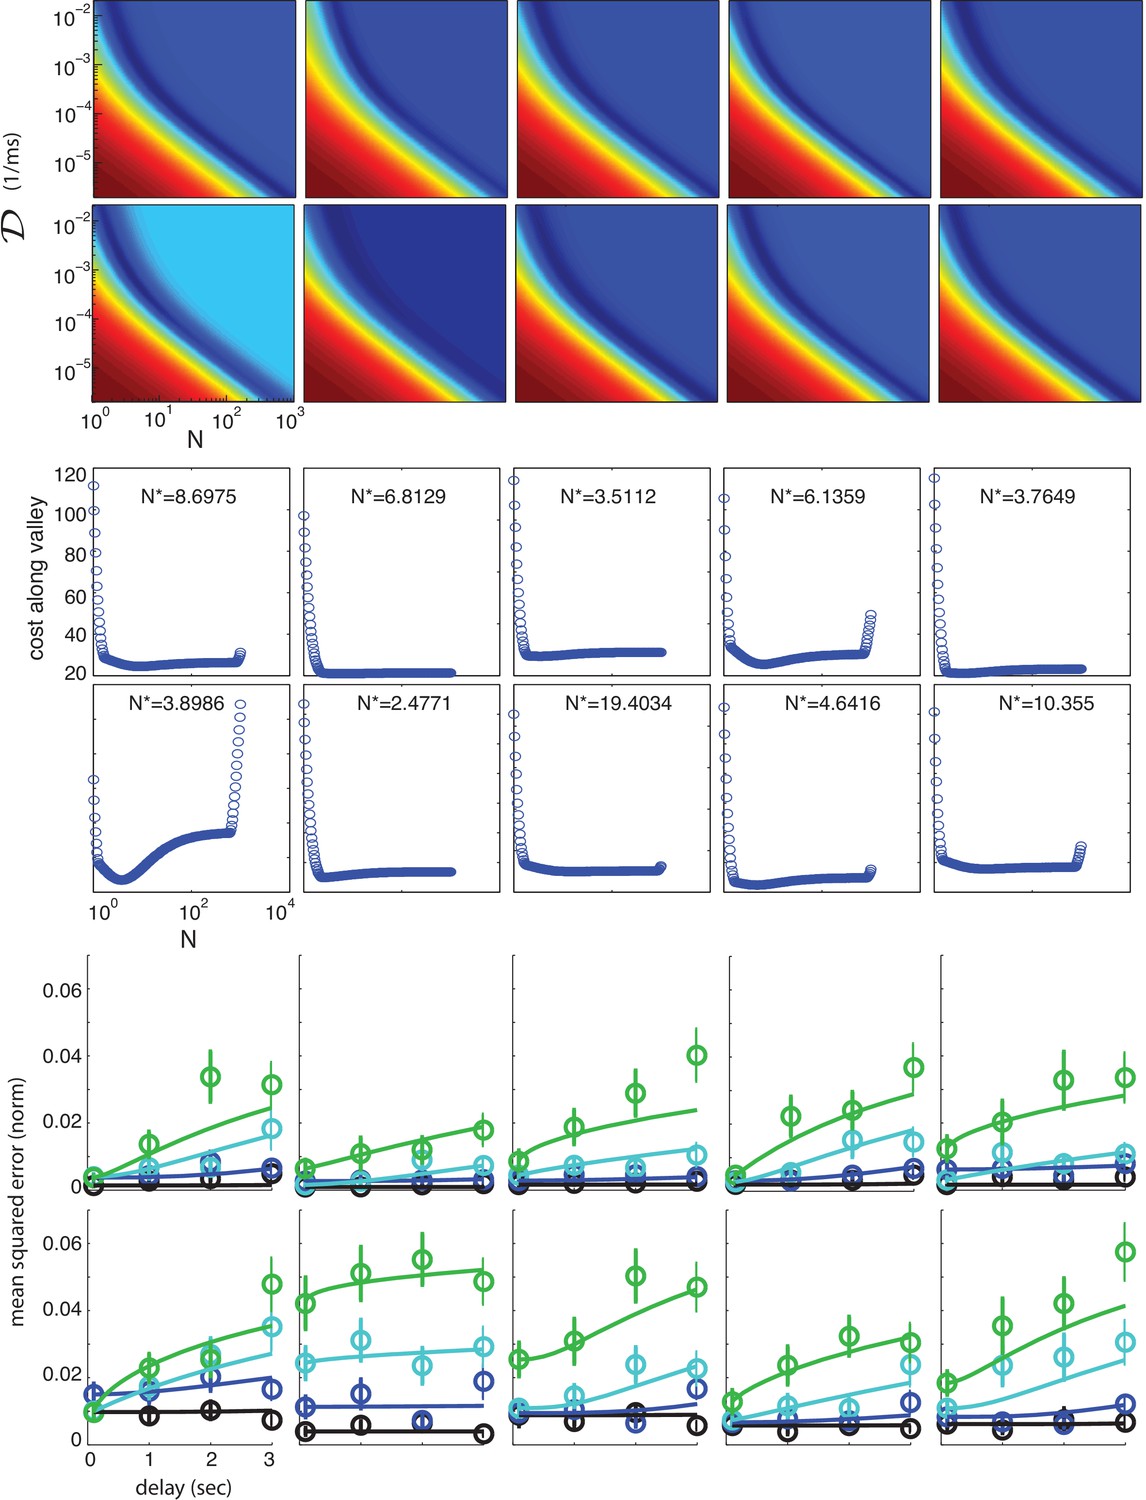
Performance of individual subjects and fits to well-coded storage model.
The responses of individual subjects are also well-fit by the functional form of the theoretically obtained bound on memory performance. Top two panels: the quality of fit (weighted squared error of fit) as a function of the two parameters of the theory (dark blue = best fit; dark red = worst fit), for each of the 10 subjects in the study. Middle two panels: The quality of fit along the valley defined by the dark blue area in the top two panels, plotted as a function of , for each of the 10 subjects. Most subjects have an optimal value of . The two outliers (subjects 7 and 8, with and , respectively, have rather flat fit quality along the entire valley, as a function of , and thus other values of produce very similar fit quality.) Bottom two panels: Individual subject performance (circles: mean-squared error averaged across trials; error bars are the across-trial SEM) as a function of storage interval duration, for different item numbers (1, 2, 4 and 6 items, black, blue, cyan and green, respectively). Solid curves: fits from the theoretical bound on performance (minimum weighted squared error).
Figure 4—figure supplement 2
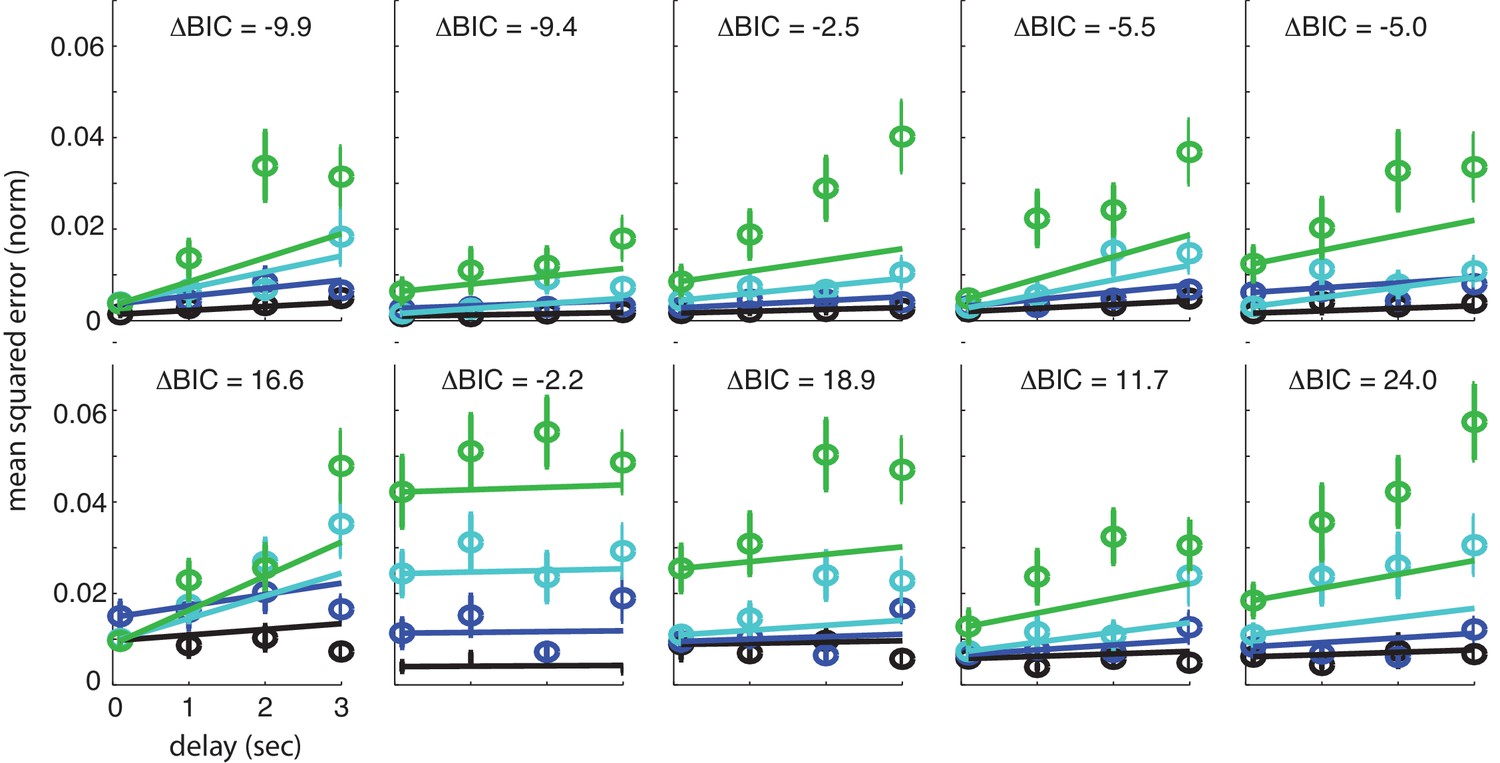
Fits of individual subject performance to direct storage model with hypothesis comparison score between direct and well-coded storage models.
The responses of individual subjects fit with weighted least-squares to the direct storage model. Weights are equal to the empirical standard error (SEM). The Bayesian Information Criterion-based hypothesis comparison score between the well-coded storage model and the direct storage model for individual subjects () is indicated at the top of each subplot.
Additional files
-
Transparent reporting form
- https://doi.org/10.7554/eLife.22225.014
Download links
A two-part list of links to download the article, or parts of the article, in various formats.
Downloads (link to download the article as PDF)
Open citations (links to open the citations from this article in various online reference manager services)
Cite this article (links to download the citations from this article in formats compatible with various reference manager tools)
Fundamental bound on the persistence and capacity of short-term memory stored as graded persistent activity
eLife 6:e22225.
https://doi.org/10.7554/eLife.22225


