Uncoupling apical constriction from tissue invagination
- The Johns Hopkins University School of Medicine, United States
Figures
Figure 1
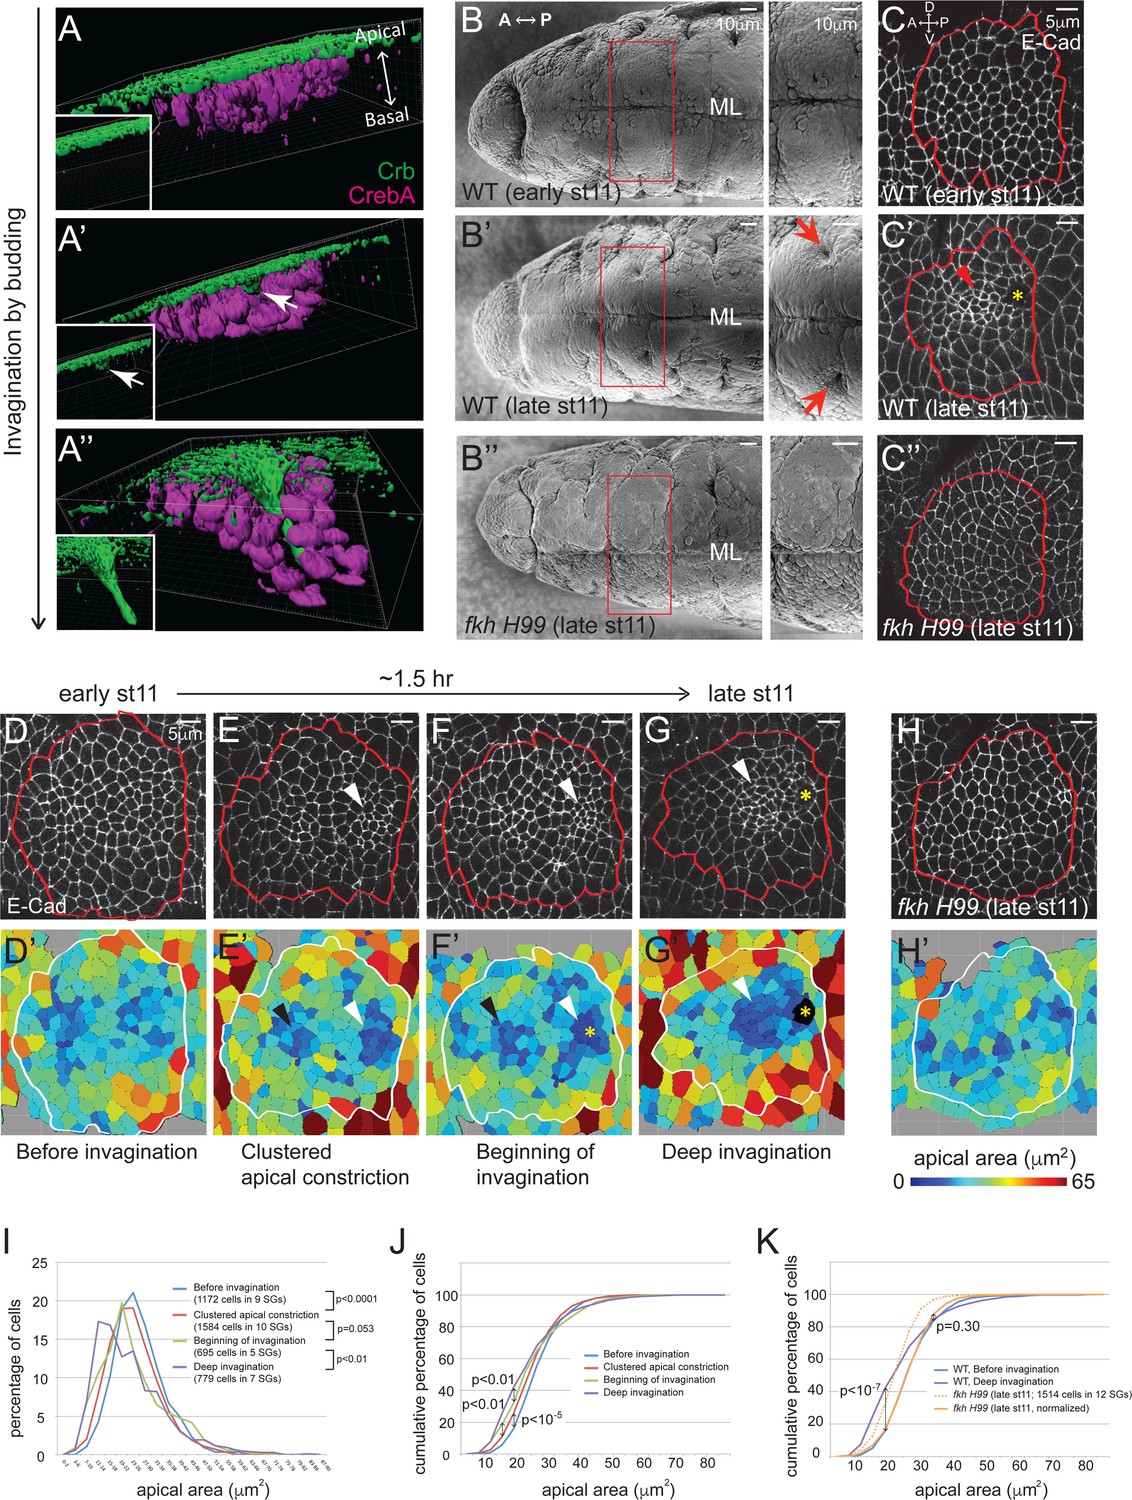
Clustered apical constriction does not occur in fkh mutant SGs.
(A–A’’) Epithelial invagination by budding. 3D reconstruction of Drosophila embryonic SGs stained with Crb (green), an apically localized transmembrane protein, and CrebA (magenta), an SG nuclear transcription factor, before (A), at the beginning (A’) and during (A’’) invagination. White arrows in A’ indicate the budding epithelium. Insets, Crb signals only. (B) SEM images of ventral views of early and late stage 11 embryos show two SG placodes, with higher magnification to the right. An invagination pit is observed in the posterior dorsal region of each placode at late stage 11 in WT (arrows in B’), which is absent in fkh H99 mutants (B’’). ML, midline. (C) E-Cad staining of WT and fkh H99 mutant SGs of early and late stage 11. Ventral views of a single SG placode are shown. Red lines denote the border of the SG placodes, based on a CrebA staining (not shown). In this figure and later, anterior is to the left and dorsal is up. Robust apical constriction is observed in WT SGs of late stage 11 (arrowhead in C’), which is not detected in WT SG of early stage 11 (C) or in fkh H99 SG of late stage 11 (C’’). Asterisk, invagination pit. (D–H) Coordinated apical constriction is observed in WT SGs prior to and during invagination, which does not occur in fkh mutants. Representative SGs for the four distinct stages of invagination observed in WT (D–G) and late stage 11 fkh H99 embryos (H) and the corresponding heat maps of apical area are shown (D’–H’). Apical area of each cell was calculated by automated tracing of E-Cad along cell boundaries. Red and white lines denote the border of the SG placodes. Arrowheads, clustered apical constriction in the posterior (white) or anterior (black) region of the placode. Asterisks, invagination pit. (I–K) Percentage (I) and cumulative percentage (J) of WT SG cells in different apical area bins at each stage of invagination. Comparison of the cumulative percentage of cells in WT and fkh mutants (K). P values are calculated using the Mann-Whitney U-test (I) and the Kolmogorov-Smirnov test (J, K). See also Figure 1—source data 1.
-
Figure 1—source data 1
SG cells quantified for apical area.
- https://doi.org/10.7554/eLife.22235.004
Figure 2
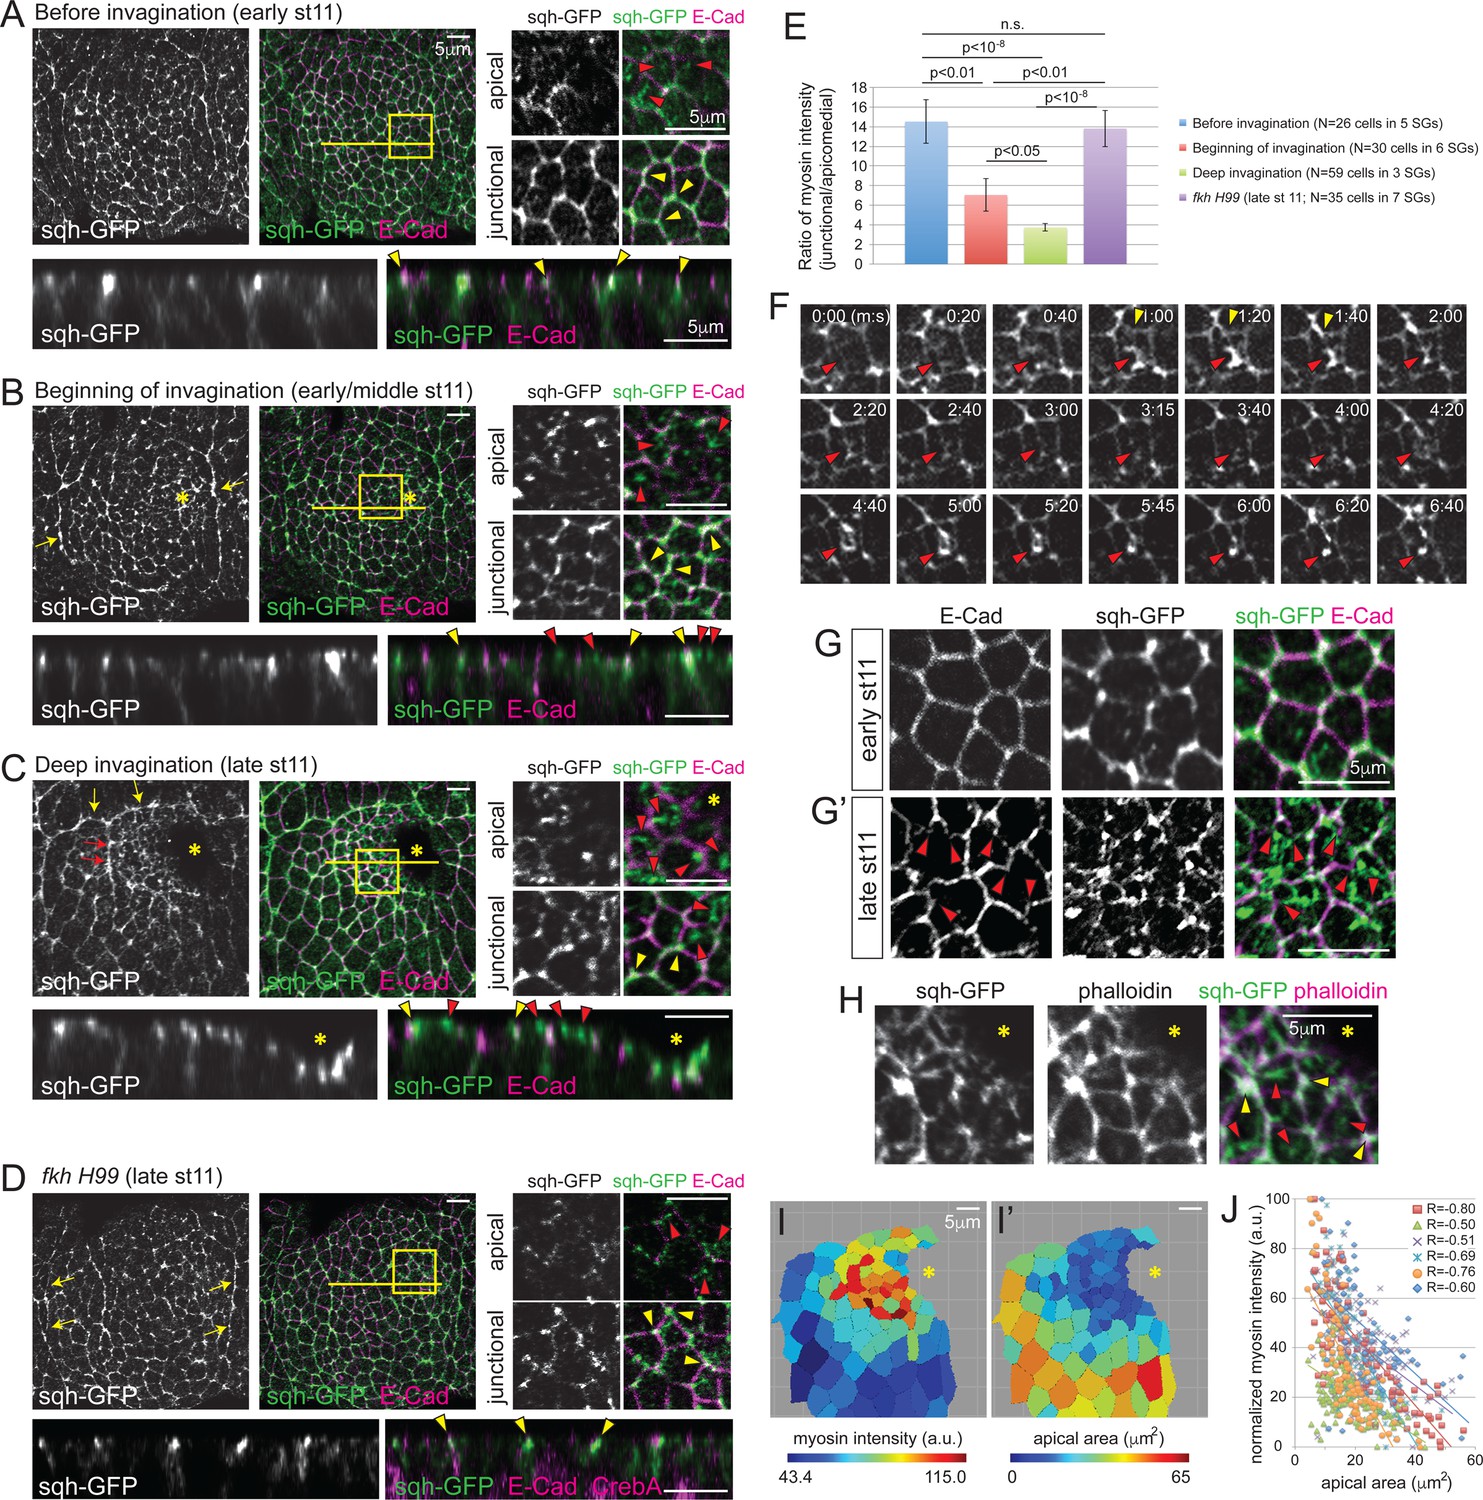
Apicomedial myosin accumulation and coordinated apical constriction are regulated both spatially and temporally during SG invagination.
(A–D) Myosin accumulation at different stages of invagination of WT (A–C) and in the fkh mutant SGs (D). Two focal planes (apical and junctional) for the posterior/dorsal region of each placode (yellow box) are shown in higher magnification. Z sections along the yellow lines are shown at the bottom. Before invagination (A), most myosin is found along cell junctions, often with higher intensity at vertices (yellow arrowheads). Only very weak and dispersed myosin is observed apically (red arrowheads). When the first cells begin to invaginate (B), web-like myosin structures become prominent in the apical region of cells (red arrowheads). Strong myosin signals at cell junctions are still observed (yellow arrowheads). Supracellular myosin cables along the anterior and posterior boundaries of the SG are also observed (yellow arrows). During deep invagination (C), high intensity apicomedial myosin web structures are observed in cells near the invagination pit (red arrowheads). Note that the epithelial sheet is tilted a little basally toward the invagination pit (asterisk) in the magnified images. At this stage, large supracellular cables form at the dorsal boundary of the tissue (yellow arrows) to connect the lateral cables and surround the entire tissue. Short intercellular myosin cables across several cells are also occasionally observed (red arrows). In fkh mutant SGs (D), strong myosin signals are observed only along junctions, even at late stage 11 (yellow arrowheads). Apical myosin is weak and dispersed (red arrowheads). The supracellular myosin cables along the lateral boundaries of the tissue are still visible (arrows), but a connected dorsal cable does not form. (E) Ratio of junctional to apicomedial myosin signals of the SG cells. Shown are mean ± SEM. P values are calculated using the two-tailed Student’s t-test. See Figure 2—source data 1. (F) Time-lapse images of sqh-GFP in a single WT SG cell show pulsatile behavior of apicomedial myosin (red arrowheads). Cell deformation is occasionally observed during the peak intensity period of apicomedial myosin (yellow arrowheads). See Video 1. (G) Whereas cells have a roughly hexagonal shape before invagination (G), significant cell membrane distortion is observed during invagination (G’) where apicomedial myosin contacts E-Cad (arrowheads). (H) Weak actin signals colocalize with apicomedial myosin (red arrowheads). Strong actin signals colocalize with myosin at cell junctions (yellow arrowheads). (I) Heat maps corresponding to the late stage 11 WT SG shown in (C). Higher intensity myosin signals are observed in cells near the invagination pit (I), which have smaller apical area (I’). (J) Negative correlation between myosin intensity and apical area during deep invagination. Myosin intensity for each SG is re-scaled for 0 to 100 (a.u.). Cells from six WT SGs are plotted with different colors. Trendlines are shown for each SG. R, Pearson correlation coefficient. p<0.0001 for all samples. Asterisks in B, C, H and I, invagination pit.
-
Figure 2—source data 1
Ratio of junctional to apicomedial myosin signals of the SG cells.
- https://doi.org/10.7554/eLife.22235.006
Figure 3
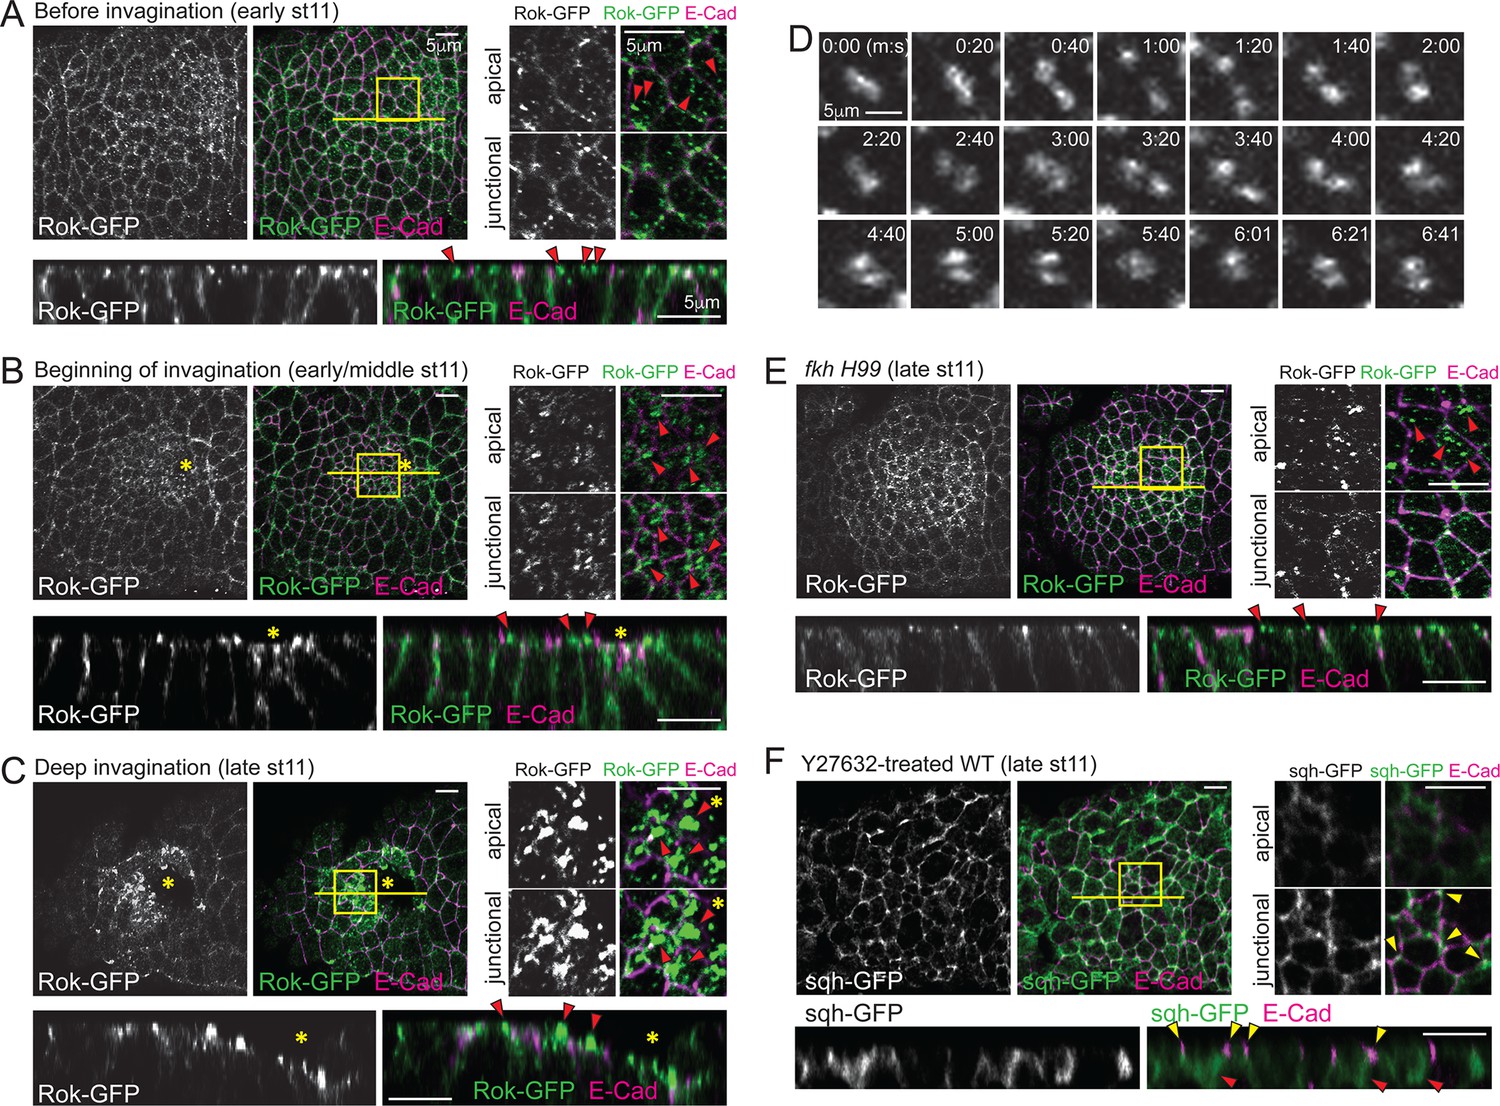
Spatiotemporal regulation of Rok is critical for formation of apicomedial myosin during SG invagination.
(A–C) Apicomedial Rok increases dramatically during SG invagination and forms huge globular structures. Two focal planes (apical and junctional) for the posterior/dorsal region of each placode (yellow box) are shown at higher magnification. Bottom panels for each time point are the Z sections along the yellow lines. Before invagination (A), Rok is observed only as small puncta in the apical region (arrowheads). Additional Rok signals are shown along the entire lateral membranes. When cells first begin to invaginate (B), Rok is observed in large punctate structures in the apical region of the posterior/dorsal region of the placode (arrowheads). During deep invagination (C), huge globs of Rok accumulation are observed in cells near the invagination pit (arrowheads). Asterisk, invagination pit. (D) Time-lapse images of Rok-GFP in a single WT SG cell show dynamic apicomedial Rok accumulation. See Video 2. (E) In late stage 11 fkh mutants, apical Rok is present only in small punctate structures (arrowheads). (F) Y-27632 inhibits formation of apicomedial myosin and SG invagination. Myosin is only observed along the lateral membrane, including the AJ domain (yellow arrowheads) and in the basal region of the cells (red arrowheads).
Figure 4
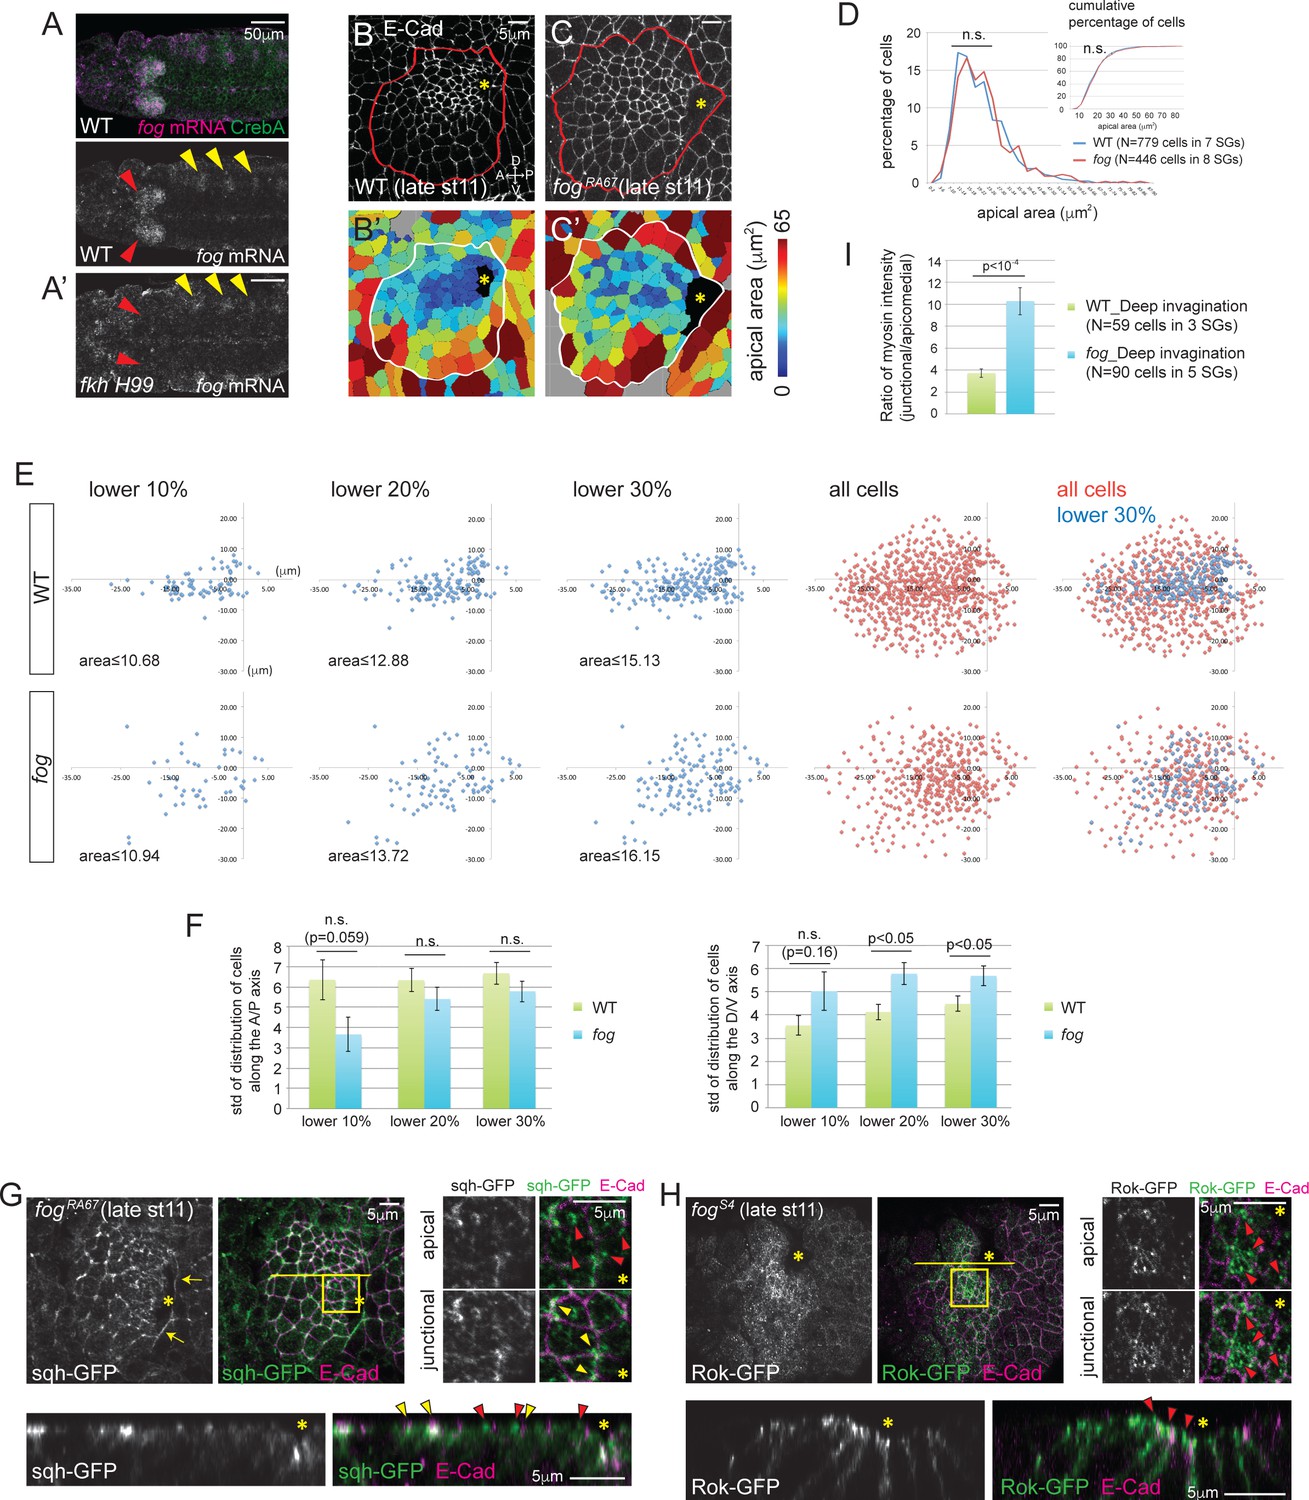
Fog, a downstream effector of Fkh, is essential for proper Rok localization, apicomedial myosin formation and coordinated apical constriction.
(A) fog mRNA (magenta) is expressed in the SG (red arrowheads in A), overlapping with the SG-specific marker CrebA (green). In fkh mutants, fog mRNA in the SG is at background levels (red arrowheads in A’) whereas fog expression in the developing trachea is unaffected (yellow arrowheads). (B, C) E-Cad staining of WT and fog SGs during invagination (B, C) and the corresponding heat maps of apical area (B’, C’). (D) Percentage and cumulative percentage of cells of different apical area in WT and fog mutant SGs are indistinguishable during invagination. See Figure 4—source data 1. (E) Scatter plots showing the position of cells relative to the invagination pit. X and Y axes represent the distance along the A/P axis and D/V axis from the pit, respectively. Cells of lower 10%, 20%, 30% of apical area (blue) and all cells (red) are plotted. Note that the cells of lower 30% of area are plotted on top of all cells in the merged plots (right-most panels). The same cells quantified in D were analyzed in E and F. (F) Quantification of distribution of cells along the A/P and D/V axis. Compared to WT, cells with small apical area are more dispersed along the D/V axis in fog mutant SGs. See Figure 4—source data 2. (G) Only weak apicomedial myosin structures form in fog mutant SGs during invagination (red arrowheads). Yellow arrowheads, junctional myosin. (H) Rok is more dispersed at the apical region and is observed only in small punctate structures (arrowheads) in fog mutant SGs. (I) The ratio of junctional to apicomedial myosin is significantly higher in fog mutants during deep invagination. Shown are mean ± SEM. P values are calculated using the two-tailed Student’s t-test. See Figure 4—source data 3. Asterisks in B, C, G and H, invagination pit.
-
Figure 4—source data 1
SG cells quantified for apical area.
- https://doi.org/10.7554/eLife.22235.011
-
Figure 4—source data 2
Distribution of SG cells along the A/P and D/V axis.
- https://doi.org/10.7554/eLife.22235.012
-
Figure 4—source data 3
Ratio of junctional to apicomedial myosin signals of the SG cells.
- https://doi.org/10.7554/eLife.22235.013
Figure 5 with 1 supplement
Blocking apical constriction does not prevent SG internalization.
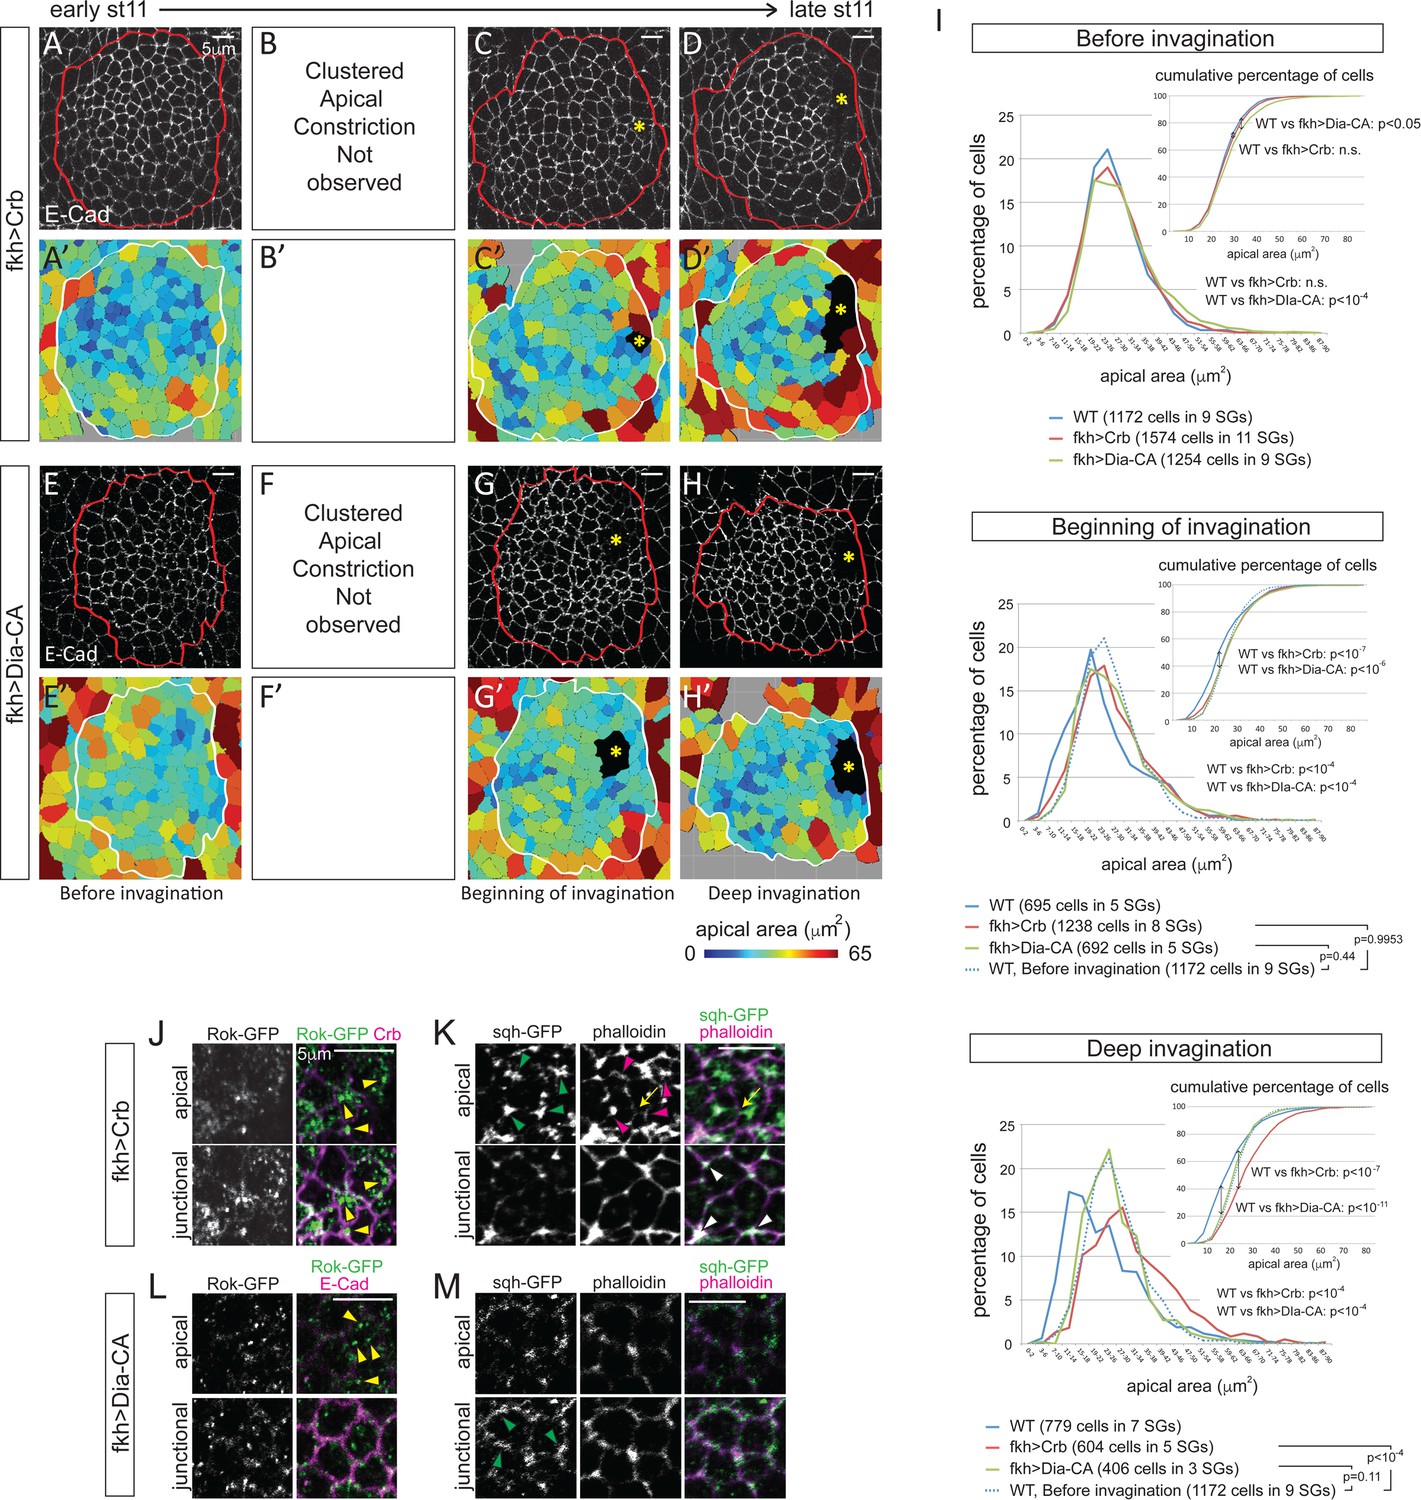
(A–H) Representative confocal images for Crb- (A–D) and Dia-CA-overexpressing SGs (E–H) at each stage of invagination and the corresponding heat maps for apical area (A’–H’). Red and white lines mark the SGs. Asterisks, invagination pit. (I) Percentage and cumulative percentages of cells with different apical area show a gradual and significant increase of apical area for Crb- and Dia-CA-overexpressing SG cells. P values are calculated using the Mann-Whitney U test (percentage of cells) and using the Kolmogorov-Smirnov test (cumulative percentage of cells). See also Figure 5—source data 1 and Figure 5—figure supplement 1. (J, K) In Crb-overexpressing cells, Rok is observed as small- to medium-sized puncta (yellow arrowheads in J). Strong apicomedial myosin (green arrowheads in J) colocalizes with F-actin (magenta arrowheads in K). Junctional myosin (white arrowheads in K) is also clearly shown. Occasional cell deformation is observed at the contact site of apicomedial actomyosin complex and the junction (arrows). (L, M) Only small punctate Rok signals are observed in Dia-CA-overexpressing cells (yellow arrowheads in L). Myosin is observed in punctate structures in a broad cortical area (green arrowheads in M).
-
Figure 5—source data 1
SG cells quantified for apical area.
- https://doi.org/10.7554/eLife.22235.015
Figure 5—figure supplement 1

Overexpression of Crb- and Dia-CA affects the distribution of cells with smaller apical areas.
(A) Scatter plots showing the position of cells relative to the invagination pit. The same cells quantified in Figure 5I were analyzed. X and Y axes represent the distance along the A/P axis and D/V axis from the pit, respectively. Cells of lower 10%, 20%, 30% of apical area (blue) and all cells (red) are plotted. Note the apical area of cells in the 10% range with overexpression of Crb or Dia-CA is larger than in either WT or fog mutant SGs up through the 30% range (Compare to Figure 4E). (B) Quantification of distribution of cells along the A/P and D/V axis (the same cells analyzed in A). Compared to WT, cells overexpressing Crb or Dia-CA with relatively smaller apical area are more dispersed along the A/P axis.
Figure 6
Apical constriction is essential for tissue geometry.
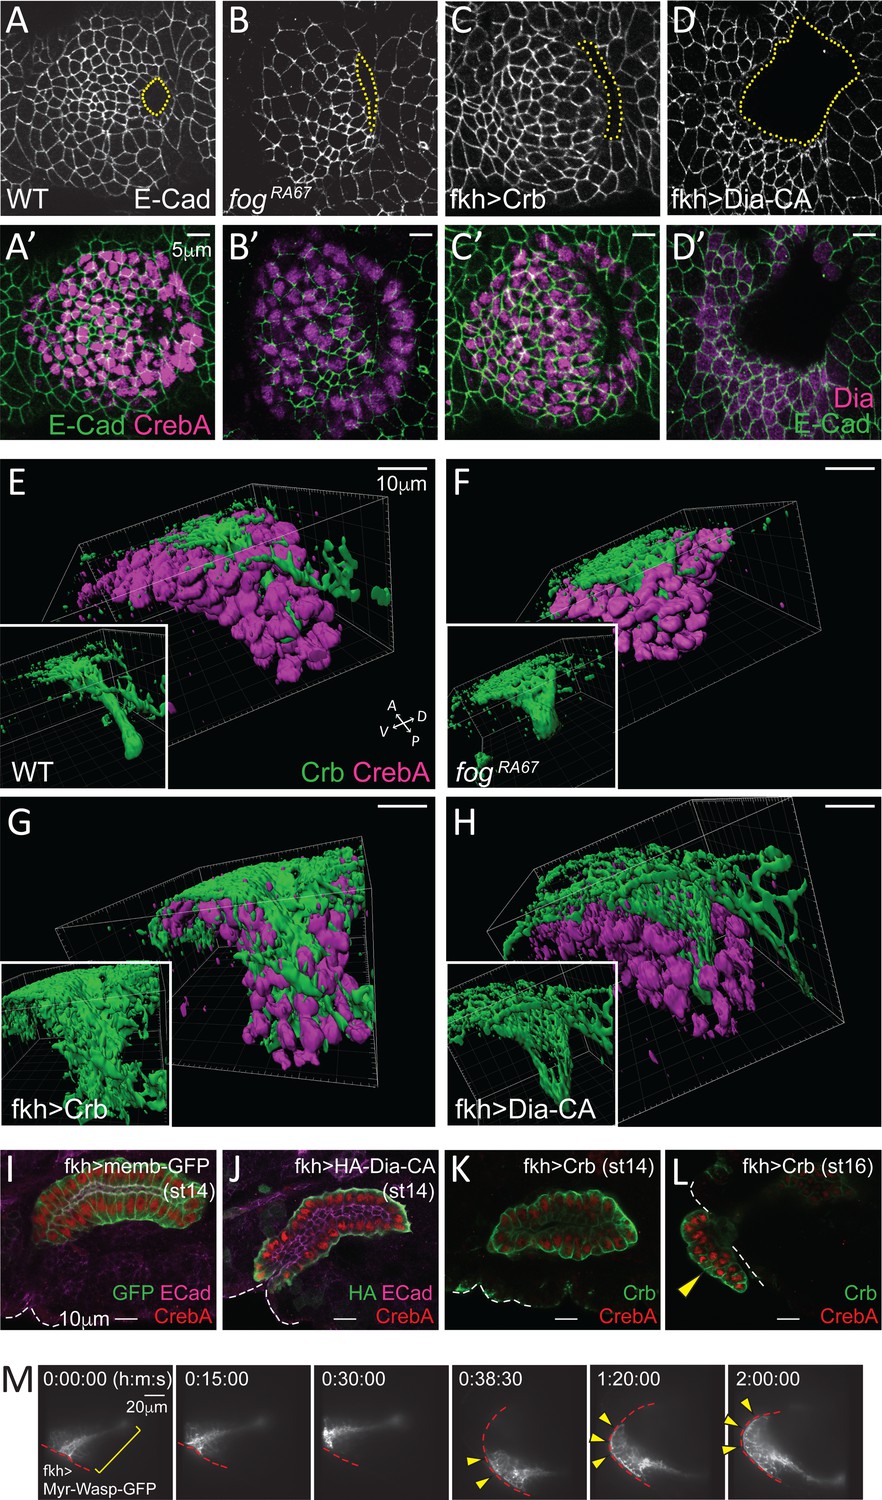
(A–D, A'–D') Representative images showing morphology and size of the invagination pit (dotted lines) in the different genotypes. (E–H) 3D reconstruction of late stage 11 SGs stained with Crb (green) and CrebA (magenta). Compared to a narrow lumen in a WT SG (E), fog mutant (F), Crb-overexpressing (G) and Dia-CA-overexpressing (H) SGs form a wider lumen. Insets, Crb signals only. (I–L) Fully formed late stage SGs. Dia-CA-overexpressing SGs have wider lumens and are closer to the embryo surface (J). Crb-overexpressing SGs show normal SG internalization until stage 14 (K), but some cells occasionally evaginate at later stages (arrowhead in L). White dashed lines, embryo boundary. (M) Time-lapse images of Myr-Wasp-overexpressing SG show evagination behavior of SG cells. The SG was re-centered at 38:30. Cells that were completely internalized at the beginning of the movie (bracket) are shown on the embryo surface over time (arrowheads). Red dashed lines, embryo boundary. See Video 3.
Figure 7
The tissue-level supracellular cable is defective in the SGs with defective invagination.
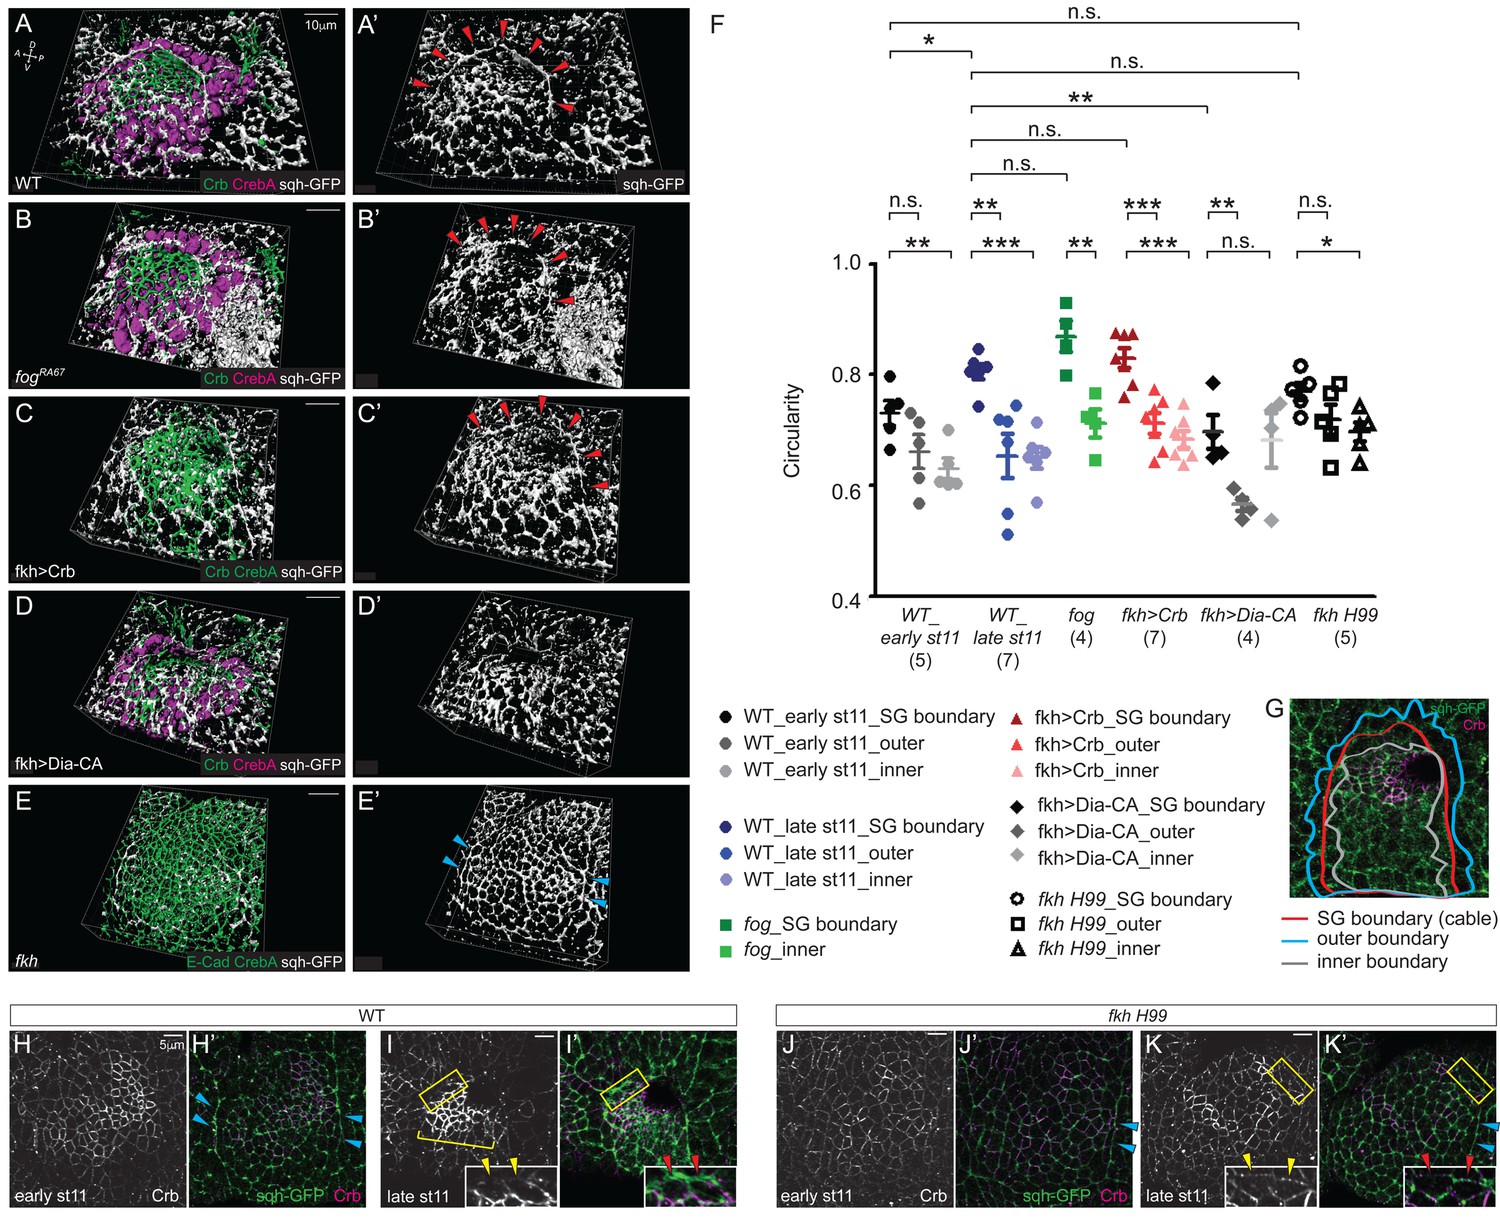
(A–E) 3D reconstruction of late stage 11 SGs stained with Crb (green), CrebA (magenta in A, B and D and green in C and E), and sqh-GFP (white). A supracellular myosin cable (red arrowheads) that surrounds the entire SG placode is observed in the WT (A), fog mutant (B) and Crb-overexpressing SGs (C). The tissue-level myosin cable is not obvious in the Dia-CA-overexpressing SGs (D). Only the supracellular cables along the lateral boundaries of the placode are shown in the fkh H99 mutant SGs (cyan arrowheads in E). (A’–E’) sqh-GFP signals only. (F, G) Analysis of the circularity of the SG placode boundary as a measure of smoothness and tension. The circularity of the placode boundary in the WT, fog, and Crb-overexpressing SGs, where the cable is located, is significantly greater than that of the boundaries shifted outside the placode by one cell (outer boundary) or inside the placode by one cell (inner boundary). Numbers of the SGs measured are shown below each genotype. mean ± SEM; P values are calculated using the unpaired t-test. *p<0.05; **p<0.01; ***p<0.001. (G) An example of a WT SG with the boundaries measured. (H, I) Compared to moderate levels at early stage 11 (H, H’), Crb levels (magenta) notably increase in the SG cells at late stage 11 (bracket). Anisotropic Crb localization (yellow arrowheads) correlates with supracellular myosin cable at the SG boundary (red arrowheads). (J, K) In fkh H99 mutant SGs, Crb levels in the SG are reduced throughout stage 11. Weak Crb signals do not show anisotropic localization at the SG boundary (yellow arrowheads), and the supracellular myosin cable does not form at the dorsal boundary of the SG (red arrowheads). Cyan arrowheads, supracellular myosin cable along the lateral boundaries.
Figure 8

Invagination decouples internalization of cells.
(A–E, A'-E') fog mutant SGs of late stages, from fully internalized (A, A'), partially internalized (B, B') to completely externalized glands, either folded (C, C') or elongated (D, D', E, E'). The externalized SG that migrates along the embryo surface (dashed bracket in E) formed a longer tube than the internalized one (solid bracket in E). All SGs have proper apicobasal polarity. (F, G) Whereas the surface epithelium is in the same plane as the SG in WT (F), a deep ingression between the SG and the neighboring surface epithelium is often observed in fog mutants (G), with some SG cells perpendicular to the rest of the SG on the apical side of the epithelial sheet (arrowheads). Z sections along the lines (F’, G’). Two SG cells are outlined with white dotted lines for each sample; one of them is perpendicularly positioned at the edge in the fog mutant (arrowhead). ML, midline. Yellow dashed lines, the boundary of the neighboring surface epithelia. (H) Strong myosin signals are often observed along the edge of the fog mutant SG (arrows). Arrowheads, nuclei of the slipped-out cells. (I, J) fog mutant SGs with slipped-out cells (arrowheads) in the anterior region of the placode form an externalized tube as cells invaginate (I). fog mutant SGs with slipped-out cells in the posterior region of the placode form an externalized tube as cells invaginate (J). Z sections along the lines (I’, J’). White lines, the boundary of SGs. Green lines, embryo surface. Arrows, the direction of invagination. Asterisks, non-specific signals. (K) SG-specific expression of Fog in fog mutant embryos did not rescue the externalized SG phenotype. Numbers inside bars indicate the number of SGs counted. P value was calculated using the Chi-square test. (L) A model for SG invagination. Fkh-dependent high-level Crb expression in the SG versus low levels of Crb in the surrounding ectodermal tissues regulates formation of the circumferential myosin cable that surrounds the entire SG to provide a compressing force during invagination. Regulation of the SG expression of fog by Fkh controls apicomedial localization of Rok and formation of apicomedial myosin, which drives clustered apical constriction to ensure the proper tissue geometry. Fkh-dependent uncharacterized target genes are proposed to drive the cell rearrangement that also contributes to SG internalization.
Videos
Video 1
Pulsatile apicomedial myosin, Related to Figure 2.
Time-lapse movie of sqh-GFP in a WT SG during invagination; a single confocal section is shown. Signals in a single SG cell are shown in the right panel. Frames are 5 s apart.
Video 2
Rok is observed as huge globular structures in the invaginating SGs, Related to Figure 3.
Time-lapse movie of Rok-GFP in a WT SG during invagination; a single confocal section is shown. Signals in a single SG cell are shown in the bottom panel. Frames are 20 s apart.
Video 3
Myristylated-Wasp-overexpressing SGs evaginate, Related to Figure 6.
Time-lapse movie for a late stage SG overexpressing a membrane-bound form of Wasp. The sample was re-centered at 38:30. Stacks of two confocal sections are shown. The fully internalized SG at the beginning of the movie gradually evaginates over time. Frames are 5 s apart.
Download links
A two-part list of links to download the article, or parts of the article, in various formats.
Downloads (link to download the article as PDF)
Open citations (links to open the citations from this article in various online reference manager services)
Cite this article (links to download the citations from this article in formats compatible with various reference manager tools)
Uncoupling apical constriction from tissue invagination
eLife 6:e22235.
https://doi.org/10.7554/eLife.22235


