The fibronectin synergy site re-enforces cell adhesion and mediates a crosstalk between integrin classes
- Universitat de València, Spain
- Ludwig-Maximilians-Universität München, Germany
- Klinikum der Universität München, Germany
- Eidgenössische Technische Hochschule Zürich, Switzerland
Figures
Figure 1 with 2 supplements
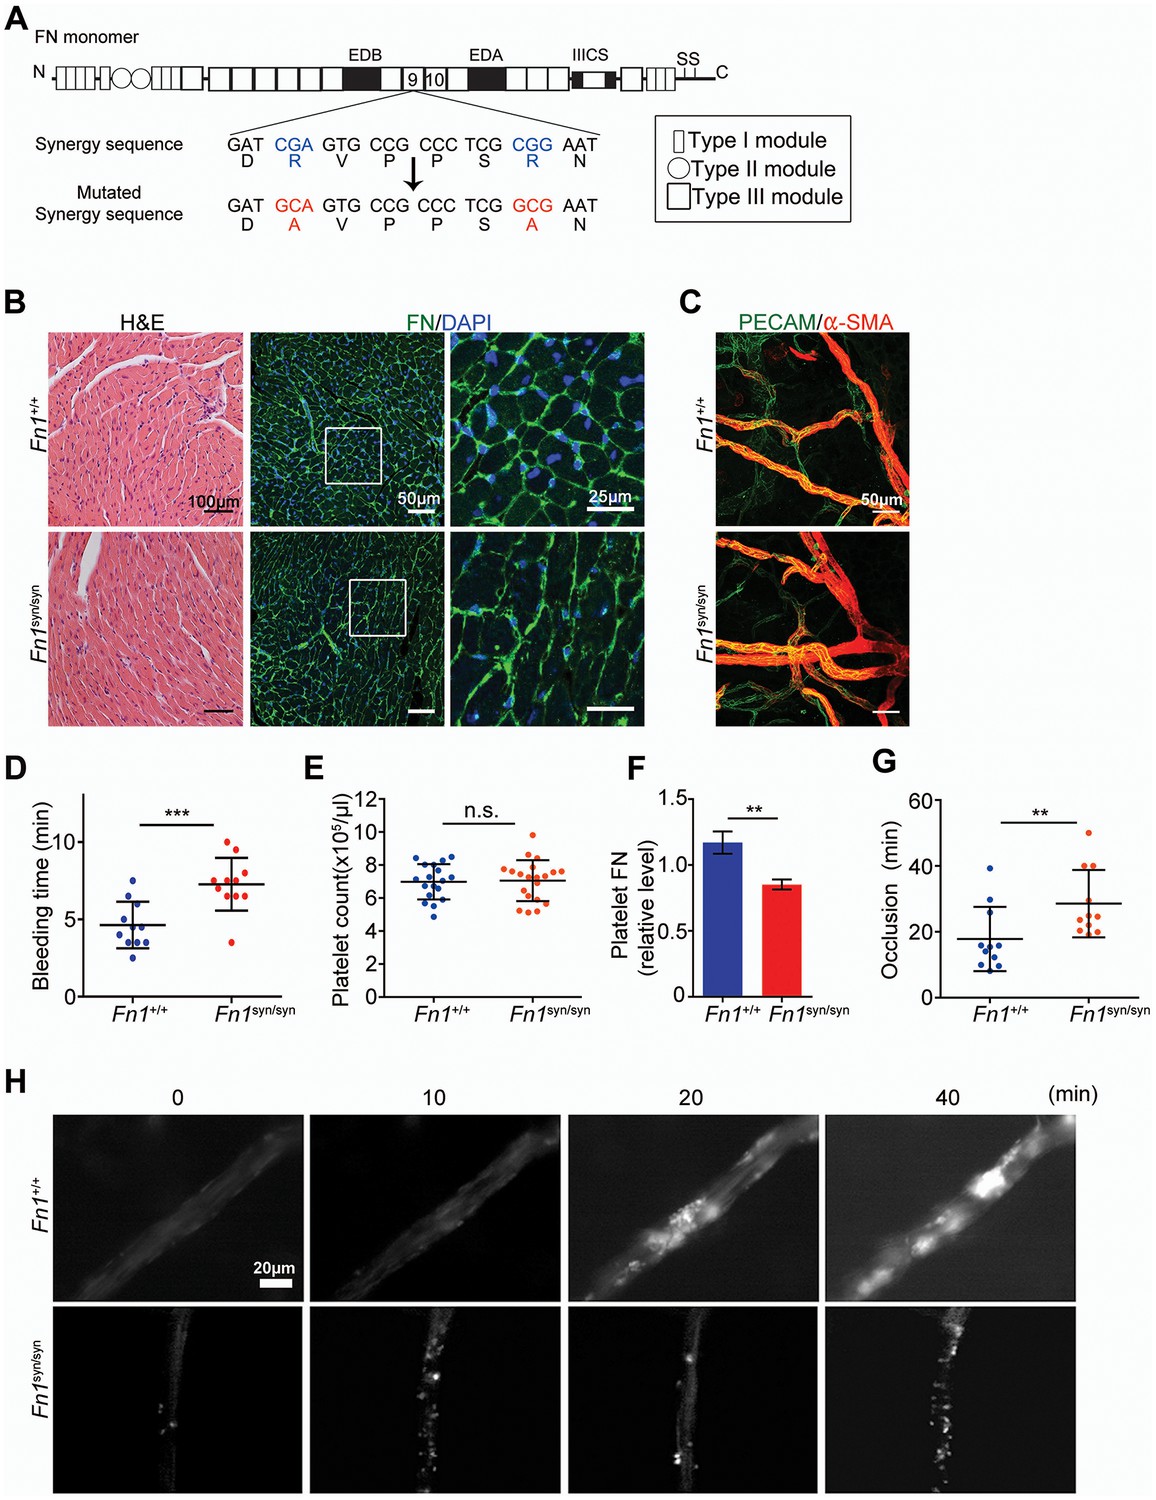
Normal tissue development and prolonged bleeding in Fn1syn/syn mice.
(A) Cartoon of FN and the nucleotide point mutations disrupting the function of the synergy site. (B) Representative images of 3-months-old Fn1 +/+ and Fn1syn/syn heart sections stained with H and E and immunostained for FN. (C) Confocal images of ear whole-mounts from 3 months-old mice immunostained with anti-PECAM-1 and anti-αSMA to visualize the dermal endothelial cell tubes and smooth muscle cells. (D) Bleeding time of 3-months-old Fn1+/+ (n = 11) and Fn1syn/syn (n = 11) mice. (E) Platelet counts in blood samples of Fn1+/+ (n = 18) and Fn1syn/syn (n = 19) mice. (F) FN content in platelets derived from Fn1+/+ (n = 6) and Fn1syn/syn (n = 6) mice relative to their vinculin levels. (G) Occlusion time of injured arterioles in the cremaster muscle of 3-months-old Fn1+/+ (n = 11) and Fn1syn/syn (n = 11) mice. (H) Representative still images of the arteriolar occlusion (white:platelets). Values are shown as mean ± SD; statistical significances were calculated using the Student t-test; **p<0.01 and ***p<0.001.
Figure 1—figure supplement 1
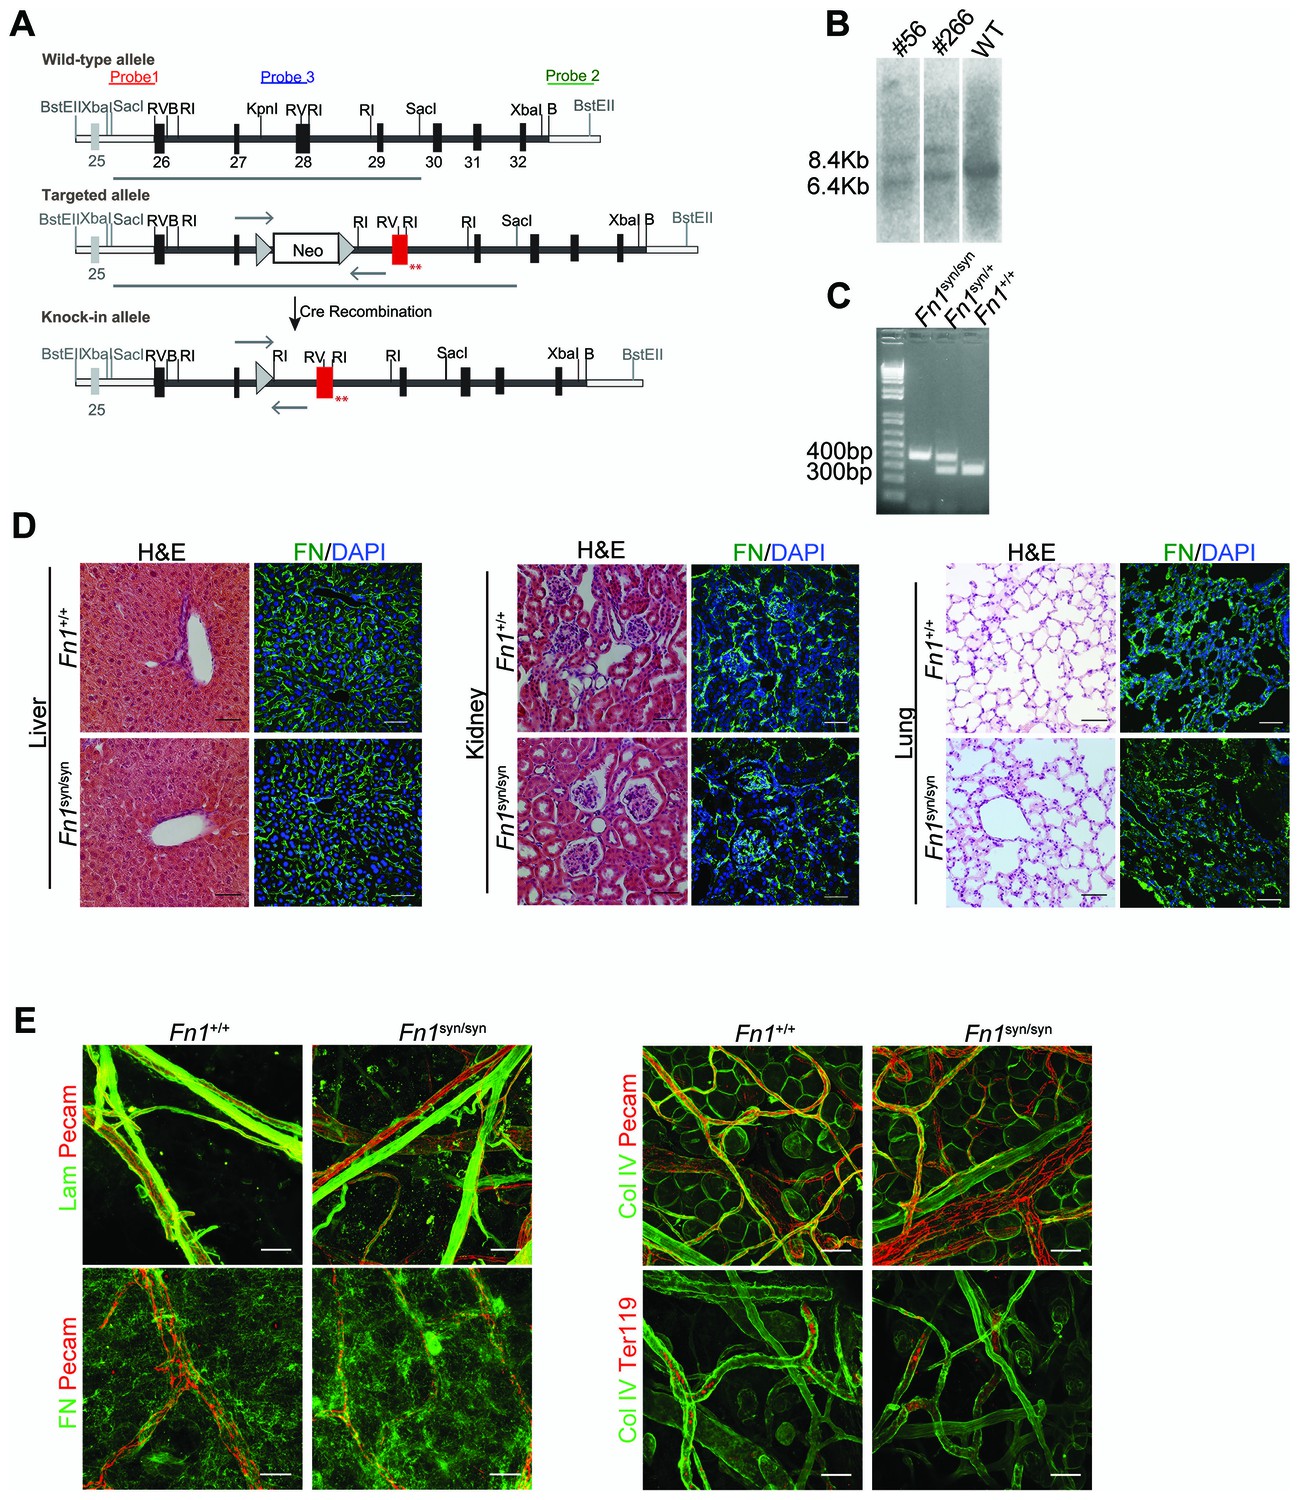
Strategy used to generate the Fn1syn/syn mice and tissue and platelet analysis.
(A) Scheme of the FN gene and the targeting vector to generate the mouse with a dysfunctional synergy site. The synergy region is located in the FNIII9 and encoded in exon 28, shown in red. (B) The homologous recombination of the targeting vector was re-tested in ES cell clones 56 and 266 by Southern-blot using probe 1 SacI digested DNA. (C) Mice were genotyped by PCR using primers shown as arrows in (a). (D) Liver, kidney and lung sections from 3-months-old Fn1+/+ and Fn1syn/syn mice stained with H and E (scale bar, 100 μm) and immunostained for FN (scale bar, 50 μm). (E) Ear whole-mount staining of laminin (Lam), FN, collagen IV, and erythrocytes (Ter119) to analyze the sub-endothelial ECM composition and the integrity of blood vessels (scale bars, 50 μm and 25 μm for FN immunostaining).
Figure 1—figure supplement 2
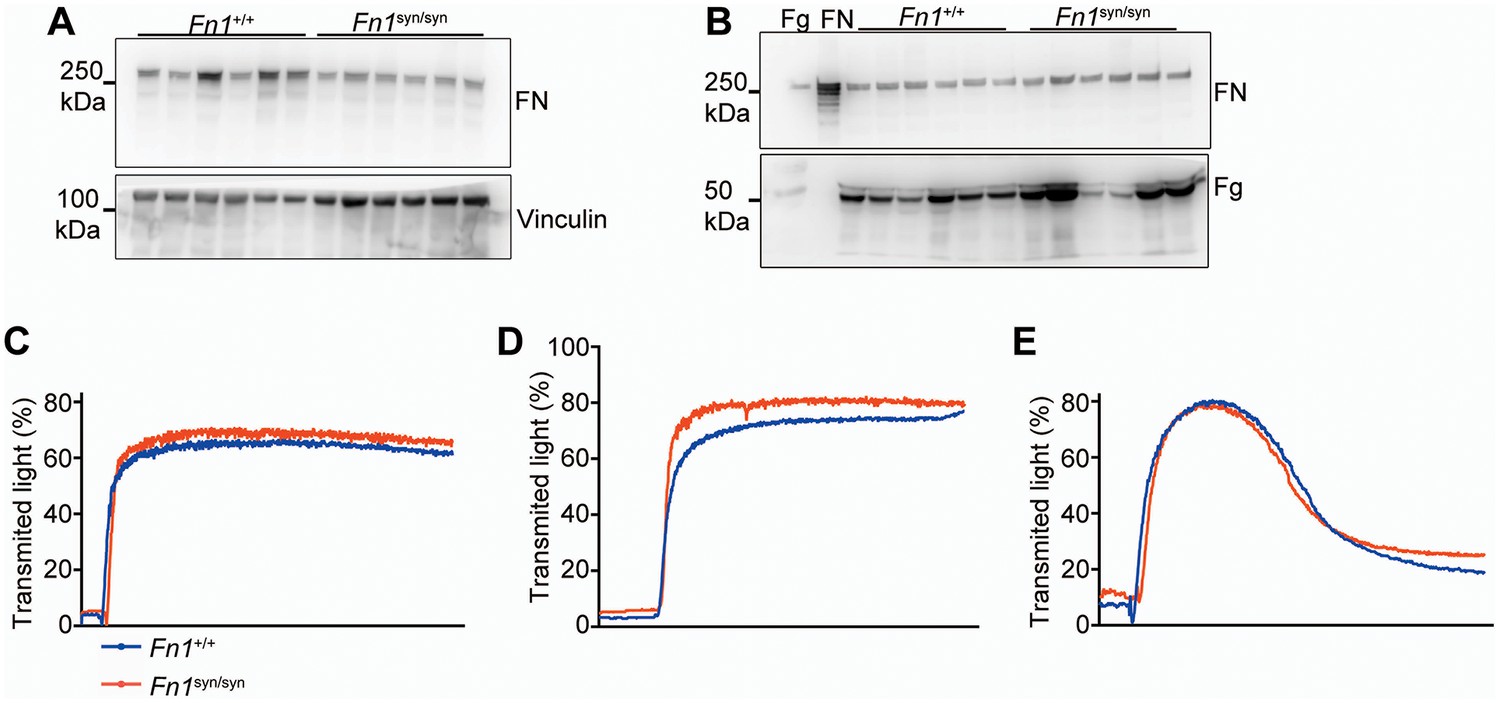
FN levels in platelets and blood from Fn1syn/syn mice and platelet aggregation assays.
(A) Western-blot to estimate FN levels in non-activated, washed platelets from Fn1+/+ (n = 6) and Fn1syn/syn mice (n = 6). (B) Western-blot to calculate FN and fibrinogen (Fg) levels in blood plasma from Fn1+/+ (n = 6) and Fn1syn/syn mice (n = 6). The first two lanes are commercial Fg and FN, respectively. (C–E) Representative in vitro aggregation assays using washed platelets from Fn1+/+ (n = 6) and FNsyn/syn mice (n = 8). Aggregation curves of platelets activated with 5 μg/ml collagen (C), with 0.5 u/ml thrombin (D) or with 20 μM ADP (E).
Figure 2 with 2 supplements
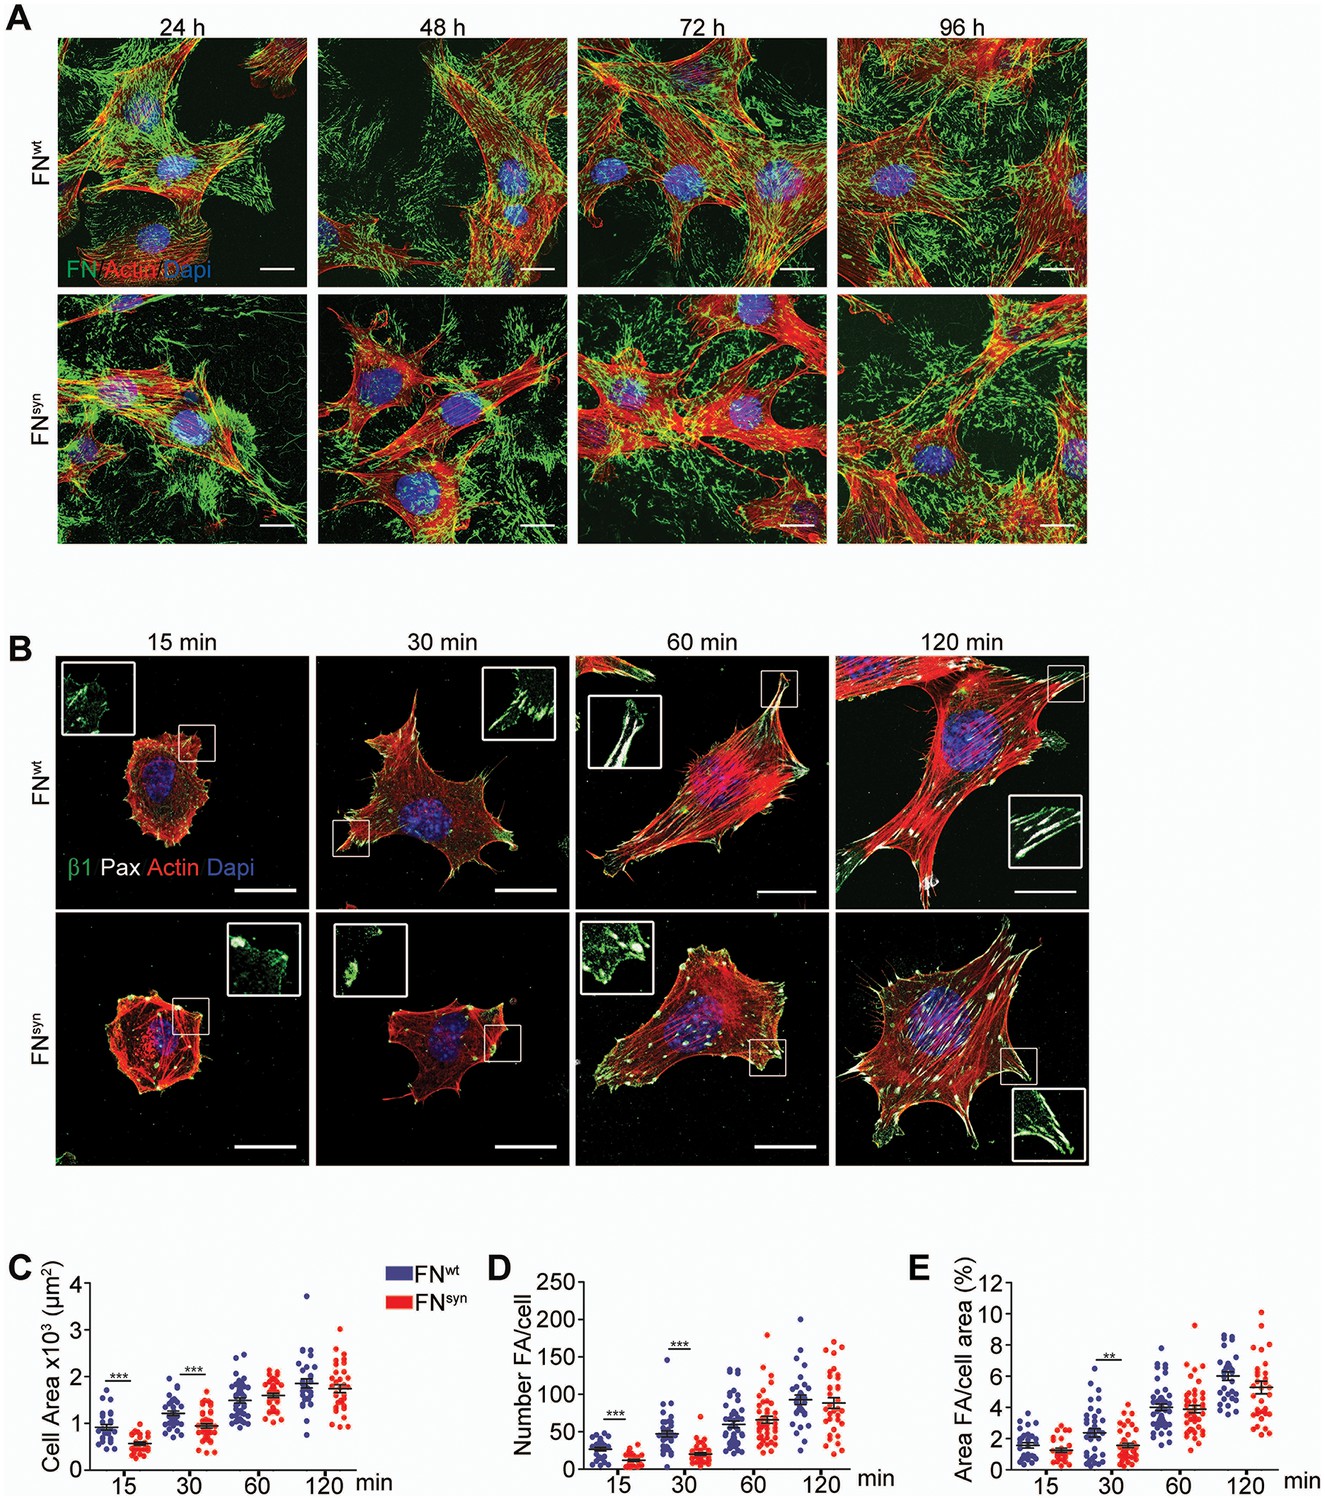
The FN synergy site is dispensable for FN fibrillogenesis, cell adhesion and spreading.
(A) Fn1-Knock-Out (Fn1-KO) fibroblasts grown in 1% plasma derived from either Fn1+/+ or Fn1syn/syn mice, fixed at the indicated times and stained for FN (green), F-actin stain (with Phalloidin; red) and nuclei (with DAPI; blue). Scale bar, 10 μm. (B) Fn1-KO cells seeded on pFNwt or pFNsyn, fixed at the indicated times and stained for F-actin (red), paxillin (white) and total β1 integrin (green). Scale bar, 20 μm. (C–E) Cell size (C), number of FAs per cell (D) and percentage coverage by FAs (paxillin-positive) (E) were quantified (n = 25 cells assessed from three independent experiments; mean ± sem). Statistical significances were calculated using the Student t-test; **p<0.01 and ***p<0.001.
Figure 2—figure supplement 1
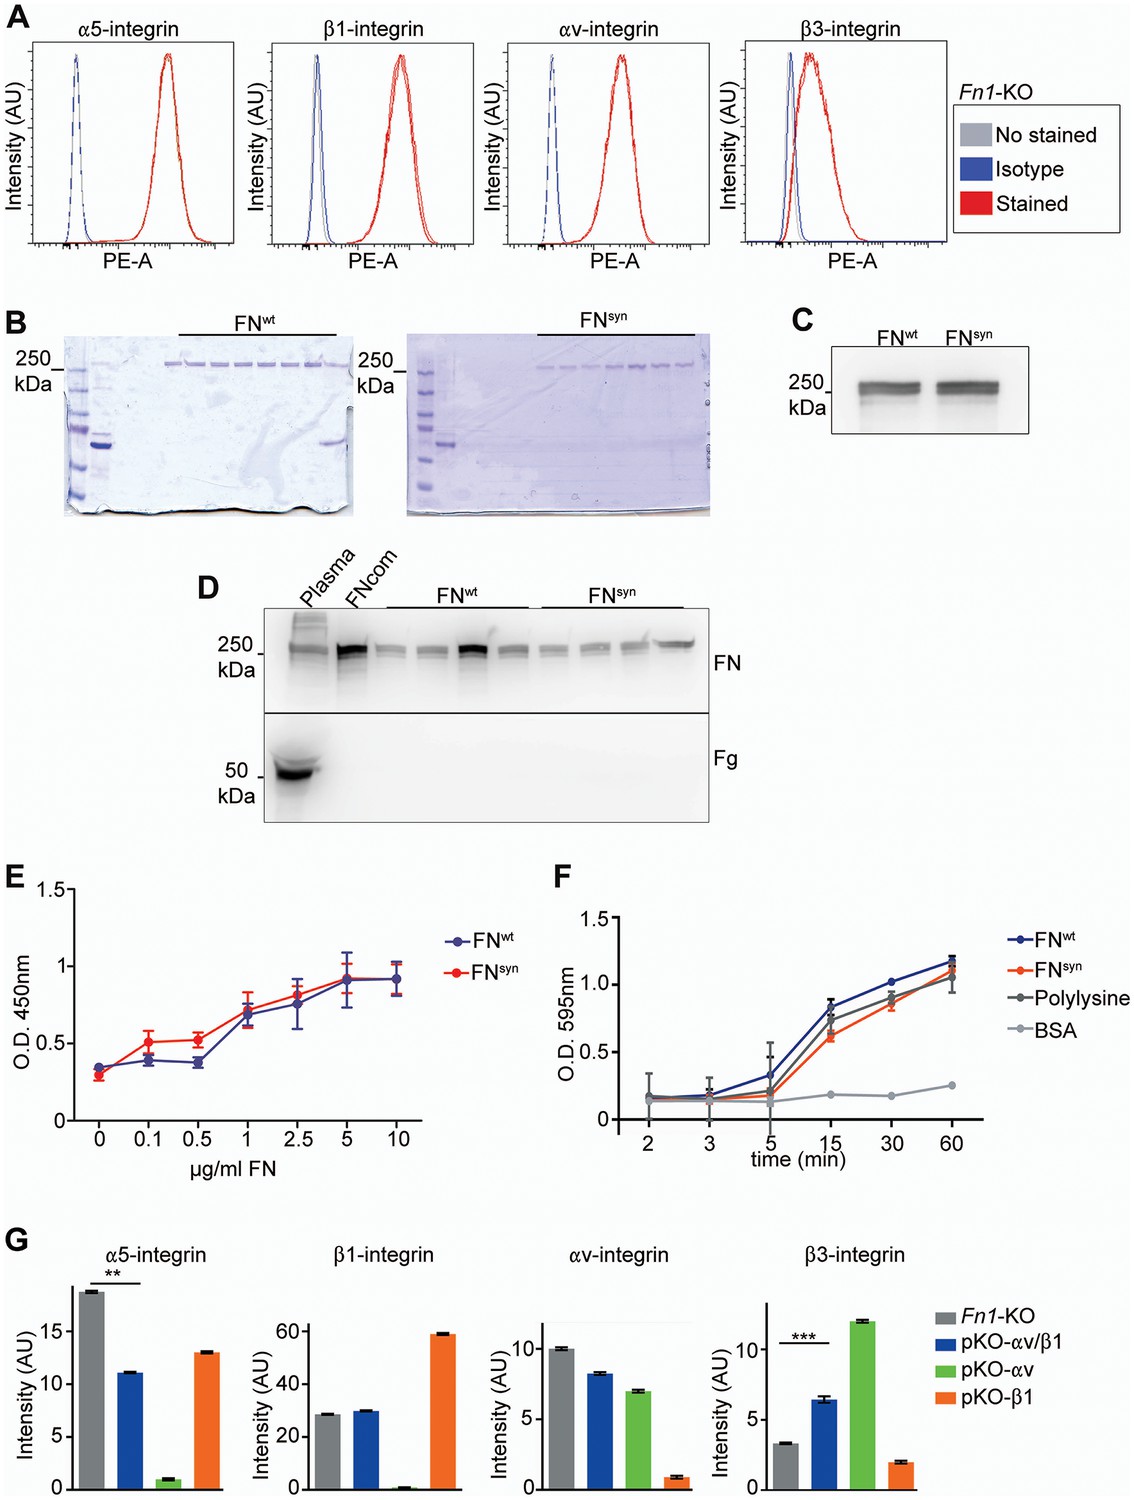
Integrin surface levels and plasma FN purification and glass coating.
(A) Integrin levels on the surface of Fn1-KO fibroblasts analyzed by flow cytometry (graphs show representative results of 3 independent experiments). (B) Coomasie blue staining of purified pFNwt and pFNsyn after PAGE. The second lane shows the starting flow-through, and the 5-11th the fractions with FN. (C) Western-blot of the purified pFNwt and pFNsyn. (D) Western-blot to detect fibrinogen in the purified mouse pFN. The fibrinogen content was below the 4% of protein. (E) ELISA of glass-coverslips coated with different pFN concentrations. (F) Adhesion of Fn1-KO fibroblasts plated to pFNwt, pFNsyn, polylysine and BSA (n = 3 independent experiments for each ligand). (G) FACS analysis of integrin surface levels on Fn1-KO, pKO-αv/β1, pKO-αv and pKO-β1 fibroblasts.
Figure 2—figure supplement 2
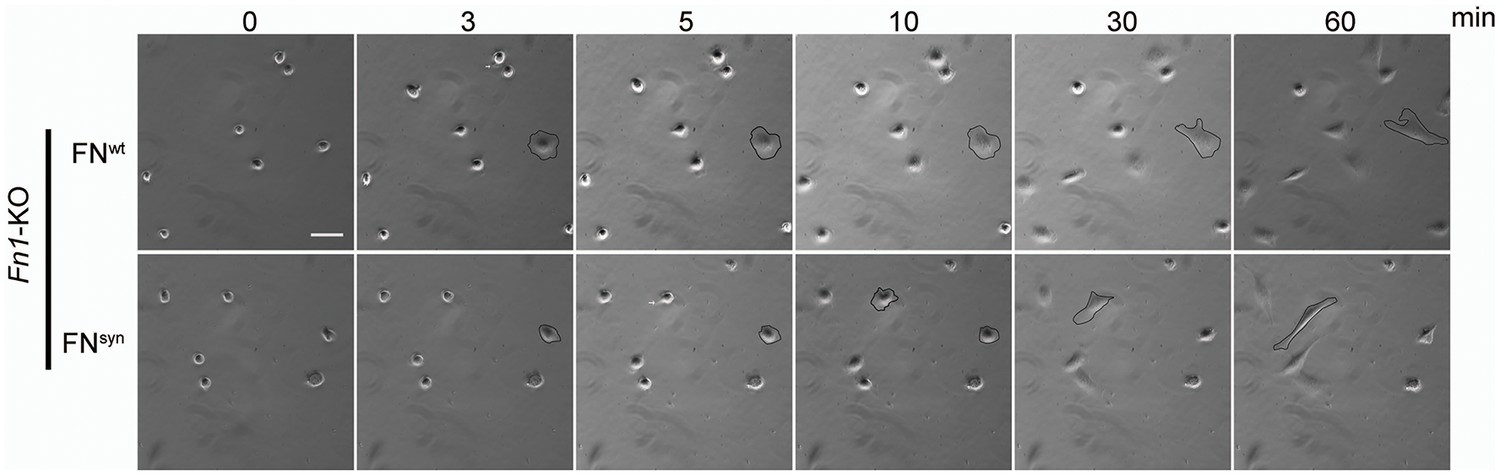
Captures of life-time microscopy videos of Fn1-KO fibroblasts spreading on pFNwt or pFNsyn.
https://doi.org/10.7554/eLife.22264.007
Figure 3 with 1 supplement
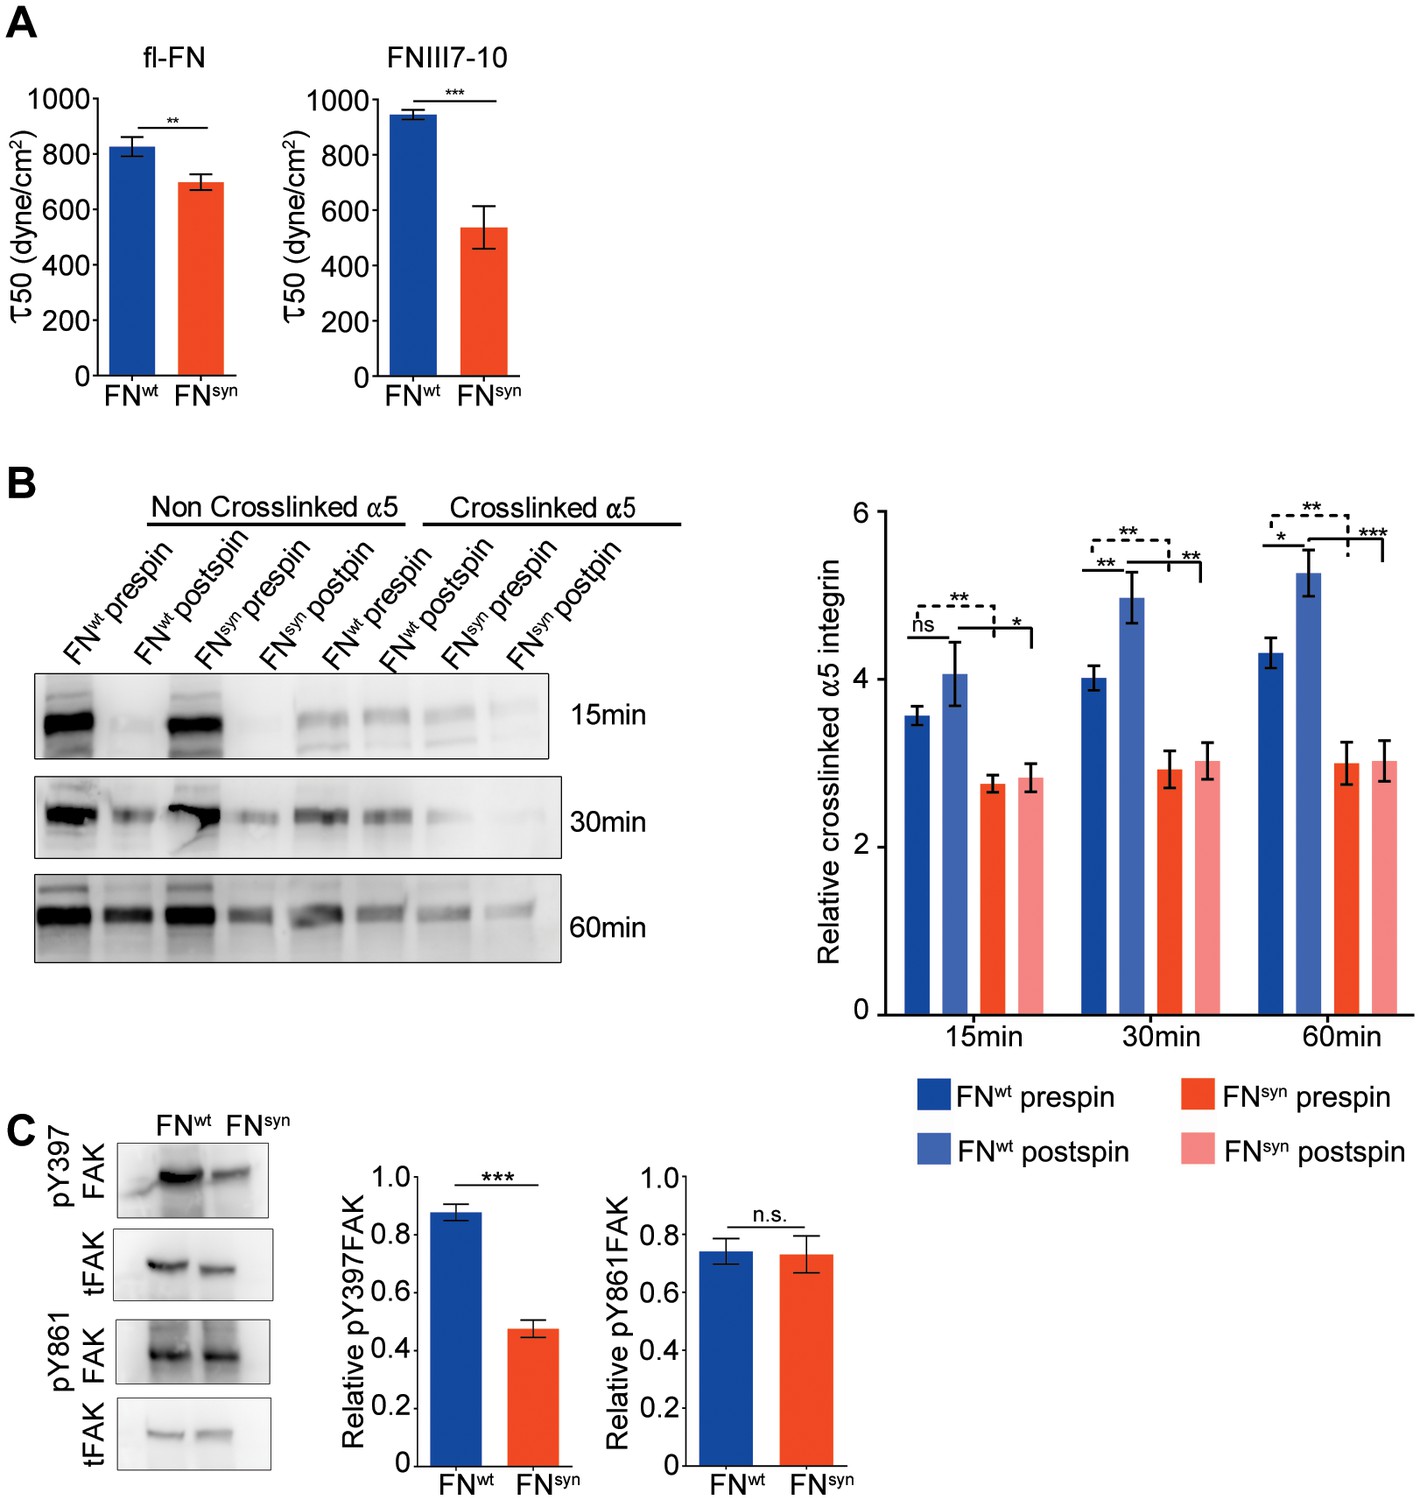
The FN synergy site is required to establish tensioned FN-α5β1 bonds.
(A) Quantification of adhesion strength. 7 × 10⁵Fn1-KO cells attached onto purified, full-length (fl) pFNwt or pFNsyn or FNIII7-10wt or FNIII7-10syn and spun with a spinning disk device (n = 7 independent experiments with fl-FN; n = 3 independent experiments with FNIII7-10; mean ± sem). (B) Western-blot analysis (left) and quantification (right) of cross-linked α5 integrins to pFNwt or pFNsyn before and after applying shear forces (n = 6 independent experiments; mean ± sem). (C) Western-blot analysis (left) and quantification (right) of pY397- and pY861-FAK levels in Fn1-KO cells plated on pFNwt or pFNsyn (n = 6 independent experiments; mean ± sem). Statistical significances were calculated using the Student t-test; *p<0.05, **p<0.01 and ***p<0.001.
Figure 3—figure supplement 1
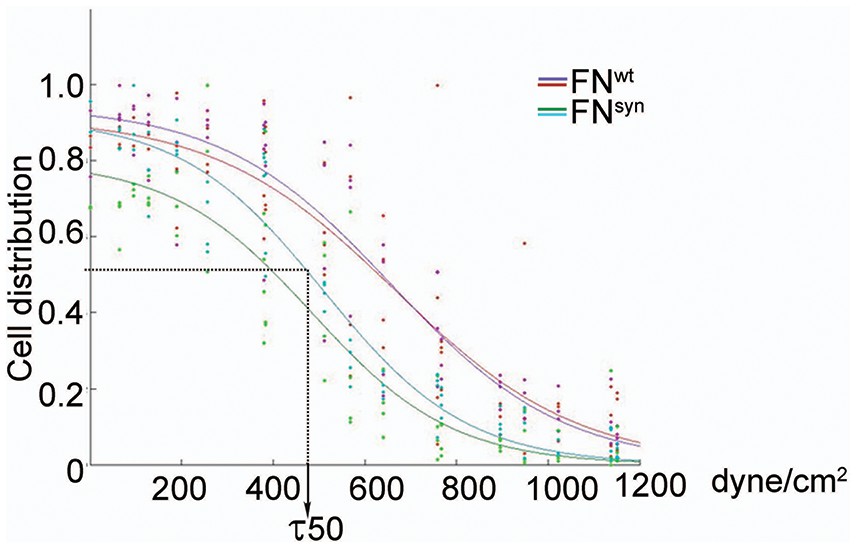
Representative spinning disk experiment showing the cell distribution profile against the shear force.
The shear force was calculated according to the method described by Friedland and Boettiger (Friedland et al., 2009). The force corresponding to the inflexion point of the curve is the τ50.
Figure 4 with 1 supplement
α5β1 integrins require the synergy site in FN to induce cell spreading.
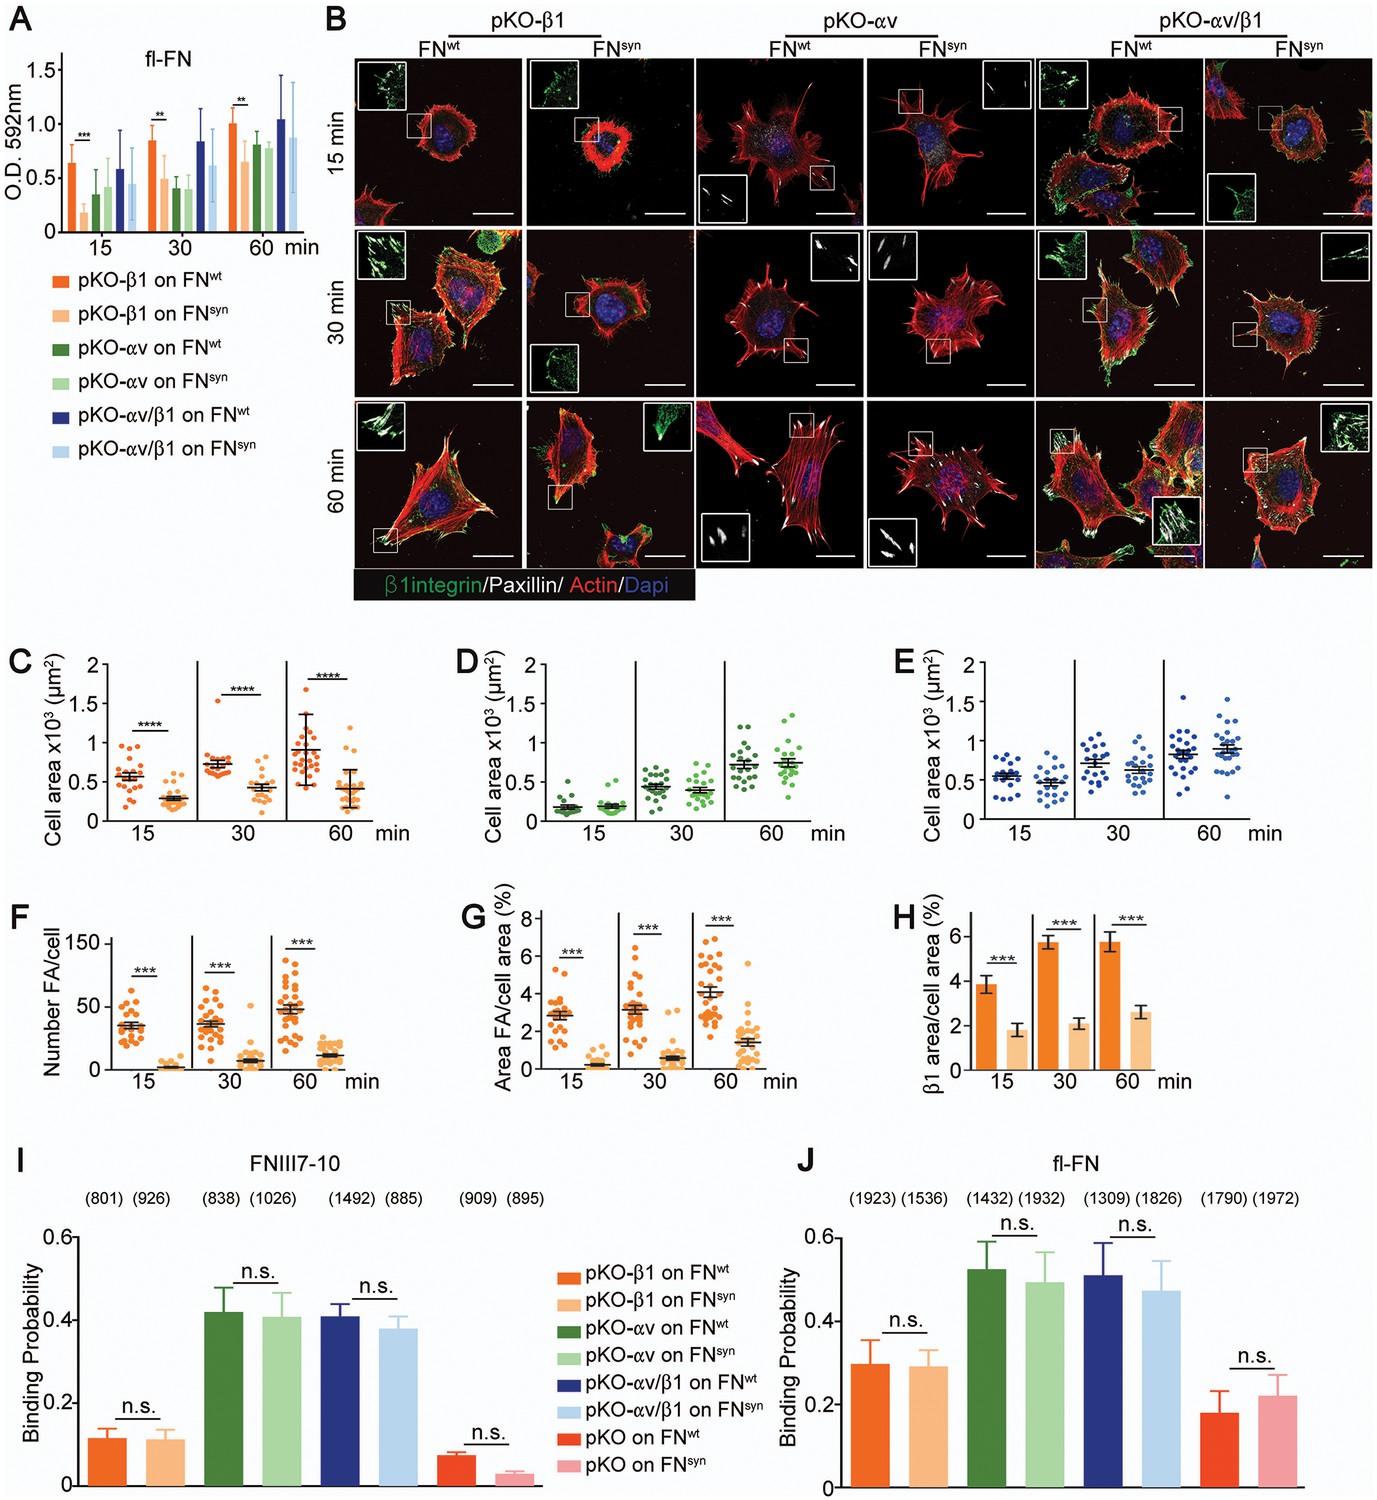
(A) Adhesion of pKO-β1, pKO-αv and pKO-αv/β1 fibroblasts seeded on pFNwt or pFNsyn for indicated times (n = 3 independent experiments; mean ± sem). (B) pKO-β1, pKO-αv and pKO-αv/β1 fibroblasts were seeded on pFNwt or pFNsyn, fixed at the indicated times and stained for total β1 integrin (green), paxillin (white) and F-actin (red). Scale bar, 50 μm. (C–E) Quantification of cell area of pKO-β1 (C), pKO-αv (D) and pKO-αv/β1 (E) cells seeded on pFNwt or pFNsyn for indicated times. (F–H) Quantification of the number of FAs (F), the percentage of FA coverage measured as paxillin-positive area (G) and the percentage of β1 integrin-positive areas referred to the total cell area (H) in pKO-β1 cells (n = 25 cells for each measurement and three independent experiments; mean ± sem). The binding probability of integrins to FNIII7-10wt or FNIII7-10syn fragments (I) and to full length (fl-FN) pFNwt or pFNsyn (J) determined by single-cell force spectroscopy. Numbers in parentheses indicate events studied for each condition. Statistical significances were calculated using the Student t-test; *p<0.05, **p<0.01, ***p<0.001 and ****p<0.0001.
Figure 4—figure supplement 1
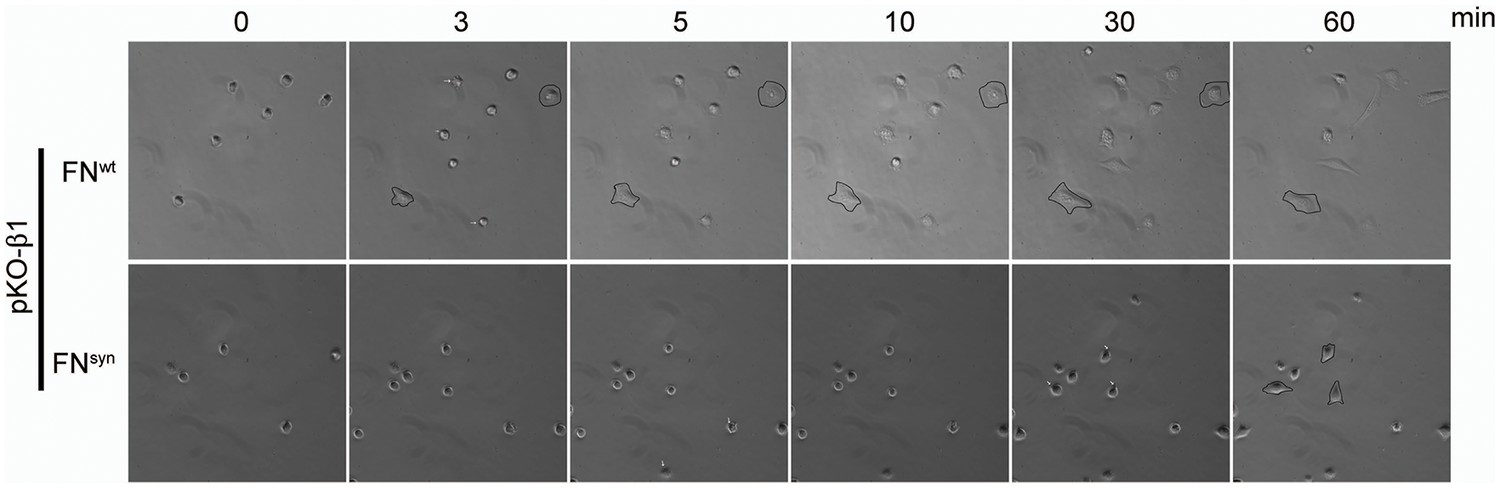
Captures of life-time microscopy videos of pKO-β1 fibroblasts spreading on pFNwt or pFNsyn.
https://doi.org/10.7554/eLife.22264.013
Figure 5 with 1 supplement
Fn1syn/syn;Itgb3-/- mice suffer from severe hemorrhages and fail to separate the blood and lymphatic vasculatures.
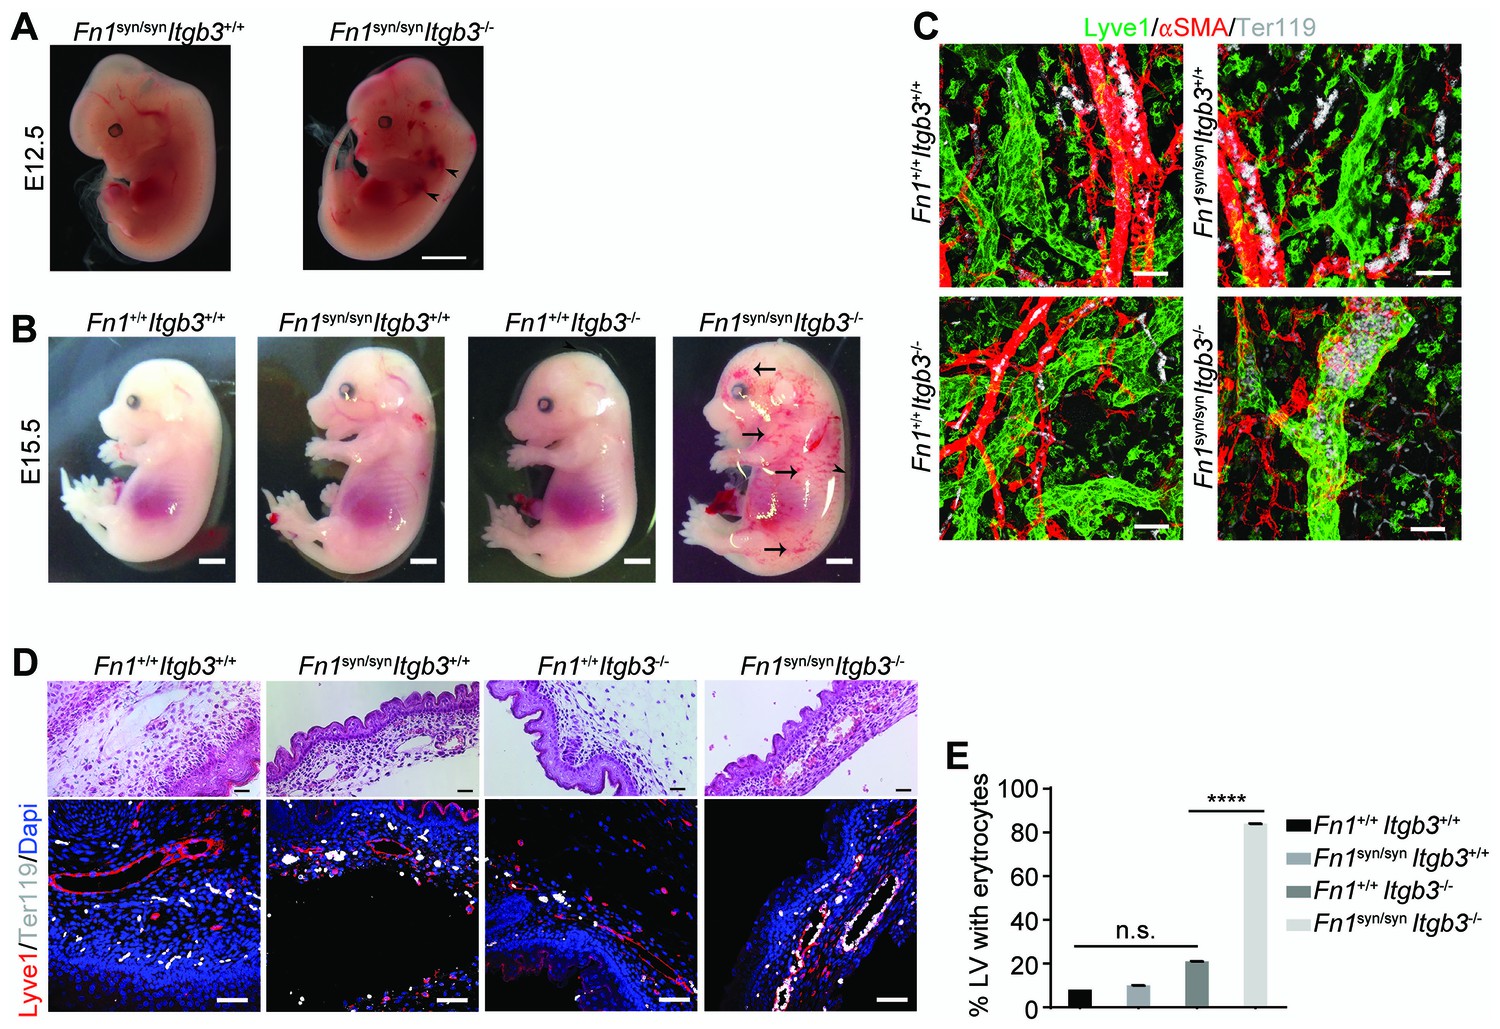
(A) E12.5 Fn1syn/syn;Itgb3-/- embryos display hemorrhages in the jugular and axilar areas in the left side (arrowheads). Scale bar, 50 mm. (B) Representative images from E15.5 littermates embryos resulting from Fn1syn/+;Itgb3-/+ intercrosses. Compound Fn1syn/syn;Itgb3-/- embryos display cutaneous edema (arrowhead) and abundant skin hemorrhages (arrows); scale bars, 50 mm. (C) Skin whole-mount from E15.5 embryos showing Lyve1-positive lymphatic vessels (green), αSMA-positive blood vessels (red) and Terr119-positive erythrocytes (white). The lymphatic vessels of compound Fn1syn/syn;Itgb3-/- embryos are dilated, covered by ectopic αSMA-positive cells and filled with erythrocytes. Scale bar, 50 μm. (D) Representative images of skin sections stained with H and E (upper panel) and Lyve1 and Terr119 (lower panel) showing erythrocytes in lymphatic vessels. Scale bar, 50 μm. (E) Quantification of the percentage of lymphatic vessels filled with Ter119-positive erythrocytes (n = 40 vessels counted per embryo, in two embryos per each genotype; mean ± sem). Statistical significances were calculated using the Student t-test: ****p<0.0001.
Figure 5—figure supplement 1
Blood vessel formation in Fn1syn/syn; Itgb3-/-embryos.
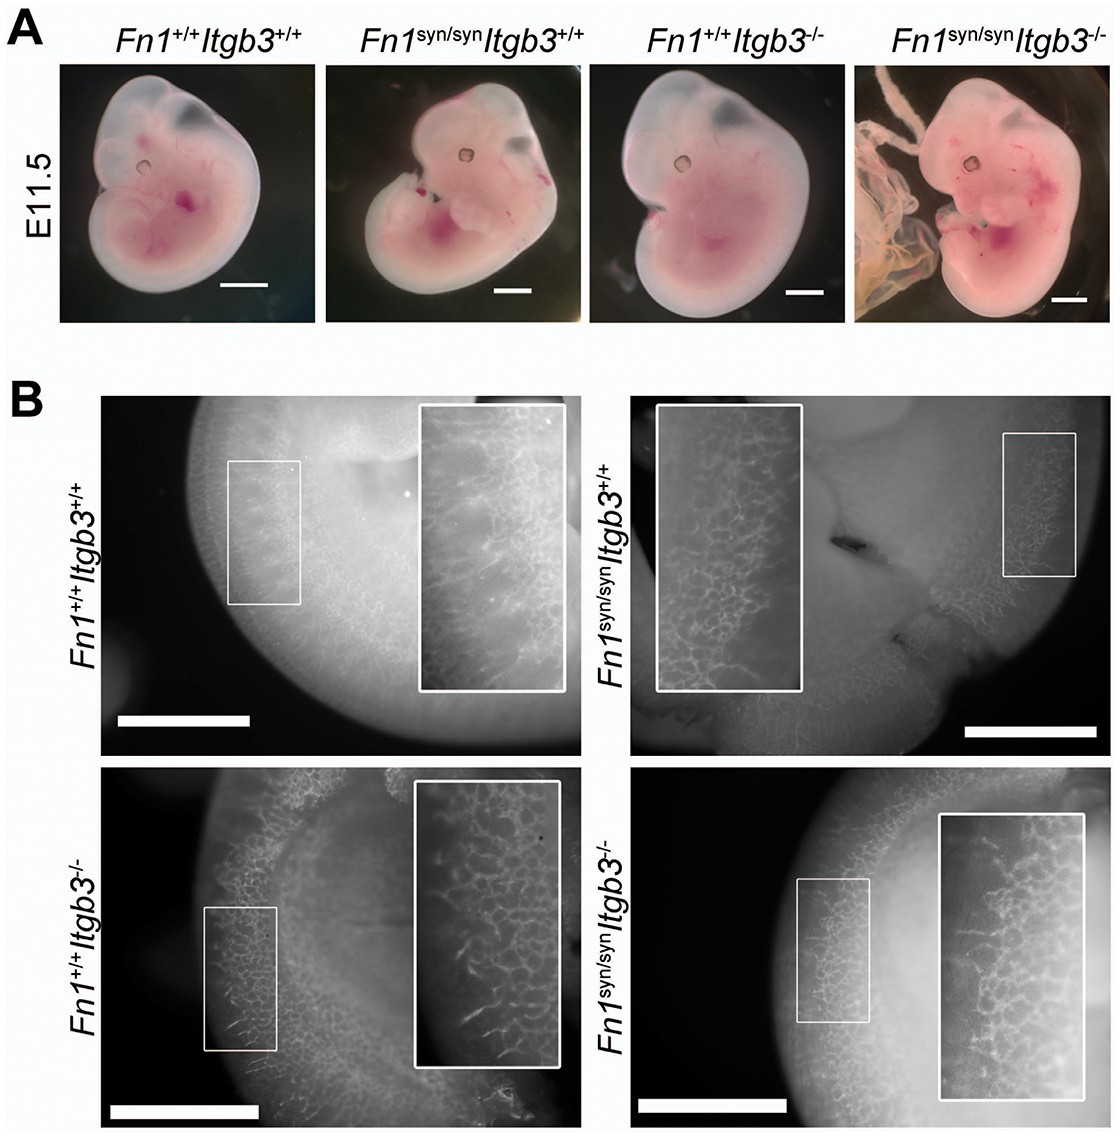
(A) E11.5 embryos of indicated genotype. Scale bar, 2 mm (B) E11.5 whole mount embryos of indicated genotype stained with PECAM. High magnifications indicate that Fn1syn/syn;Itgb3-/- embryos have normal angiogenesis. Scale bar, 1 mm.
Figure 6
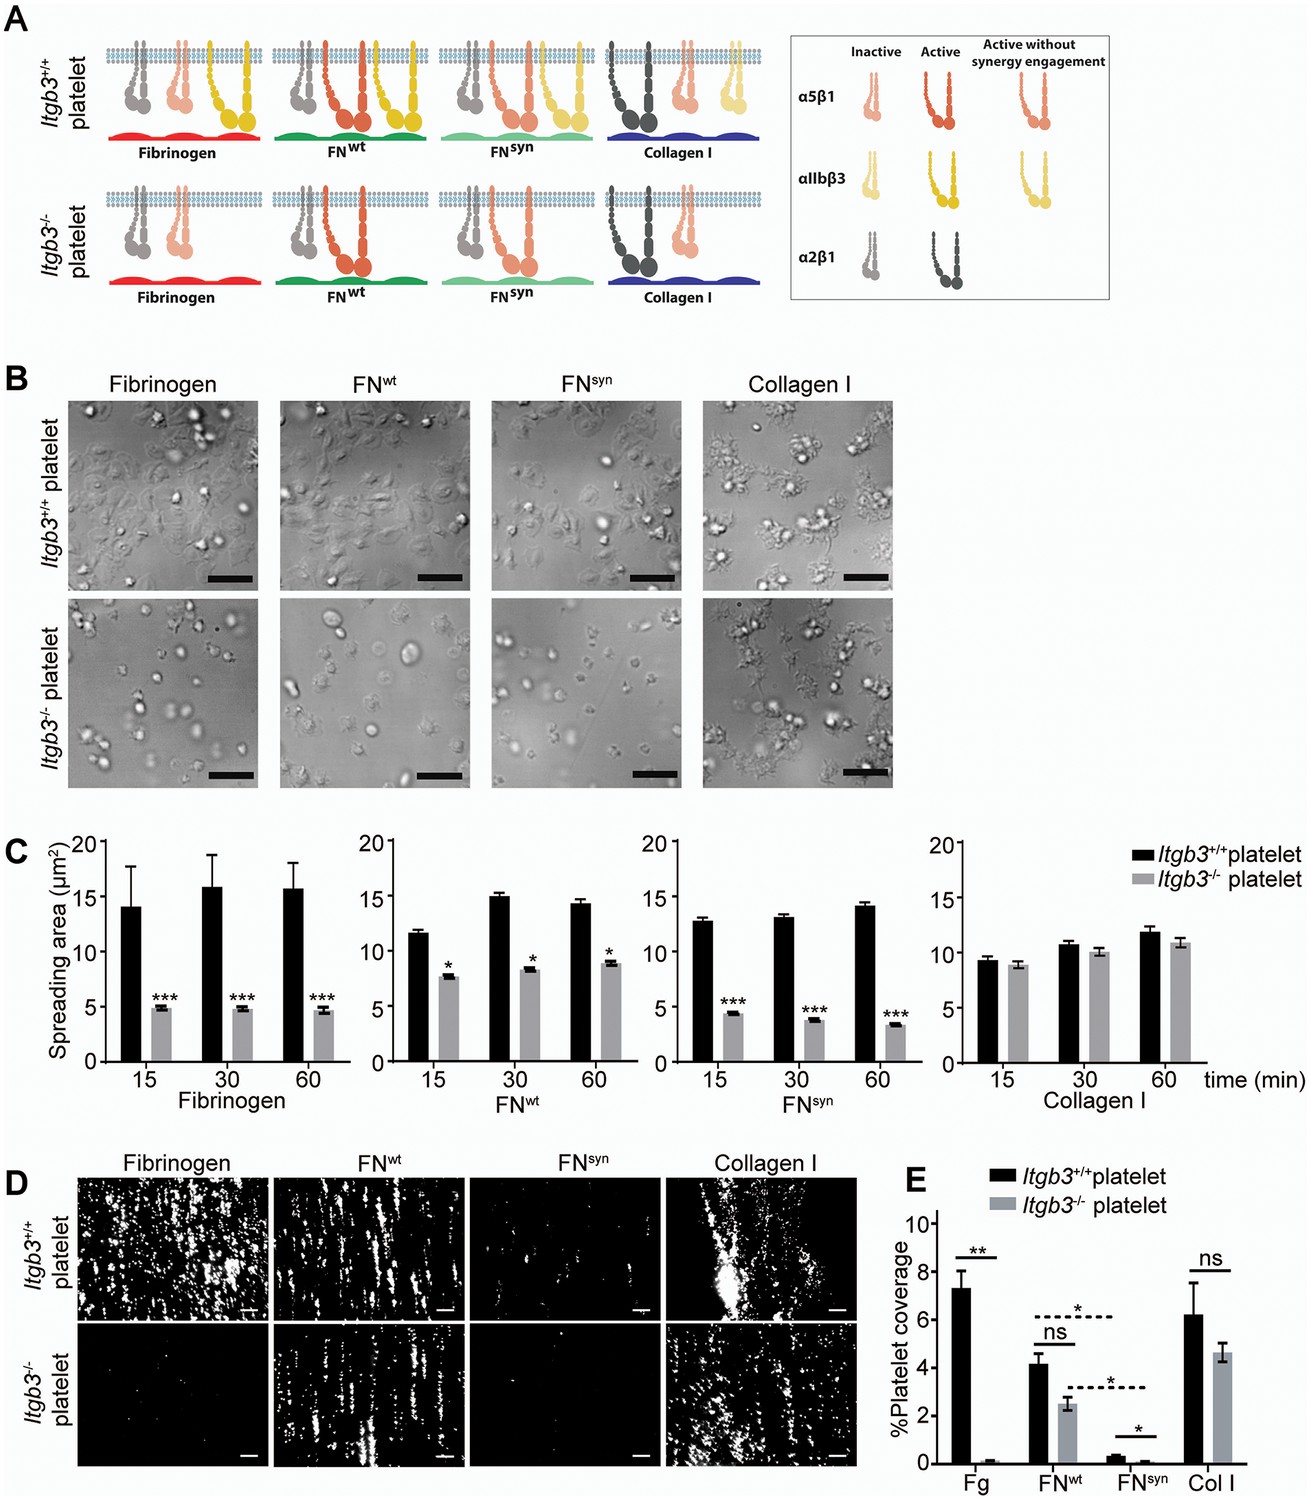
Shear flow exposed platelets fail to adhere to pFNsyn.
(A) Cartoon showing the platelet integrins that can be ligated to the different substrates used in the experiments. The color intensity of the integrin denotes whether the integrin is active or inactive. (B) Spreading of Itgb3+/+ and Itgb3-/- platelets after 1 hr on fibrinogen, pFNwt, pFNsyn and type I collagen. Scale bars, 10 μm. (C) Quantification of the platelet area at indicated times (n = 100 platelets per each condition in three independent experiments; mean ± sem). (D) Representative figures of fluorescently labeled Itgb3+/+ or Itgb3-/- platelets seeded on indicated substrates and exposed to shear flow. Scale bar, 40 μm. (E) Platelet coverage after 10 min shear flow of 1000 s−1. (n = 10 pictures per experiment, four independent experiments for each condition; mean ± sem). Statistical significances were calculated using the Student t-test; *p<0.05, **p<0.01 and ***p<0.001.
Figure 7
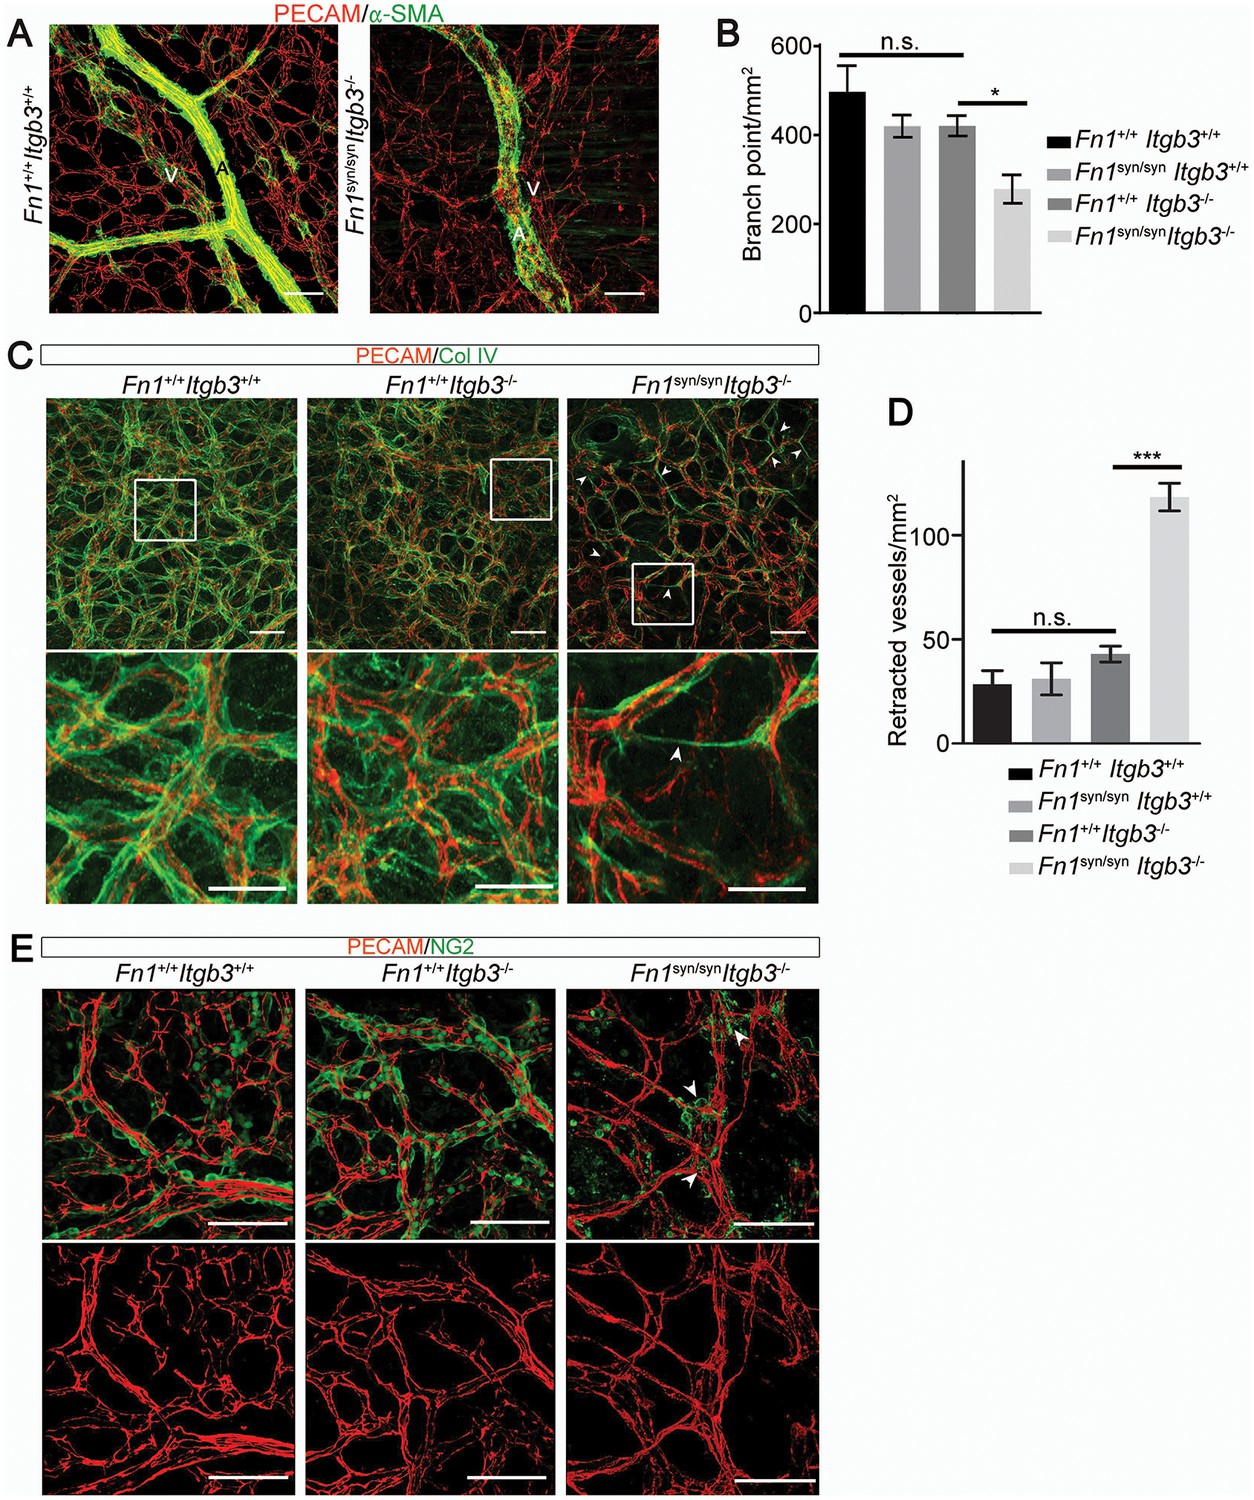
Malformed blood vessels in Fn1syn/syn;Itgb3-/- embryos.
(A) PECAM-positive endothelial cells (red) and α-SMA-positive smooth muscle cells (green) in dermal whole mounts from E15.5 Fn1+/+;Itgb3+/+ and Fn1syn/syn;Itgb3-/- littermate embryos indicate veins (V) and arteries (A). (B) Quantification of the number of branching points (n = 10–15 images of 2–3 embryos; mean ± sem). (C) Vascular basement membranes in dermal whole mounts from E15.5 Fn1+/+;Itgb3+/+, Fn1+/+;Itgb3-/- and Fn1syn/syn;Itgb3-/- littermate embryos stained for type IV collagen (green) and PECAM-positive endothelial cells (red). Arrowheads show small vessels lacking lumen. (D) Quantification of retracted vessels (n = 14–23 from 4–7 embryos; mean ± sem). (E) PECAM-positive endothelial cells (red) and NG2-positive pericytes (green) in dermal whole-mounts from E15.5 Fn1+/+;Itgb3+/+, Fn1+/+;Itgb3-/- and Fn1syn/syn;Itgb3-/- littermate embryos. Note pericytes are sparse, absent or aggregate on mutant vessels (arrowheads). Statistical significances were calculated using the Student t-test; *p<0.05, and ***p<0.001. Scale bars, 50 μm.
Figure 8
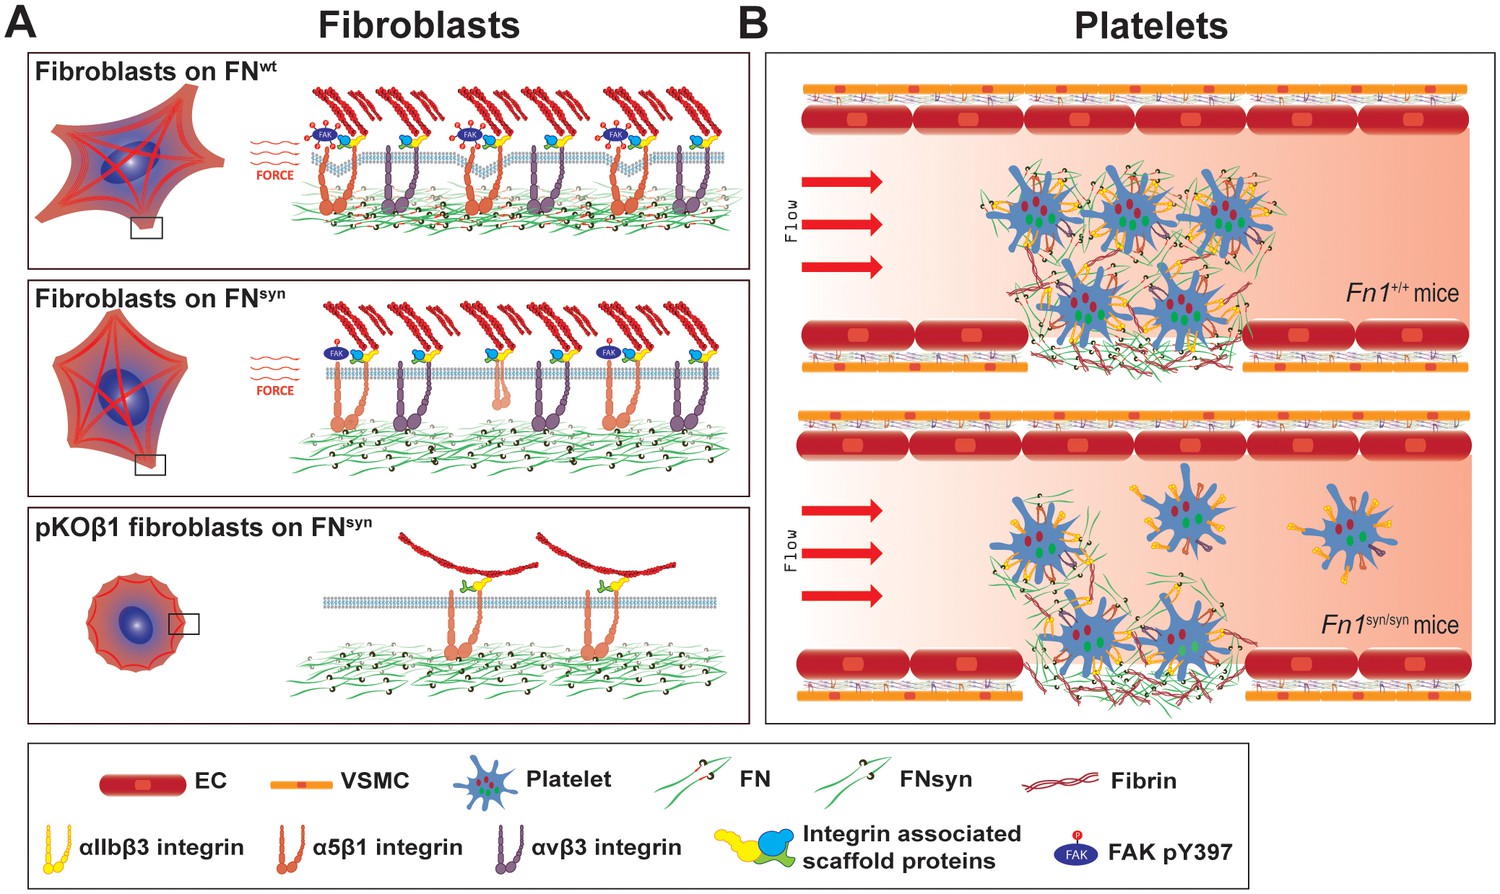
The major role of the FN synergy site is to re-enforce cell adhesion.
(A) Hydrodynamic shear force-exposed fibroblasts seeded on a FNwt-coated surface form catch-bonds that strengthen α5β1 integrin-mediated adhesions to FN and trigger phosphorylation of Y397-FAK (upper image). On FNsyn-coated surfaces, the αvβ3 integrins compensate for the absent synergy site allowing fibroblast adhesion and the reduced α5β1 binding strength leads to diminished phosphorylation of pY397-FAK (middle image). The elimination of αv-class integrins decreases cell adhesion on FNsyn-coated surfaces, reduces cell spreading and delays the maturation of FA and fibrillar adhesions (lower image). (B) Platelets in Fn1+/+ mice form tight aggregates on injured vessel walls that withstand the shear forces of the blood flow (upper image), while platelets in an injured vessel in Fn1syn/syn mice fail to withstand the blood flow leading to a delayed thrombus formation (lower image). Endothelial cells (EC); vascular smooth muscle cells (VSMC).
Videos
Video 1
Life-time microscopy video of Fn1KO fibroblasts on pFNwt.
https://doi.org/10.7554/eLife.22264.008
Video 2
Life-time microscopy video of Fn1KO fibroblasts on pFNsyn.
https://doi.org/10.7554/eLife.22264.009
Video 3
Life-time microscopy video of pKO-β1 fibroblasts on pFNwt.
https://doi.org/10.7554/eLife.22264.014
Video 4
Life-time microscopy video of pKO-β1 fibroblasts on pFNsyn.
https://doi.org/10.7554/eLife.22264.015Tables
Table 1
Progeny of Fn1syn/+;Itgb3+/- x Fn1syn/+;Itgb3+/- intercrosses.
| Age | Num. | Fn1syn/syn Itgb3+/- | Fn1syn/syn Itgb3+/+ | Fn1syn/syn Itgb3-/- | Fn1+/syn Itgb3+/- | Fn1+/syn Itgb3+/+ | Fn1+/syn Itgb3-/- | Fn1+/+ Itgb3+/- | Fn1+/+ Itgb3+/+ | Fn1+/+ Itgb3-/- |
|---|---|---|---|---|---|---|---|---|---|---|
| E11.5 | 36 | 6 (16.7%) | 1 (2.8%) | 1 (2.8%) | 10 (27.8%) | 6 (16.7%) | 4 (11.1%) | 5 (13.9%) | 2 (5.6%) | 1 (2.8%) |
| E14.5 | 23 | 2 (8.7%) | 2 (8.7%) | 2 (8.7%) | 5 (21.7%) | 5 (21.7%) | 1 (4.3%) | 1 (4.3%) | 4 (17.3%) | 1 (4.3%) |
| E15.5 | 121 | 12 (9.9%) | 5 (4.1%) | 3 (2.5%) | 39 (32.2%) | 5 (15.4%) | 12 (9.9%) | 14 (11.6%) | 17 (14%) | 4 (3.3%) |
| E16.5 | 16 | 2 (12.5%) | 1 (6.25%) | 0 | 5 (31.5%) | 1 (6.25%) | 1 (6.25%) | 3 (37.5%) | 1 (6.25%) | 2 (12.5%) |
| E17.5 | 16 | 2 (12.5%) | 0 | 0 | 6 (23%) | 3 (19%) | 2 (12.5%) | 2 (12.5%) | 1 (8%) | 0 |
| P 21 | 245 | 33 (13.5%) | 32 (13%) | 0 | 57 (23%) | 46 (18.7%) | 13 (5.3%) | 35 (14.4%) | 17 (3.9%) | 12 (4.9%) |
| Mendelian Distribution | 100 | 12.5% | 6.25% | 6.25% | 25% | 12.5% | 12.5% | 12.5% | 6.25% | 6.25% |
-
Table 1—source data 1
Progeny of Fn1syn/syn;Itgb3+/- x Fn1syn/syn;Itgb3+/- crosses
- https://doi.org/10.7554/eLife.22264.017
Download links
A two-part list of links to download the article, or parts of the article, in various formats.
Downloads (link to download the article as PDF)
Open citations (links to open the citations from this article in various online reference manager services)
Cite this article (links to download the citations from this article in formats compatible with various reference manager tools)
The fibronectin synergy site re-enforces cell adhesion and mediates a crosstalk between integrin classes
eLife 6:e22264.
https://doi.org/10.7554/eLife.22264


