Activity-dependent regulation of T-type calcium channels by submembrane calcium ions
- CNRS, INSERM, University of Montpellier, France
- LabEx 'Ion Channel Science and Therapeutics', France
Figures
Figure 1
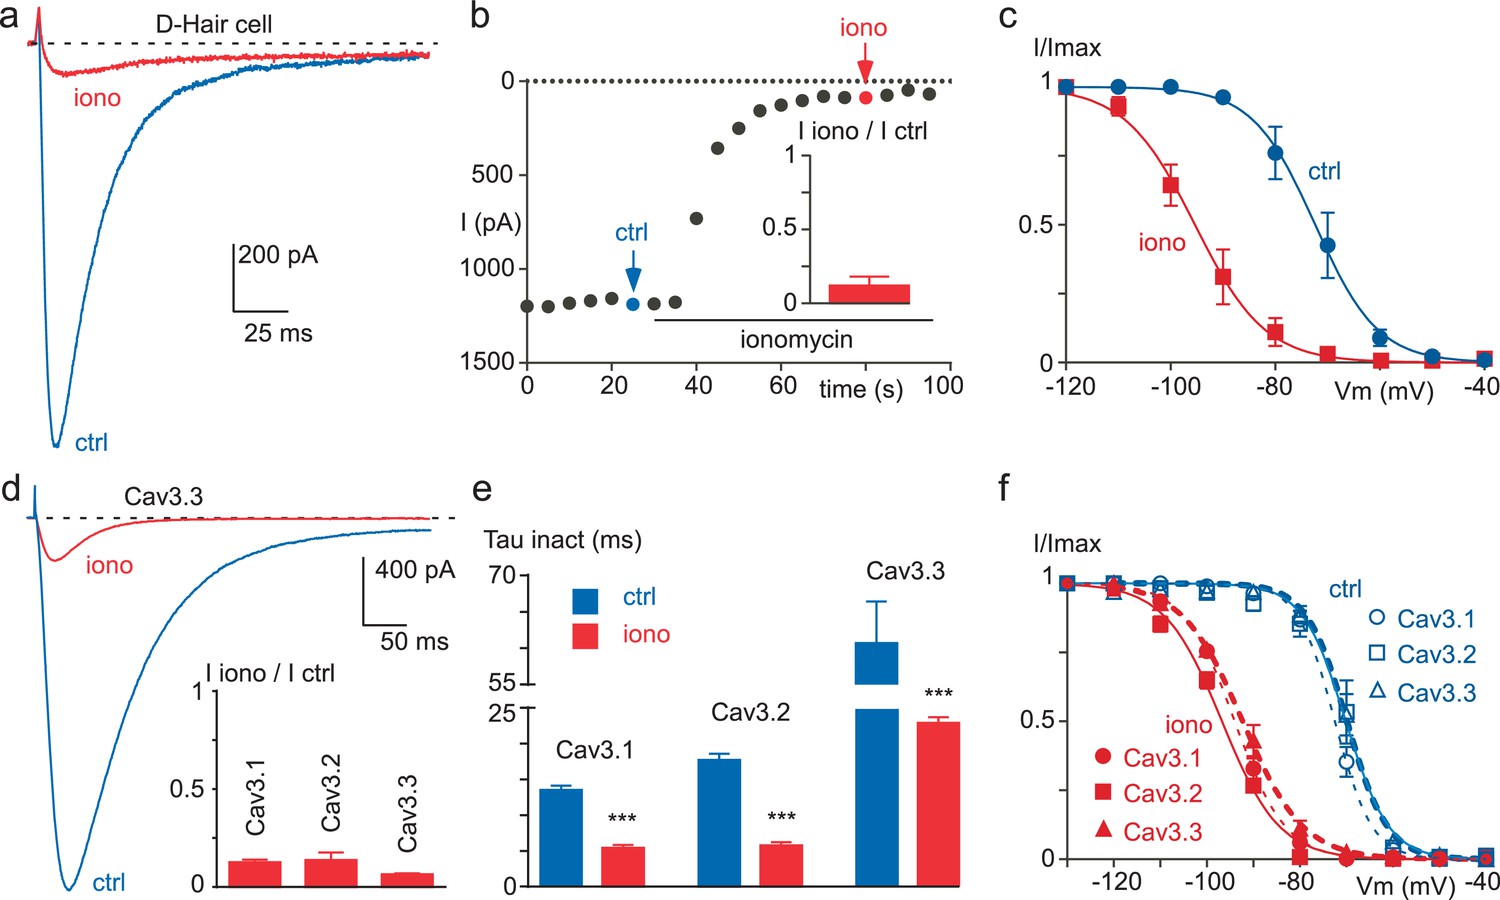
Ionomycin induces inhibition of neuronal T-type and recombinant Cav3 currents.
(a–c) Extracellular application of ionomycin induces inhibition of the native T-type current in D-hair sensory neurons. (a) Effect of 10 µM ionomycin (iono) on the T-type current recorded from a D-hair sensory neuron. (b) Time course and average effect (inset) of ionomycin (n = 5). (c) Steady-state inactivation of the native T-type current before (ctrl) and after ionomycin application (n = 5). (d–f) Ionomycin induces inhibition of the recombinant Cav3.1, Cav3.2 and Cav3.3 currents. (d) Effect of ionomycin application (10 µM) on the Cav3.3 current amplitude. Average effect of ionomycin on Cav3.1, Cav3.2 and Cav3.3 currents (inset, n = 6–7 per bar). (e) Inactivation kinetics of the Cav3 currents in the absence and in the presence of ionomycin (n = 6–7 per bar). (f) Steady-state inactivation of Cav3.1, Cav3.2 and Cav3.3 currents before and after ionomycin application (n = 6–7). In (a), (b), (d) and (e), the currents were recorded at −30 mV from a holding potential (HP) of −80 mV. In (c) and (f), the currents were elicited at −30 mV from HPs ranged from −130 to −40 mV (5 s duration) and the data were fitted with the Boltzmann equation.
Figure 2 with 2 supplements
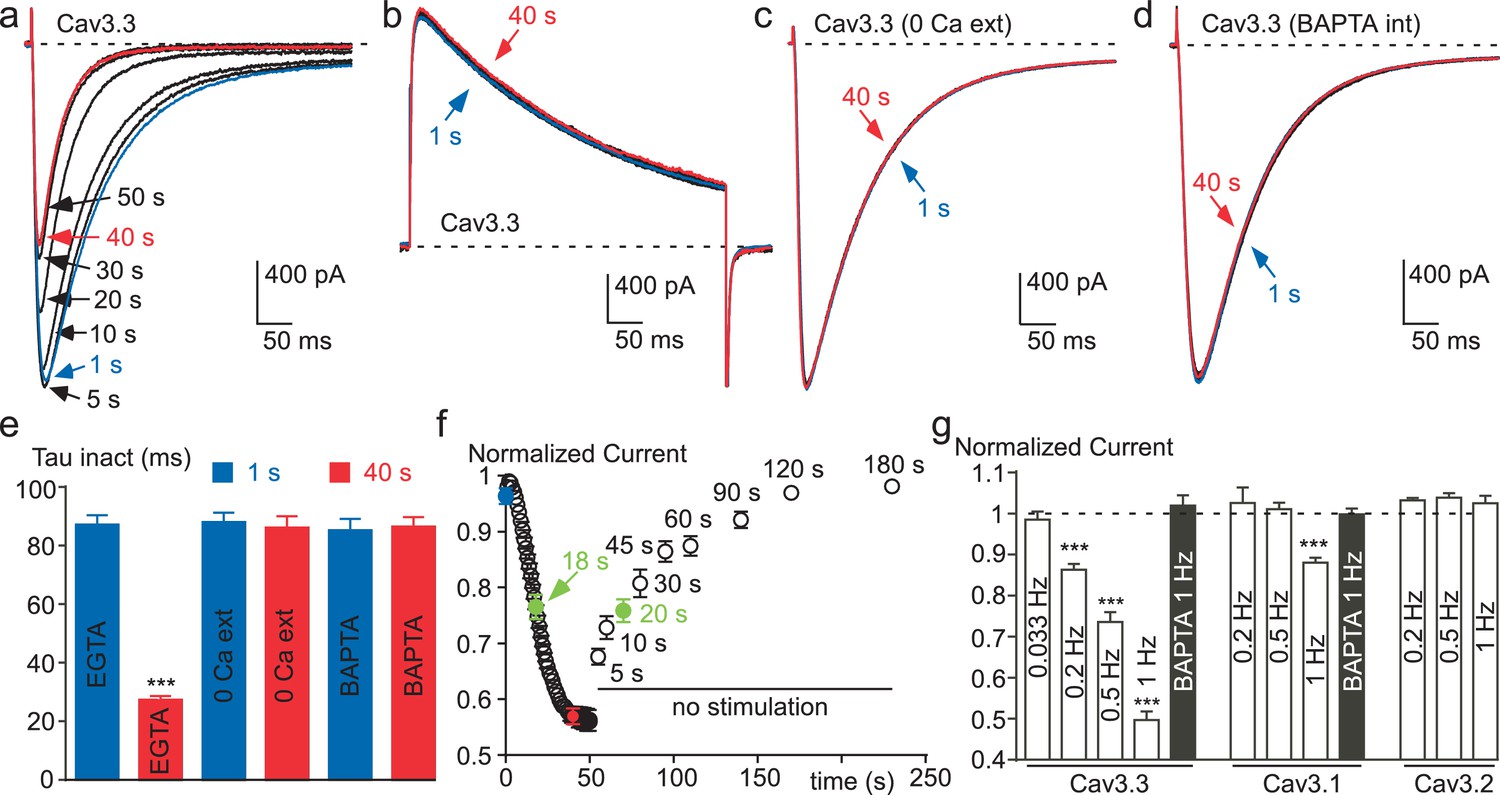
Ca2+ induces a time-dependent inhibition of the Cav3.3 current at high frequency of stimulation.
(a) Typical examples of Cav3.3 currents elicited using a 1 Hz test pulse (TP) stimulation of −30 mV (450 ms duration) from a HP of −100 mV. The traces obtained at the beginning of the stimulation (1 s) and after 40 s stimulation are indicated in blue and red, respectively. (b–d) Similar experiments for a TP of +100 mV (b), in the absence extracellular Ca2+ (c, TP −30 mV) and in the presence of intracellular BAPTA (d, TP −30 mV). (e) Inactivation kinetics of the Cav3.3 current measured at the beginning (1 s, blue bars) and after 40 s stimulation (red bars, n = 15–28 per bar). (f) Time-course of the Cav3.3 current inhibition during 1 Hz stimulation and time-course of the recovery of the Cav3.3 current as a function of time after stimulation (n = 13–28 per point). The half-time of both inhibition and recovery of the Cav3.3 current are indicated in green. (g) Summary of the data obtained on the three Cav3 currents at different frequencies of TP stimulation (n = 5–40 per bar).
Figure 2—figure supplement 1
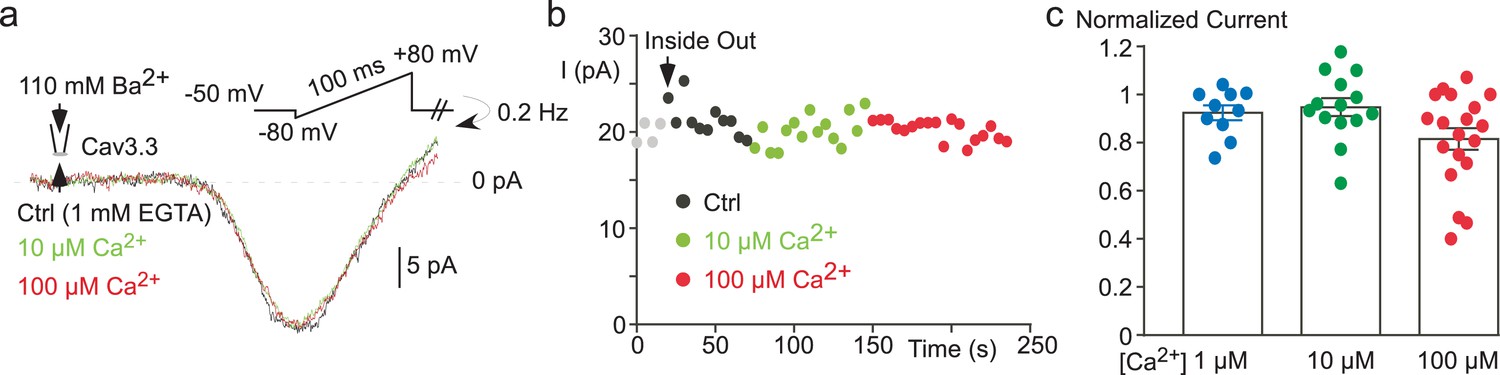
The effect of free Ca2+ application on the Cav3.3 current recorded in cell-free inside-out patches.
(a) Effect of 10 µM and 100 µM Ca2+-containing solution on the Cav3.3 current recorded during voltage-ramp protocols in the inside-out patch configuration. (b) Time course of the Cav3.3 current during the experiment presented in (a). (c) Scatter plot and average effect of 1 µM, 10 µM and 100 µM Ca2+-containing solution (n = 10–19 per bar).
Figure 2—figure supplement 2
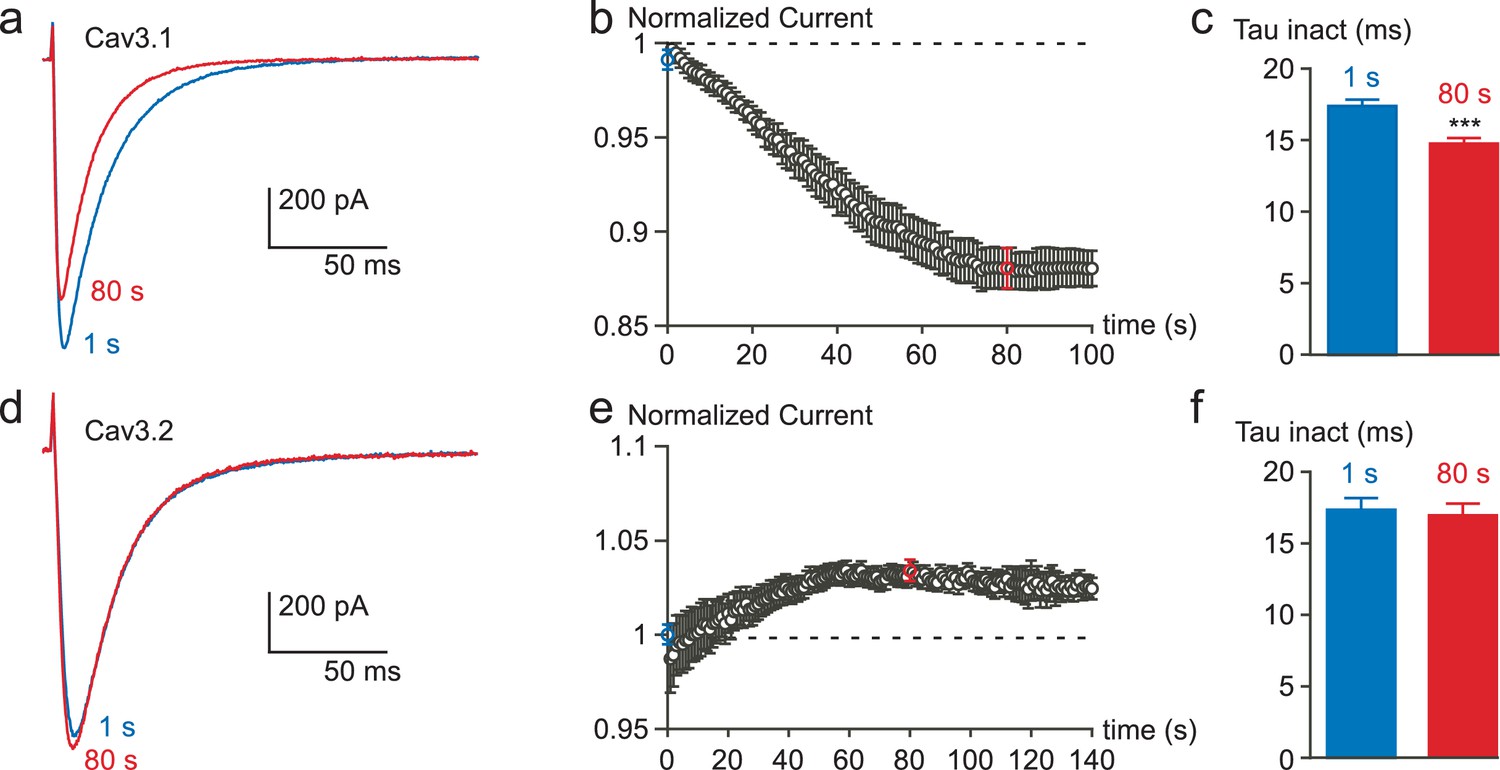
Inhibition of the Cav3.1 current at a high frequency of TP stimulation but not of the Cav3.2 current.
Typical examples of Cav3.1 and Cav3.2 currents elicited by a TP stimulation at a frequency of 1 Hz (TP of −30 mV, 180 ms duration) from a HP of −100 mV. (a) Cav3.1 current recorded at the beginning of the stimulation (1 s) and after 80 s stimulation (80 s). (b) Time-course of the Cav3.1 current inhibition during this 1 Hz stimulation protocol (n = 40). (c) Inactivation kinetics of the Cav3.1 current measured at the beginning (1 s) and after 80 s of stimulation (n = 40). (d) Cav3.2 current recorded at the beginning of the stimulation (1 s) and after 80 s stimulation. (e) Time-course of the Cav3.2 current during a 1 Hz stimulation protocol (n = 23). (f) Inactivation kinetics of the Cav3.2 current measured at the beginning (1 s) and after 80 s stimulation (n = 23).
Figure 3 with 1 supplement
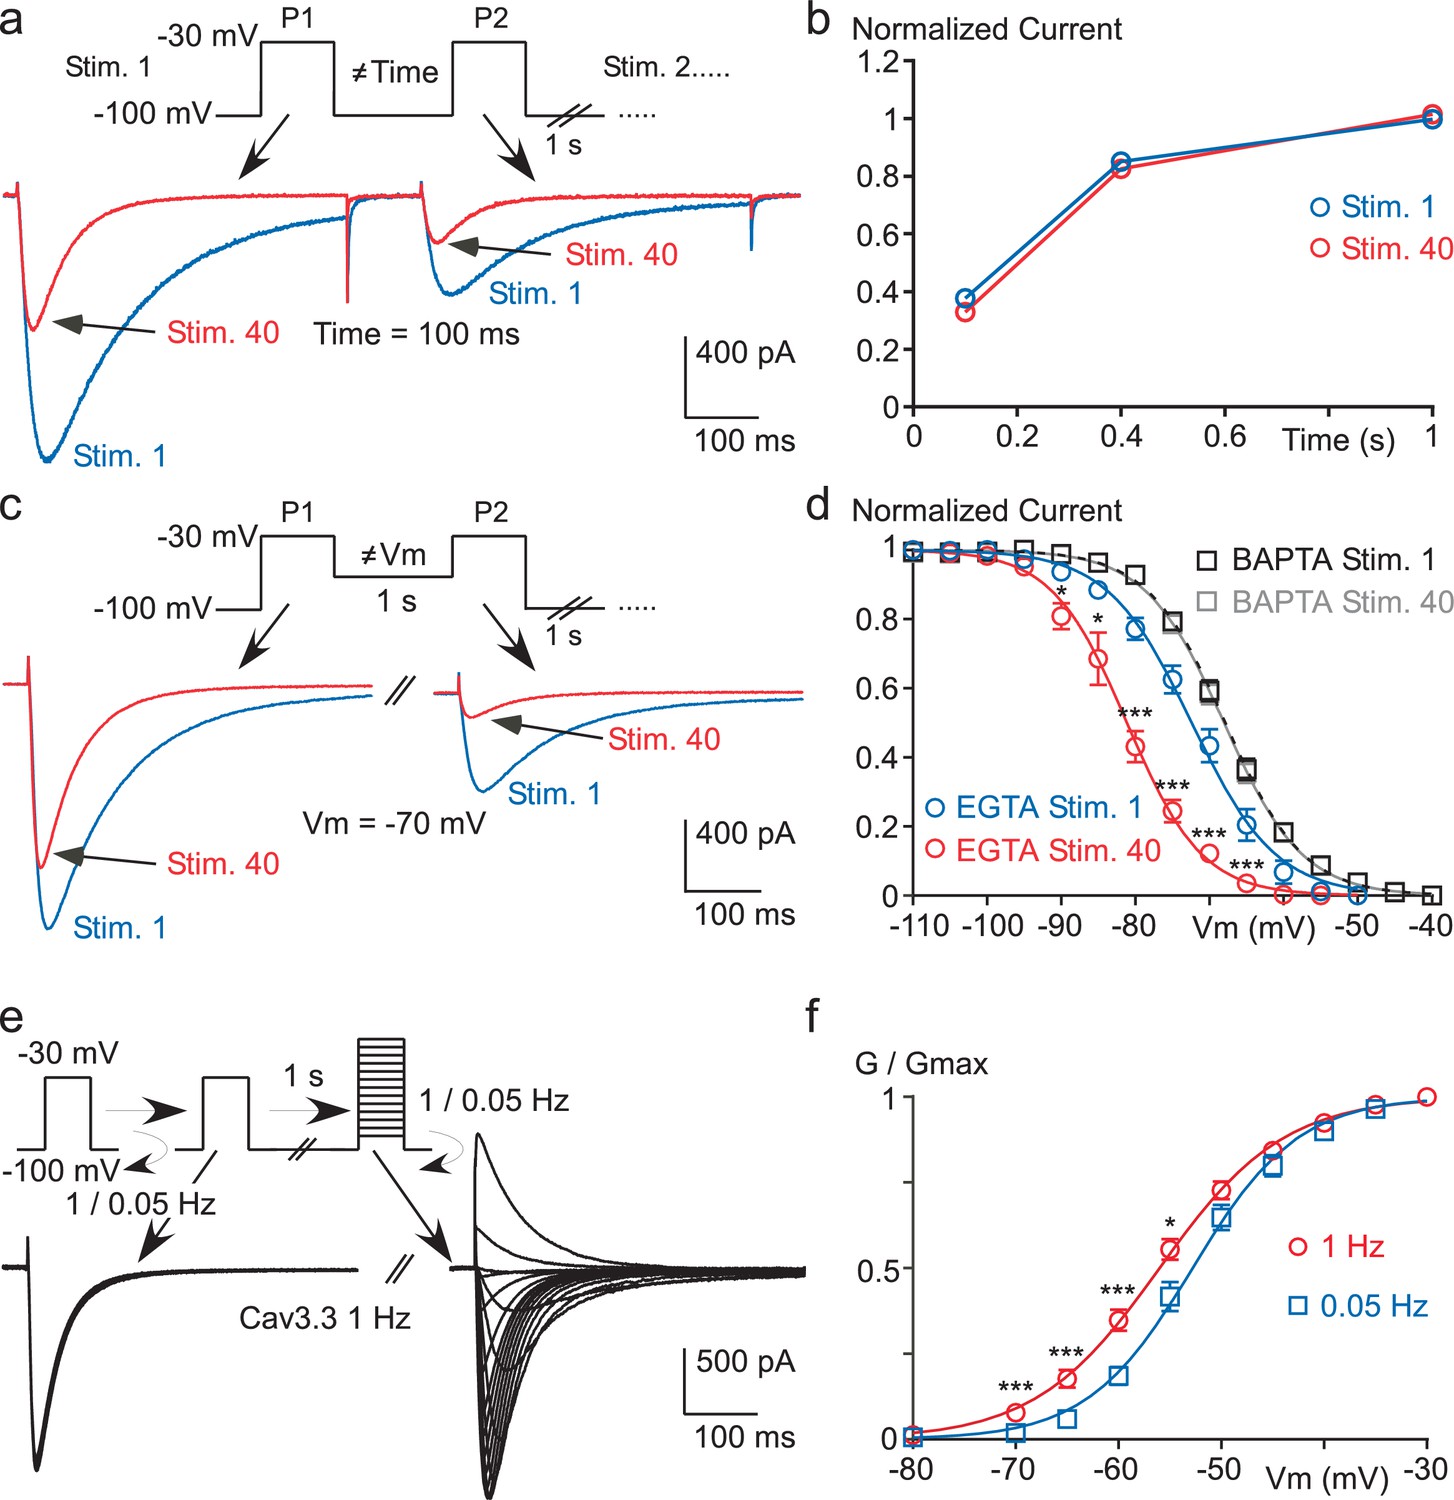
High frequency stimulation induces a Ca2+-dependent negative shift in the Cav3.3 steady-state inactivation properties.
(a–b) Recovery from short-term inactivation of the Cav3.3 current measured by a paired-pulse stimulation (inter-stimulation 1 s) applied 40 times (Stim. 1 to Stim. 40). The interval between the first pulse (P1) and the second pulse (P2), i.e. interpulse, is 100, 400 or 1000 ms, as presented in (a) for an interpulse interval of 100 ms. The recovery from short-term inactivation (P2/P1), as a function of the interpulse duration is quantified for the first stimulation (Stim. 1) and the 40th stimulation (Stim. 40) (b, n = 5–7 per point). (c–d) Steady-state inactivation of the Cav3.3 current measured using a paired-pulse stimulation applied 40 times. The Vm between the two pulses ranged from −110 to −40 mV, as illustrated in (c) for a Vm of −70 mV. Steady-state inactivation (measured at P2) as a function of the Vm is determined for the first stimulation (Stim. 1) and for the 40th stimulation (Stim. 40) (d, n = 5–9 per point). (e–f) Current-voltage (I–V) protocol (e) and activation curve (f) of the Cav3.3 current during 1 Hz or 0.05 Hz stimulation. The Cav3.3 current was stimulated at 1 Hz or 0.05 Hz until reaching the steady-state just before I-V protocols, which were performed by a double-pulse protocol to maintain the 1 Hz stimulation effect (n = 17).
Figure 3—figure supplement 1
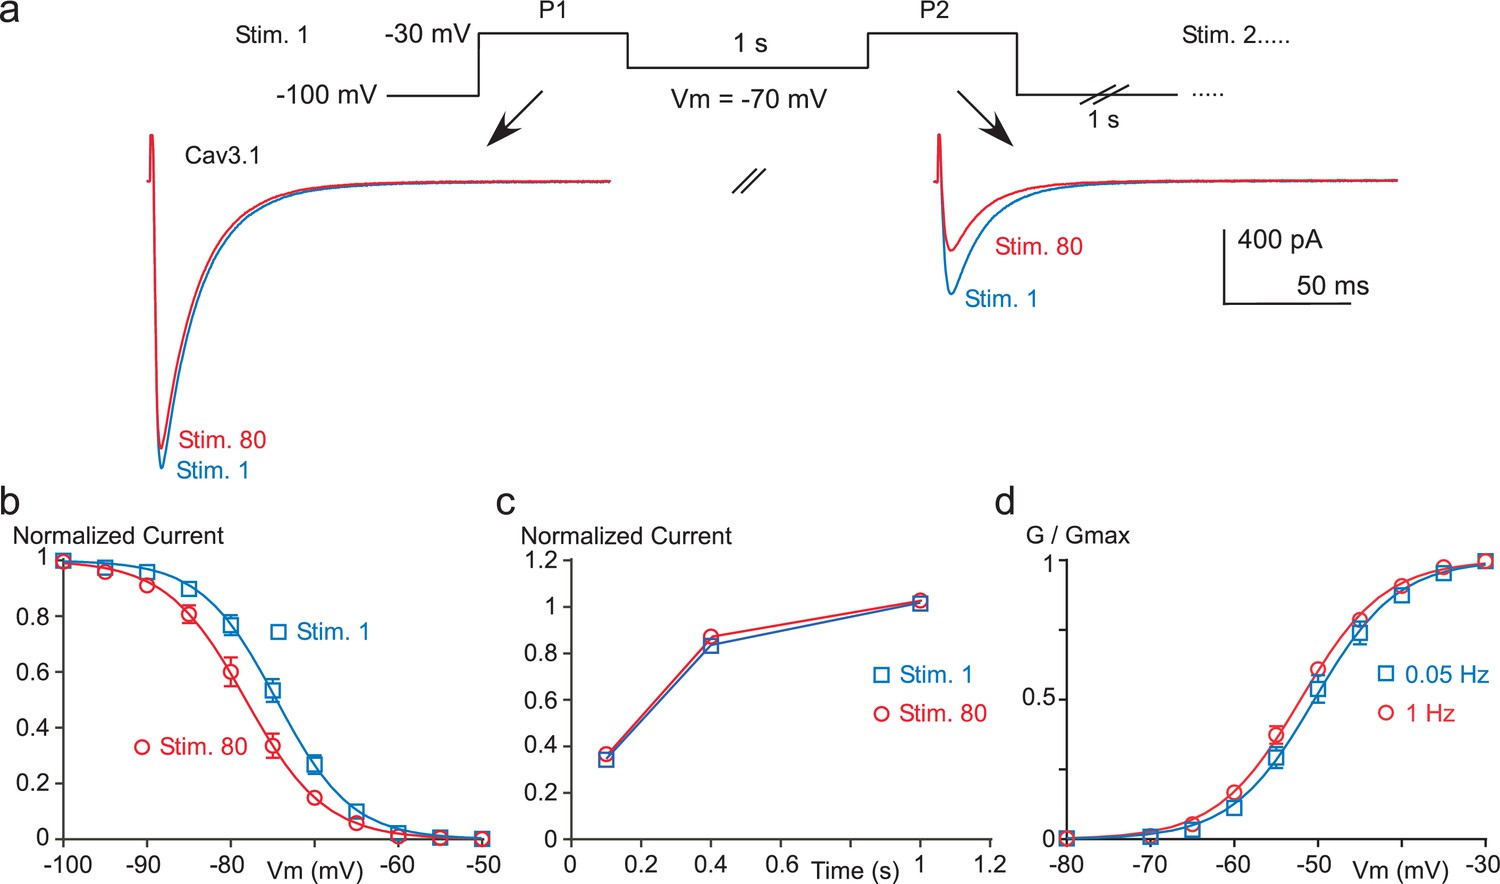
Paired-pulse stimulation at high frequency induces a negative shift in the Cav3.1 steady-state inactivation properties.
(a–b) Steady-state inactivation of the Cav3.1 current measured using a paired-pulse stimulation (inter-stimulation 1 s) applied 80 times (Stim 1 to Stim 80). The membrane potential (Vm) between the two pulses ranged from −110 to −50 mV, as illustrated in (a) for a Vm of −70 mV. Steady-state inactivation (measured at P2) as a function of the Vm is determined for the first stimulation (Stim 1) and for the 80th stimulation (Stim 80, (b), n = 5–13 per point). (c) Recovery from short-term inactivation of the Cav3.1 current measured by a paired-pulse stimulation (inter-stimulation 1 s) applied 80 times (Stim 1 to Stim 80). The recovery from short-term inactivation, as a function of the interpulse duration (100, 400 or 1000 ms) is quantified for the first stimulation (Stim 1) and for the 80th stimulation (n = 8–9 per point). (d) Activation curve of the Cav3.1 current measured during 1 Hz or 0.05 Hz stimulation. The Cav3.1 current was stimulated at 1 Hz or 0.05 Hz until reaching the steady-state just before I-V protocols, which were performed by a double-pulse protocol to maintain the 1 Hz stimulation effect (n = 6).
Figure 4
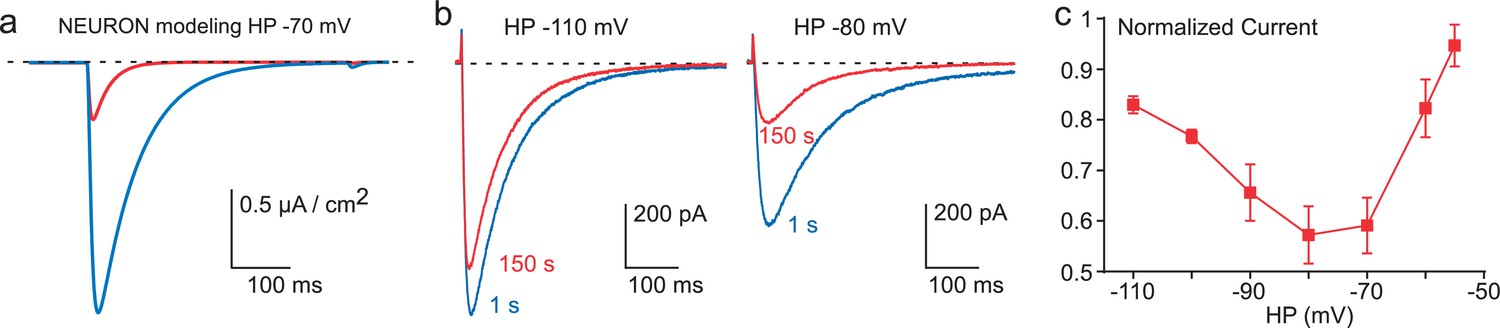
Inhibition of Cav3.3 current as a function of the HP.
(a) Simulation of the Cav3.3 current at −30 mV from an HP of −70 mV. The Cav3.3 current was modeled from experiments presented in Figure 3. The blue trace corresponds to the Cav3.3 current properties obtained before the 1 Hz stimulation whereas the red trace corresponds to the Cav3.3 current properties obtained after 40 s stimulation at 1 Hz. (b) Cav3.3 current elicited at a frequency of 0.2 Hz from a HP of −110 mV (left panel) and a HP of −80 mV (right panel). (c) Inhibition of Cav3.3 current after 150 s stimulation as a function of the HP (n = 5–8 per point).
Figure 5 with 1 supplement
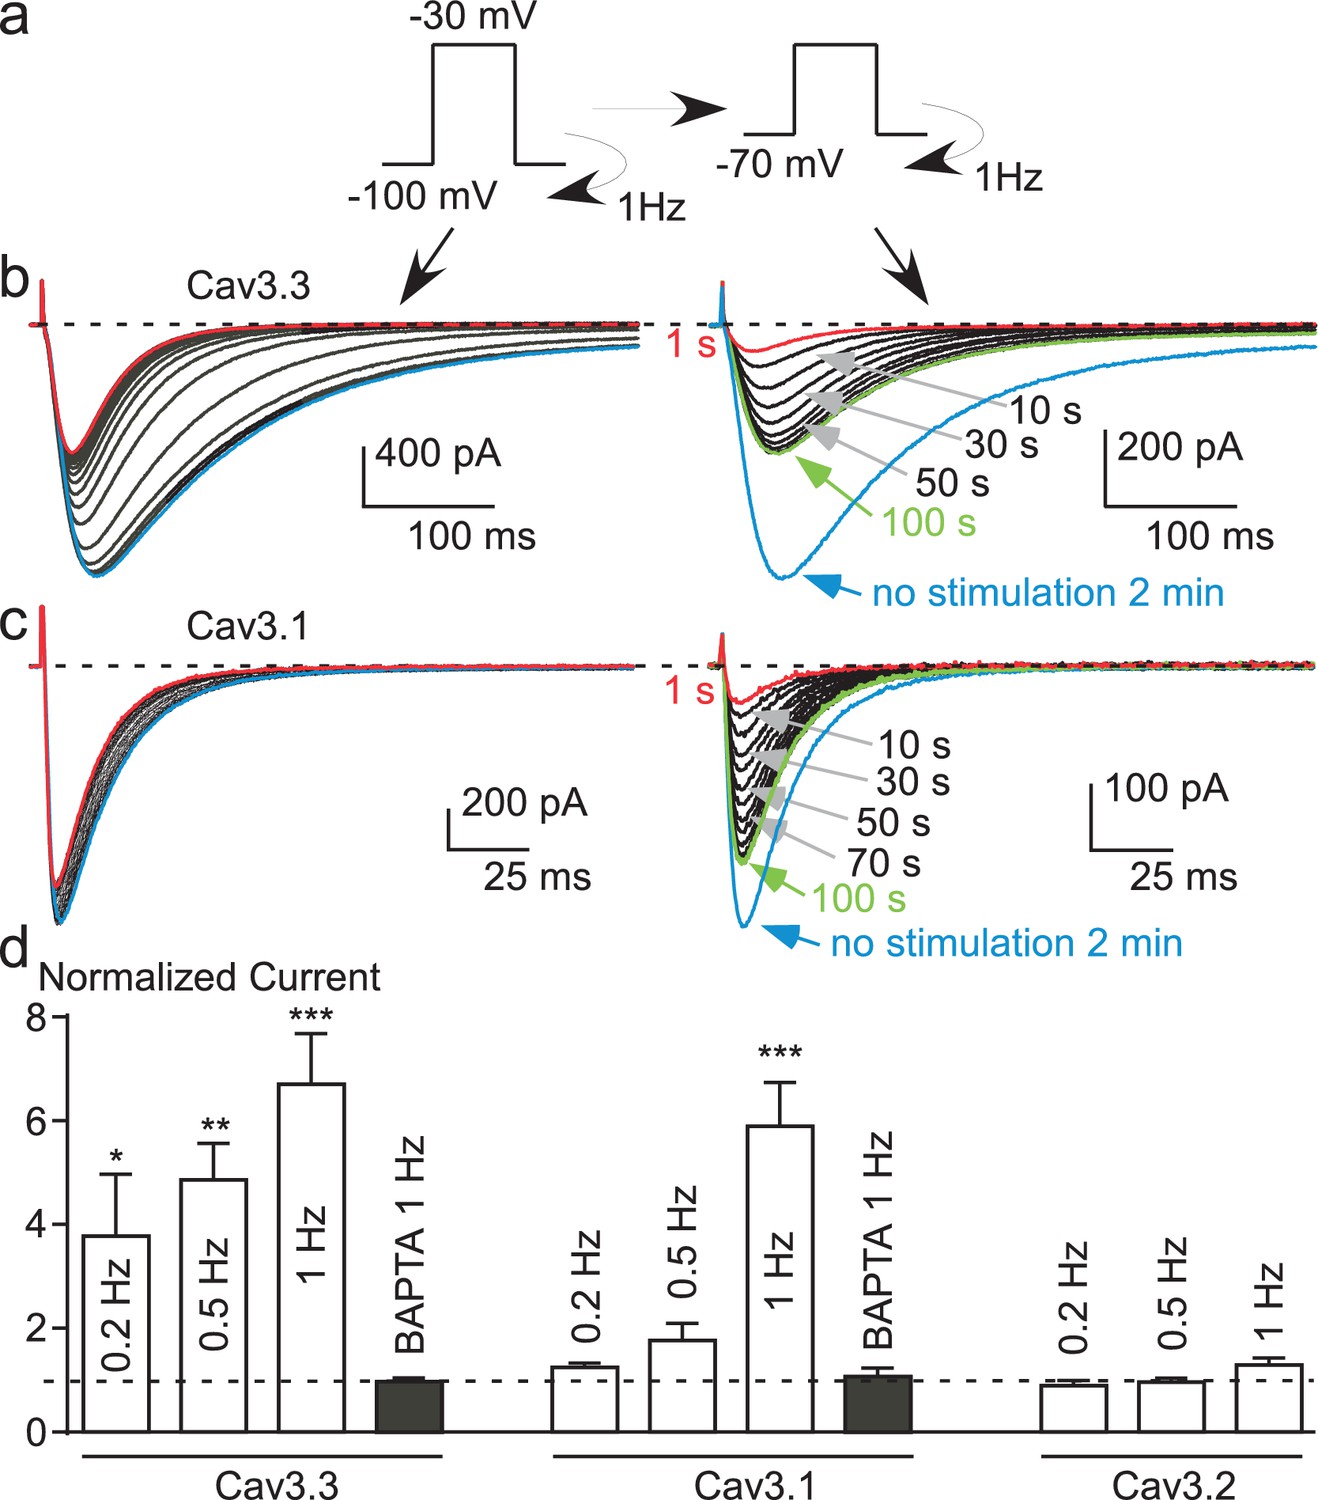
Potent T-type current recovery at physiological resting potentials.
(a–c) Fast TP stimulation (TP −30 mV) using HP of −100 mV to induce inhibition, switched to a HP of −70 mV to induce recovery (see protocol in (a)). The inhibition of Cav3.3 and Cav3.1 currents was measured using fast TP stimulation at a HP of −100 mV (b–c, left panels) whereas the recovery of the Cav3.3 and Cav3.1 currents was measured on a HP of −70 mV (b–c, right panels). (d) Quantification of the increase (recovery) in Cav3.3, Cav3.1 and Cav3.2 currents (at HP −70 mV) as a function of the TP stimulation frequency (n = 5–40 per bar). The normalized current corresponds to the ratio of the current obtained after 2 min without stimulation (blue trace) to the initial current (1 s, red trace) recorded at a HP −70 mV.
Figure 5—figure supplement 1

Modulation of the Cav3.2 Met1549Ile mutant channel at a high frequency of stimulation.
Similar to that described for Figure 5, the Cav3.2 current recovery was measured at a HP of −80 mV (a–b, right panels) after their inhibition by 1 Hz stimulation at a HP of −100 mV (a-b, left panels) for wild-type (WT) Cav3.2 channels (b) and for the Cav3.2 Met1549Ile channels (c). The average current decrease at HP −100 mV and the average current increase at HP −80 mV are shown in (c) as insets in the left and the right panels, respectively (n = 23–31).
Figure 6
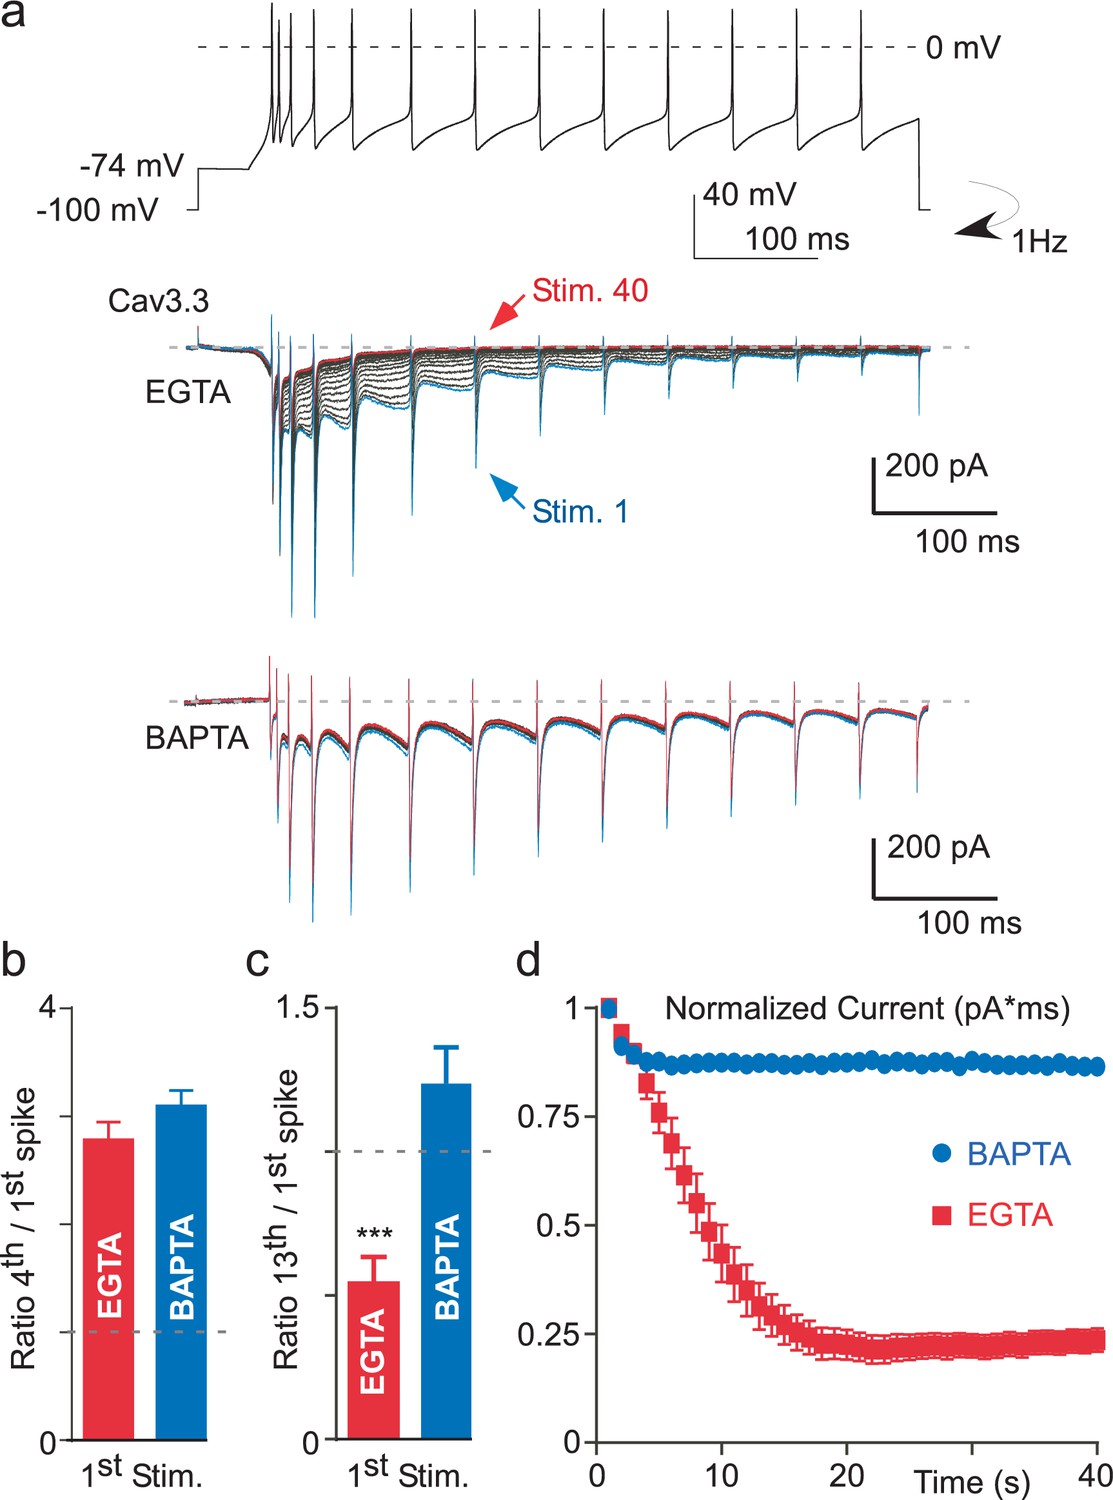
Ca2+-dependent inhibition of the Cav3.3 current during action potential-clamp experiments.
(a) The top trace represents a burst activity of a thalamic neuron which was used as a waveform. Typical Cav3.3 current recorded after dialyzing the cell with EGTA (middle panel) or with BAPTA (lower panel). (b) Average increase of the Cav3.3 current during the first spikes recorded at the first stimulation. The current increase is quantified as the ratio of the current recorded at the fourth to the first spike (n = 12–14). (c) Average decrease of the Cav3.3 current during the first stimulation quantified as the ratio of the thirteenth to the first spike (n = 12–14). (d) Time course of the total Cav3.3 current during 40 s stimulation. The total Cav3.3 current is quantified as the area under the curve (pA * ms) (n = 12–14).
Figure 7 with 1 supplement
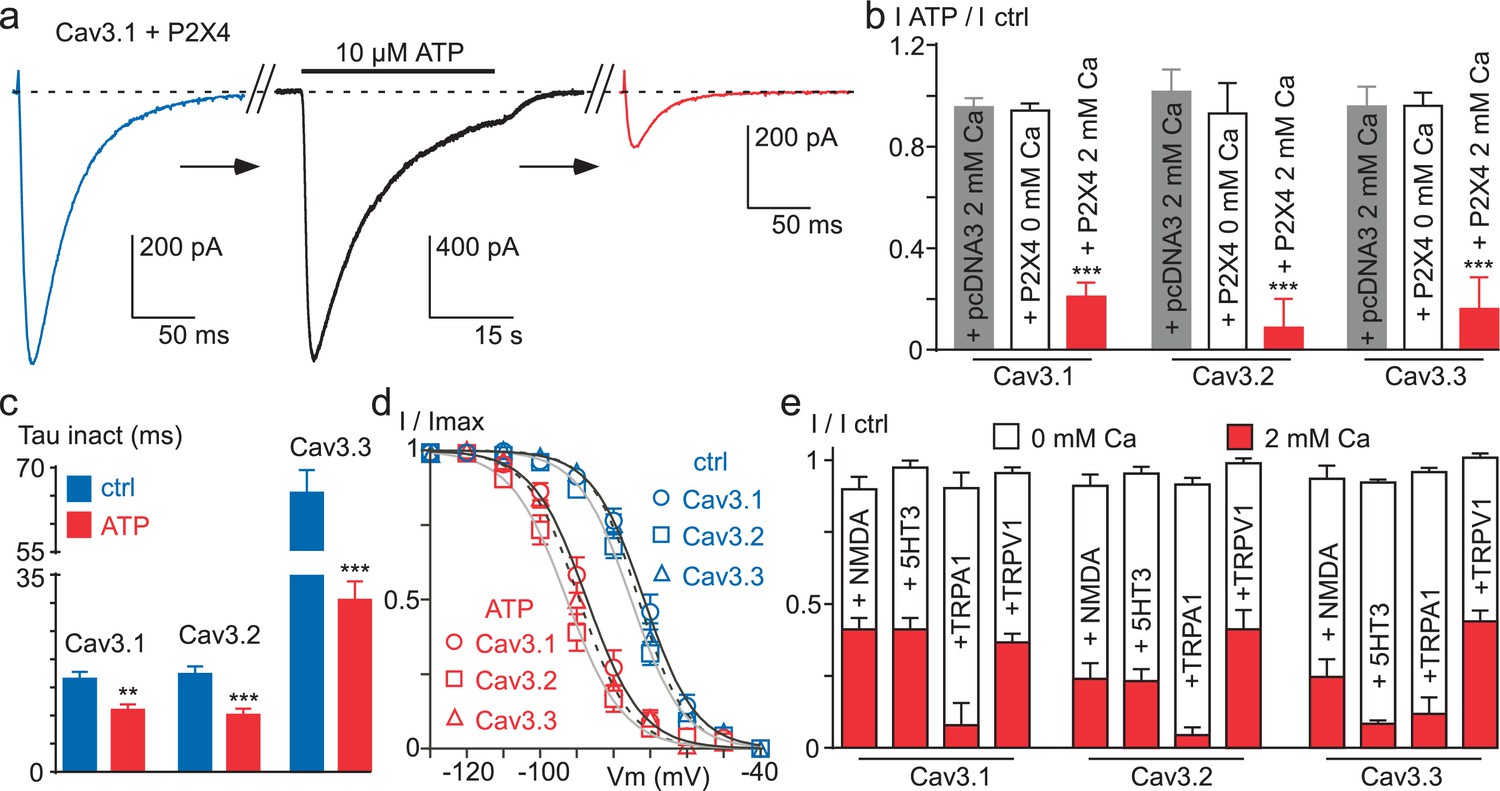
Ca2+ entry via Ca2+-permeable ionotropic receptors inhibits Cav3 currents.
(a) Effect of 10 µM ATP application on the Cav3.1 current recorded in a tsA-201 cell expressing the P2X4 receptor. The Cav3.1 current recorded just before (blue trace) and just after (red trace) the application of an ATP solution (black trace, P2X4 current). (b) Summary of ATP effect on the Cav3.1, the Cav3.2 and the Cav3.3 current recorded in tsA-201 cells expressing or not (pcDNA3) the P2X4 receptor in the presence or in the absence of 2 mM Ca2+ in the extracellular solution (n = 5–23 per bar). (c) Inactivation kinetics of the Cav3 currents in the absence and in the presence of ATP (2 mM Ca2+, n = 11–18 per bar). (d) Steady-state inactivation properties of the Cav3 currents the presence and in the absence of ATP (2 mM Ca2+, n = 10–17 per point). (e) Summary of the effect of NMDA, 5-HT3, TRPA1 and TRPV1 receptor activation on the Cav3 current amplitude recorded in the presence or in the absence of 2 mM Ca2+ in the extracellular saline (n = 5–30 per bar). In all these experiments the HP is −80 mV.
Figure 7—figure supplement 1
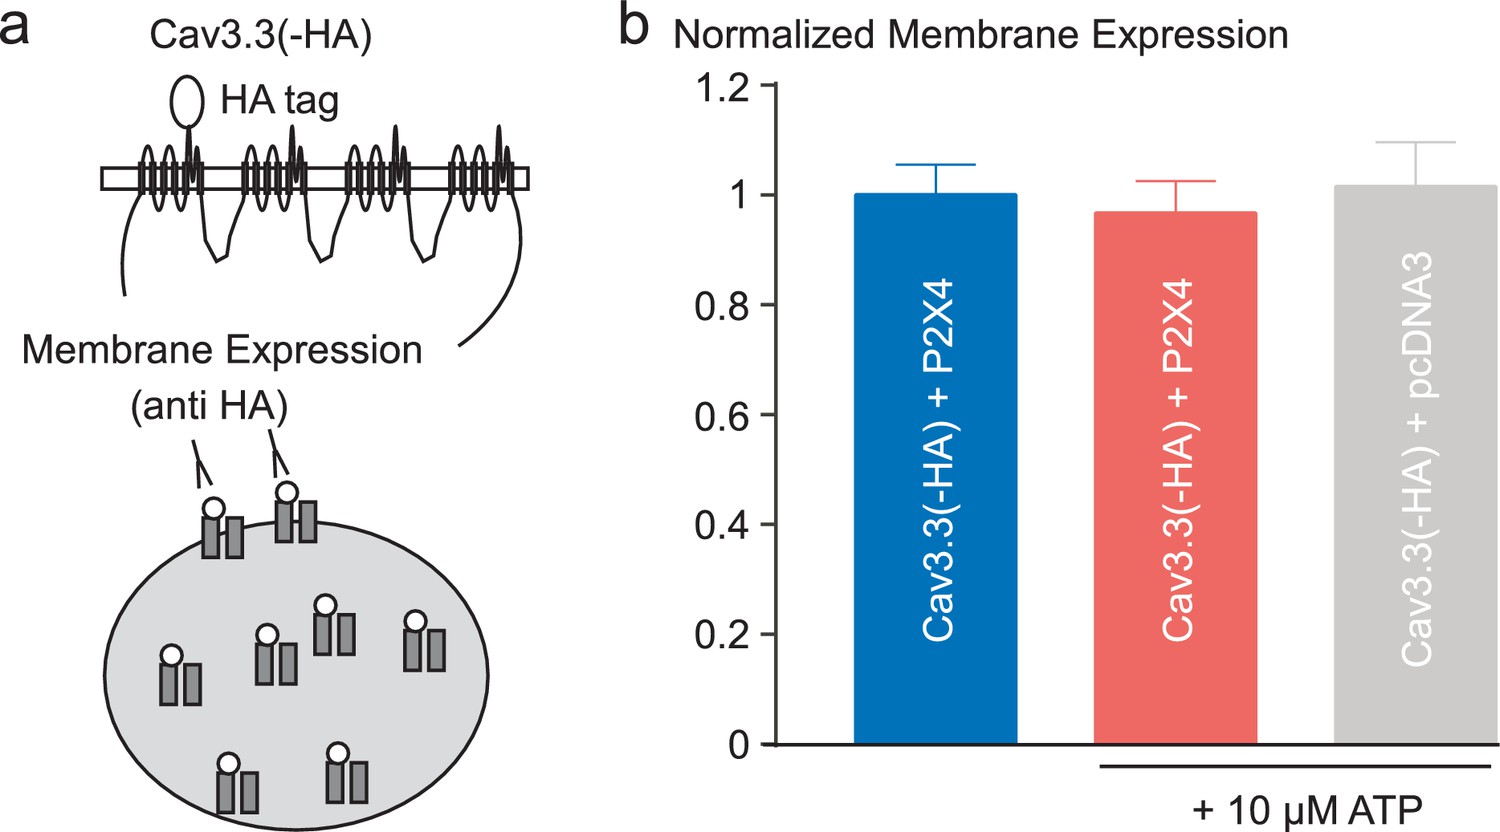
Effect of P2X4 activation on membrane density of Cav3.3 channels.
(a) Schematic representation of a Cav3.3 channel construct containing an extracellular HA tag (located in the IS5-pore loop) used to measure its membrane expression in tsA-201 cells. The cells were co-transfected with the Cav3.3 channel and either the P2X4 receptor or the pcDNA3 plasmid. (b) Quantification by ELISA/luminometry of the membrane expression levels of HA-tagged Cav3.3 channels after treatment with 10 µM ATP. The histogram represents relative light unit (RLU) normalized toward the values obtained in the control condition (P2X4 without ATP treatment).
Download links
A two-part list of links to download the article, or parts of the article, in various formats.
Downloads (link to download the article as PDF)
Open citations (links to open the citations from this article in various online reference manager services)
Cite this article (links to download the citations from this article in formats compatible with various reference manager tools)
Activity-dependent regulation of T-type calcium channels by submembrane calcium ions
eLife 6:e22331.
https://doi.org/10.7554/eLife.22331


