Bottom-up and top-down computations in word- and face-selective cortex
- University of Minnesota, United States
- University of Washington, United States
Figures
Figure 1 with 1 supplement
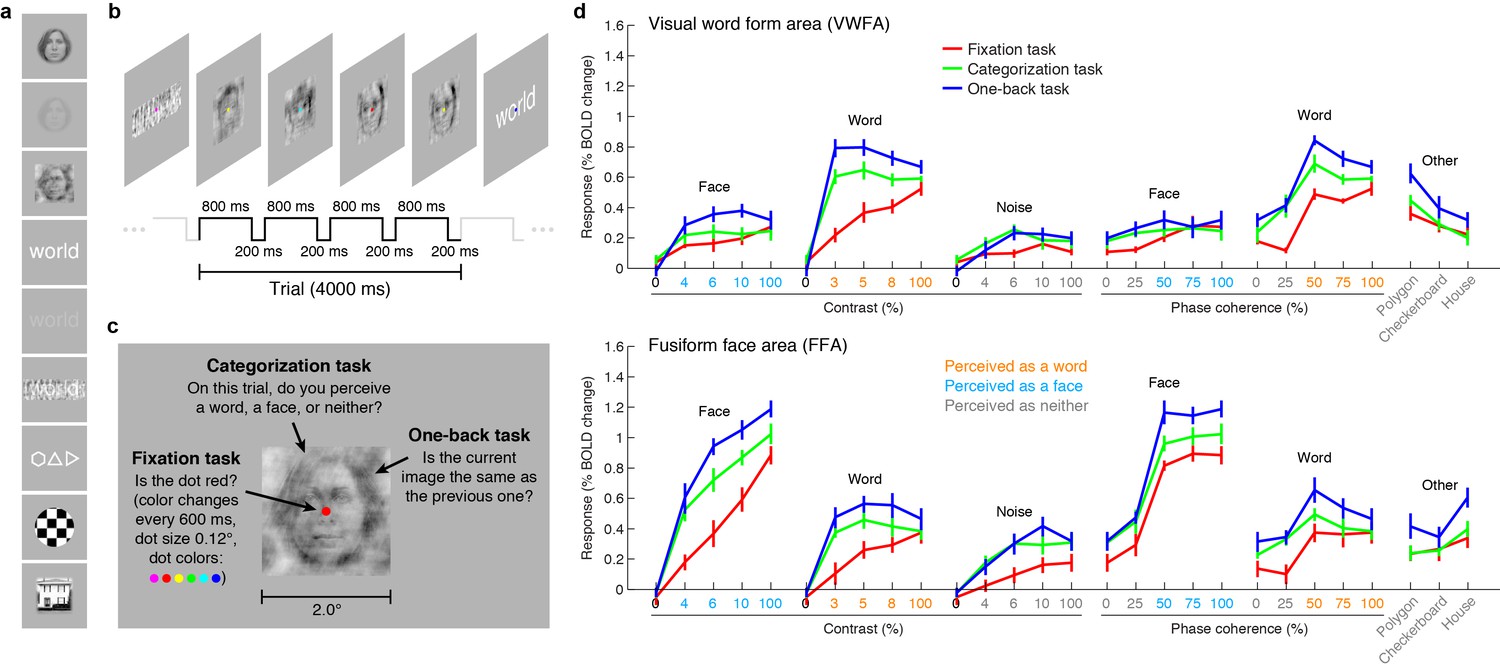
VTC responses depend on both stimulus properties and cognitive task.
(a) Stimuli. Stimuli included faces, words, and noise patterns presented at different contrasts and phase-coherence levels, as well as full-contrast polygons, checkerboards, and houses. (b) Trial design. Each trial consisted of four images drawn from the same stimulus type. (c) Tasks. On a given trial, subjects performed one of three tasks. (d) Evoked responses in VWFA (top) and FFA (bottom) for different stimuli and tasks. Color of x-axis label indicates the perceived stimulus category as reported by the subjects. Error bars indicate bootstrapped 68% CIs.
Figure 1—figure supplement 1
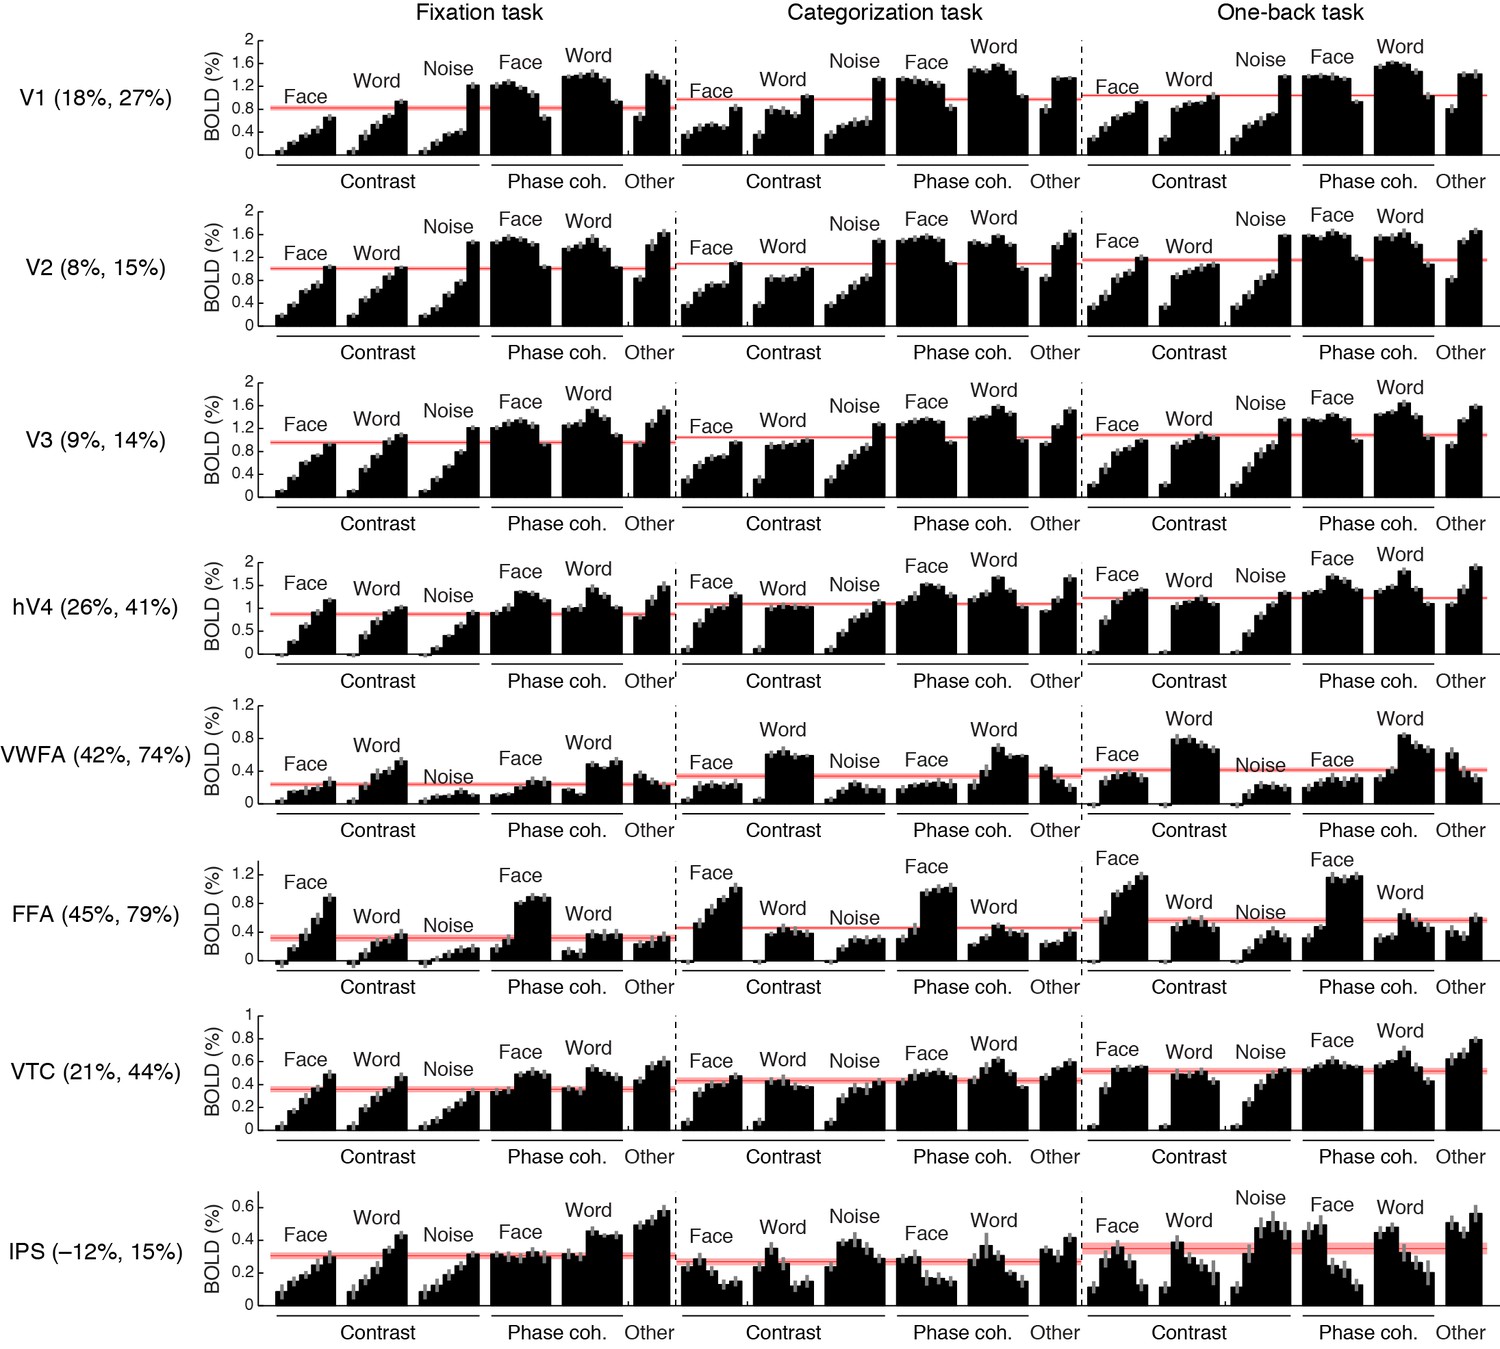
Comprehensive summary of fMRI measurements.
Black bars indicate responses (beta weights) evoked by different stimuli and tasks. Red lines indicate the average response across stimuli, computed separately for each task. Error bars indicate bootstrapped 68% CIs (resampling subjects with replacement). Percentages in ROI labels indicate the strength of the response observed during the categorization and one-back tasks relative to the fixation task. For example, in FFA, the average response across stimuli during the one-back task is 79% stronger than the average response across stimuli during the fixation task. Task effects are substantially stronger in VWFA and FFA than in early visual areas V1–V3. The larger apparent task modulation in V1 compared to V2 and V3 might due to small eye movements that may have been made during the categorization and one-back tasks. Our interpretation of the observed IPS activity during the fixation task is that this activity reflects the decision-making process involved in judging the color of the fixation dot. Support for this interpretation comes from the fact that the root-mean-square contrast of the stimuli, computed over a small region surrounding the fixation dot (0.36° × 0.36°), correlates strongly with IPS responses during the fixation task (r = 0.86).
Figure 2 with 1 supplement
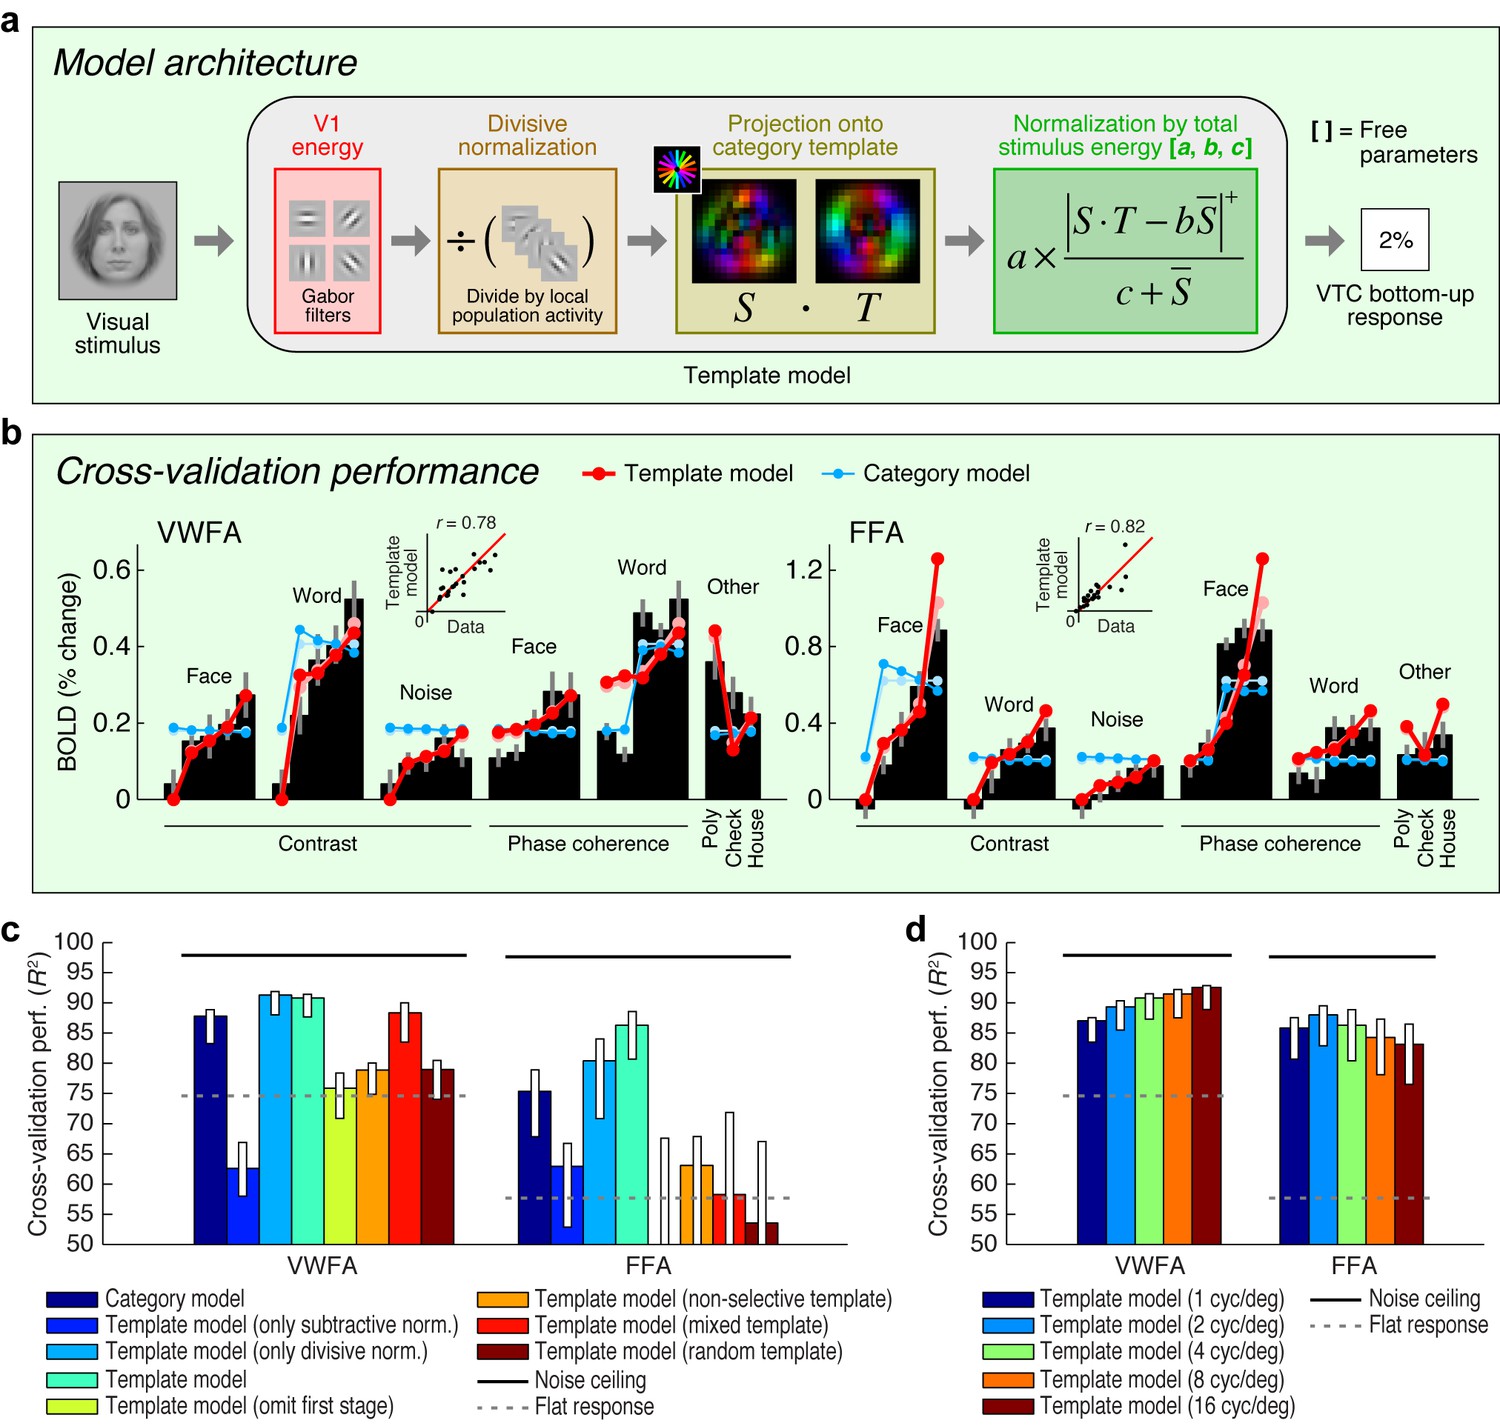
Model of bottom-up computations in VTC.
(a) Model architecture. The predicted response of the Template model is given by a series of image computations (see Materials and methods). (b) Cross-validation performance. Black bars indicate bottom-up stimulus-driven responses measured during the fixation task, dark lines and dark dots indicate model predictions (leave-one-stimulus-out cross-validation), and light lines and light dots indicate model fits (no cross-validation). Scatter plots in the inset compare model predictions against the data. The Template model is compared to the Category model which simply predicts a fixed response level for stimuli from the preferred stimulus category and a different response level for all other stimuli (the slight decrease in response as a function of contrast is a result of the cross-validation process). (c) Comparison of performance against control models. Bars indicate leave-one-stimulus-out cross-validation performance. Error bars indicate 68% CIs, obtained by bootstrapping (resampling subjects with replacement). Solid horizontal lines indicate the noise ceiling, that is, the maximum possible performance given measurement variability in the data. Dotted horizontal lines indicate the cross-validation performance of a model that predicts the same response level for each data point (this corresponds to R2 = 0 in the conventional definition of R2 where variance is computed relative to the mean). The performance of the Template model degrades if the second stage of nonlinearities is omitted (Template model (only subtractive normalization)) or if the first stage of the model involving V1-like filtering is omitted (Template model (omit first stage)). The plot also shows that the precise configuration of the template is important for achieving high model performance (Template model (non-selective, mixed, random templates)). (d) Performance as a function of spatial frequency tuning. Here we manipulate the spatial frequency tuning of the filters in the Template model (while fixing spatial frequency bandwidth at one octave). The Template model uses a single set of filters at a spatial frequency tuning of 4 cycles/degree.
Figure 2—figure supplement 1
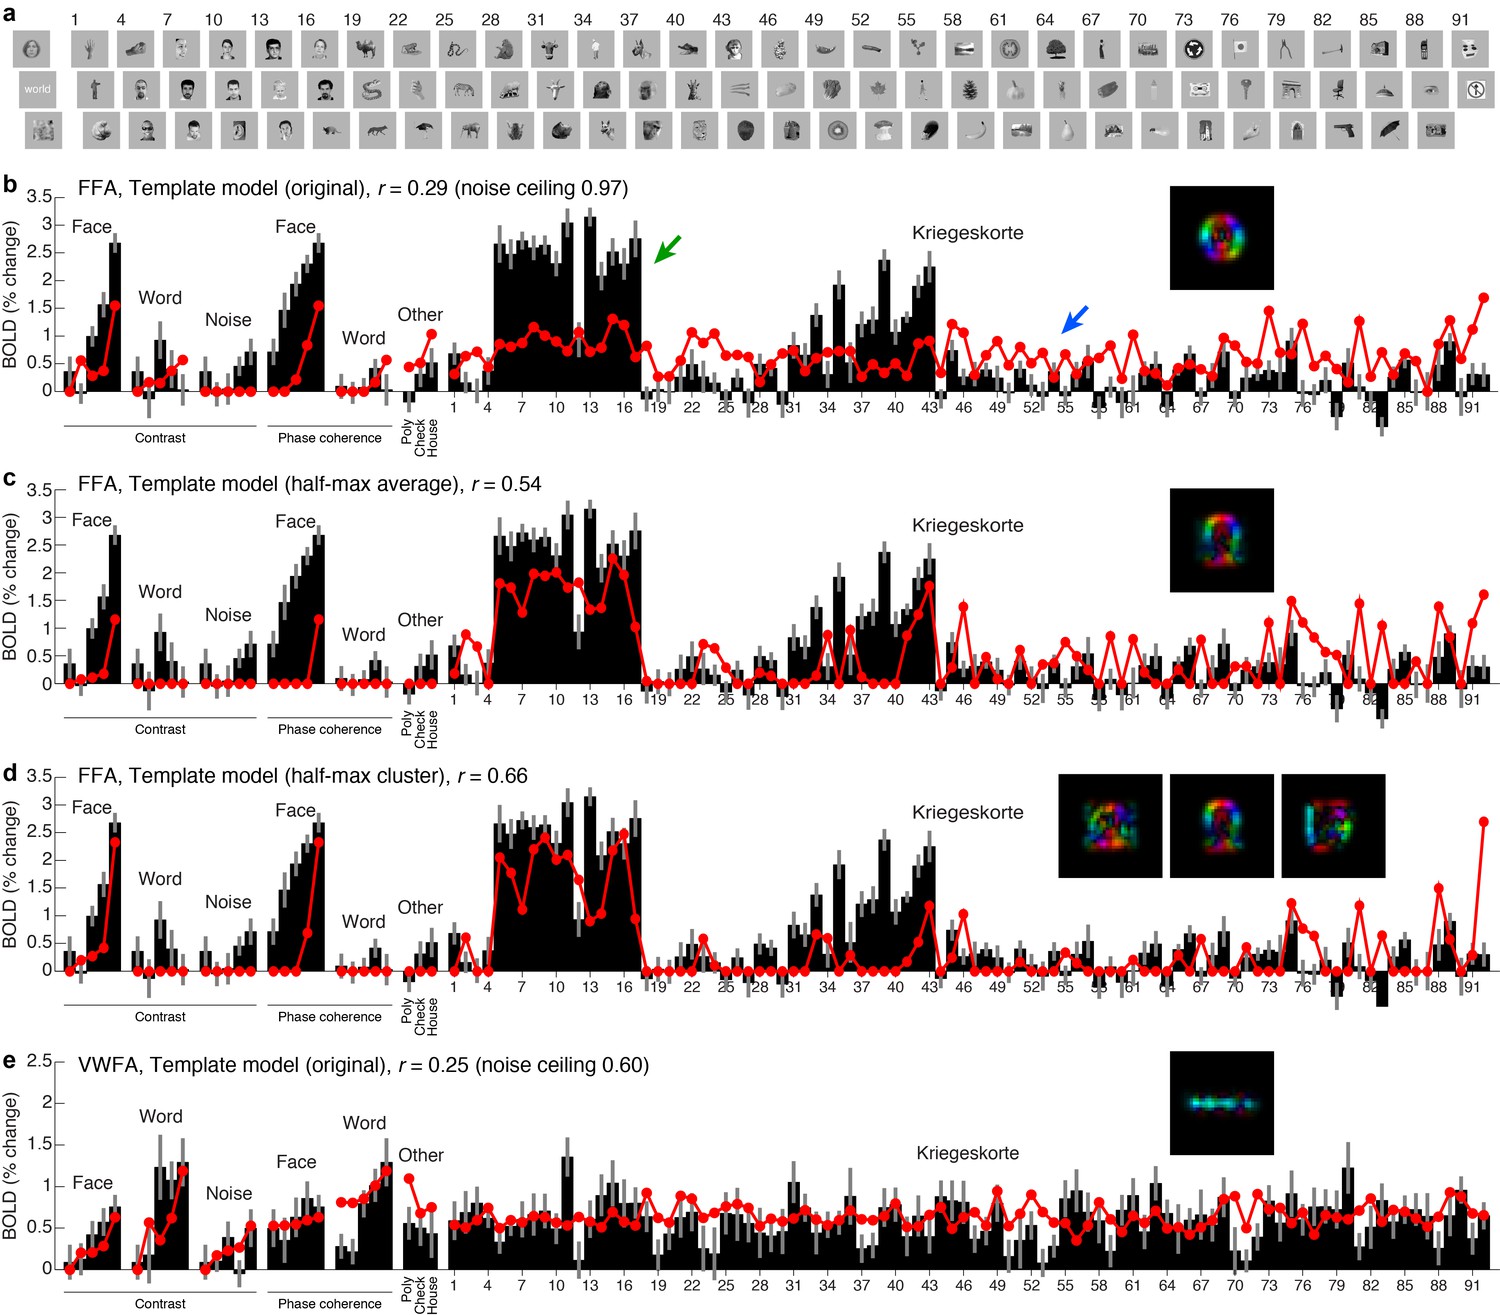
Testing the Template model on a wide range of stimuli.
(a) Stimuli. We collected an additional dataset consisting of 92 images from a previous study by Kriegeskorte et al. (2008) (all images shown), along with 22 images from the original experiment (three images shown). We assessed model accuracy using 20-fold cross-validation across stimuli (see Materials and methods for details). (b) Performance of Template model (original). Black bars indicate data from FFA, with error bars indicating 68% CIs (error across trials). Red lines and red dots indicate model predictions. Inset shows the category template used in the model. The model performs poorly. (c) Performance of Template model (half-max average). This model derives the category template by computing (in the V1-like representation) the centroid of all stimuli in the training set that evoke at least half of the maximum response. Performance improves. (d) Performance of Template model (half-max cluster). This model derives multiple category templates by performing k-means clustering (in the V1-like representation) on all stimuli in the training set that evoke at least half of the maximum response. Performance further improves, resolving both underprediction of responses (for example, green arrow in panel b) and overprediction of responses (for example, blue arrow in panel (b). (e) Results for VWFA. Similar responses are observed across the 92 Kriegeskorte images. Responses are well predicted by the original Template model, up to the level of measurement noise in this region.
Figure 3
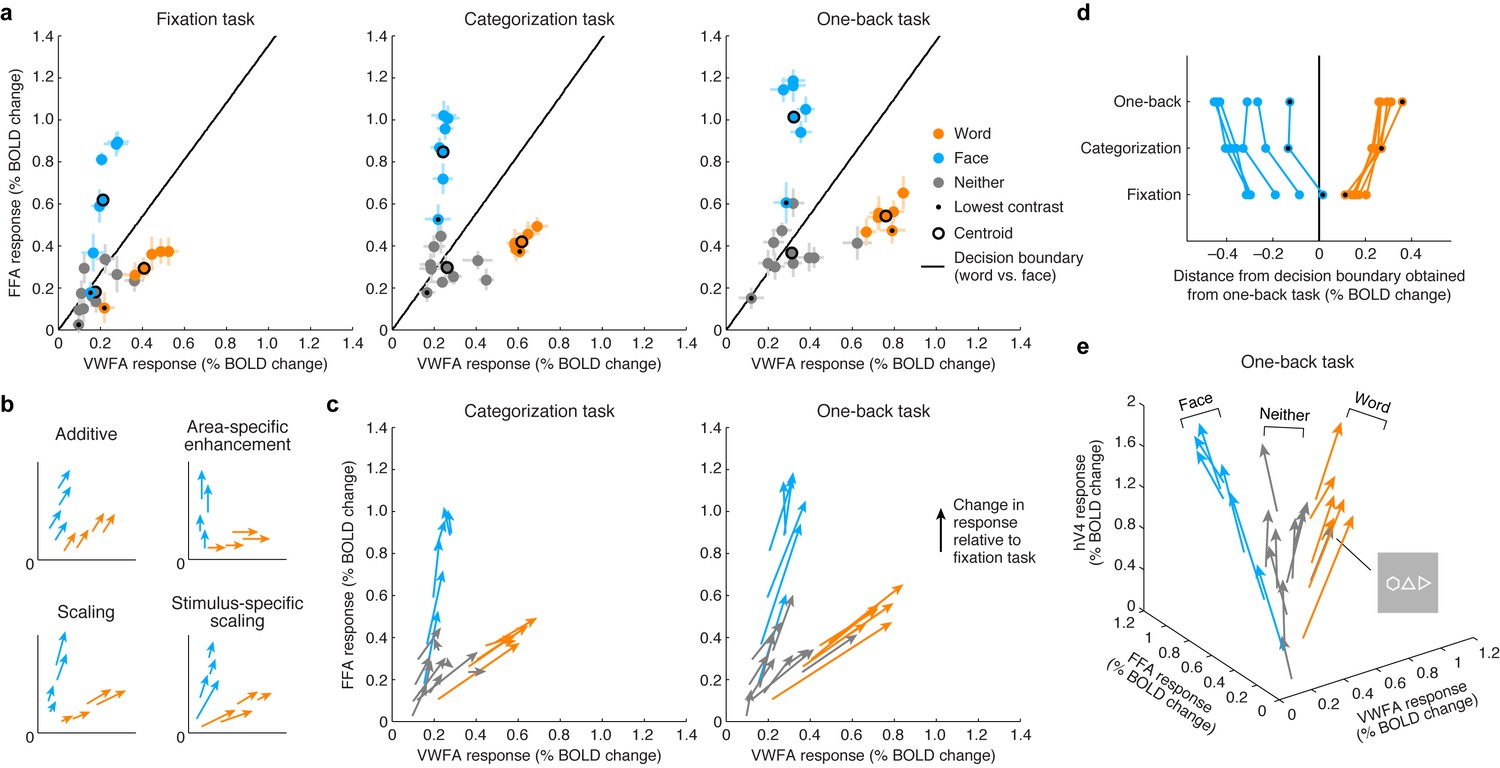
Top-down stimulus-specific scaling of VTC representation.
(a) Responses plotted in multi-dimensional neural space. Each dot indicates ROI (VWFA, FFA) responses to a stimulus. In each plot, the black line indicates a linear decision boundary separating words and faces (nearest-centroid classifier, angular distance). (b) Schematics of potential top-down mechanisms (these models are formally evaluated in Figure 5c; see Materials and methods section ‘IPS-scaling model’ for details). (c) Categorization and one-back tasks produce stimulus-specific scaling. Arrows indicate the change in representation compared to the fixation task. (d) Scaling improves readout. Each data point indicates the signed Euclidean distance between the word-face decision boundary (as determined from the one-back task) and the neural response to a single stimulus. Lines join data points that correspond to the same stimulus. The scaling observed during the categorization and one-back tasks moves responses away from the decision boundary, thereby improving signal-to-noise ratio. (e) Separation of other stimulus categories. Including hV4 as a third dimension reveals that stimuli categorized as neither words nor faces manifest as a third ‘arm’ that emanates from the origin. Although not reported to be a word by the subjects, the polygon stimulus behaves similarly to word stimuli.
Figure 4 with 1 supplement
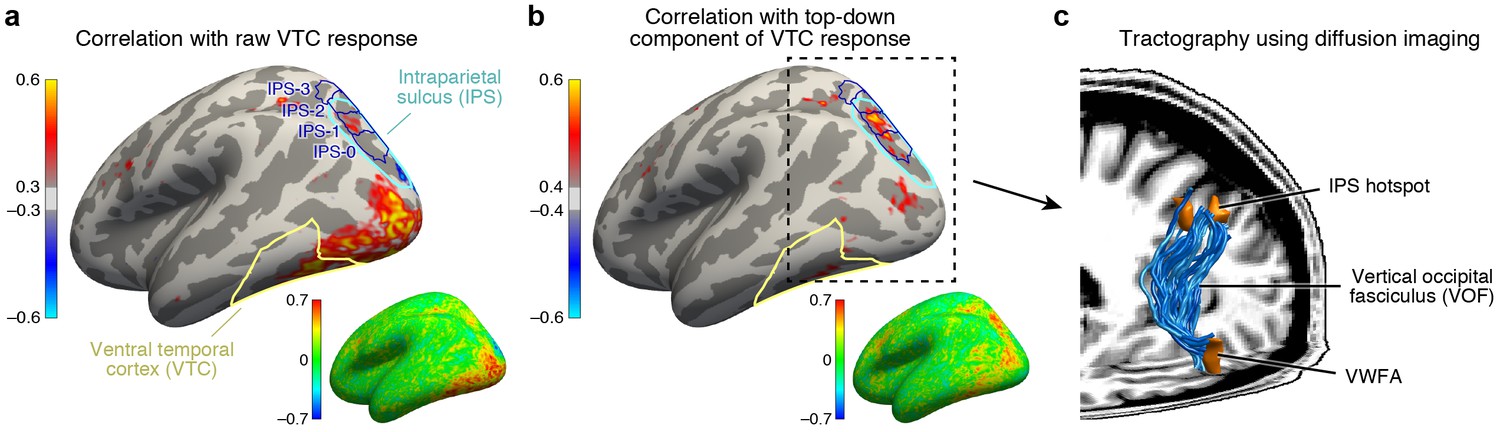
IPS is the source of top-down modulation to VTC.
(a) Correlation with raw VTC response. This map depicts the correlation between the VTC response observed during the categorization and one-back tasks with the response at each cortical location (inset shows an unsmoothed and unthresholded map). Positive correlations are broadly distributed across occipital cortex. Results are shown for subjects with whole-brain coverage (n = 3); results for other subjects with partial-brain coverage (n = 6) are shown in Figure 4—figure supplement 1. (b) Correlation with top-down component of VTC response. After removing bottom-up responses (fixation task), the correlation is spatially localized to a hotspot in IPS-0/1. (c) Tractography using diffusion MRI. We find that the vertical occipital fasciculus (Yeatman et al., 2014) connects VWFA and FFA to the IPS hotspot in each subject for which diffusion data were collected (n = 8) (rendering shows a representative subject).
Figure 4—figure supplement 1
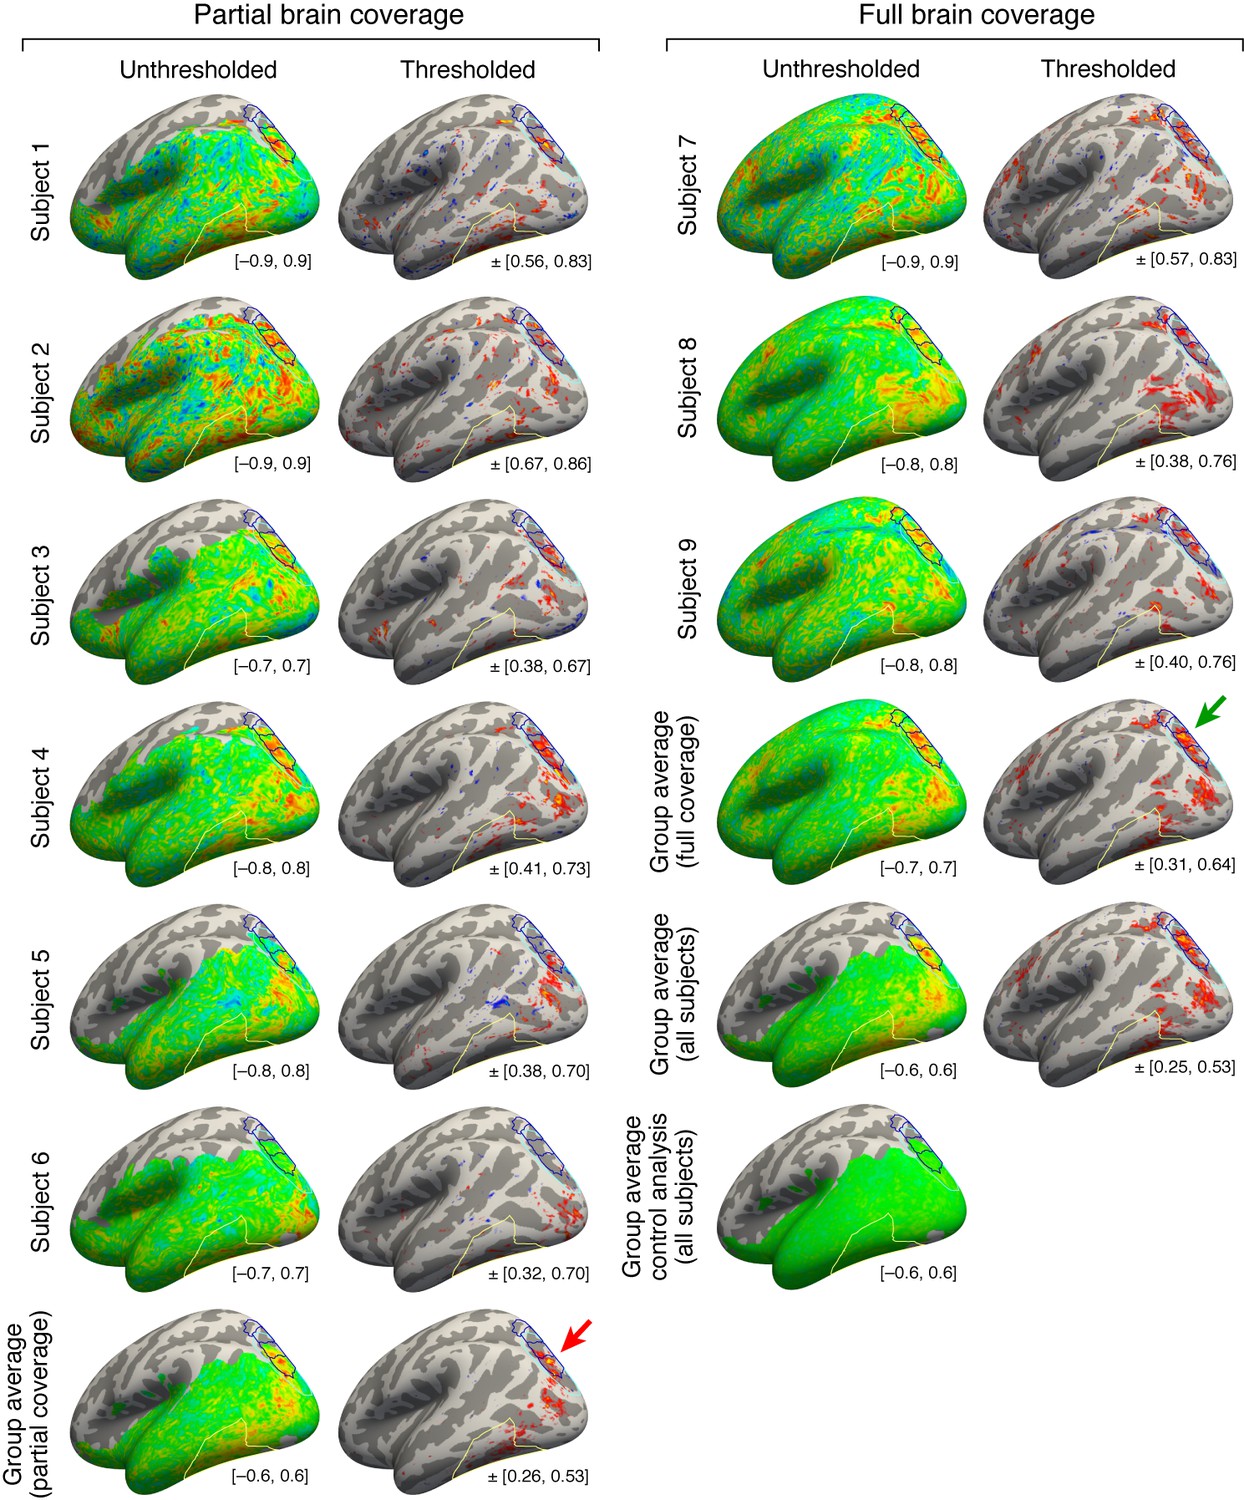
Maps of top-down connectivity to VTC.
This figure shows thresholded and unthresholded maps for individual subjects and group averages (same format as Figure 4b; all maps shown on the fsaverage surface). At the lower right of each map is the range of values used for the colormap. The left two columns show the results obtained for the six subjects with partial brain coverage. Group average results for these subjects are shown in the last row. The right two columns show the results obtained for the three subjects with full brain coverage. Group average results for these subjects are shown in the third to last row. Group average results for all subjects are shown in the second to last row. The last row shows the results obtained from a control analysis in which we generate individual-subject maps by correlating cortical responses with random Gaussian noise and then average these maps across subjects. This control analysis produces no substantial correlations. Notice that the peak correlation is found in and around IPS-0/1 for both the group of subjects with partial brain coverage (red arrow) and the group of subjects with full brain coverage (green arrow). Some variability in the location of the peak correlation is expected given that there are limits on the degree to which functional areas can be aligned across subjects based solely on anatomical features.
Figure 5
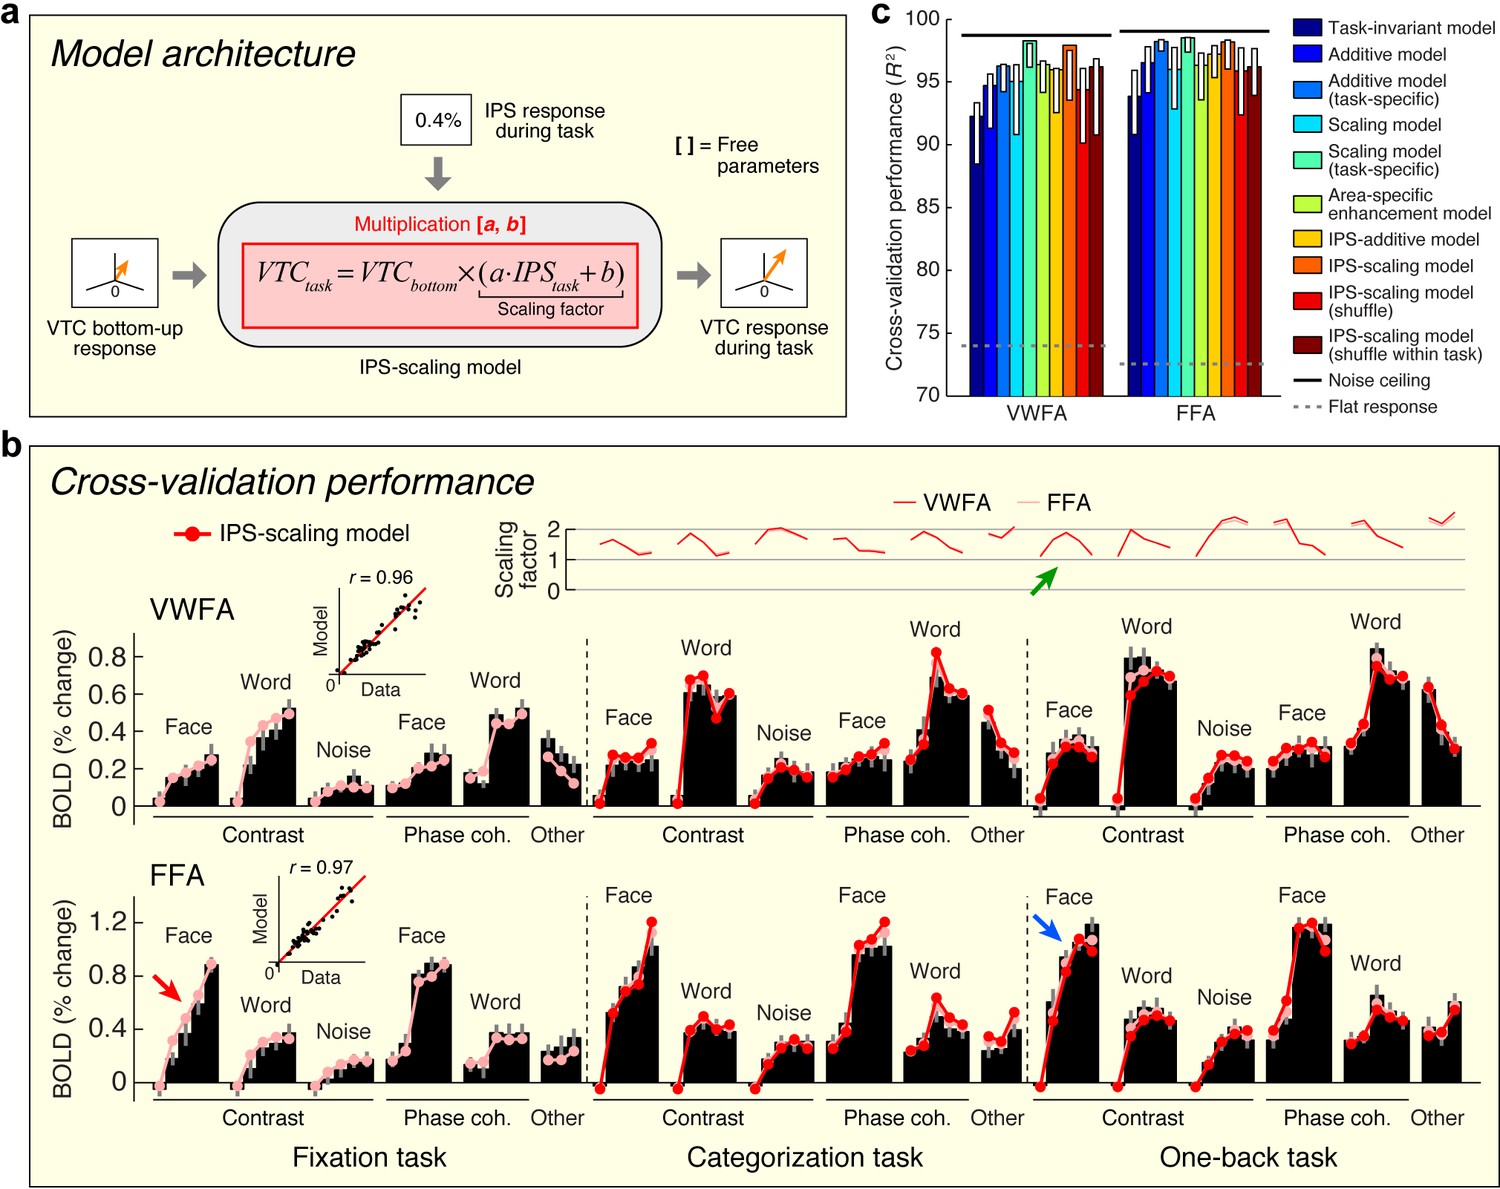
Model of top-down computations in VTC.
(a) Model architecture. The predicted response during the stimulus-directed tasks (categorization task, one-back task) is given by scaling the bottom-up response, with the amount of scaling proportional to the IPS signal. (b) Cross-validation performance. Same format as Figure 2b. The arrows highlight an example of how the bottom-up response (red arrow) is multiplied by the IPS signal (green arrow) to produce the predicted response (blue arrow). (c) Comparison of performance against alternative models. Same format as Figure 2c (some error bars do not include the bar height; this is a consequence of the bootstrap procedure). Although the Additive and Scaling models perform well, note that these are ad hoc, phenomenological models. For instance, the Scaling model (task-specific) posits separate parameters for the amount of scaling under the categorization and one-back tasks. However, such a model does not explain why there is a different amount of scaling, whereas the IPS-scaling model provides such an explanation.
Figure 6
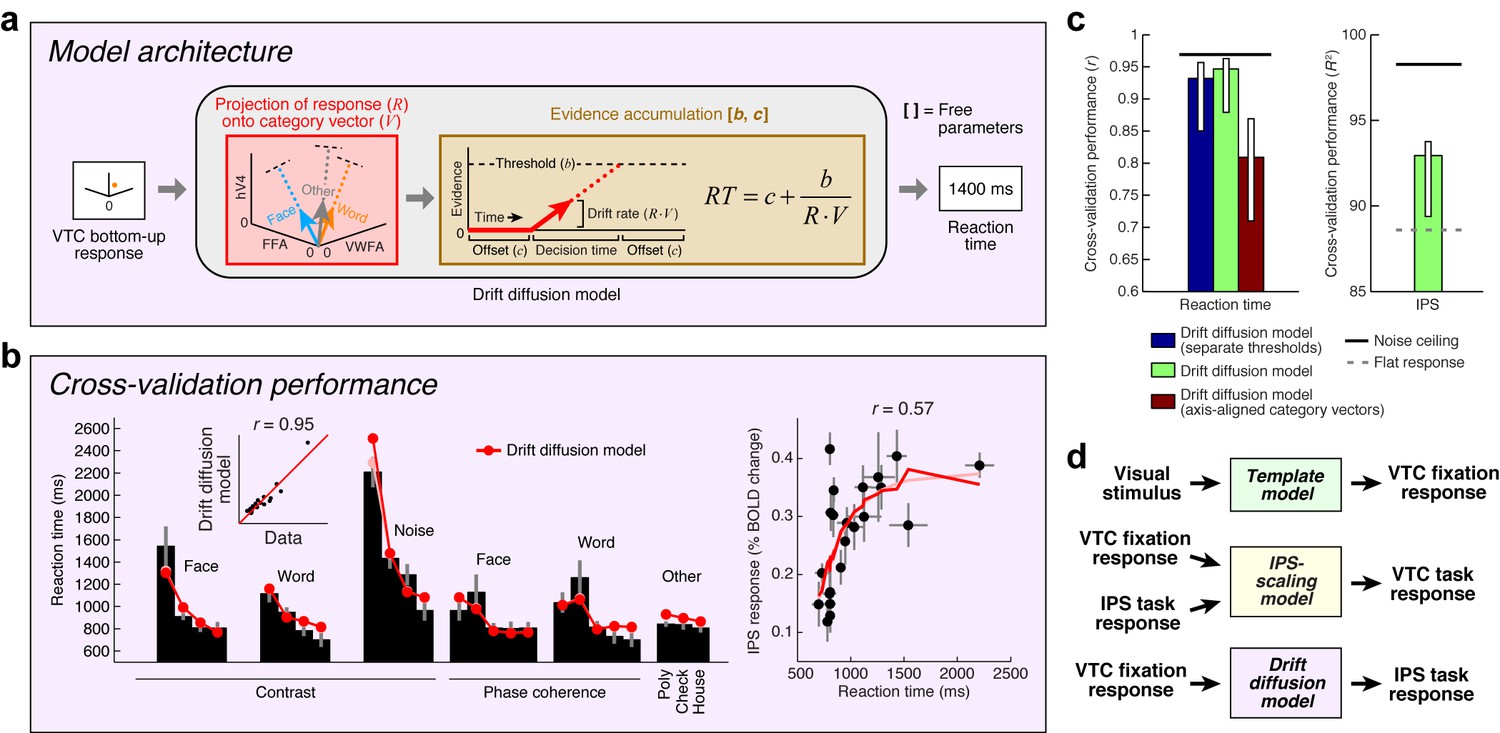
Model of perceptual decision-making in IPS.
(a) Model architecture. We implement a model that links the stimulus representation in VTC to a decision-making process occurring in IPS. The model first uses the bottom-up VTC response as a measure of sensory evidence and predicts reaction times in the categorization task. The model then predicts the IPS response as a monotonically increasing function of reaction time. Note that this model does not involve stochasticity in the evidence-accumulation process, and is therefore a simplified version of the classic drift diffusion model (Ratcliff, 1978). (b) Cross-validation performance. Same format as Figure 2b (except that reaction times are modeled in the left plot). (c) Comparison of performance against control models. The performance of the Drift diffusion model does not degrade substantially if a single threshold is used, thus justifying this simplification. Performance degrades if axis-aligned category vectors are used, supporting the assertion that responses of multiple VTC regions are used by subjects in deciding image category. (d) Overall model architecture. This schematic summarizes all components of our computational model (Figures 2a, 5a and 6a). Bottom-up visual information is encoded in the VTC fixation response (green box; Template model), fixation responses are routed to the IPS for evidence accumulation (purple box; Drift diffusion model), and then feedback from the IPS to VTC causes top-down modulation during the categorization and one-back tasks (yellow box; IPS-scaling model).
Download links
A two-part list of links to download the article, or parts of the article, in various formats.
Downloads (link to download the article as PDF)
Open citations (links to open the citations from this article in various online reference manager services)
Cite this article (links to download the citations from this article in formats compatible with various reference manager tools)
Bottom-up and top-down computations in word- and face-selective cortex
eLife 6:e22341.
https://doi.org/10.7554/eLife.22341


