Codon optimization underpins generalist parasitism in fungi
- LIPM, Université de Toulouse, INRA, CNRS, France
- Curtin University, Australia
Figures
Figure 1
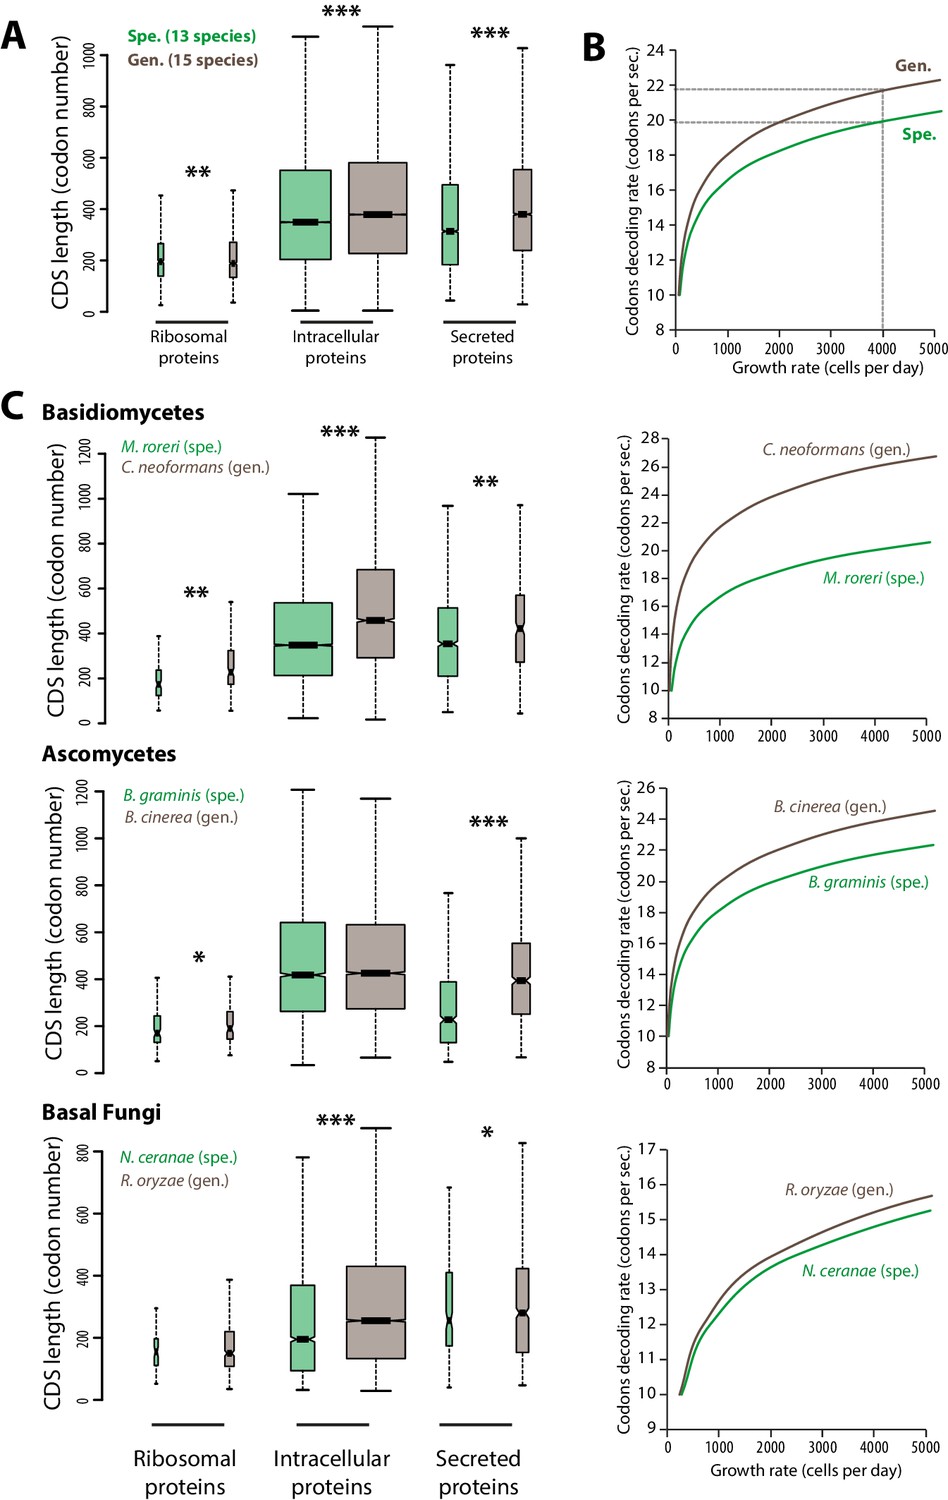
Contrasted length distribution in proteomes is expected to increase selection on codon optimization in generalist fungi.
(A) Distribution of length (number of codons) in the ribosomal, intracellular and predicted secreted proteomes of 13 specialist fungal parasites and 15 generalist fungal parasites. (B) Relationship between codon decoding rate (number of codons translated per second) and cell growth rate of typical specialist and generalist fungi predicted by a cellular model of protein translation. Dotted lines highlight the higher codon decoding rate required in generalist fungi compared to specialist fungi to achieve a growth rate of 4000 cells produced per day. (C) Distribution of length in the proteomes (left) and relationship between codon decoding rate and cell growth rate (right) in related specialist and generalist fungi from the Basidiomycetes, Ascomycetes and Basal Fungi. The width of boxplots is proportional to the number of values. Spe., specialist (green); Gen., generalist (brown). Welch’s t-test p: *<10−01, **<10−04, ***<10−08.
-
Figure 1—source data 1
Equations forming the mathematical model of protein biosynthesis related to protein length and codon optimization parameters; list of parameters and variables used for modeling of growth rate based on proteome properties; and values of parameters used for modeling of growth rate based on proteome properties.
- https://doi.org/10.7554/eLife.22472.003
Figure 2
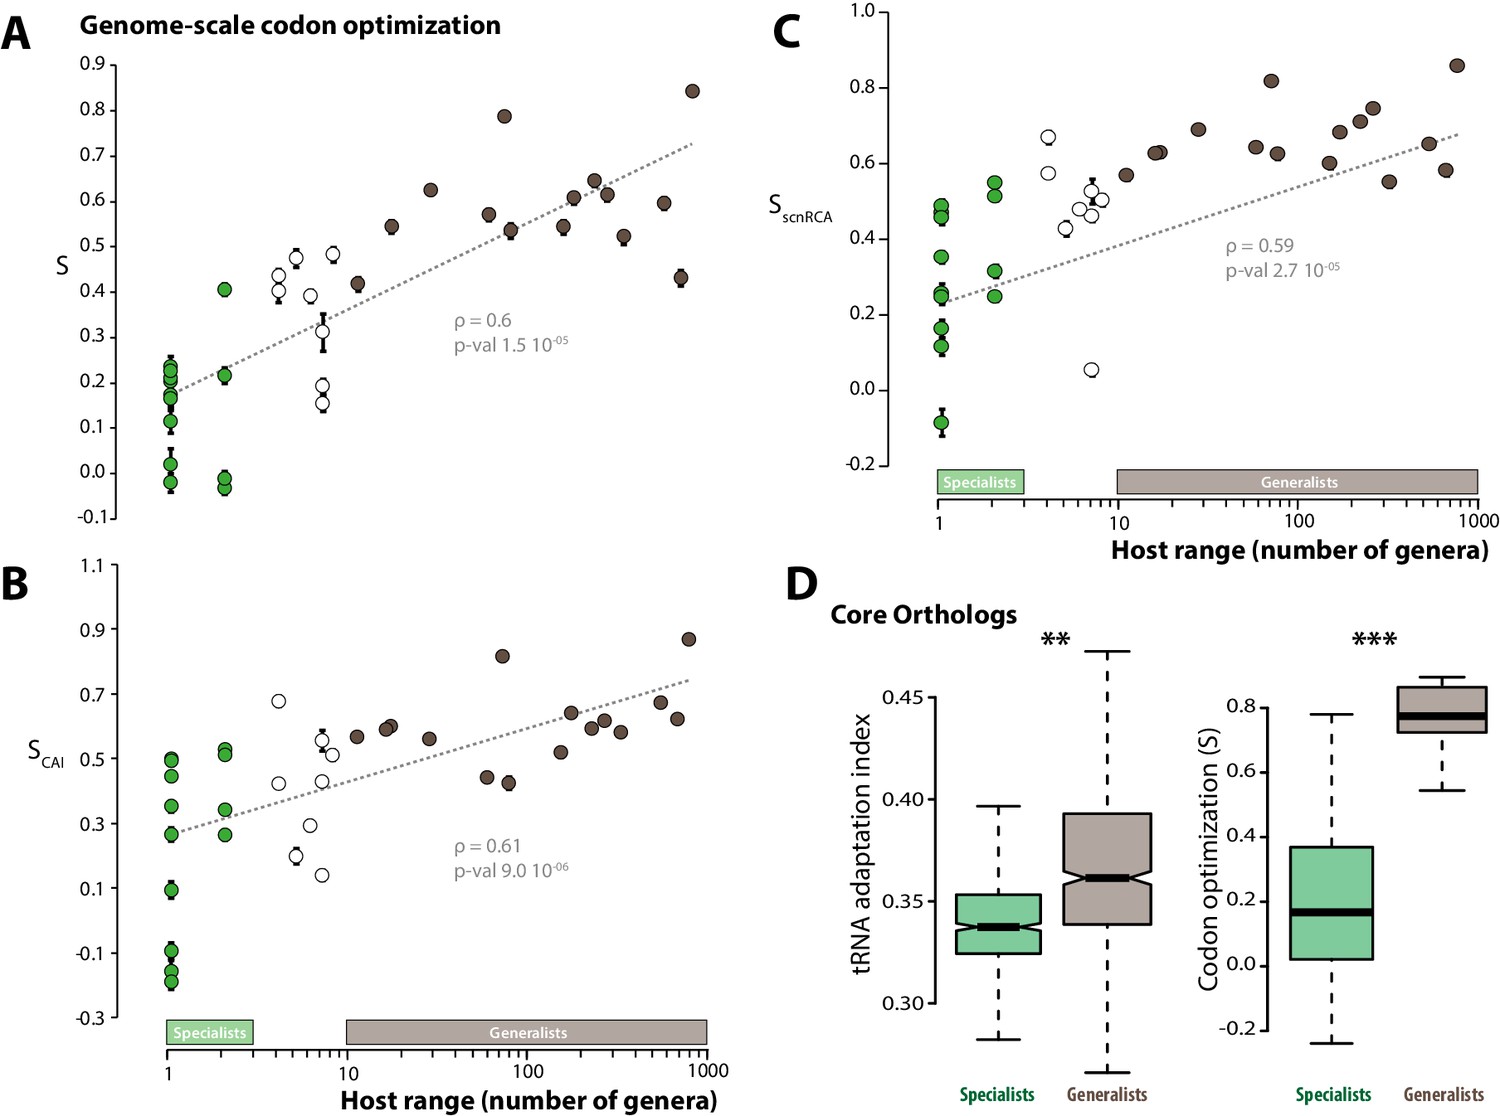
Codon optimization correlates with host range in fungal parasites.
Genome-scale codon optimization correlates with host range in 36 parasites across the kingdom Fungi. Species considered as specialists (less than four host genera) are shown in green, species considered as generalists (over 10 host genera) are shown in brown. Error bars show 95% confidence interval, dotted line shows logarithmic regression of the data. Codon optimization calculated based on knowledge on the tRNA pool (A), on codon usage in ribosomal protein genes (B) and on self-consistent relative codon adaptation (C) correlated with host range at Spearman ρ≥0.59 (p≤2.7 10−05) under phylogenetic independent contrasts. (D) Codon optimization is stronger in core orthologs from generalist fungal parasites than in core orthologs from specialist fungal parasites. Left: Distribution of tRNA adaptation indices in 1620 core ortholog genes show significantly higher values in generalist fungi (**, Welch’s t-test p<0.01). Right: Codon optimization calculated as the degree of coadaptation of core ortholog genes to the genomic tRNA pool is significantly higher in generalist fungi (***, Welch’s t-test p<10−04).
-
Figure 2—source data 1
Codon optimization is dependent on breadth of host range but not genome assembly parameters.
Results of an analysis of variance (ANOVA) considering the number of contigs in genome assemblies (no. contigs, as a descriptor of the quality of assemblies), host range and their interaction as factors; values of host range, number of contigs and codon optimization (S) for each genome.
- https://doi.org/10.7554/eLife.22472.005
-
Figure 2—source data 2
List of core ortholog genes and their codon adaptation indices.
- https://doi.org/10.7554/eLife.22472.006
Figure 3
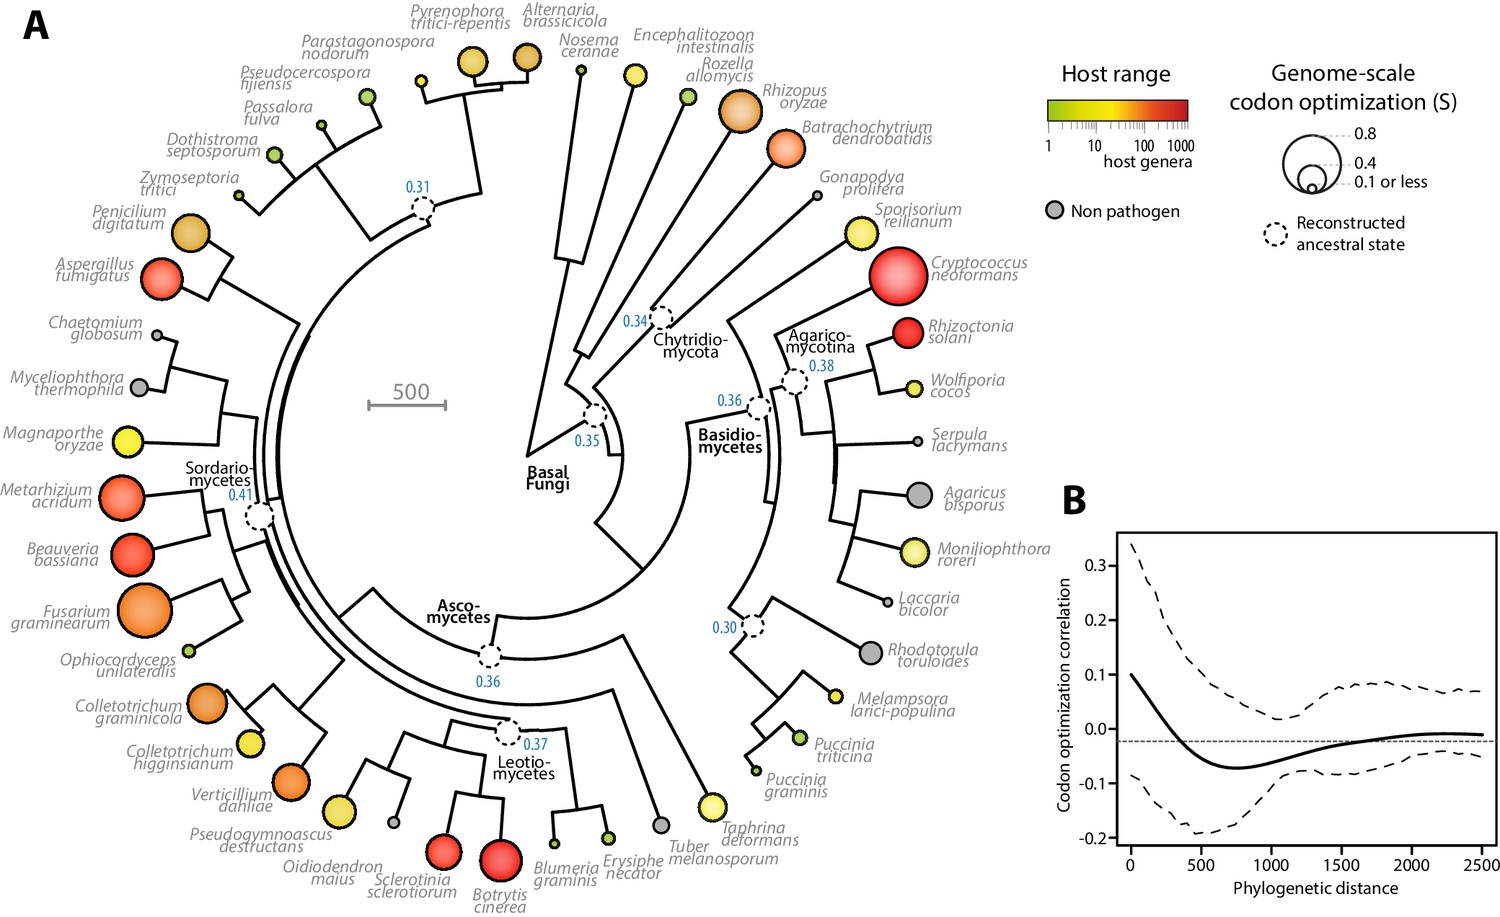
Codon optimization and host range co-evolved multiple times across fungal phylogeny.
(A) Phylogeny, genome-scale codon optimization and host range in 36 parasites across the kingdom Fungi. Nine non-pathogenic species belonging to the major branches of Fungi are shown for comparison. The phylogenetic tree was generated using the TimeTree database (Hedges et al., 2015) and PATHd8 (Britton et al., 2007). Codon optimization shown as the size of terminal nodes corresponds to the degree S of coadaptation of all genes to the genomic tRNA pool (dos Reis et al., 2004). Terminal nodes are sized according to genome-scale codon optimization and colored according to host range (grey was used for non pathogen species). Internal nodes are sized according to reconstructed ancestral genome-scale codon optimization, with ancestral S value indicated as a blue label. (B) Correlogram of genome-scale codon optimization and phylogenetic distance along the tree shown in A. Dotted lines delimit 95% confidence interval.
-
Figure 3—source data 1
Overview of host range features for the 45 fungal species analyzed in this work.
- https://doi.org/10.7554/eLife.22472.009
-
Figure 3—source data 2
Phylogenetic tree of the 45 fungal species analyzed in this work.
- https://doi.org/10.7554/eLife.22472.010
Figure 4 with 2 supplements
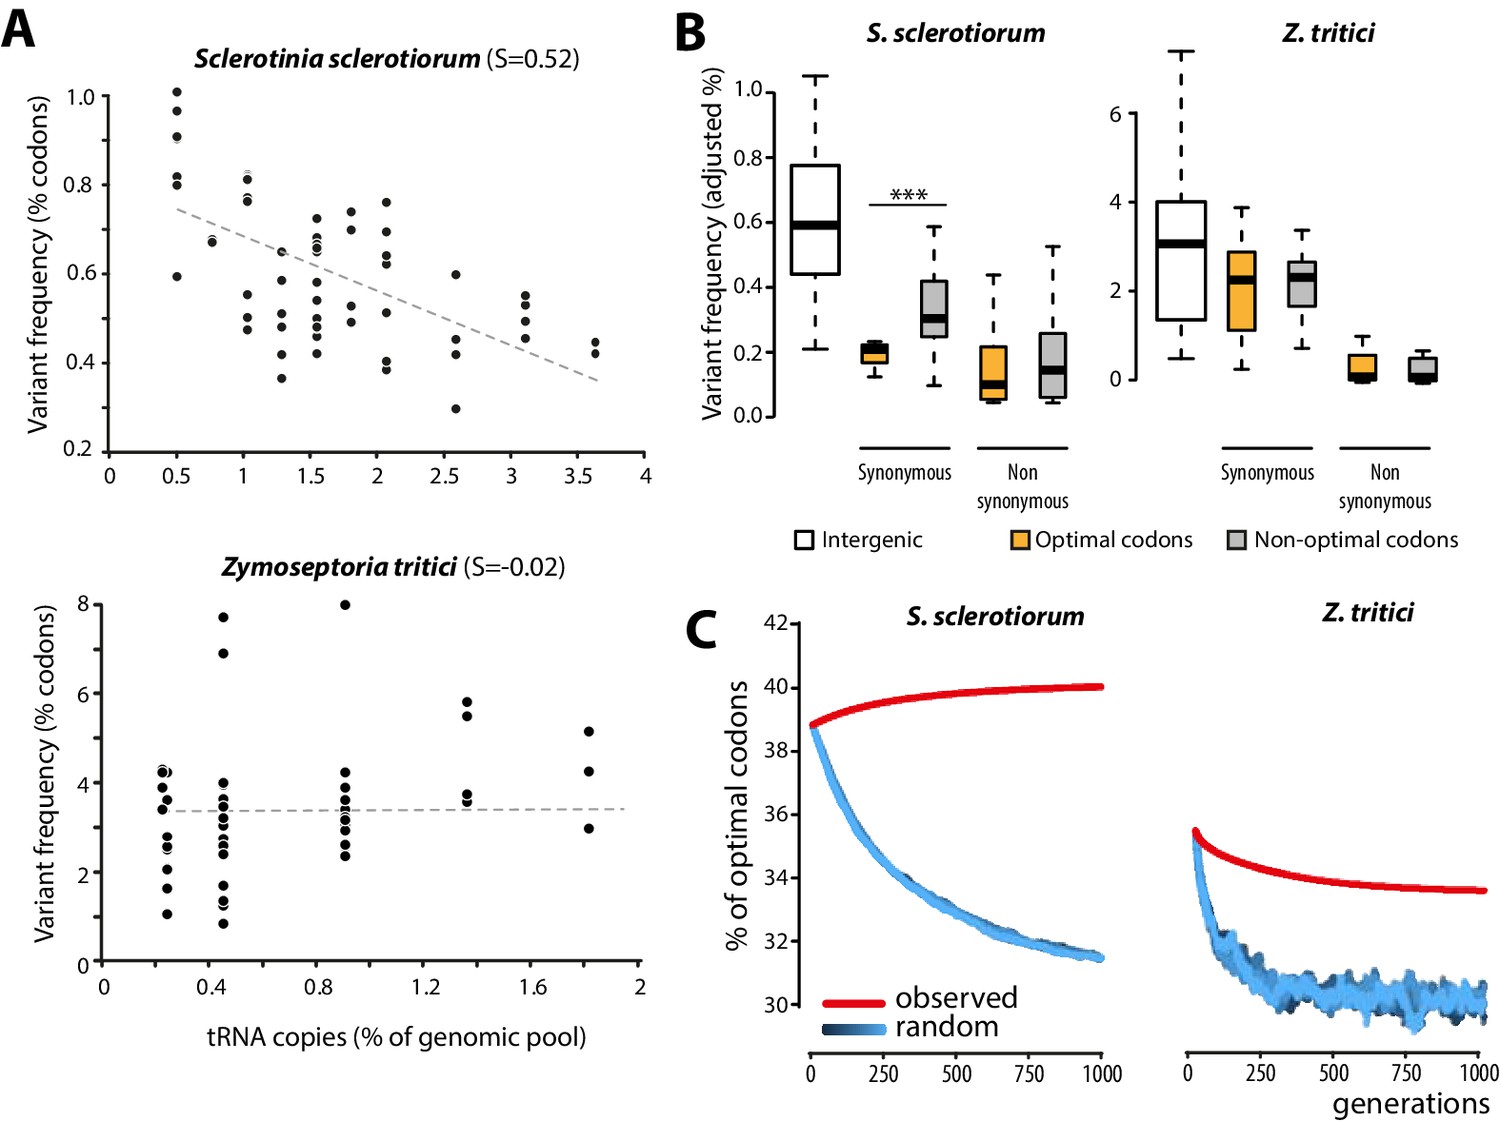
Biased synonymous substitution patterns underpin codon optimization in local populations of a generalist but not a specialist fungal parasite.
(A) Genome-wide frequencies of variant codons in local populations of the host generalist Sclerotinia sclerotiorum and the host specialist Zymoseptoria tritici, according to the number of genomic copies of cognate tRNAs. The number of cognate tRNAs for each codon type was determined using wobble rules for codon-anticodon pairing. Dotted lines show linear regression of the data (Z. tritici: Pearson ρ = 0.06; p=0.62; S. sclerotiorum ρ = −0.60; p=4.6 10−07). (B) Adjusted variant frequencies for intergenic nucleotide triplets, optimal and non-optimal codons. Synonymous and non-synonymous SNPs are shown separately. Differences between optimal and non-optimal codon rates were assessed by Welch’s t-test (***p<0.001). (C) Predicted evolution of genome-wide content in optimal codons in S. sclerotiorum and Z. tritici based on observed and random mutation patterns.
-
Figure 4—source data 1
Codon statistics for S. sclerotiorum and Z. tritici genomes.
- https://doi.org/10.7554/eLife.22472.012
-
Figure 4—source data 2
Frequency of codon substitutions in S. sclerotiorum and Z. tritici populations (as % of all codons).
Ref. indicates codons in the reference genome (isolate 1980 for S. sclerotiorum and isolate IPO323 for Z. tritici) tog ether with their total number, Var. indicates variant codons.
- https://doi.org/10.7554/eLife.22472.013
-
Figure 4—source code 1
Python scripts for in silico evolution of codon usage.
- https://doi.org/10.7554/eLife.22472.014
Figure 4—figure supplement 1
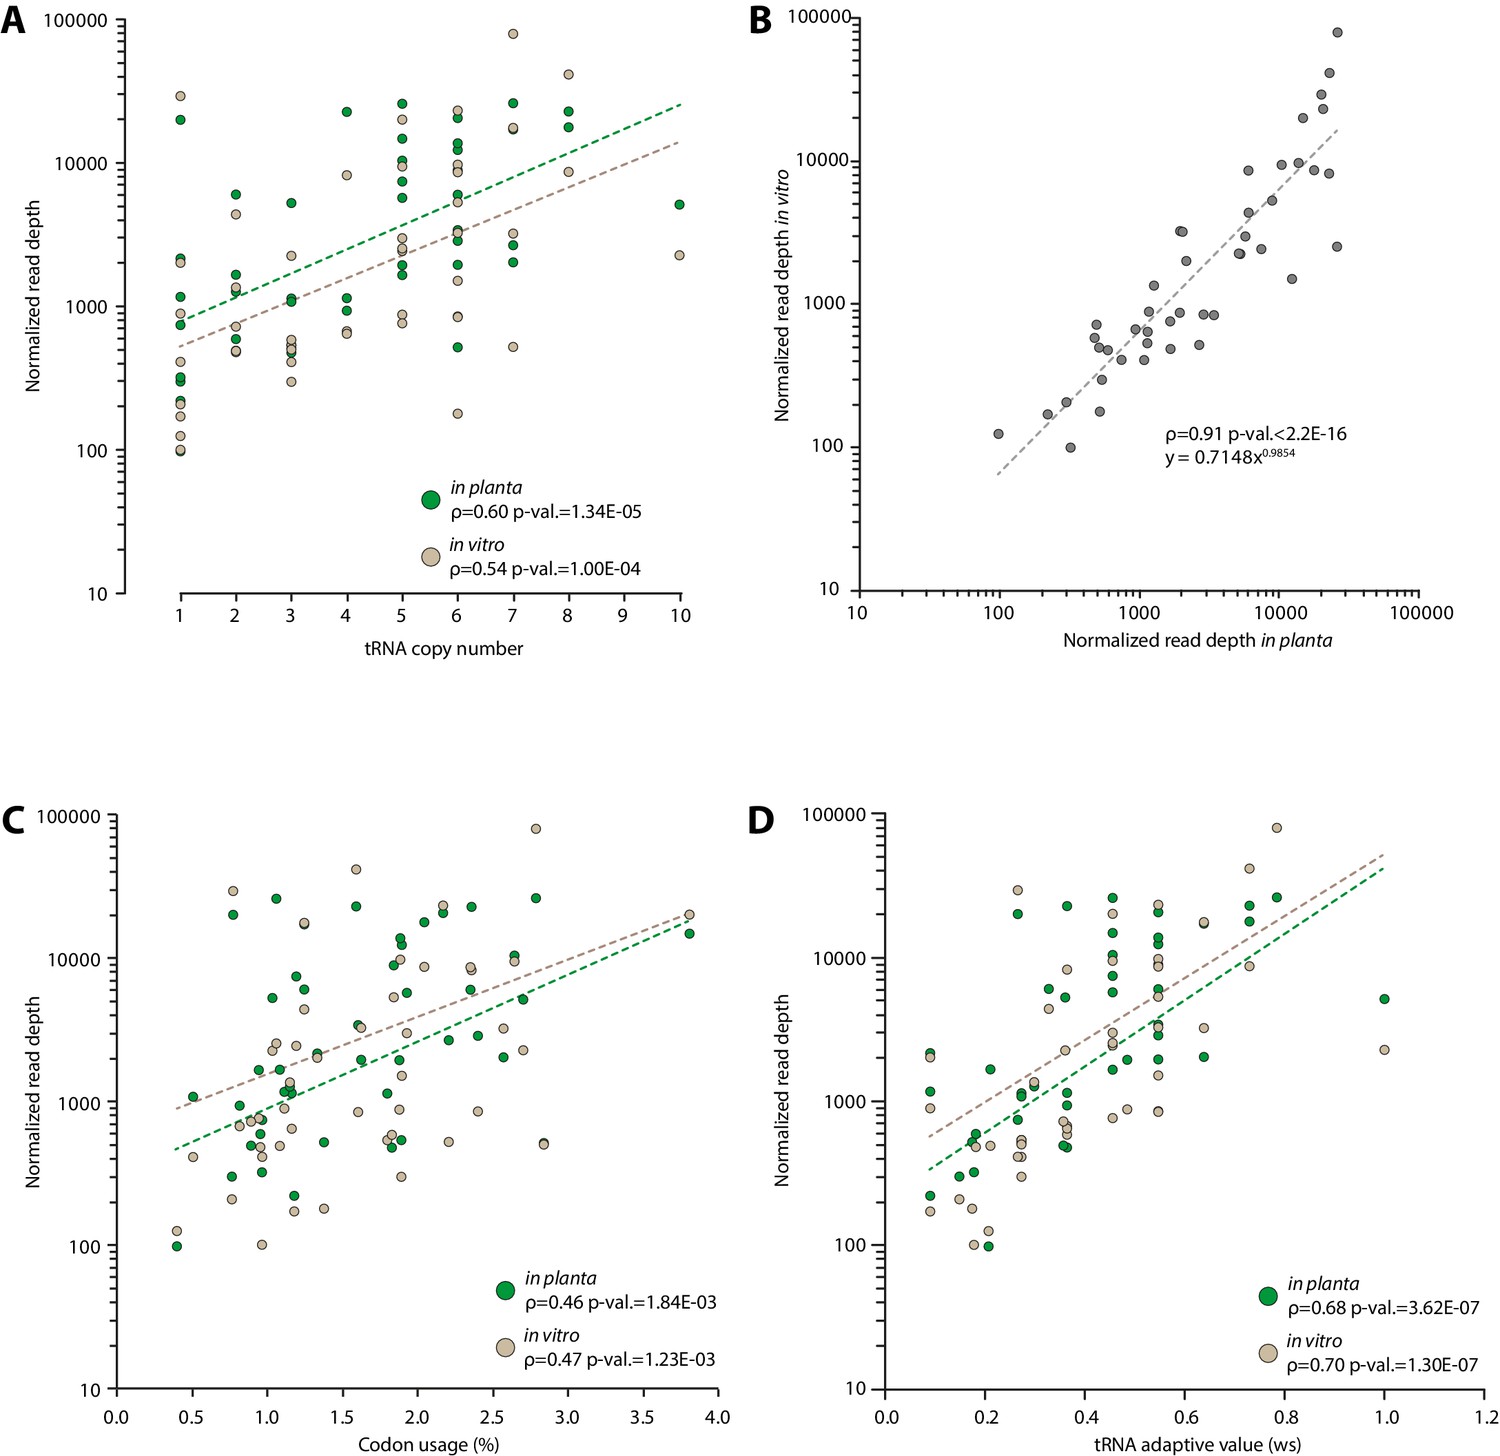
Experimental determination of S. sclerotiorum tRNA accumulation supports a good correlation between genomic copy numbers and tRNA accumulation.
The accumulation of tRNA transcripts was determined by sequencing small RNAs of S. sclerotiorum grown in vitro and in planta. (A) Normalized read depth correlated exponentially with tRNA copy number for each tRNA species both in vitro and in planta. (B) A comparison of tRNA transcripts accumulation in vitro and in planta. Correlation of tRNA transcripts accumulation with codon usage (C) and tRNA adaptive value (D) calculated as described in dos Reis et al. (2004). The exponential regression of the data is shown as a dotted line. The Spearman rank correlation coefficient ρ and the p-value for Spearman’s test are given.
Figure 4—figure supplement 2
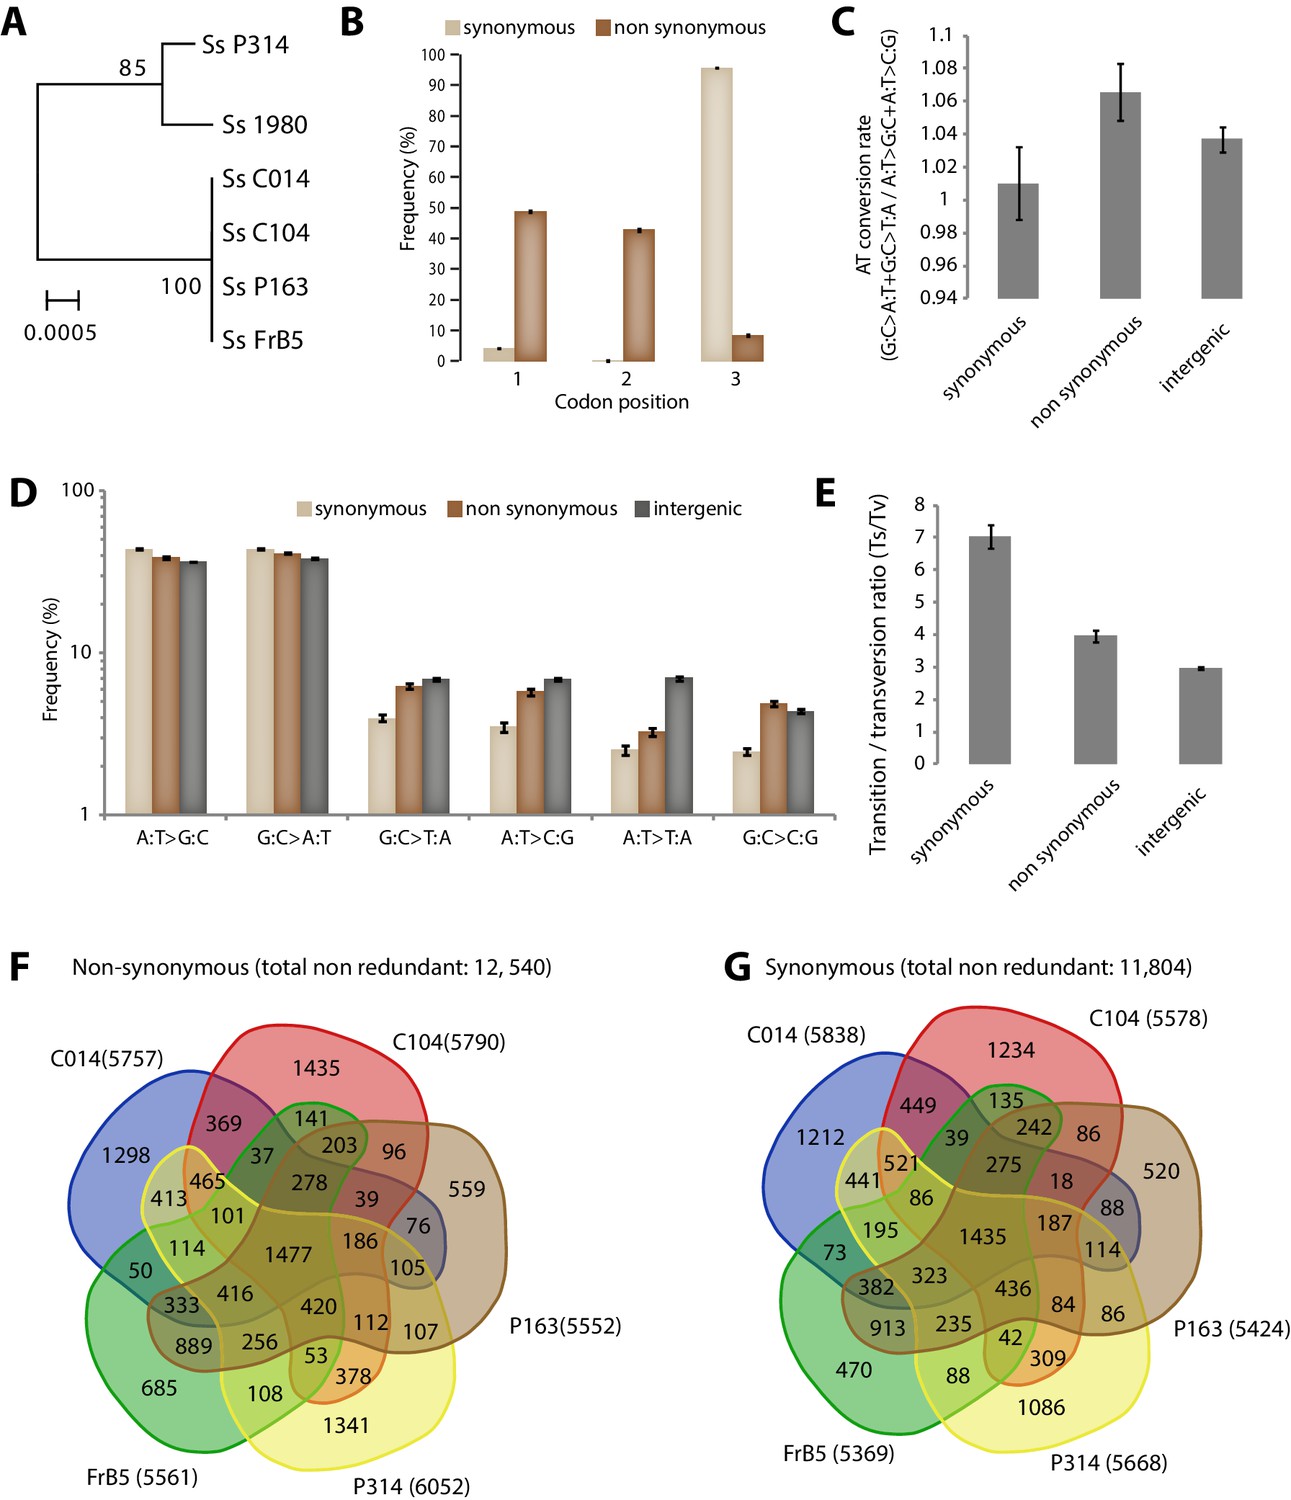
Analysis of Single Nucleotide Polymorphisms (SNPs) in a natural population of the generalist plant pathogen Sclerotinia sclerotiorum.
(A) IGS-based phylogeny of the S. sclerotiorum isolates re-sequenced in this work. (B) Frequency of SNPs according to codon position and SNP type. (C) SNPs in coding regions do not show significant bias toward enrichment in A or T nucleotides as shown by the rate of AT conversion. (D) Frequency of each substitution type among synonymous, non-synonymous and intergenic SNPs shows higher transition rate among synonymous substitutions. (E) Transition/transversion ratio per SNP type shows ~threefold increase in synonymous substitutions. (B–E) Error bars show the standard deviation of means for each isolate. Distribution of non-synonymous (F) and synonymous (G) SNPs among the five re-sequenced isolates.
Figure 5
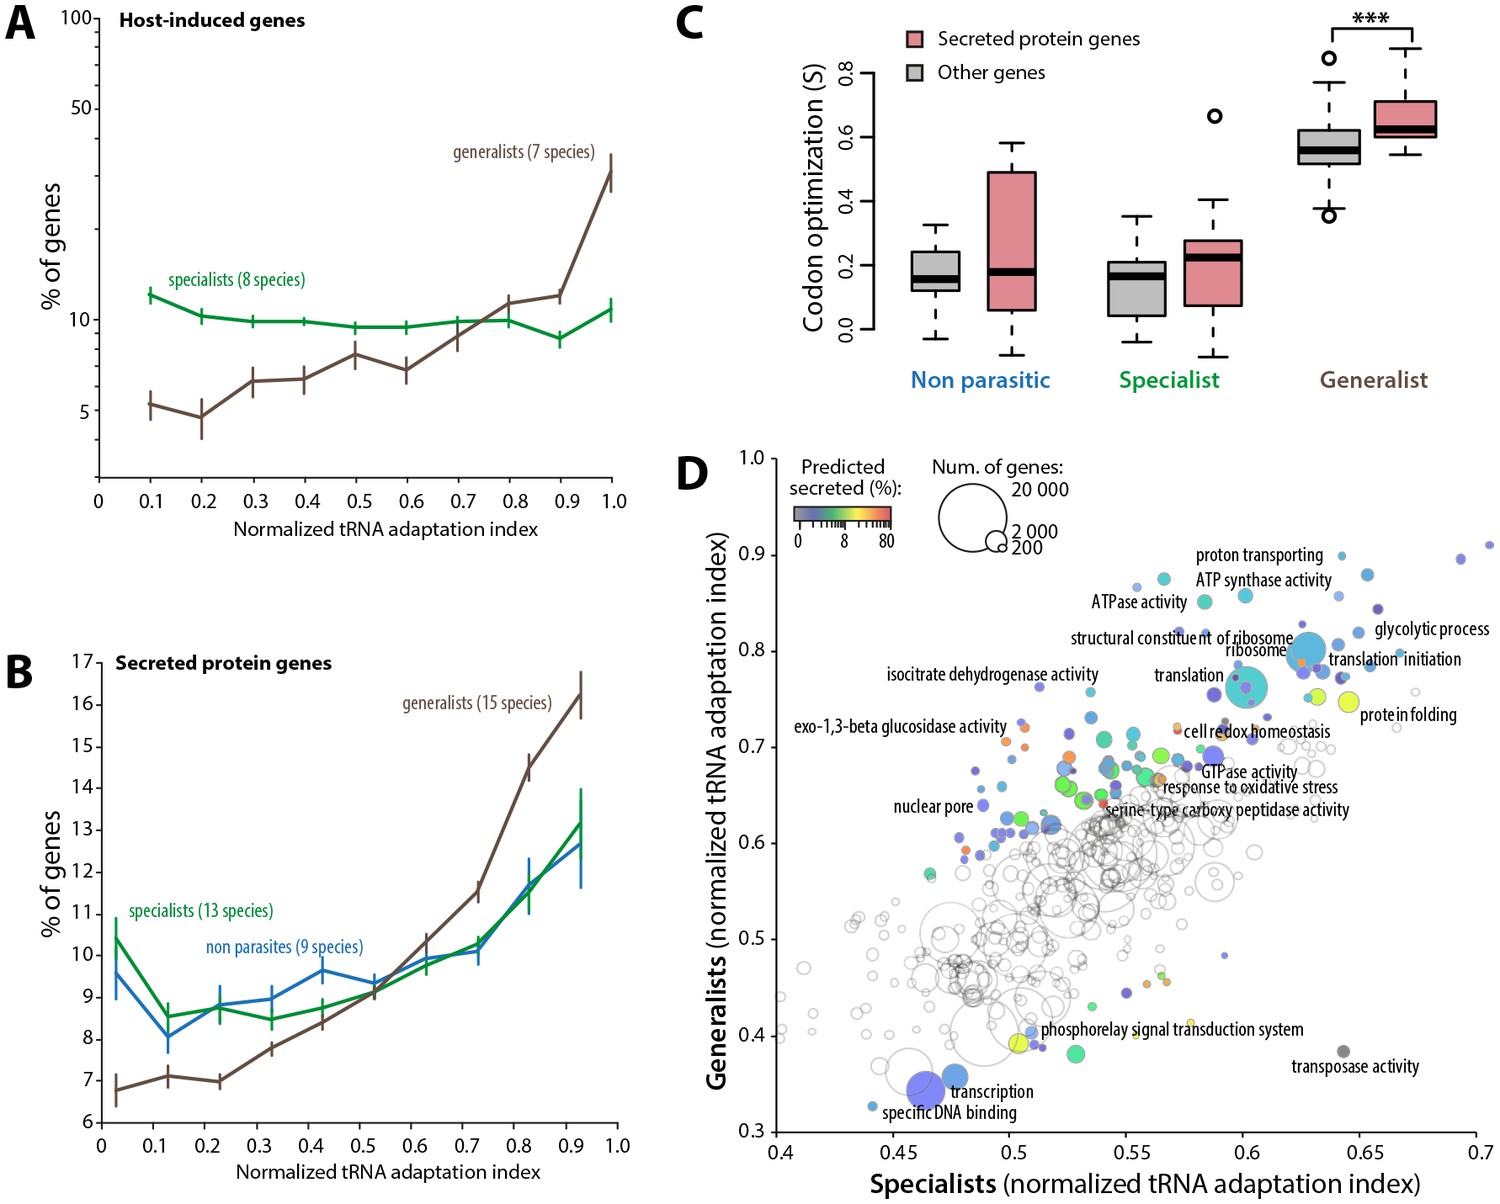
Codon optimization strongly associates with host colonization in generalist fungal parasites.
(A) Genes induced during host infection are enriched among high tRNA adaptation index genes in generalist but not specialist parasite genomes. Error bars show standard error of the mean. (B) Genes encoding predicted secreted proteins are more strongly enriched among high tRNA adaptation index genes in generalist parasite genomes compared to specialist and non-parasitic fungi genomes. Error bars show standard error of the mean. (C) Degree of coadaptation of secreted protein genes and other genes to the genomic tRNA pool in non parasitic, specialist and generalist fungi (*** Student’s paired t-test p<0.002). (D) Distribution of tRNA adaptation indices according to gene functions in generalist and specialist fungal parasites. For each Gene Ontology (GO), the average normalized tRNA adaptation indices in all genes from generalist and specialist genomes are shown. Bubbles are sized according to the total number of genes, and colored according to the percentage of predicted secreted proteins when values for generalists and specialists differ by over 10%. Selected GOs are labeled.
-
Figure 5—source data 1
Summary of gene expression data used for the analysis of tAI in host-induced genes.
- https://doi.org/10.7554/eLife.22472.018
-
Figure 5—source data 2
Distribution of host-induced genes according to tAI (as % of all host-induced genes).
- https://doi.org/10.7554/eLife.22472.019
-
Figure 5—source data 3
Distribution of secreted protein genes according to tAI (as % of all host-induced genes).
- https://doi.org/10.7554/eLife.22472.020
-
Figure 5—source data 4
Codon optimization values in secreted and non-secreted proteins for each of the 45 fungal genomes analyzed in this work.
Cat. Category; NP, non parasitic; Gen, generalist; Spe, specialist; No. Sec. Prot., Number of secreted proteins.
- https://doi.org/10.7554/eLife.22472.021
-
Figure 5—source data 5
Distribution of tRNA adaptation indices per Gene Ontology in generalist and specialist genomes.
- https://doi.org/10.7554/eLife.22472.022
Tables
Table 1
List of fungal species analyzed in this work, their host range and genome-scale codon optimization values. Genome-scale codon optimization was calculated using tRNA adaptation indiced (S), codon adaptation indices (SCAI) or self-consistent normalized relative codon adaptation indices (SscnRCA).
Species | Host range | Class* | S | SCAI | SscnRCA |
|---|---|---|---|---|---|
Cryptococcus neoformans | 800 | Gen. | 0.843 | 0.870 | 0.860 |
Rhizoctonia solani | 690 | Gen. | 0.432 | 0.624 | 0.583 |
Botrytis cinerea | 556 | Gen. | 0.597 | 0.675 | 0.653 |
sclerotinia sclerotiorum | 332 | Gen. | 0.524 | 0.583 | 0.553 |
Beauveria bassiana | 269 | Gen. | 0.616 | 0.619 | 0.747 |
Metarhizium acridum | 228 | Gen. | 0.647 | 0.595 | 0.712 |
Aspergillus fumigatus | 175 | Gen. | 0.609 | 0.643 | 0.684 |
Batrachochytrium dendrobatidis | 153 | Gen. | 0.545 | 0.521 | 0.602 |
Verticilium dahliae | 78 | Gen. | 0.537 | 0.426 | 0.627 |
Fusarium graminearum | 72 | Gen. | 0.788 | 0.818 | 0.819 |
Colletotrichum graminicola | 59 | Gen. | 0.572 | 0.444 | 0.644 |
Rhizopus oryzae | 28 | Gen. | 0.625 | 0.563 | 0.691 |
Penicillium digitatum | 17 | Gen. | 0.545 | 0.602 | 0.630 |
Alternaria brassicicola | 16 | Gen. | 0.400 | 0.592 | 0.628 |
Pyrenophora tritici-repentis | 11 | Gen. | 0.419 | 0.569 | 0.570 |
Pseudogymnoascus destructans | 8 | 0.484 | 0.513 | 0.505 | |
Encephalitozoon intestinalis | 7 | 0.313 | 0.558 | 0.528 | |
Melampsora larici-populina | 7 | 0.194 | 0.142 | 0.055 | |
Stagonospora nodorum | 7 | 0.155 | 0.431 | 0.462 | |
Colletotrichum higginsianum | 6 | 0.393 | 0.295 | 0.480 | |
Sporisorium reilianum | 5 | 0.476 | 0.200 | 0.429 | |
Taphrina deformans | 4 | 0.403 | 0.679 | 0.671 | |
Magnaporthe oryzae | 4 | 0.437 | 0.424 | 0.575 | |
Puccinia graminis | 2 | Spe. | −0.032 | 0.344 | 0.249 |
Wolfiporia cocos | 2 | Spe. | 0.217 | 0.266 | 0.316 |
Moniliophthora roreri | 2 | Spe. | 0.406 | 0.530 | 0.551 |
Passalora fulva | 2 | Spe. | −0.011 | 0.513 | 0.514 |
Rozella allomycis | 1 | Spe. | 0.236 | 0.096 | 0.259 |
Nosema ceranae | 1 | Spe. | 0.021 | −0.155 | −0.085 |
Puccinia triticina | 1 | Spe. | 0.204 | 0.501 | 0.472 |
Dothistroma septosporum | 1 | Spe. | 0.211 | 0.447 | 0.354 |
Pseudocercospora fijiensis | 1 | Spe. | 0.227 | 0.495 | 0.490 |
Zymoseptoria tritici | 1 | Spe. | −0.019 | 0.355 | 0.248 |
Blumeria graminis | 1 | Spe. | 0.116 | −0.187 | 0.164 |
Erysiphe necator | 1 | Spe. | 0.174 | −0.092 | 0.117 |
Ophiocordyceps unilateralis | 1 | Spe. | 0.166 | 0.268 | 0.458 |
Gonapodya prolifera | 0 | np | 0.115 | 0.311 | 0.363 |
Rhodotorula toruloides | 0 | np | 0.344 | 0.385 | 0.470 |
Serpula lacrymans | 0 | np | −0.001 | 0.379 | 0.395 |
Laccaria bicolor | 0 | np | −0.026 | 0.237 | 0.155 |
Agaricus bisporus | 0 | np | 0.361 | 0.432 | 0.400 |
Tuber melanosporum | 0 | np | 0.230 | 0.319 | 0.349 |
Oidiodendron maius | 0 | np | 0.147 | 0.442 | 0.388 |
Myceliophthora thermophila | 0 | np | 0.246 | 0.123 | 0.323 |
Chaetomium globosum | 0 | np | 0.148 | 0.204 | 0.342 |
-
*The class column indicates whether species were considered as generalist (Gen.), specialist (Spe.) or non-parasitic (np).
Download links
A two-part list of links to download the article, or parts of the article, in various formats.
Downloads (link to download the article as PDF)
Open citations (links to open the citations from this article in various online reference manager services)
Cite this article (links to download the citations from this article in formats compatible with various reference manager tools)
Codon optimization underpins generalist parasitism in fungi
eLife 6:e22472.
https://doi.org/10.7554/eLife.22472


