Dpp controls growth and patterning in Drosophila wing precursors through distinct modes of action
- Institute of Molecular Life Sciences, University of Zurich, Switzerland
- The Francis Crick Institute, United Kingdom
Figures
Figure 1 with 1 supplement
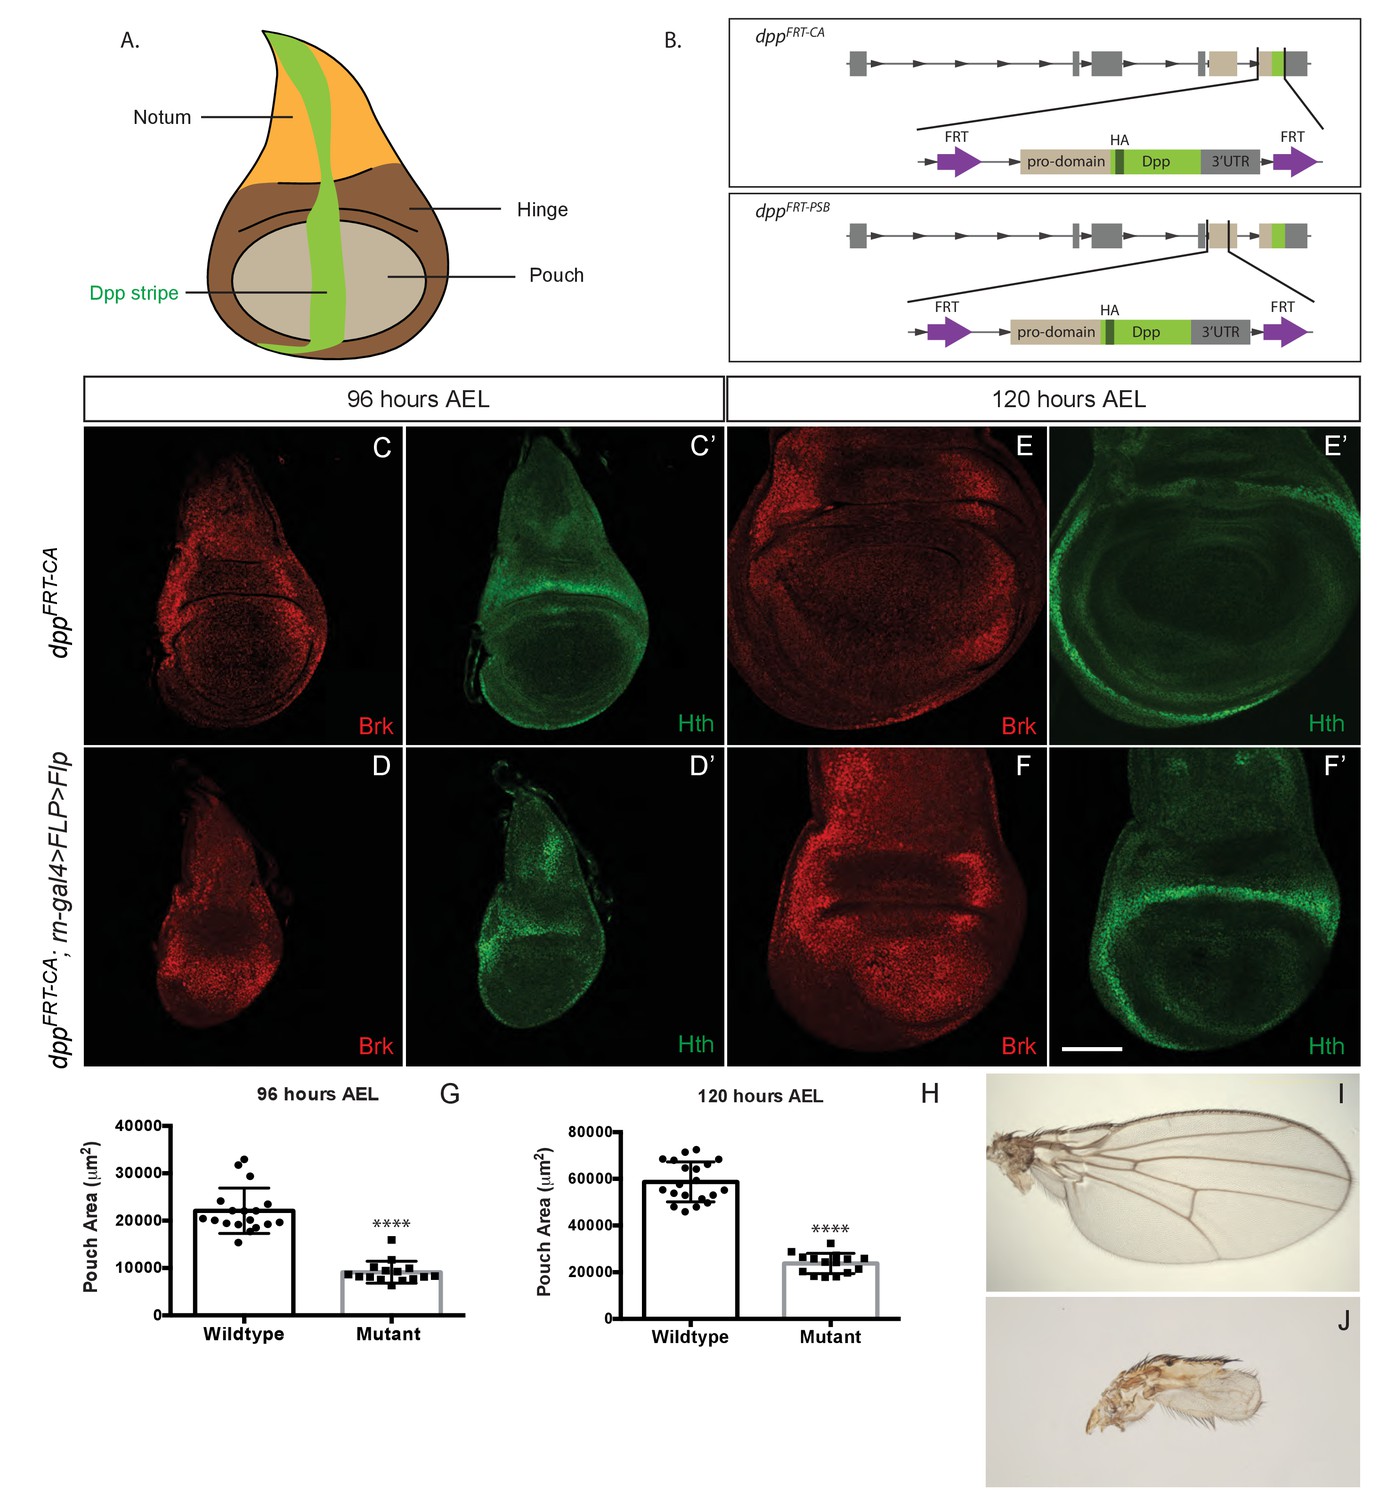
Growth of the prospective wing requires Dpp expression within the pouch.
(A) Diagram highlighting the three domains of wing imaginal discs and the stripe of Dpp expression. (B) Diagram of the two conditional alleles we created, showing the region deleted from the genome and the inserted fragment. (C–F’). Inactivation of dppFRT-CA in the pouch (with rotund-gal4 UAS-Flp) leads to derepression of brinker and reduced growth (shown here in discs fixed at 96 hr and 120 hr AEL). The edge of the pouch is marked by the weak inner ring of Hth expression. However, since the outer ring is more readily visible, this is the marker we used to measure pouch size (thus overestimating). (G, H) Quantification of the area enclosed by the Hth outer ring at the two stages (each dot/square represents one imaginal disc). (I, J) Wings from control (I) and experimental (J) adults. The scale bar, which represents 50 μm, applies to panels (C-F’). In panels (G and H) statistical significance of the difference between experimental and control samples was assessed with Student’s t-test, assuming equal variance and a Gaussian distribution (p<0.0001).
-
Figure 1—source data 1
Pouch area.
- https://doi.org/10.7554/eLife.22546.004
Figure 1—figure supplement 1
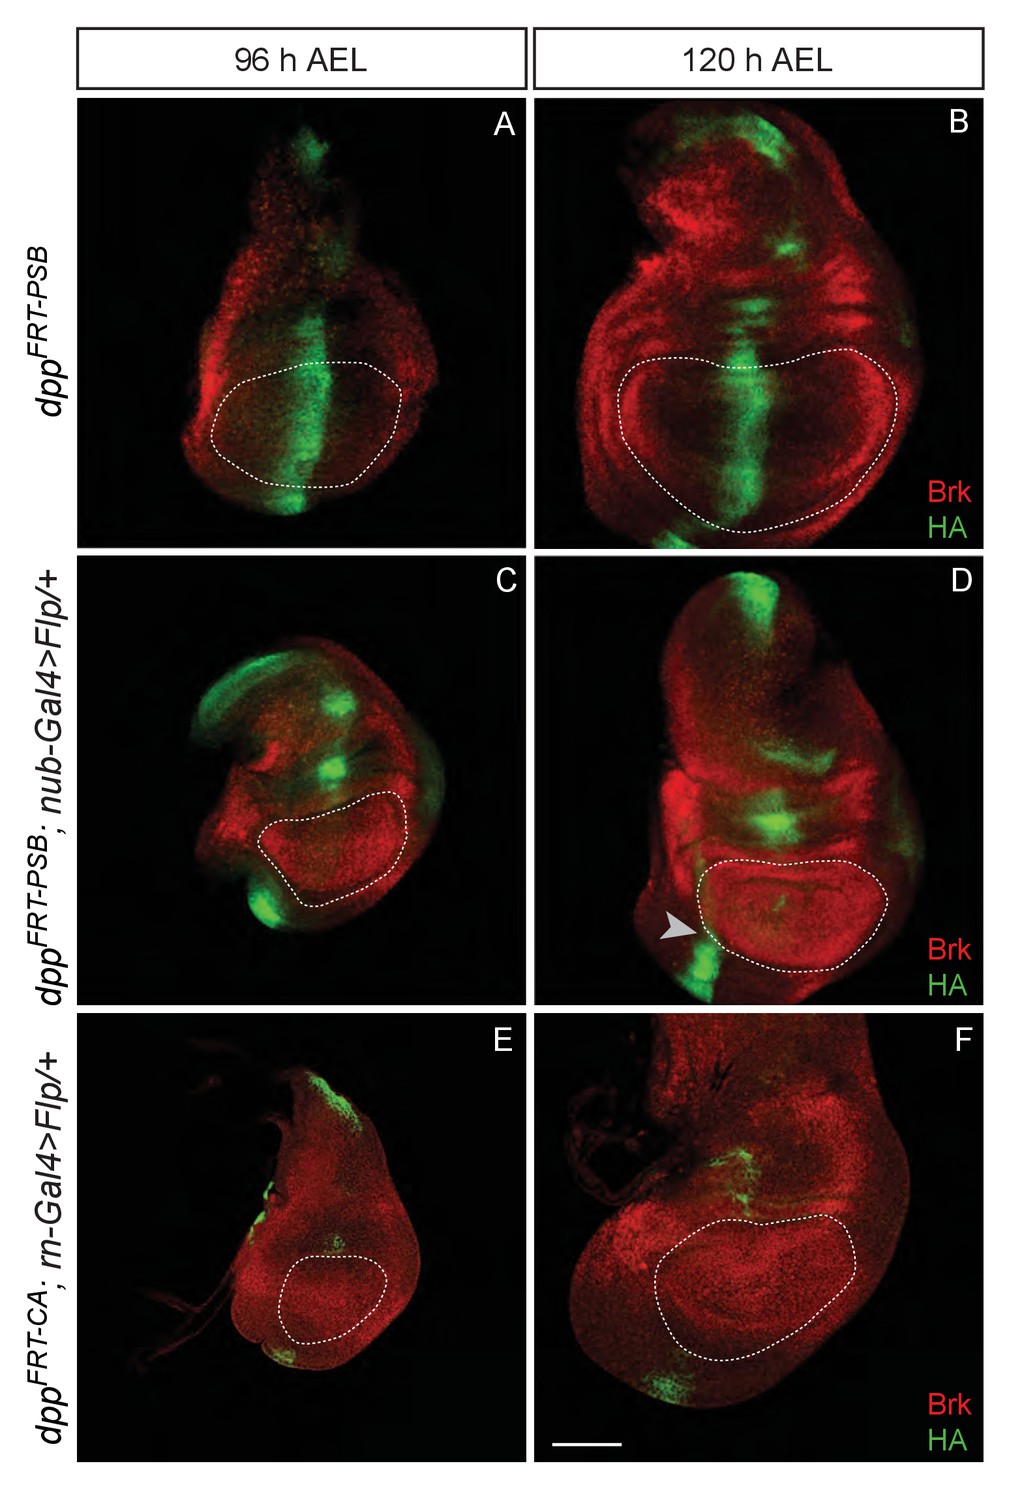
Inactivation of Dpp specifically in the pouch.
(A–B) Expression of HA-Dpp and Brinker in the unexcised dppFRT-PSB allele (normal Dpp activity). Note the repression of brinker expression on either side of the central stripe of Dpp. (C–D) Pouch-specific inactivation of Dpp expression from dppFRT-PSB by nubbin-gal4 UAS-Flp. Most HA immunoreactivity has disappeared at 96 hr AEL, although some is still detectable at 72 hr AEL (not shown). As Dpp disappears, brinker becomes derepressed. (E–F). Pouch-specific inactivation of Dpp expression from dppFRT-CA by rotund-gal4 UAS-Flp. As with nubbin-Gal4, Dpp is no longer detectable in the pouch from 96 hr AEL. On all panels, the edge of the pouch (marked with a white dotted line) was estimated from tissue folds that could be observed in the DAPI channel (not shown). Scale bar = 50 µm.
Figure 2

Temporal requirement of Dpp for growth.
(A–D) Imaginal discs at 120 hr AEL following inactivation of dppFRT-PSB by induction of hsp70-Flp at the indicated times. Inactivation of Dpp leads to ubiquitous derepression of brinker, with the exception of residual HA-Dpp expressing clones (Representative examples are shown). (E) The total surface area of discs heat shocked at 24, 48, 72, and 96 hr AEL was measured and normalised to the average surface area of control discs (n = 4 for 24 hr AEL and n = 20 for the other time points). Area measurement for each time point was compared to the control area (no heat shock) with a one-way ANOVA. The p value was highly significant (<0.0001) for every side by side comparison except for 96 hr AEL vs 120 hr AEL. Scale bar = 50 µm.
-
Figure 2—source data 1
Total disc area.
- https://doi.org/10.7554/eLife.22546.007
Figure 3 with 3 supplements
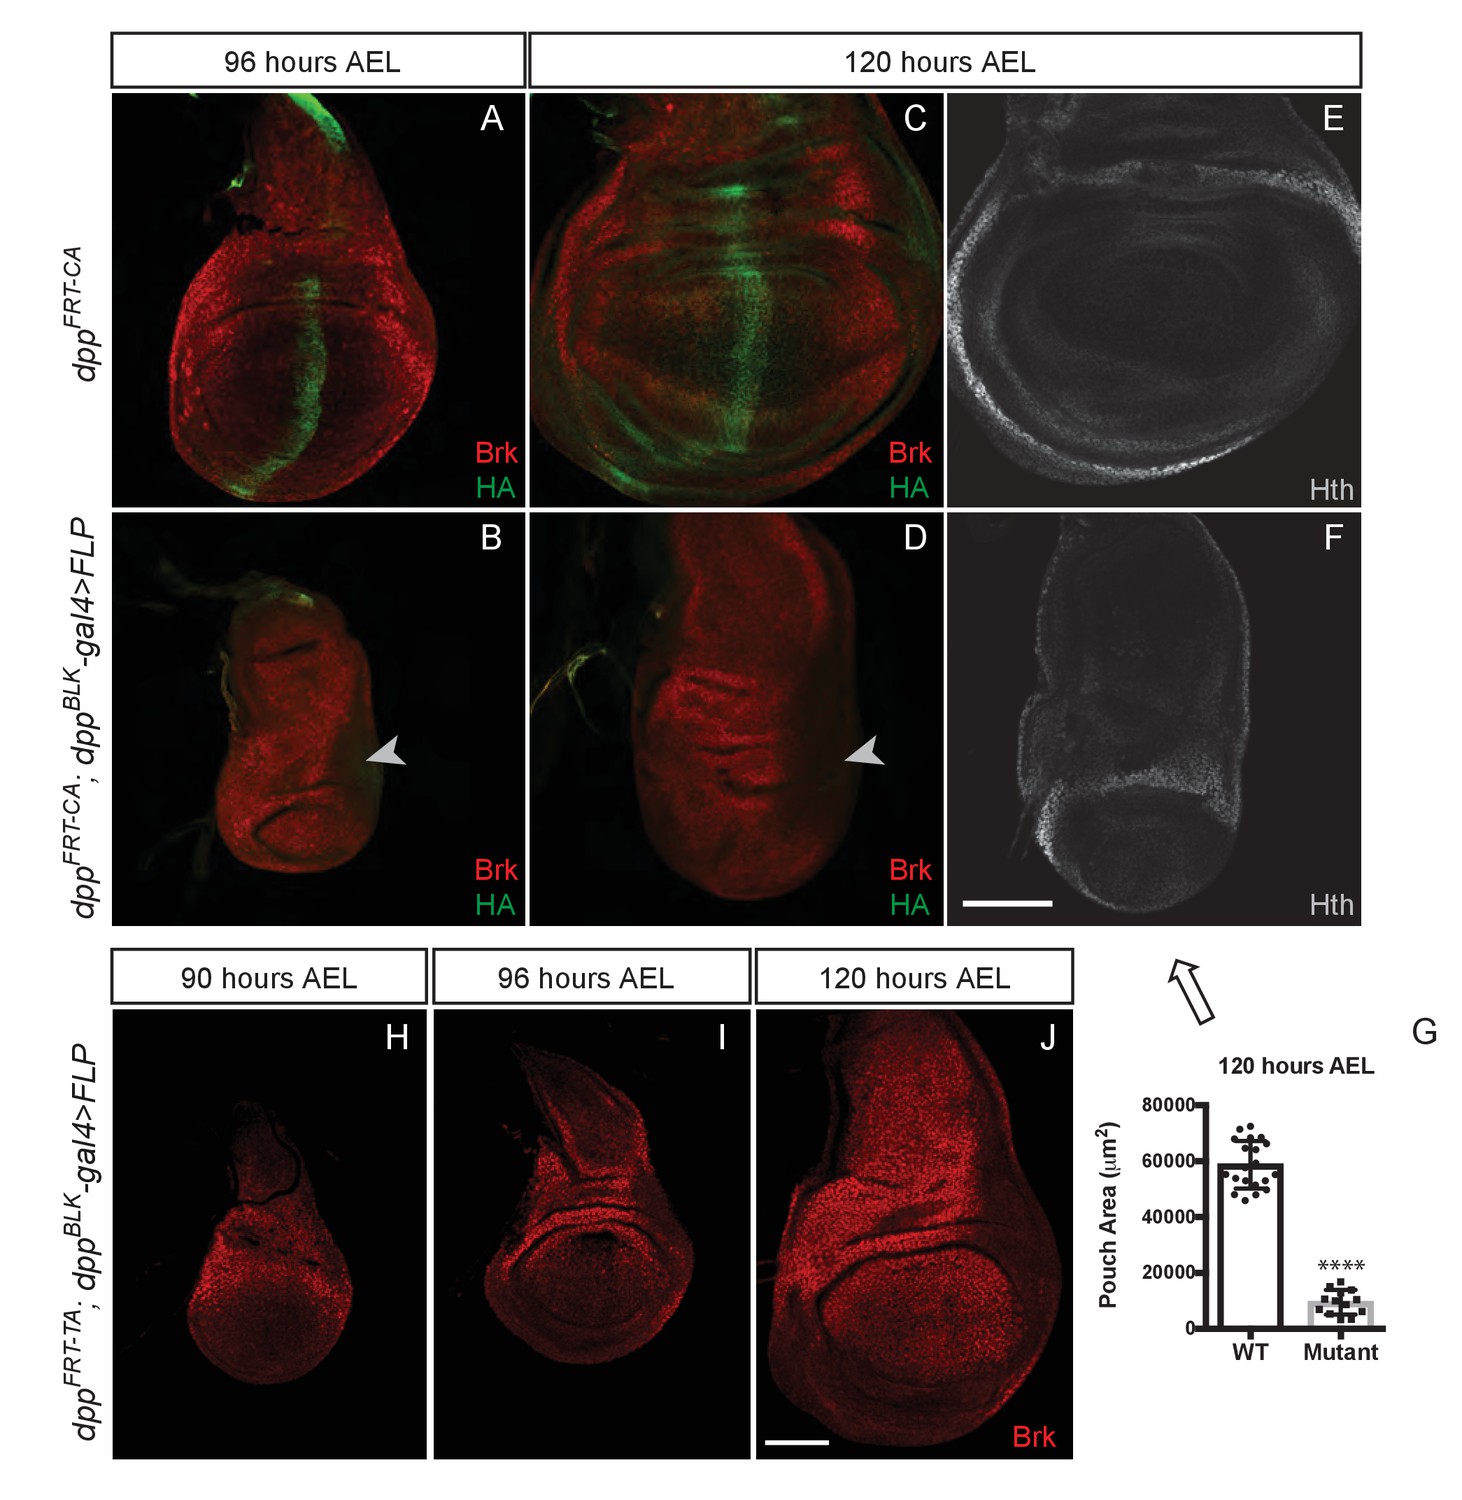
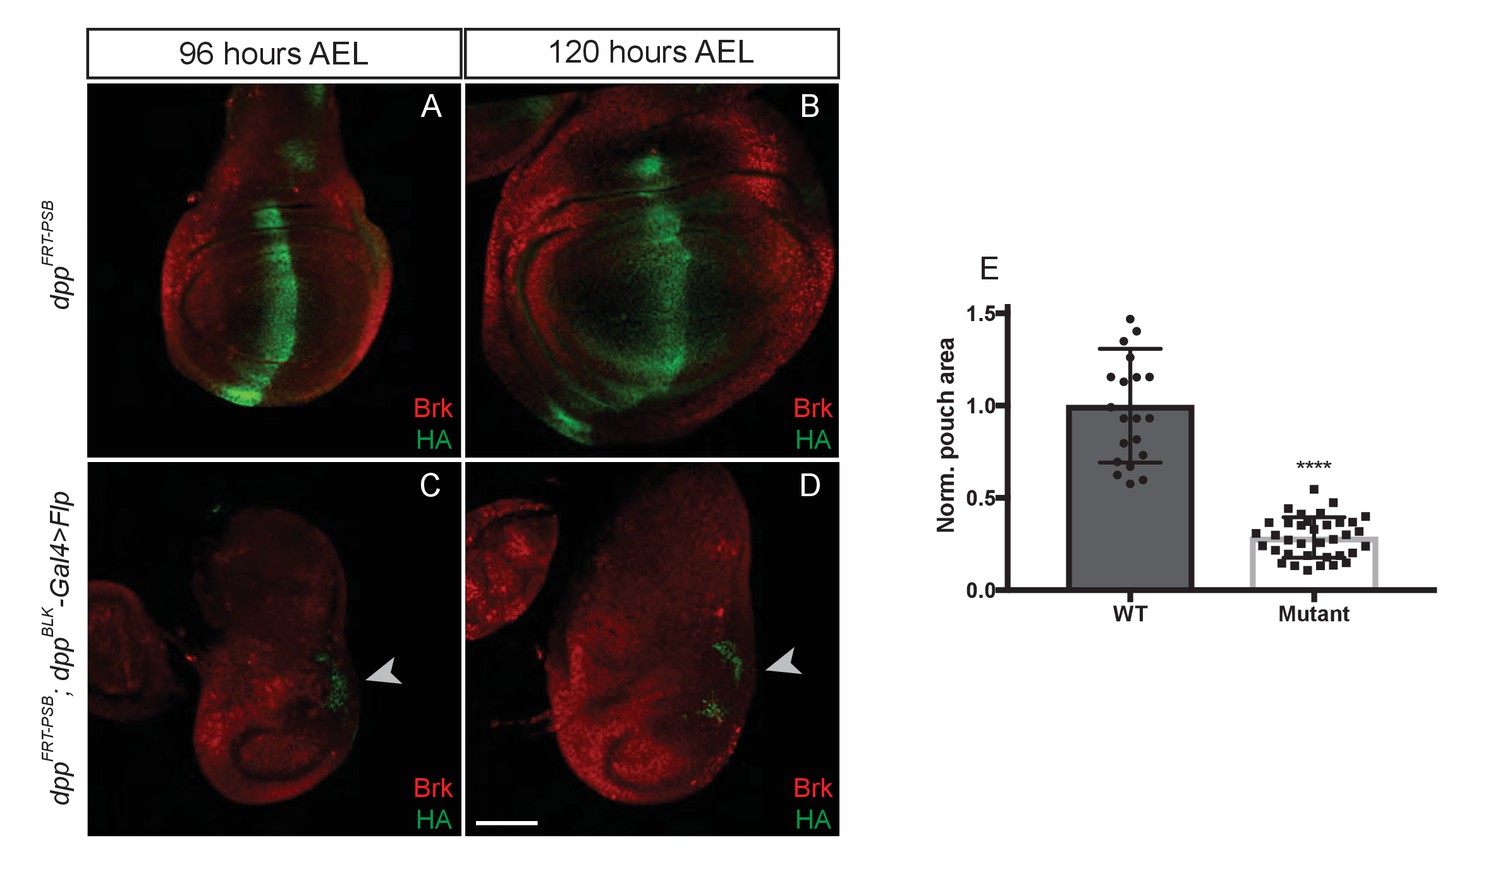
Growth of the prospective wing requires the endogenous stripe of Dpp expression.
(A–F) Inactivation of dppFRT-CA in the normal domain of Dpp expression (with dppBLK-Gal4 UAS-Flp) leads to depression of brinker and reduced growth (shown here in discs fixed at 96 and 120 hr AEL). A zone of brinker repression can be seen in the prospective hinge around weak residual Dpp expression (arrowhead in B, D). (G) Quantification of the pouch area (area enclosed by the outer ring of Hth) in control and experimental discs (each dot/square represents a disc). Asterisks in panels G denote the statistical significance of the difference between experimental and control samples, using Student’s t-test, assuming equal variance and a Gaussian distribution. (H–J) Inactivation of dppFRT-TA in the normal domain of Dpp expression (with dppBLK-Gal4 UAS-Flp) only leads to Brinker derepression after growth has taken place. At earlier stages (90 and 96 hr AEL), Brinker is repressed, indicating residual Dpp signaling activity. Scale bar = 50 μm.
-
Figure 3—source data 1
Pouch area.
- https://doi.org/10.7554/eLife.22546.009
Figure 3—figure supplement 1
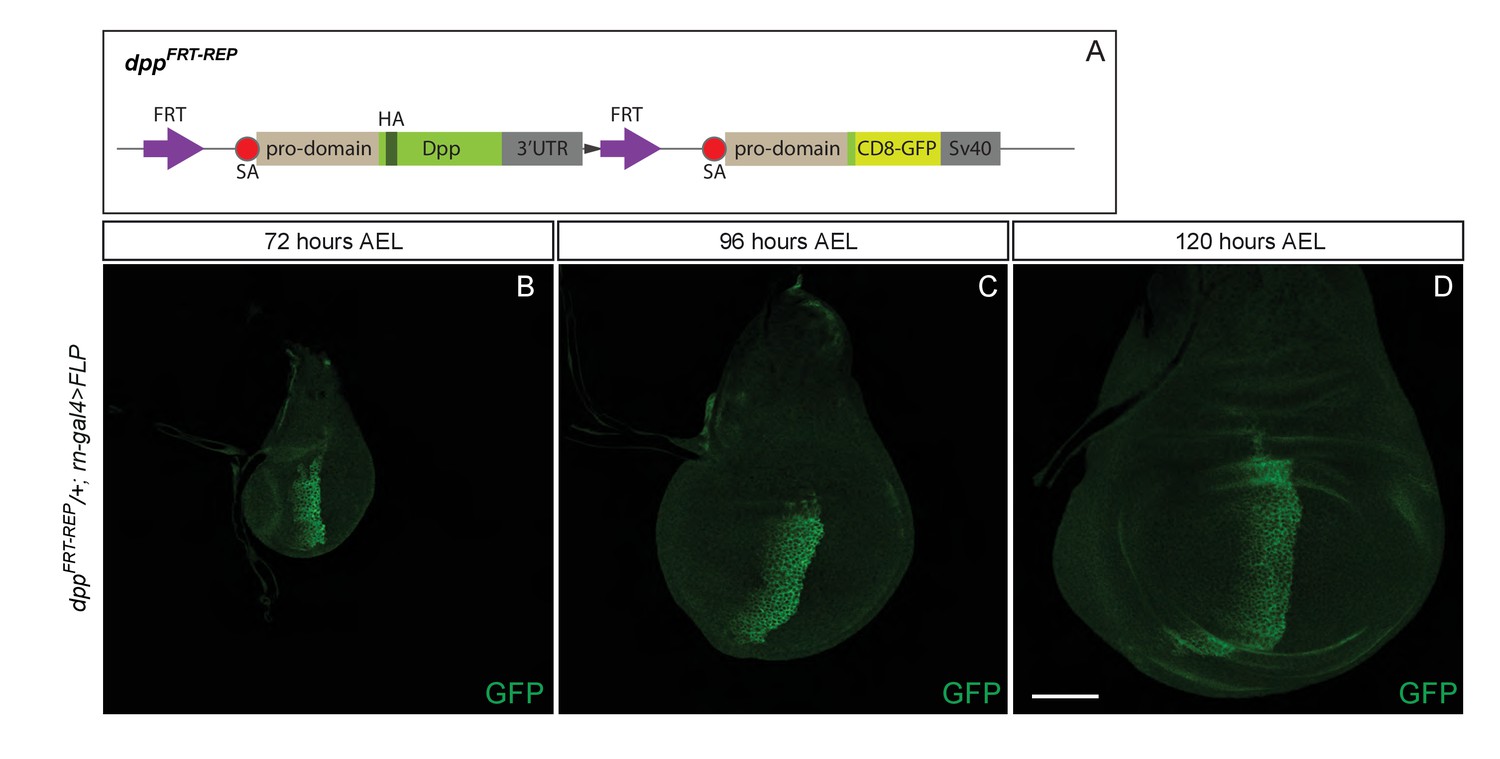
A reporter inserted at the locus shows that dpp expression is confined to the stripe along the A/P boundary.
(A) Diagram describing the dppFRT-REP allele, designed to act as a reporter following excision of the FRT-flanked HA-Dpp-containing cassette. B-D. Expression of CD8-GFP from dppFRT-REP within the pouch at 72, 96, and 120 hr AEL. Expression is only seen in the stripe.
Figure 3—figure supplement 2
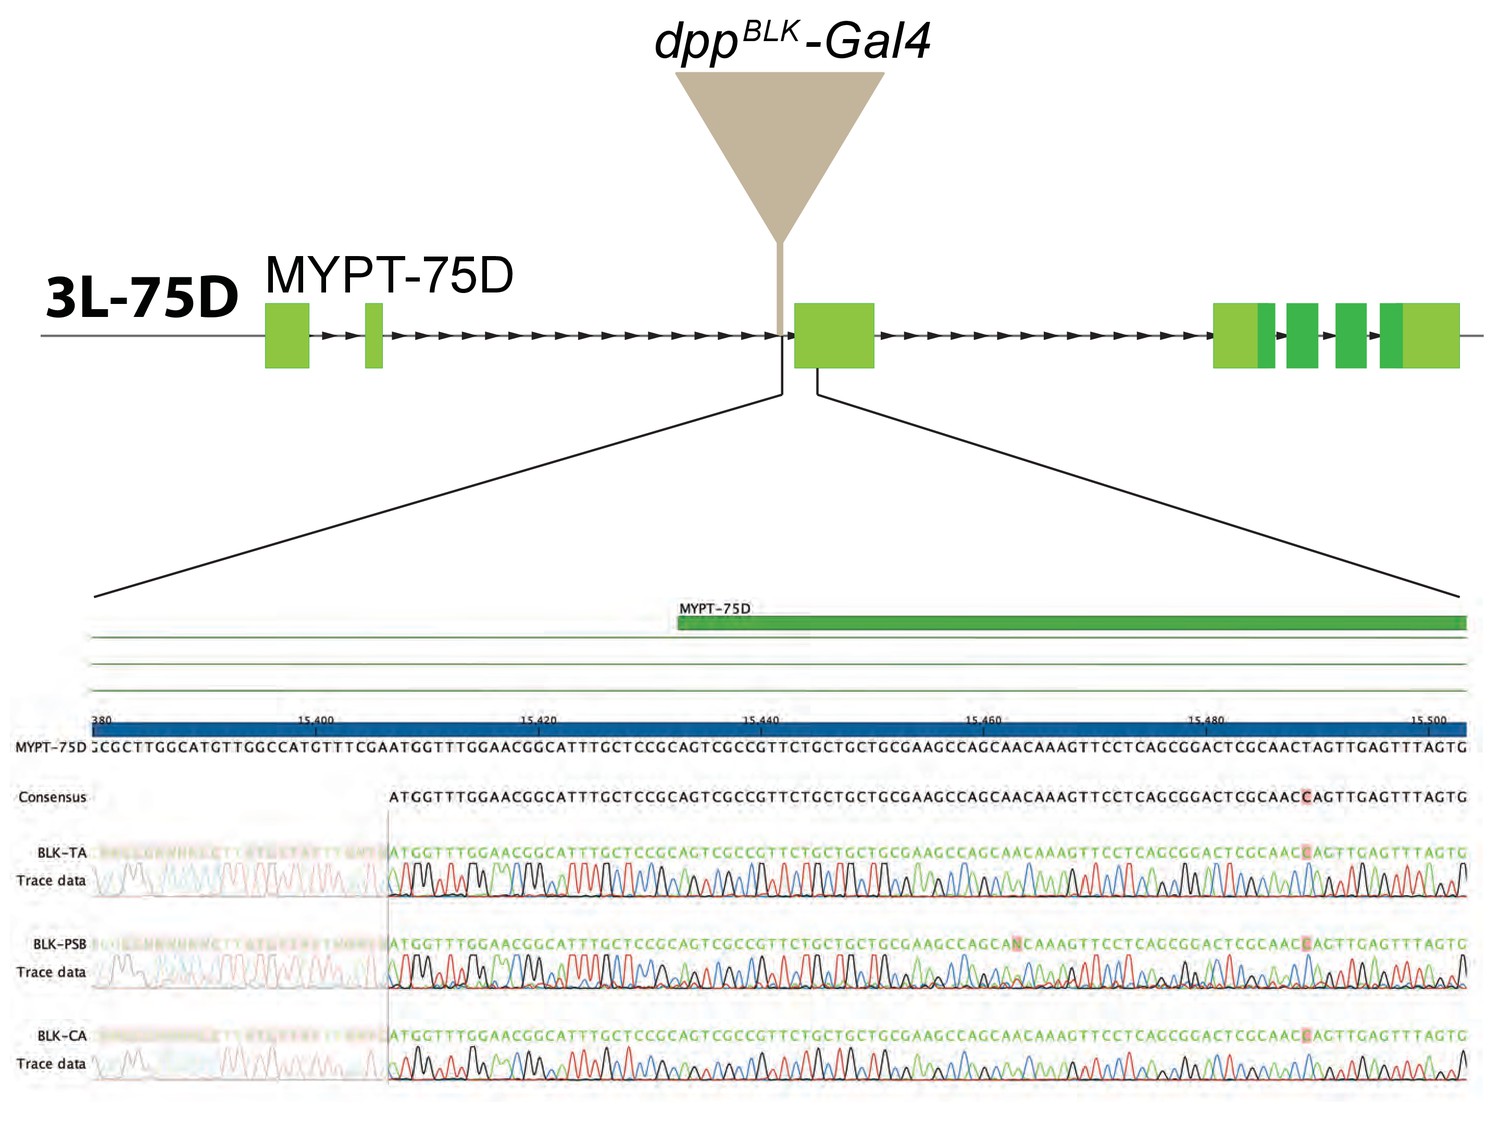
Comparison of various dpp-Gal4 strains.
Three dppBLK-Gal4 lines (kept separately in three laboratories) were characterised molecularly, as described in Materials and methods. DNA sequencing of the genomic region flanking the transgene shows that the insertion site is the same for all three strains.
Figure 3—figure supplement 3
Inactivation of dppFRT-PSB in the domain of dpp expression abolishes growth.
(A–D) Inactivation of dppFRT-PSB in the normal Dpp expression domain with dppBLK-Gal4 UAS-Flp leads to derepression of brinker and growth defects. Note the repression of brinker at the posterior end of the disc (arrowheads in C and D). (E) Quantification of the pouch area in control and experimental discs. Each dot/square represents a disc. The statistical difference (p<0.0001) was calculated with a t-test, assuming equal variance and a Gaussian distribution. Scale bar = 50 μm.
Figure 4
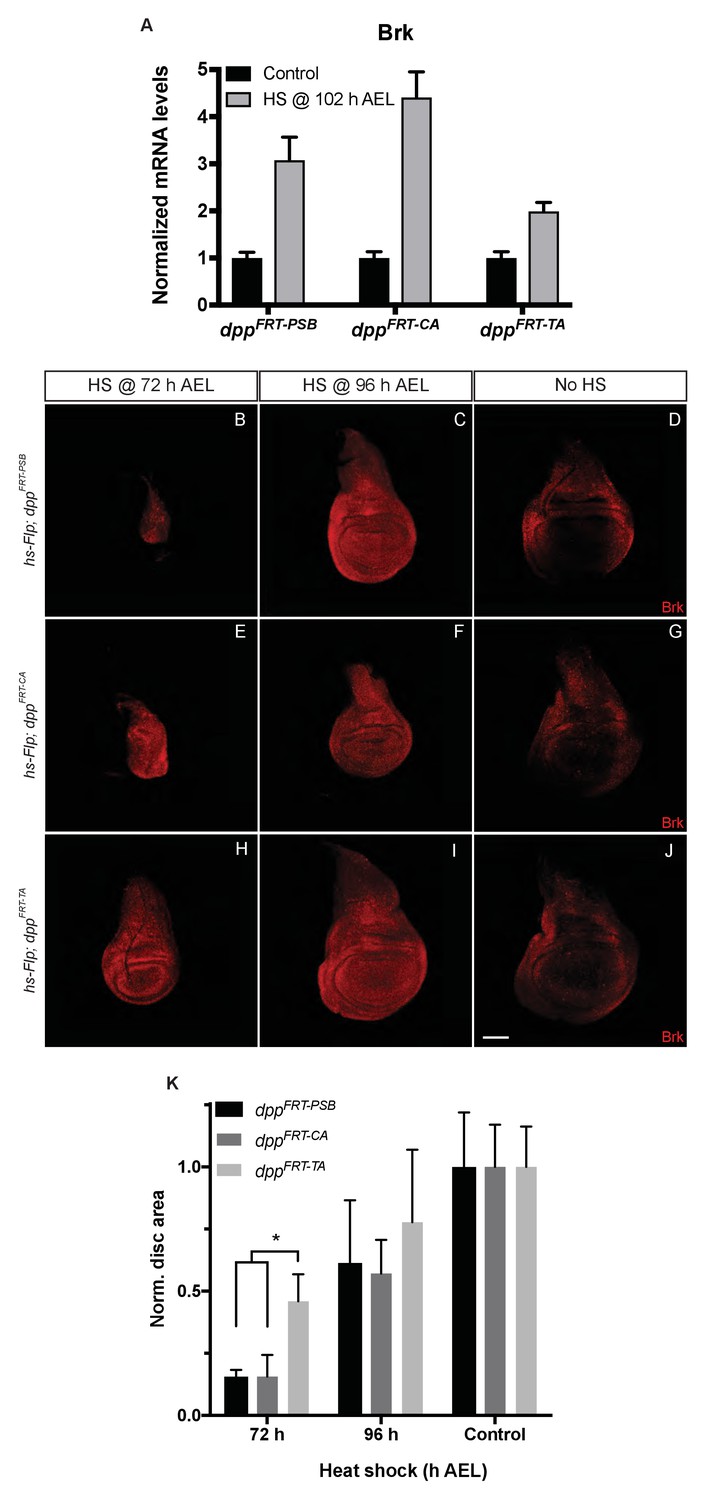
Inactivation efficiency for three conditional alleles of dpp.
(A) Efficiency of inactivation for dppFRT-PSB, dppFRT-CA and dppFRT-TA by Flp expressed from hsp70-Flp induced at 102 hr AEL. Level of brinker mRNA, normalized to that in non-heat-shocked controls, was assessed by qRT-PCR at 120 hr AEL. Each bar shows average mRNA level +/- SEM. A two-way ANOVA test showed statistically different brinker expression between dppFRT-PSB and dppFRT-TA (p=0.0041) as well as between dppFRT-CA and dppFRT-TA (p<0.0001). (B–J) Imaginal discs of the same genotypes were fixed and stained with anti-Brinker at 120 hr AEL, following a heat shock at 72 or 96 hr AEL or in the absence of heat shock (control). As can be seen, the 72 hr heat shock did not impair growth as much in dppFRT-TA as it did in dppFRT-PSB and dppFRT-CA. (K) Quantification of disc surface area (normalized to average surface area of control discs) at 120 hr AEL for the nine conditions shown in panels (B–J). Each bar represents data for 10 discs. Asterisk denotes statistical significance, as assessed by a two-way ANOVA test (p=0.029). Scale bar = 50 μm.
-
Figure 4—source data 1
Primers for qPCR.
- https://doi.org/10.7554/eLife.22546.014
-
Figure 4—source data 2
Normalised Brk mRNA levels.
- https://doi.org/10.7554/eLife.22546.015
-
Figure 4—source data 3
Total disc area.
- https://doi.org/10.7554/eLife.22546.016
Figure 5

Low level uniform Dpp expression suffices for growth but not patterning.
(A–H) Comparison of wild-type discs (A, C, E, G) to discs lacking endogenous Dpp in the pouch and expressing weak uniform Dpp instead (B, D, F, H). Uniform Dpp allows discs to reach a relatively normal size, although with a variably deformed shape (representative examples are shown). Omb is expressed in experimental discs, an indication of active Dpp signaling, but at a relatively lower level than in control discs (samples shown in A and B were stained and imaged under identical conditions). Note also the repression of Brinker and the loss of pMad expression in experimental discs. In contrast to their relatively normal size, experimental discs show abnormal vein patterning, with only two vein territories recognizable instead of the normal five (marked by the absence of DSRF immunoreactivity) (G, H). (I–K) pH3 immunoreactivity shows that, in control and rescued discs, proliferation is sustained seemingly normally (I, J) while proliferation in the pouch of non-rescued discs is depressed (K) Quantification show in L is based on 14 rescued discs, 9 controls and 11 unrescued discs. Statistical significance was assessed with a Student’s t-test, assuming equal variance and a Gaussian distribution. Mitotic density (pH3 spots/area) was determined for each individual disc using a code written in Fiji (see Figure 5—source data 1). (M–O) Wings from the above genotypes. A majority of examined experimental wings (15/20) had excess vein tissue (O) while the remainder (5/20) had one central vein around the position of the A/P boundary and another (not visible) along the margin (I). Each micrograph is representative of 7–10 discs. Scale bar = 50 μm.
-
Figure 5—source data 1
PH3 density.
- https://doi.org/10.7554/eLife.22546.018
Additional files
-
Source data 1
Allele sequences.
- https://doi.org/10.7554/eLife.22546.019
Download links
A two-part list of links to download the article, or parts of the article, in various formats.
Downloads (link to download the article as PDF)
Open citations (links to open the citations from this article in various online reference manager services)
Cite this article (links to download the citations from this article in formats compatible with various reference manager tools)
Dpp controls growth and patterning in Drosophila wing precursors through distinct modes of action
eLife 6:e22546.
https://doi.org/10.7554/eLife.22546


