Caspase-8 contributes to angiogenesis and chemotherapy resistance in glioblastoma
- University of Rome Tor Vergata, Italy
- Istituto di Ricovero e Cura a Carattere Scientifico (IRCCS) Fondazione Santa Lucia, Italy
- Consiglio Nazionale delle Ricerche (CNR), Italy
- Regina Elena National Cancer Institute, Italy
- IRCCS Istituto Neurologico Mediterraneo (INM) Neuromed, Italy
- University of Bologna, Italy
Figures
Figure 1 with 2 supplements
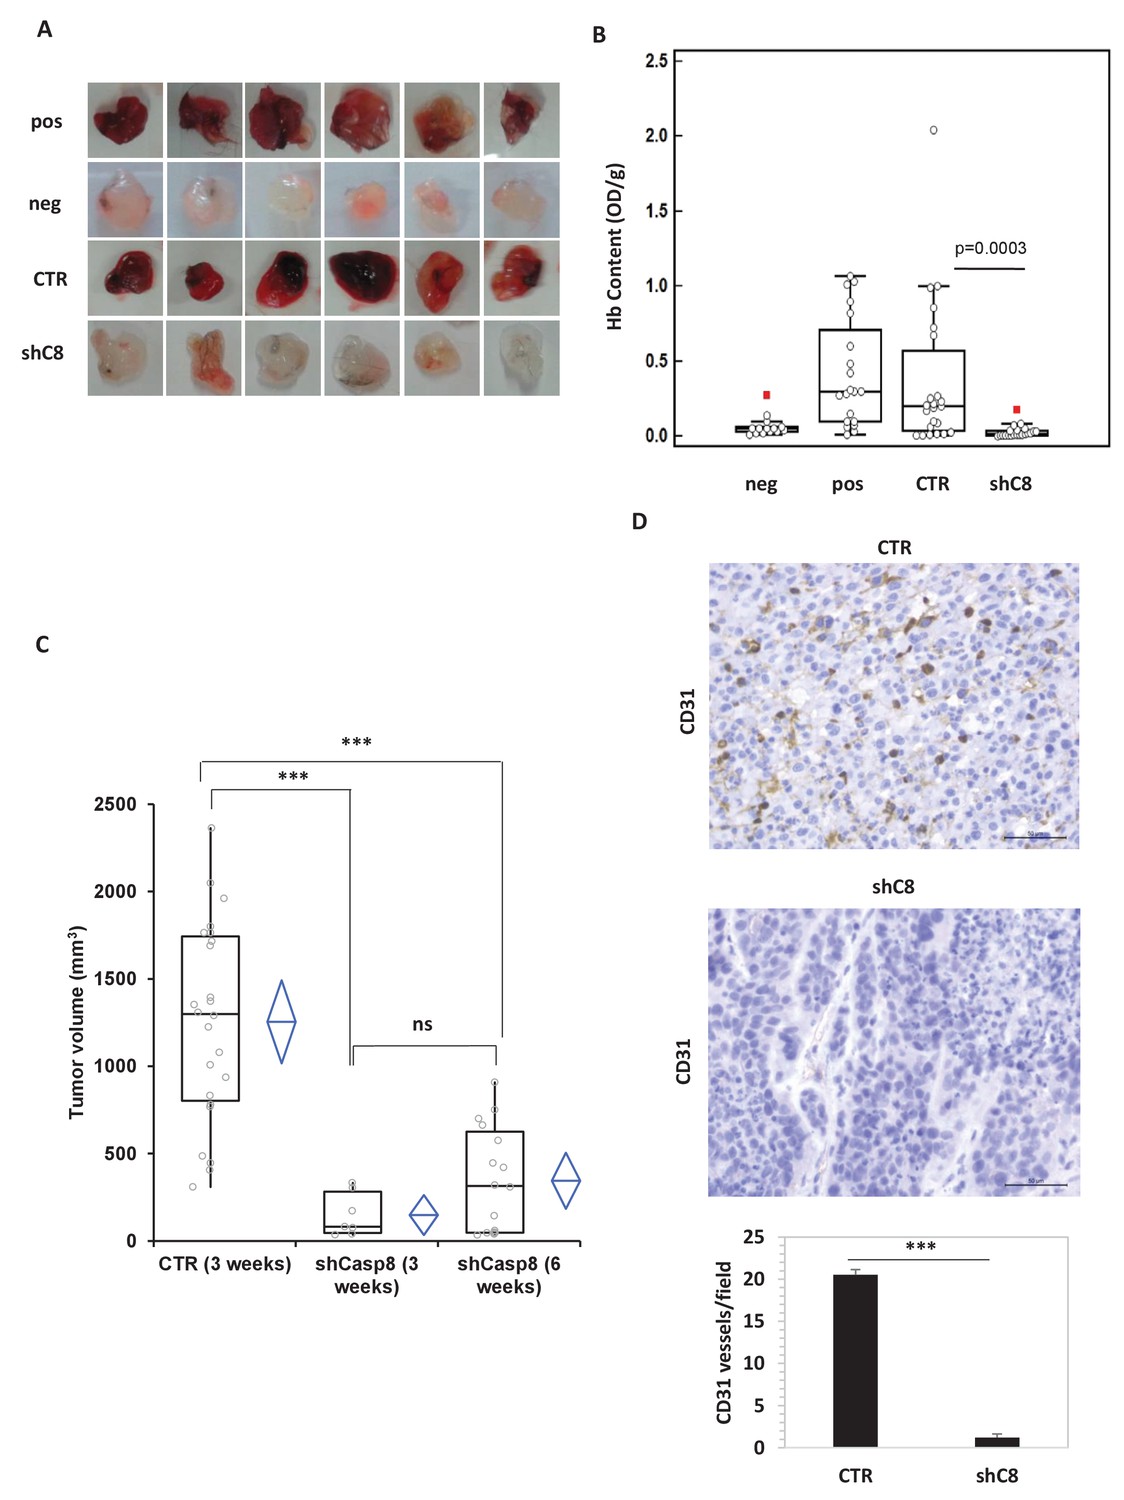
Caspase-8 expression promotes tumor growth and neoangiogenesis in vitro and in vivo.
(A, B) Caspase-8 expression promotes the ability of conditioned medium (CM) from U87 cells to induce neo-angiogenesis in vivo. Representative images illustrate the macroscopic analysis (A) and quantification of Hb content (B) of Matrigel plugs containing CM from Sh Control (CTR, n = 23) or Sh Caspase-8 (ShC8, n = 21) cells. The negative (Neg, n = 14) and positive (Pos, n = 20) controls contained heparin alone or heparin plus VEGF, respectively. The values of biological replicates (n) for each condition are shown as single dot, and are expressed as optical density (OD 540 nm)/g of the Matrigel plug. The Mann-Whitney test (independent samples) was used for statistical analyses. In all experiments, the volume of CM from different samples was normalized on the number of cells for each sample counted when CM was collected. (C) Comparison of the tumor size between U87 CTR and U87shC8 mouse xenografts. Quantitative analysis, by Kruskal-Wallis test with Bonferroni correction, of the volume of tumors measured at 3 and 6 weeks after cell injection. Each plot graphically shows the central location and scatter/dispersion of the values of each group: the line series in the rectangular-shaped boxes indicate the median value of the data and the end of the vertical lines indicate the minimum and the maximum data value. The means and their confidence intervals are shown in the diamond-shaped box. P-value was calculated according to the independent samples t-test. Each dot corresponds to the tumor value of one mouse. ***p<0.001. (D) The microvessel density, determined immunohistochemically by the means of an anti-CD31 antibody recognizing murine endothelial cells, evidenced the presence of a significantly higher number of vessels in CTR cells (evaluated as mean ± SD in CTR tumors) than in shC8 tumors (***p<0.001). Original magnification 40X, scale bar 50 µm.
-
Figure 1—source data 1
Caspase-8 mRNA is efficiently silenced in shC8 and shC8#2 cell lines compared to CTR cells.
Statistical analysis of quantitative real time RT-PCR Figure 1—figure supplement 1A.
- https://doi.org/10.7554/eLife.22593.004
-
Figure 1—source data 2
Caspase-8 expression promotes the ability of conditioned medium (CM) from U87 cells to induce neo-angiogenesis
Figure 1B Statistical analysis of the quantification of Hb content (Figure 1—figure supplement 2A, C). Statistical analysis of the quantification of HUVEC cells proliferation and of tubulogenesis.
- https://doi.org/10.7554/eLife.22593.005
-
Figure 1—source data 3
Caspase-8 expression promotes tumor growth in mouse xenograft experiments.
Statistical analysis of tumor growth data from U87 and U87shC8 samples.
- https://doi.org/10.7554/eLife.22593.006
-
Figure 1—source data 4
Caspase-8 expression promotes neovascularization in vivo.
Statistical analysis of vessel content analysis from immunohystochemistry experiments (Figure 1D).
- https://doi.org/10.7554/eLife.22593.007
Figure 1—figure supplement 1
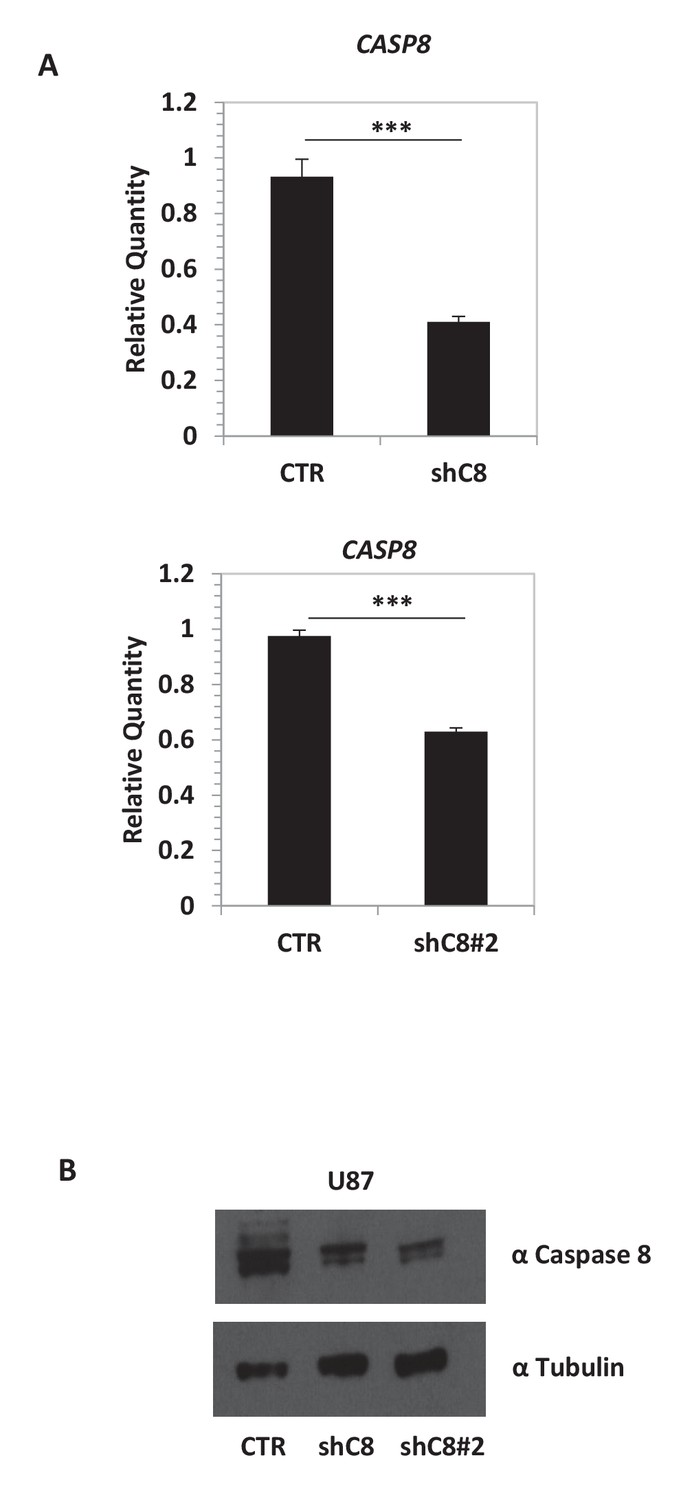
Caspase-8 mRNA and protein expression is efficiently silenced in shC8 and shC8#2 cell lines compared to CTR cells.
(A) Quantitative real-time RT-PCR for Caspase-8 mRNA on U87CTR (CTR), U87shC8 (shC8) and U87shC8#2 (shC8#2) cells. Relative qQuantities were calculated by normalizing for TBP. Representative results of a single experiment with n = 3 biological replicates, each one performed in technical duplicate are shown as mean ± SD (***p<0.001). Three independent experiments were consistent. (B) Detection of Caspase-8 protein expression by western blot analysis of whole lysates of CTR, shC8 and shC8#2 cell lines.
Figure 1—figure supplement 2

Caspase-8 expression promotes the ability of conditioned medium from U87 cells to induce endothelial cells proliferation and Capillary Tube-Like Network Formation.
(A) HUVEC proliferation evaluated after exposure for 72 hr to CM from Sh Control (CTR) or Sh Caspase-8 (ShC8) cells. Endothelial cells incubated in serum free medium (neg) or complete medium (pos) were used as negative or positive control, respectively. The results represent the mean ± SD. Error bars represent a SD between two independent experiments, each of them performed in six replicates. Student’s t test was used for statistical analyses. (B) Representative images of Capillary Tube-Like Network Formation Assay and quantification of sprouts formation, estimated by measuring the cumulative length of the sprouts (C), on Matrigel. Bar scale: 100 μm. Endothelial cells incubated in serum free medium (neg) or complete medium (pos) were used as negative or positive control, respectively. The values were expressed as mean of cumulative length of the sprouts ± SD. Error bars represent a SD among biological duplicates, with at least four technical replicates each, of a representative experiment. Student’s t test was used for statistical analyses. In all experiments, the volume of CM from different samples was normalized on the number on cells for each sample counted when CM was collected.
Figure 2 with 2 supplements
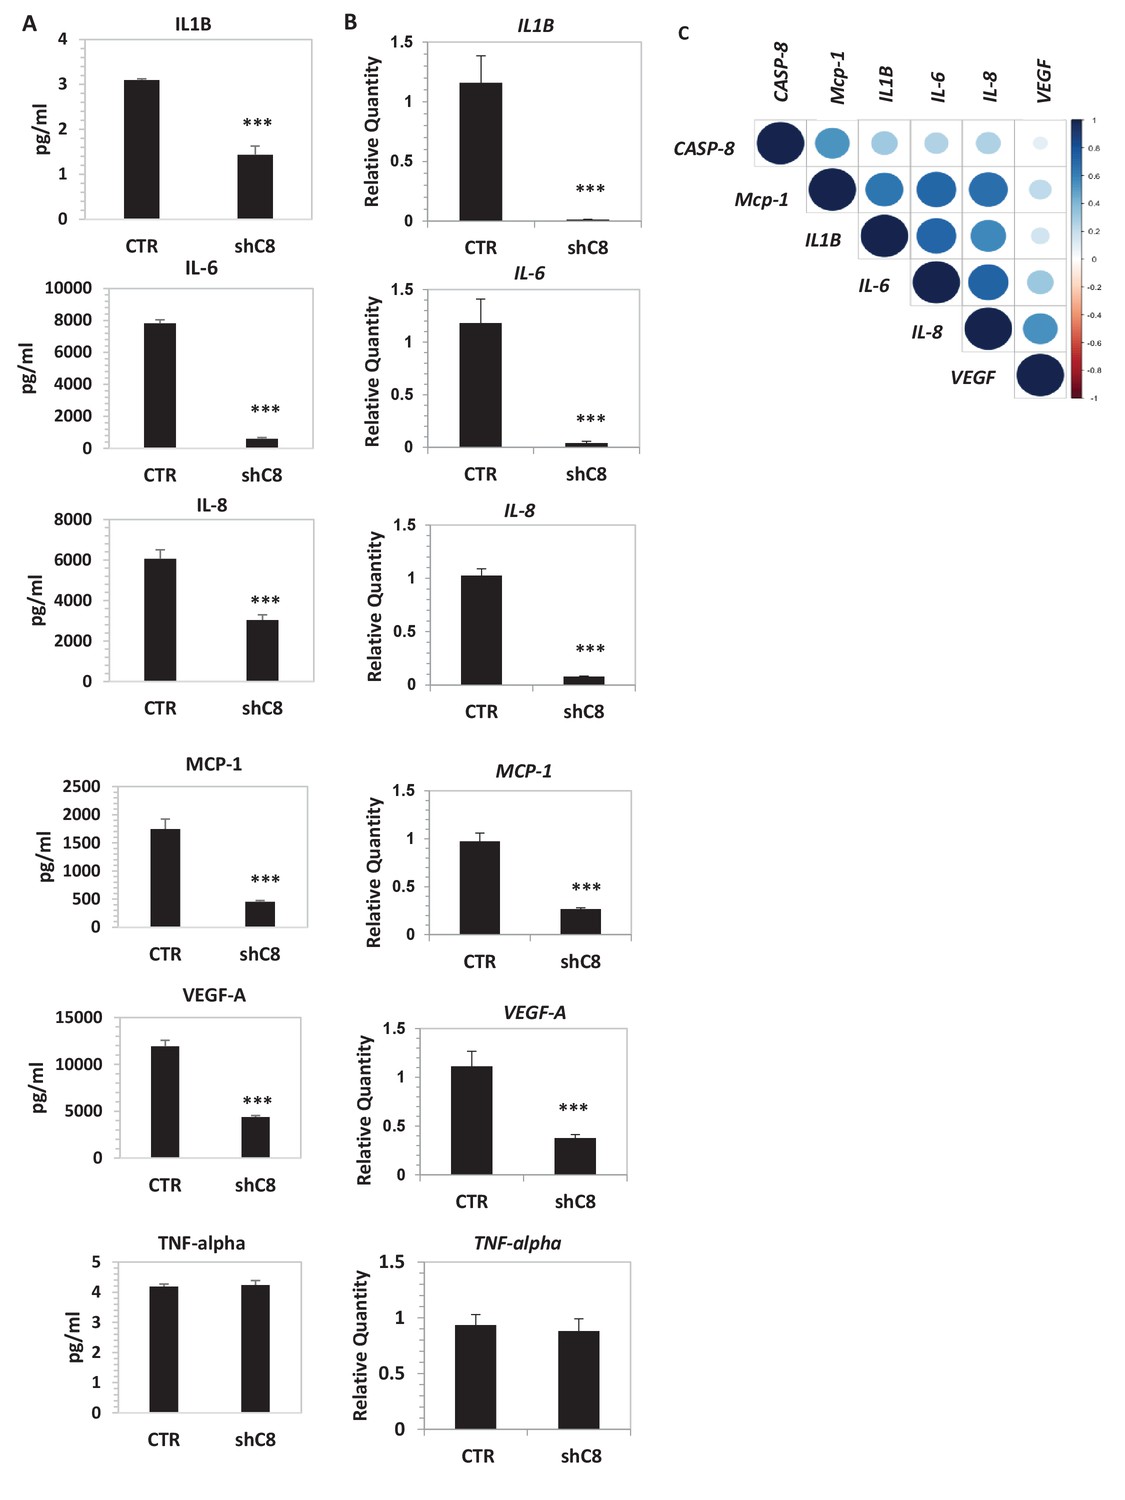
Caspase-8 promotes the expression and secretion of cytokines and growth factors.
(A) Concentrations (pg/ml) of IL-1β, IL-6, IL-8, MCP-1 (CCL-2), VEGF-A and TNF-α were measured by Luminex assay, in the supernatants of U87 cells upon stable genetic silencing of Caspase-8 expression (Sh C8) or not (ShCTR, named CTR). Data were plotted as mean ± SD and statistical significance was estimated by Unpaired T-test, ***p<0.001. Error bars represent a SD between three independent experiments, each of them performed in technical duplicate. In all experiments, the volume of CM from different samples was normalized on the number of cells for each sample counted when CM was collected. (B) Quantitative real time RT-PCR on U87CTR cells and U87shC8 cells. Relative quantities were calculated normalizing for TBP. Representative results of a single experiment with n = 3 biological replicates, each one performed in technical duplicate, are shown as mean ± SD (***p-value<0.001). Three independent experiments were consistent. (C) Correlation between Caspase-8 and IL-6, IL-8, IL1β, MCP-1 and VEGF expression in human glioblastoma. Pearson correlation coefficients computed between gene expression profiles for CASP-8, IL-6, IL-8, IL1β, MCP-1 and VEGF, in 174 glioblastoma RNA-Seq samples retrieved from the Cancer Genome Atlas. The correlation coefficient between expression profiles is proportional to the circle radii in the matrix, and additionally color-coded using the color scale reported to the right of the matrix. The plot was generated using the /corrplot/ R package (https://cran.r-project.org/web/packages/corrplot).
-
Figure 2—source data 1
Caspase-8 promotes the secretion of cytokines and growth factors.
Statistical analysis of Luminex Experiments (Figure 2A).
- https://doi.org/10.7554/eLife.22593.011
-
Figure 2—source data 2
Caspase-8 promotes mRNA expression of cytokines and growth factors.
Statistical analysis of quantitative real time RT-PCR Figure 2B and Figure 2—figure supplement 1A and B.
- https://doi.org/10.7554/eLife.22593.012
-
Figure 2—source data 3
Data collection for the analysis of the correlation between Caspase-8 and IL-6, IL-8, IL1β, MCP-1 and VEGF expression in human glioblastoma, Figure 2C.
- https://doi.org/10.7554/eLife.22593.013
-
Figure 2—source data 4
Correlation between Caspase-8 and IL-6, IL-8, IL1β, MCP-1 and VEGF expression in human glioblastoma.
The Pearson correlation coefficients and corresponding p-values between Caspase-8 expression and those of the different cytokine and growth factor genes are displayed.
- https://doi.org/10.7554/eLife.22593.014
Figure 2—figure supplement 1
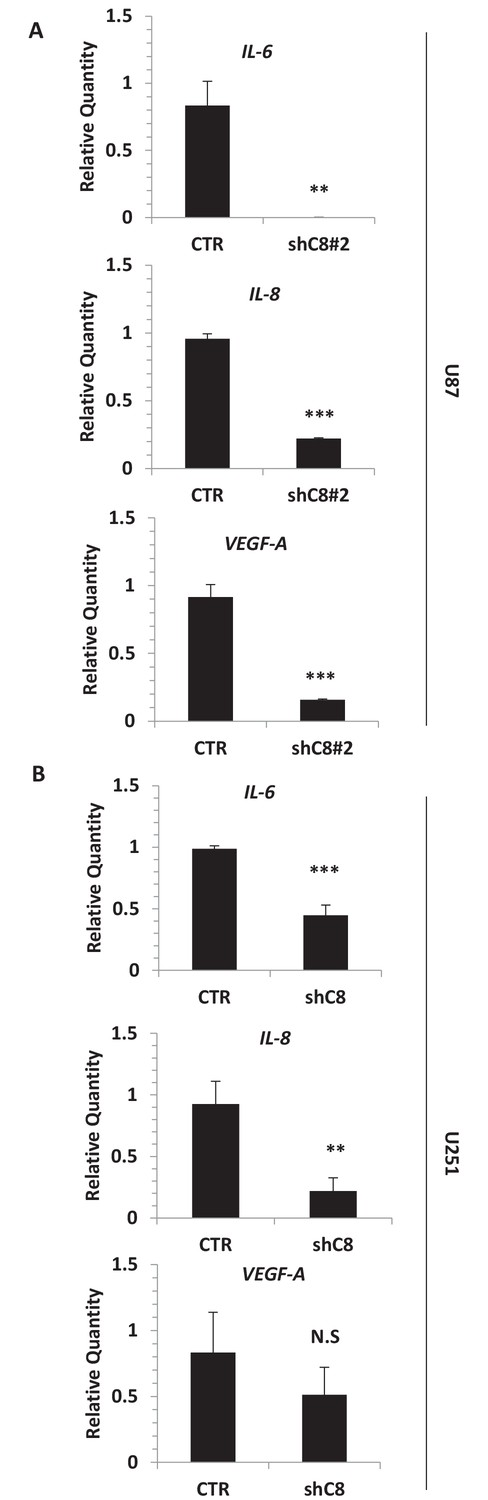
Silencing of Caspase-8 triggers the downregulation of IL-6, IL-8 and VEGF mRNA expression.
(A) Quantitative real time RT-PCR for IL-6, IL-8 and VEGF mRNAs in U87 CTR and U87 ShC8#2. (B) Quantitative real time RT-PCR for IL-6, IL-8 and VEGF mRNAs in U251 Sh control and Sh Caspase-8 (shC8) cell lines. Relatives quantities were calculated to TBP and are relative to U87 Sh CTR cells. n = 3 biological replicates, each performed in technical duplicate ***p-value<0.001, **p-value<0.01, NS = not significant.
Figure 2—figure supplement 2
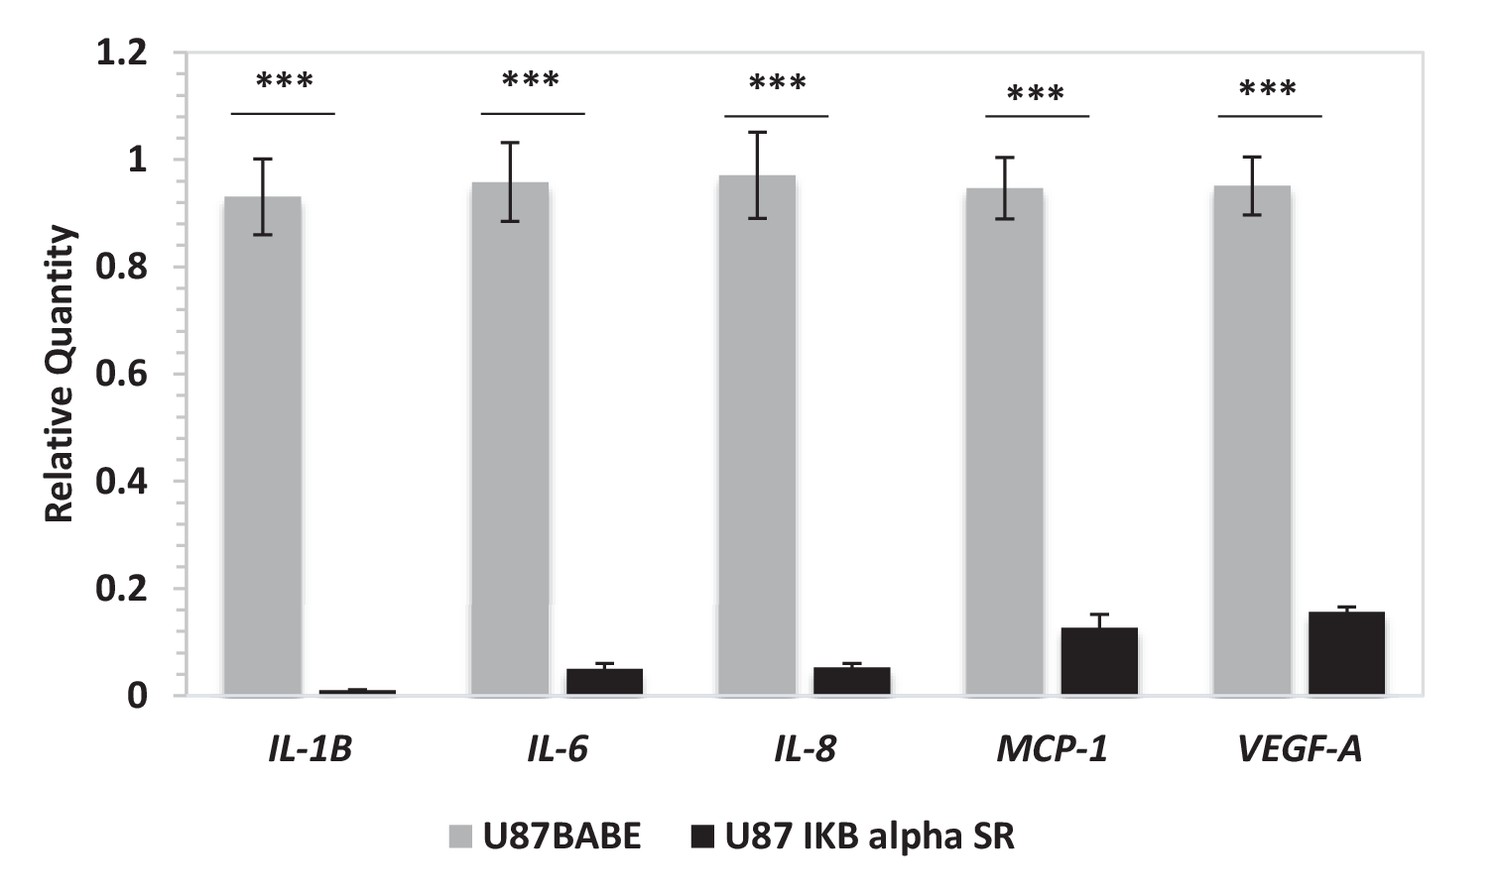
Ectopic expression of a dominant negative IKBα triggers the downregulation of IL-6, IL-8, IL-1β, MCP-1 and VEGF mRNA expression.
Quantitative real time RT-PCR on U87 stably overexpressing a dominant negative IKBalpha construct (IKB alpha SR) or not. Relative quantities were calculated by normalizing for TBP. Representative results of a single experiment with n = 3 biological replicates are shown as mean ± SD (***p-value<0.001).
Figure 3 with 1 supplement
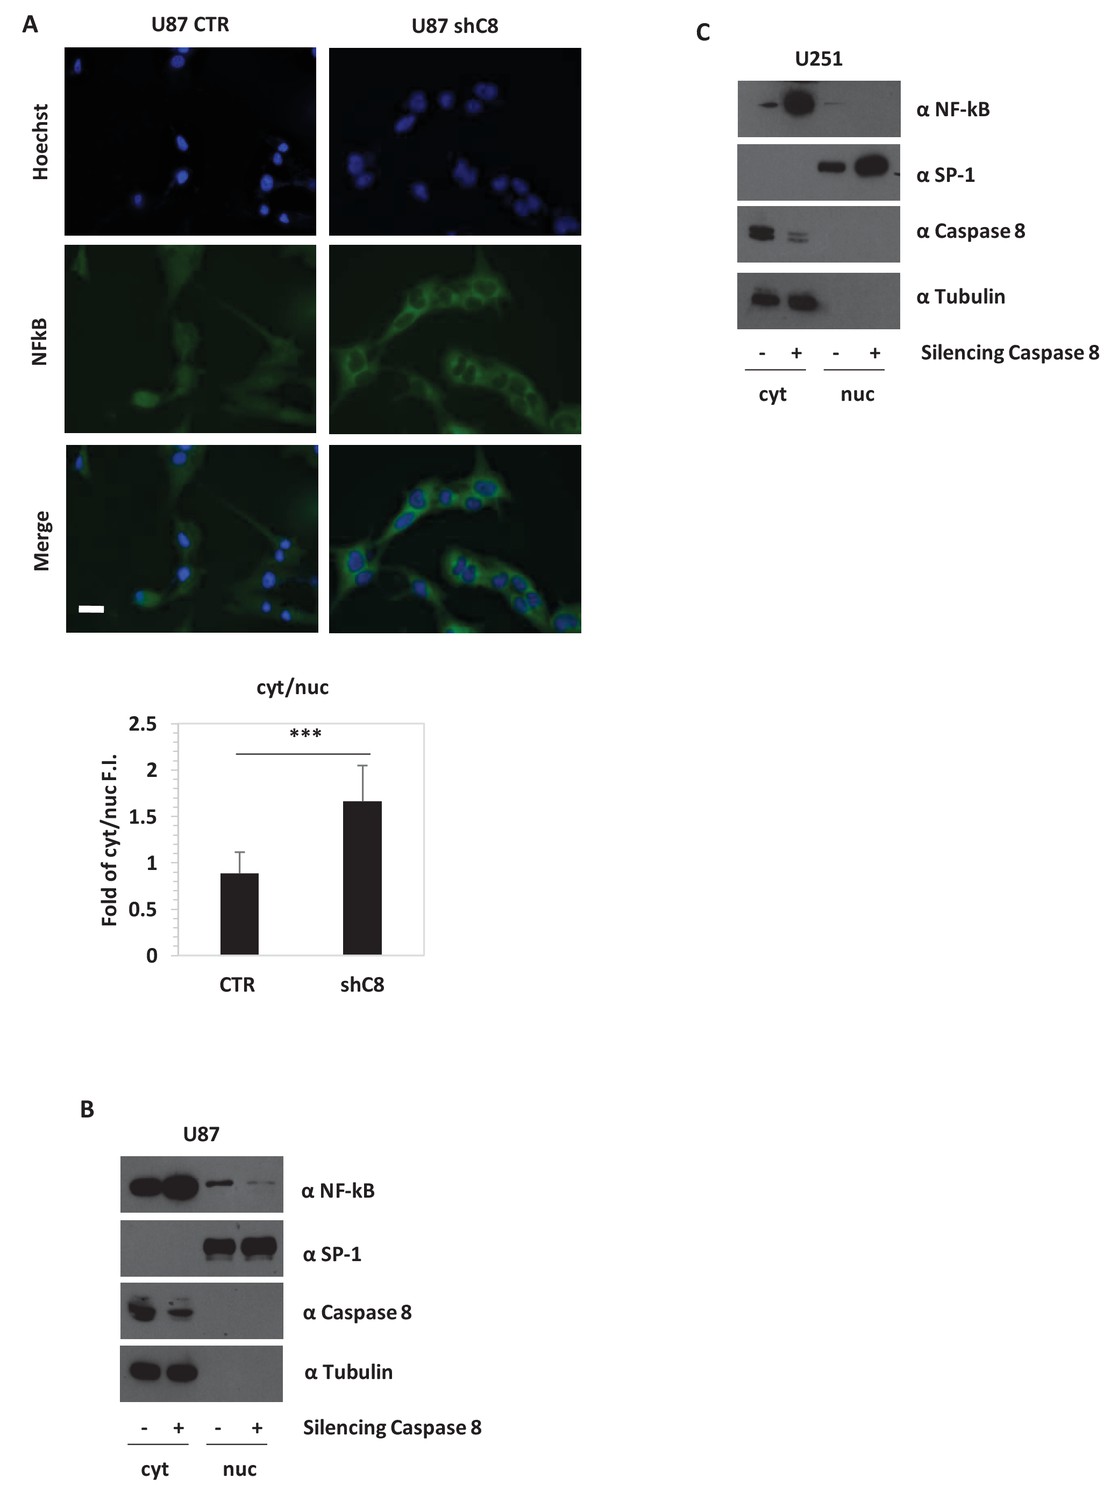
Caspase-8 expression promotes NFkB translocation into the nucleus.
(A) Immunostaining α-p65-NFkB in U87 Sh Caspase-8 and control cell lines. Bar scale: 25 μm. The bar chart represents the cytoplasmic (cyt)/nuclear (nuc) ratio of cell fluorescence intensity (FI) obtained using the Image J program. ***p-value<0.001. (B, C) Western blot analysis of fractionated cell lysates of U87 (B) and U251 (C) cell lines.
-
Figure 3—source data 1
Caspase-8 promotes NFkB nuclear localization in U87 GBM cells.
Statistical analysis of Image J Quantification of NFkB cellular localization (Figure 3A).
- https://doi.org/10.7554/eLife.22593.018
-
Figure 3—source data 2
Caspase-8 promotes IL8 and VEGFA mRNA expression in tumors derived from mouse xenograft experiments.
Statistical analysis of quantitative real time RT-PCR (Figure 3—figure supplement 1B).
- https://doi.org/10.7554/eLife.22593.019
Figure 3—figure supplement 1
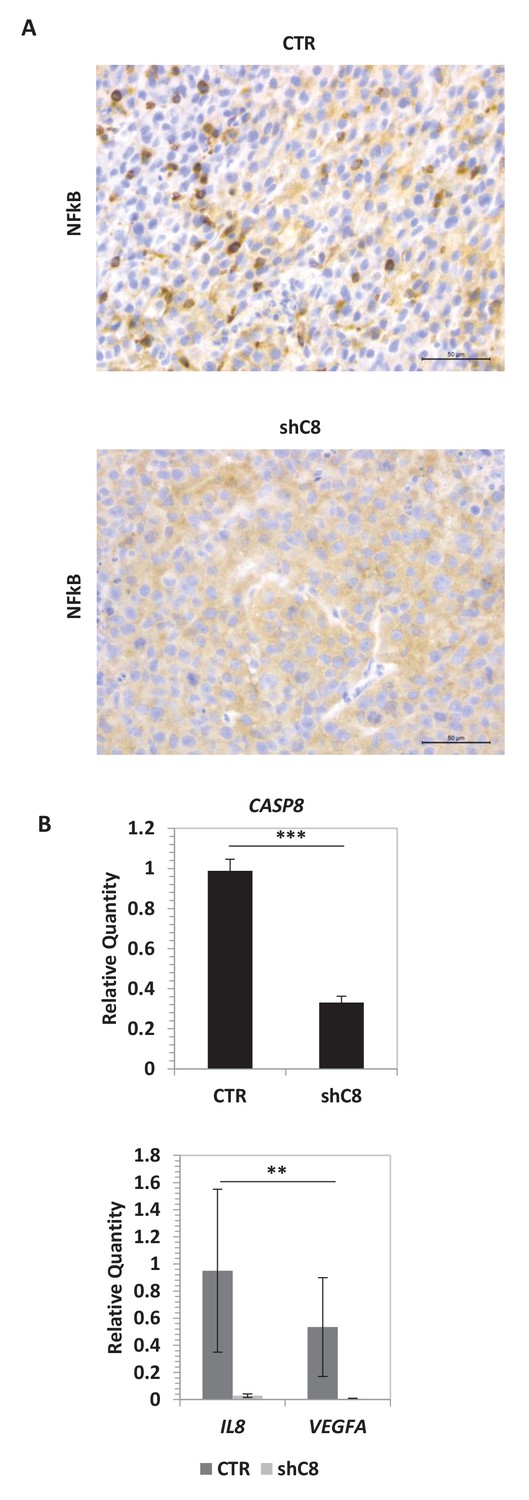
Caspase-8 expression promotes NFkB activity in vivo.
(A) NF-kB immunohistochemical expression performed in formalin-fixed paraffin-embedded tissues evidences a different distribution of NFkB in shC8 (mainly cytoplasmic) with respect to CTR (nuclear and cytoplasmic) tumor samples (original magnification 40X, scale bar 50 µm). (B) Quantitative real time RT-PCR for Caspase-8, VEGF and IL-8 mRNAs in tumor mass caused by subcutaneous injection of U87 CTR control and U87 shC8 cells. Relative quantities were normalized to TBP and calculated relative to U87 Sh CTR. n = 4 (CTR) or n = 6 (shC8) biological replicates, each performed in technical duplicate. ***p-value<0.001, **p-value<0.01.
Figure 4 with 2 supplements
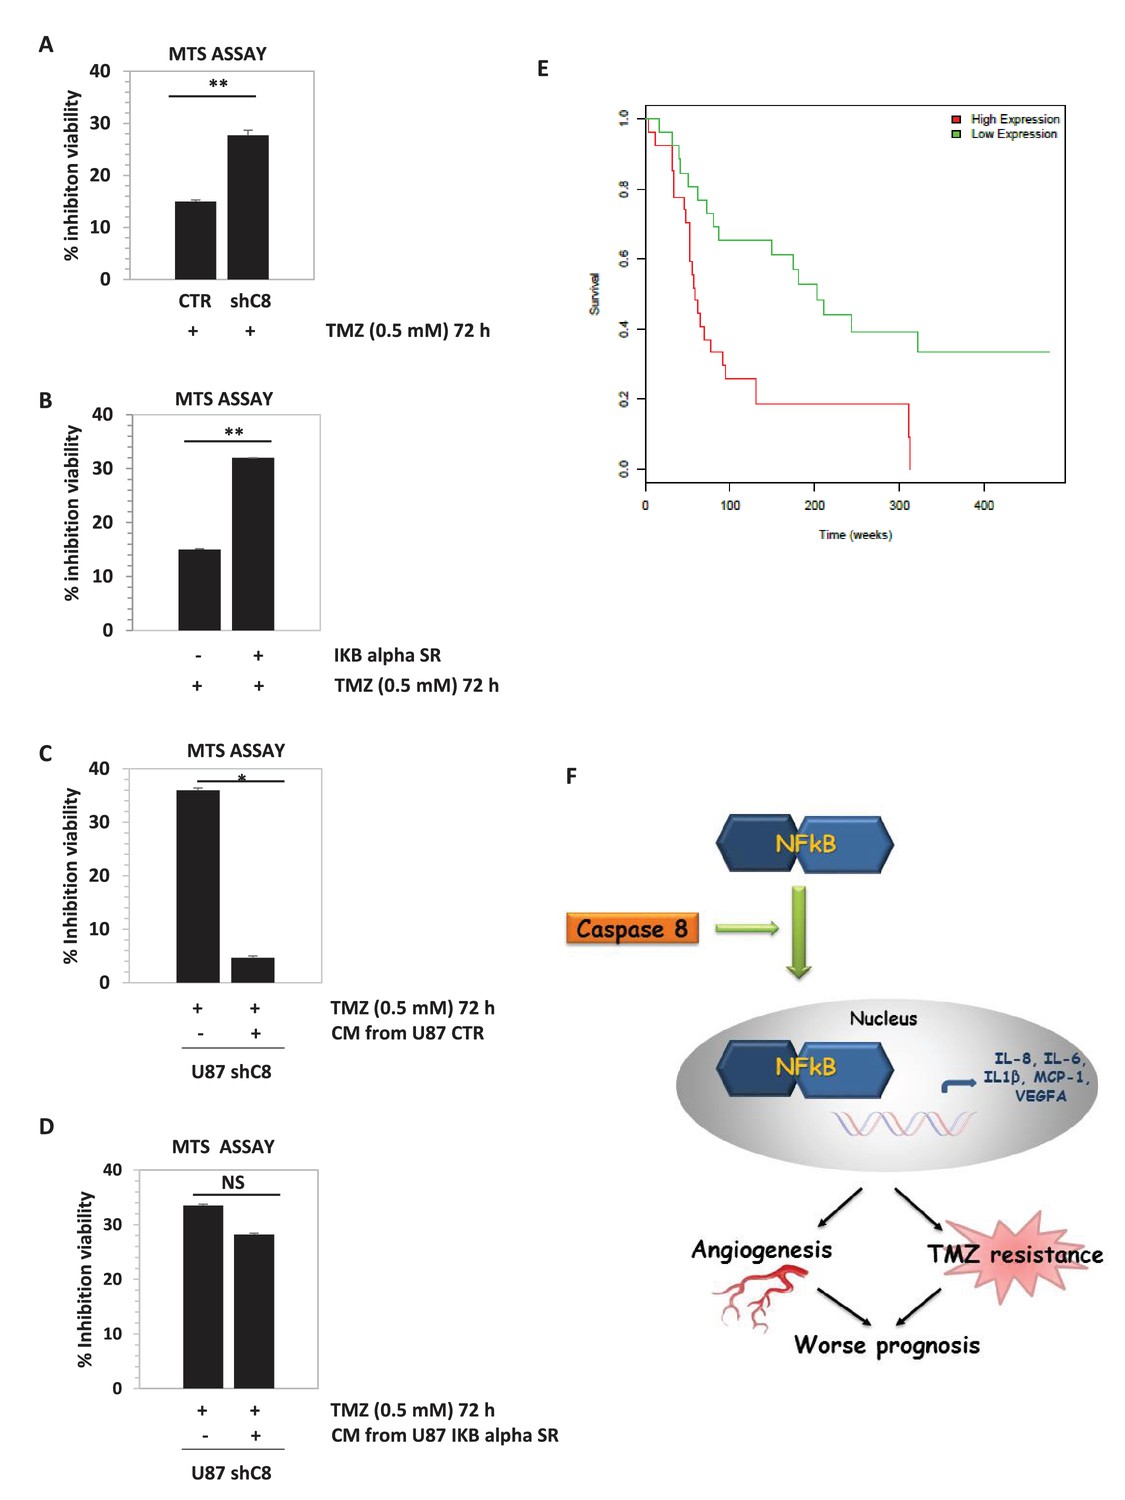
Downregulation of Caspase-8 increases sensibility to Temozolomide (TMZ).
(A, B) Viability assay represented in the histogram as mean ± SD. U87CTR control cell lines, U87shCaspase-8 and U87 IKBalphaSR, were incubated in the presence of Temozolomide (TMZ 0.5 mM for 72 hr) or not. The viability of TMZ-treated cells was assessed with the CellTiter 96 Aqueous One Solution Cell proliferation assay, and was represented as the percentage of inhibition of viability measured in cells without TMZ treatment. Data are represented in the histogram as mean ± SD. Error bars represent a SD between three (A) or two (B) independent experiments, each of them performed at least in technical triplicate. Student’s t test was used for statistical analyses. **p<0.01 (A, B). (C, D) U87shCaspase-8 were incubated or not in the presence of Temozolomide (TMZ 0.5 mM for 72 hr) dissolved in conditioned media derived from U87 ShCtr (CTR), U87 shCaspase-8 (shC8) or U87IKBa SR. Data are represented in the histogram as mean ± SD. Error bars represent a SD between two (C) or three (D) independent experiments, each of them performed in technical triplicate. Student’s t test was used for statistical analyses. *p-value<0.05 (C), NS=not significant. In all experiments shown in panel A–D, the volume of CM from different samples was normalized on the number on cells for each sample counted when the CM was collected. (E) Survival curves of high-grade glioma classified based on Caspase-8 expression levels. Glioma patients were classified as low Caspase-8 expression (green curve) and high Caspase-8 expression level (red curve), as described in the text. The Kaplan-Meier test supports a significant difference (p-value 0.00117) between the survival rates of the two groups, with patients having a low Caspase-8 expression showing a higher survival probability. (F) Proposed model depicting the link between Caspase-8 and cytokines in glioblastoma. Caspase-8 promotes NFkB nuclear localization and sustains the production of VEGF, IL-6, IL-8, IL-1β and MCP-1. This pathway promotes neoangiogenesis and triggers resistance to Temozolomide.
-
Figure 4—source data 1
Caspase-8 downregulation increases sensibility to Temozolomide (TMZ).
Statistical analysis of experiments (Figure 4A,B,C,D).
- https://doi.org/10.7554/eLife.22593.022
-
Figure 4—source data 2
Survival curves of high-grade glioma classified on the basis of Caspase-8 (CASP8) expression levels.
Data collection.
- https://doi.org/10.7554/eLife.22593.023
-
Figure 4—source data 3
Caspase-8 downregulation by two different shC8 constructs increases sensibility to Temozolomide (TMZ).
Statistical analysis of experiments (Figure 4—figure supplement 1).
- https://doi.org/10.7554/eLife.22593.024
Figure 4—figure supplement 1
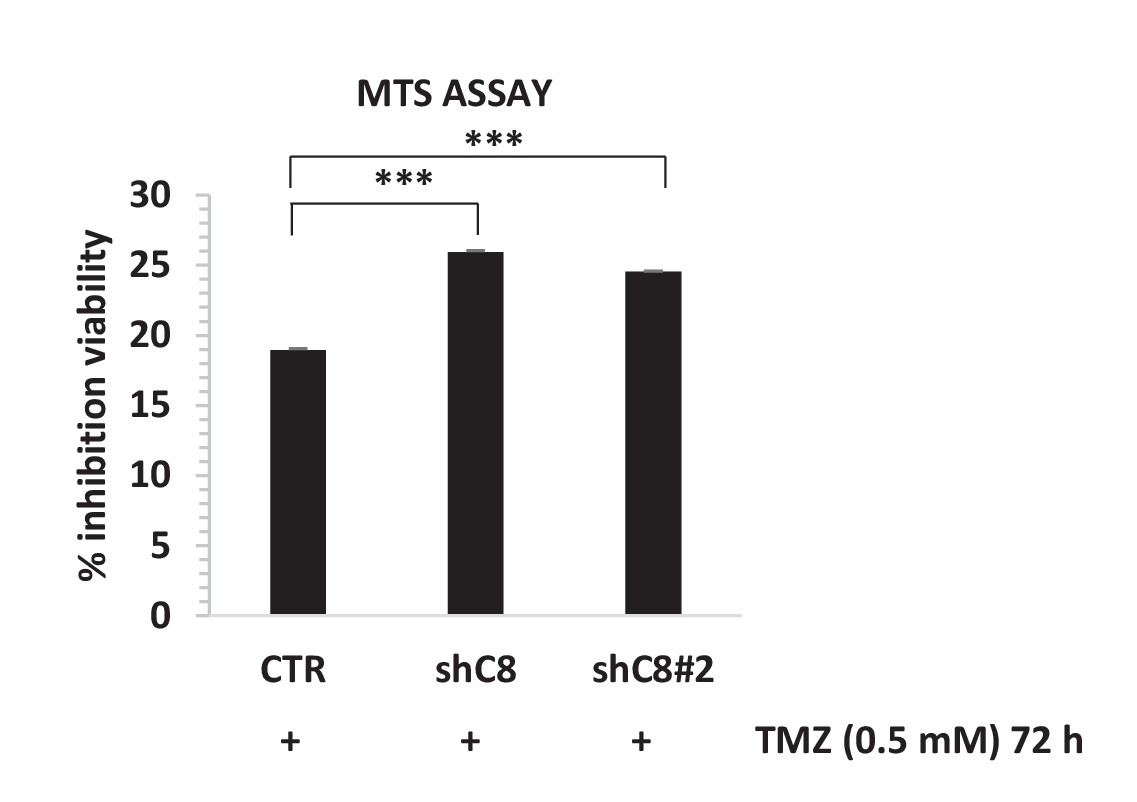
Caspase-8 downregulation by two independent interference sequences increases sensibility to Temozolomide (TMZ).
Viability assay represented in the histogram as mean ± SD. U87CTR control cells (CTR), U87shC8 (shC8) and U87shCaspase-8#2 (shC8#2) cells were incubated or not in the presence of Temozolomide (TMZ 0.5 mM for 72 hr). The viability of TMZ-treated cells was assessed with the CellTiter 96 Aqueous One Solution Cell Proliferation assay, and is represented as the percentage of inhibition of viability measured in cells treated without TMZ. Data are represented in the histogram as mean ± SD. Error bars represent SD between two independent experiments each of them performed at least in technical triplicate. Student’s t test was used for statistical analysis. ***p<0.001. In all experiments, the volume of CM from different samples was normalized on the number on cells for each sample counted when the CM was collected.
Figure 4—figure supplement 2
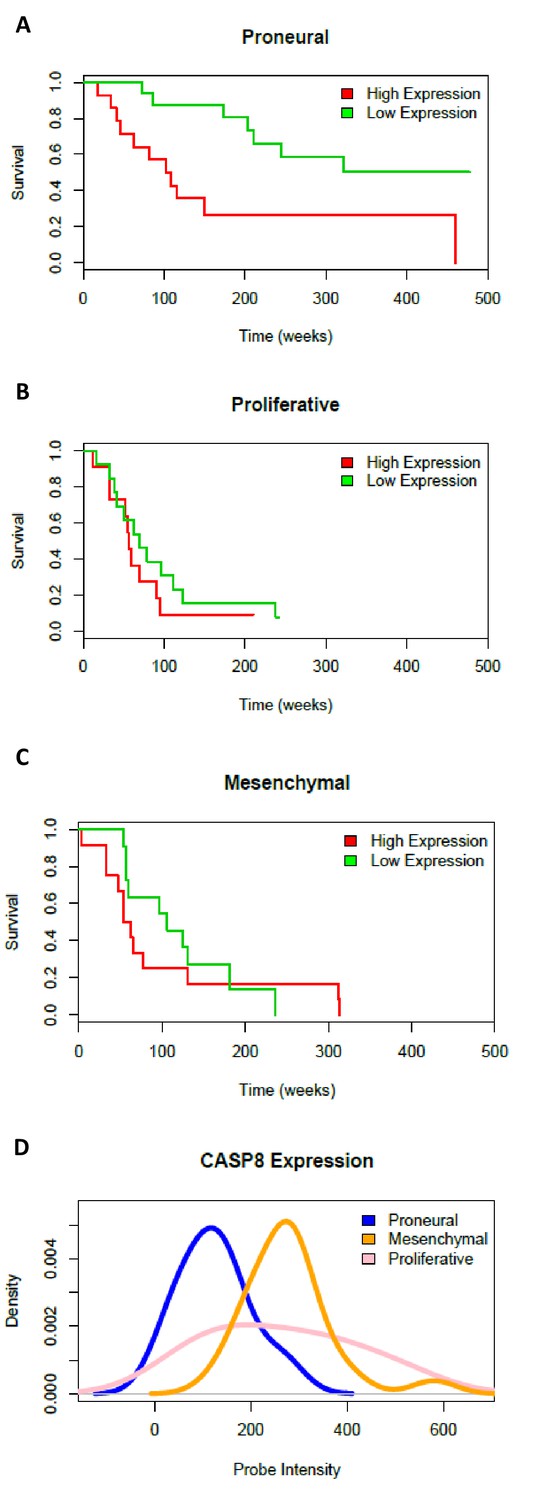
Survival curves and Caspase-8 expression levels in three GBM subtypes.
Survival of patients classified as proneural (A), proliferative (B) and mesenchymal (C) and stratified into low and high Caspase-8 expression groups on the basis of the expression distribution. (D) Caspase-8 (CASP8) expression distributions, estimated as microarray probe intensity, in samples belonging to the proneural (blue curve), mesenchymal (orange curve) and proliferative (pink curve) subtypes.
Author response image 1
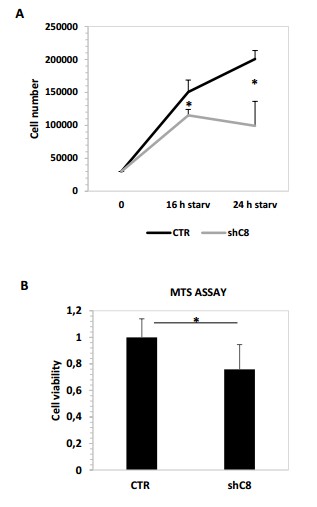
(A) Cell proliferation analysis of U87 sh CTR and U87 shC8 cell lines after starvation (16 or 24 hour) Cell number shave been counted in triplicate. Data are shown as mean ± SD. * Pvalue=0,04 (CTR/shC8 16 h starvation); *Pvalue=0,009 (CTR/shC8 24 h starvation (B) Viability assay represented in the histogram as mean ± s. U87CTR control cell lines, U87shCaspase 8 cell lines were incubated without serum (starvation) for 72 hours and viability was assessed with the CellTiter 96 Aqueous One Solution Cell Proliferation assay. Data are represented in the histogram as mean ± SD. Error bars represent a SD between technical triplicates. Student’s t test was used for statistical analysis. * P value=0,007
Author response image 2
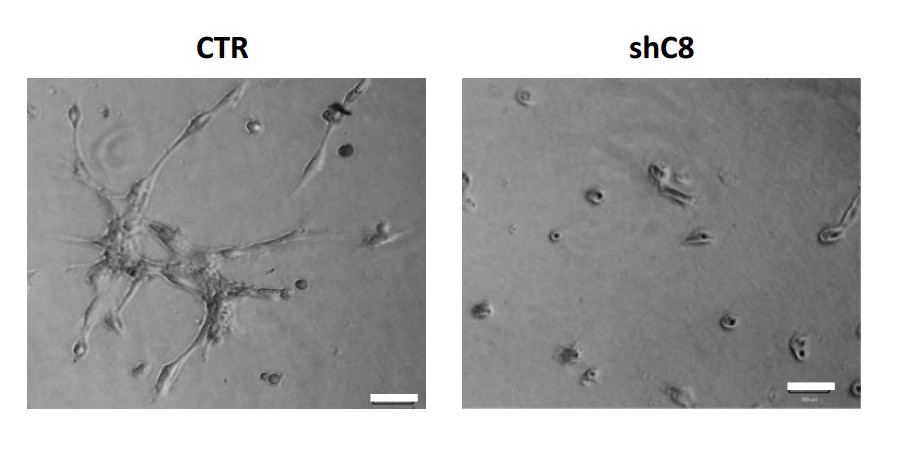
HUVEC formed tube-like structures resembling a capillary plexus when exposed to conditioned media from U87 shcontrol cells (3156 ± 1474 mean of cumulative length of the sprouts ± SD), on the contrary when HUVEC are exposed to conditioned media collected from U87 shC8#2 cells, they are poorly organized (1105 ± 1960 mean of cumulative length of the sprouts ± SD) and most of the cells are rounded.
https://doi.org/10.7554/eLife.22593.029Additional files
-
Supplementary file 1
The Cancer Genome Atlas data retrieval.
- https://doi.org/10.7554/eLife.22593.027
Download links
A two-part list of links to download the article, or parts of the article, in various formats.
Downloads (link to download the article as PDF)
Open citations (links to open the citations from this article in various online reference manager services)
Cite this article (links to download the citations from this article in formats compatible with various reference manager tools)
Caspase-8 contributes to angiogenesis and chemotherapy resistance in glioblastoma
eLife 6:e22593.
https://doi.org/10.7554/eLife.22593


