A metabolic switch controls intestinal differentiation downstream of Adenomatous polyposis coli (APC)
- Oklahoma Medical Research Foundation, United States
- University of Texas Health Science Center at San Antonio, United States
- University of Utah School of Medicine, United States
Figures
Figure 1 with 1 supplement
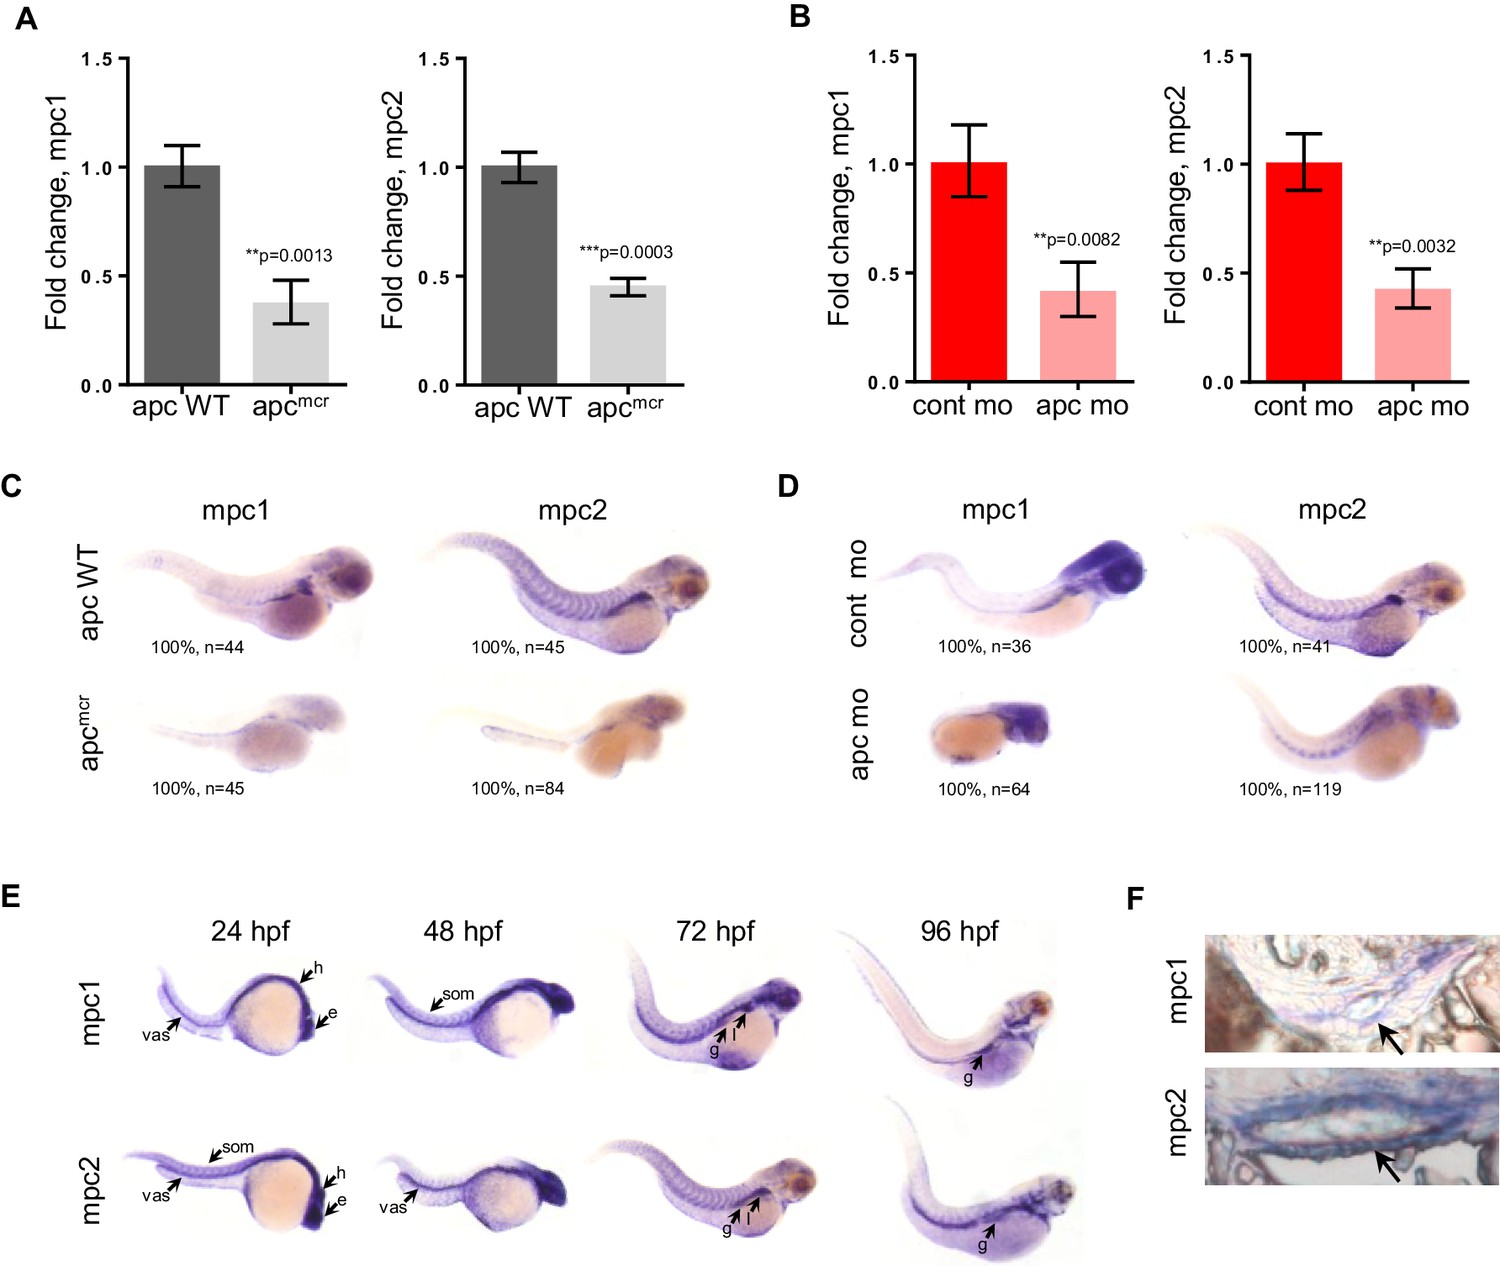
mpc1 and mpc2 are downregulated in apcmcr and apc morphant embryos.
(A,B) Quantitative RT-PCR analysis of mpc1 and mpc2 gene expression in apcmcr (A) and apc mo (B) embryos. Values represent mean ± SD. Graph shown above is representative of at least three independent experiments. Statistical significance was analyzed using unpaired t-test. (C,D) Whole mount in situ hybridization for mpc1 and mpc2 in 72 hpf apcmcr (C) and apc mo (D) embryos. (E) Whole mount in situ hybridization for mpc1 and mpc2 in wild type (WT) embryos. head (h), eyes (e), somite (som), vasculature (vas), gut (g), liver (l). (F) Cross sections from 96 hpf WT embryos probed with either mpc1 or mpc2 confirmed gut-specific expression of both genes. See also Figure 1—figure supplement 1.
-
Figure 1—source data 1
Fold change calculations for Figure 1A,B
- https://doi.org/10.7554/eLife.22706.004
Figure 1—figure supplement 1
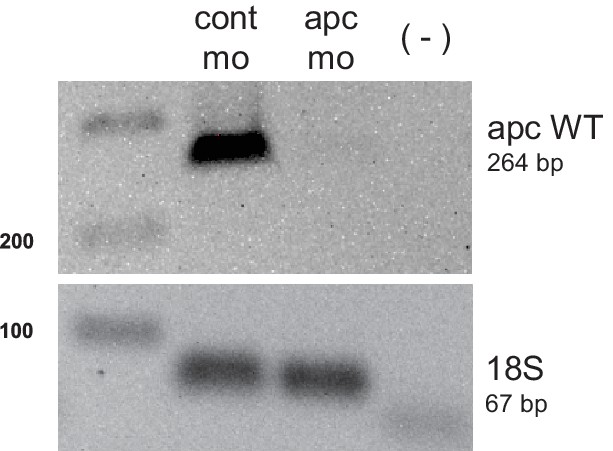
PCR analysis confirming apc knockdown.
cDNA from 48 hpf embryos injected with either control (cont mo) or apc morpholino (apc mo) was used to amplify a 264 bp band corresponding to apc WT. A negative control with no reverse transcriptase (-) was also included. Amplification of 18s served as control for input cDNA (67 bp).
Figure 2 with 2 supplements
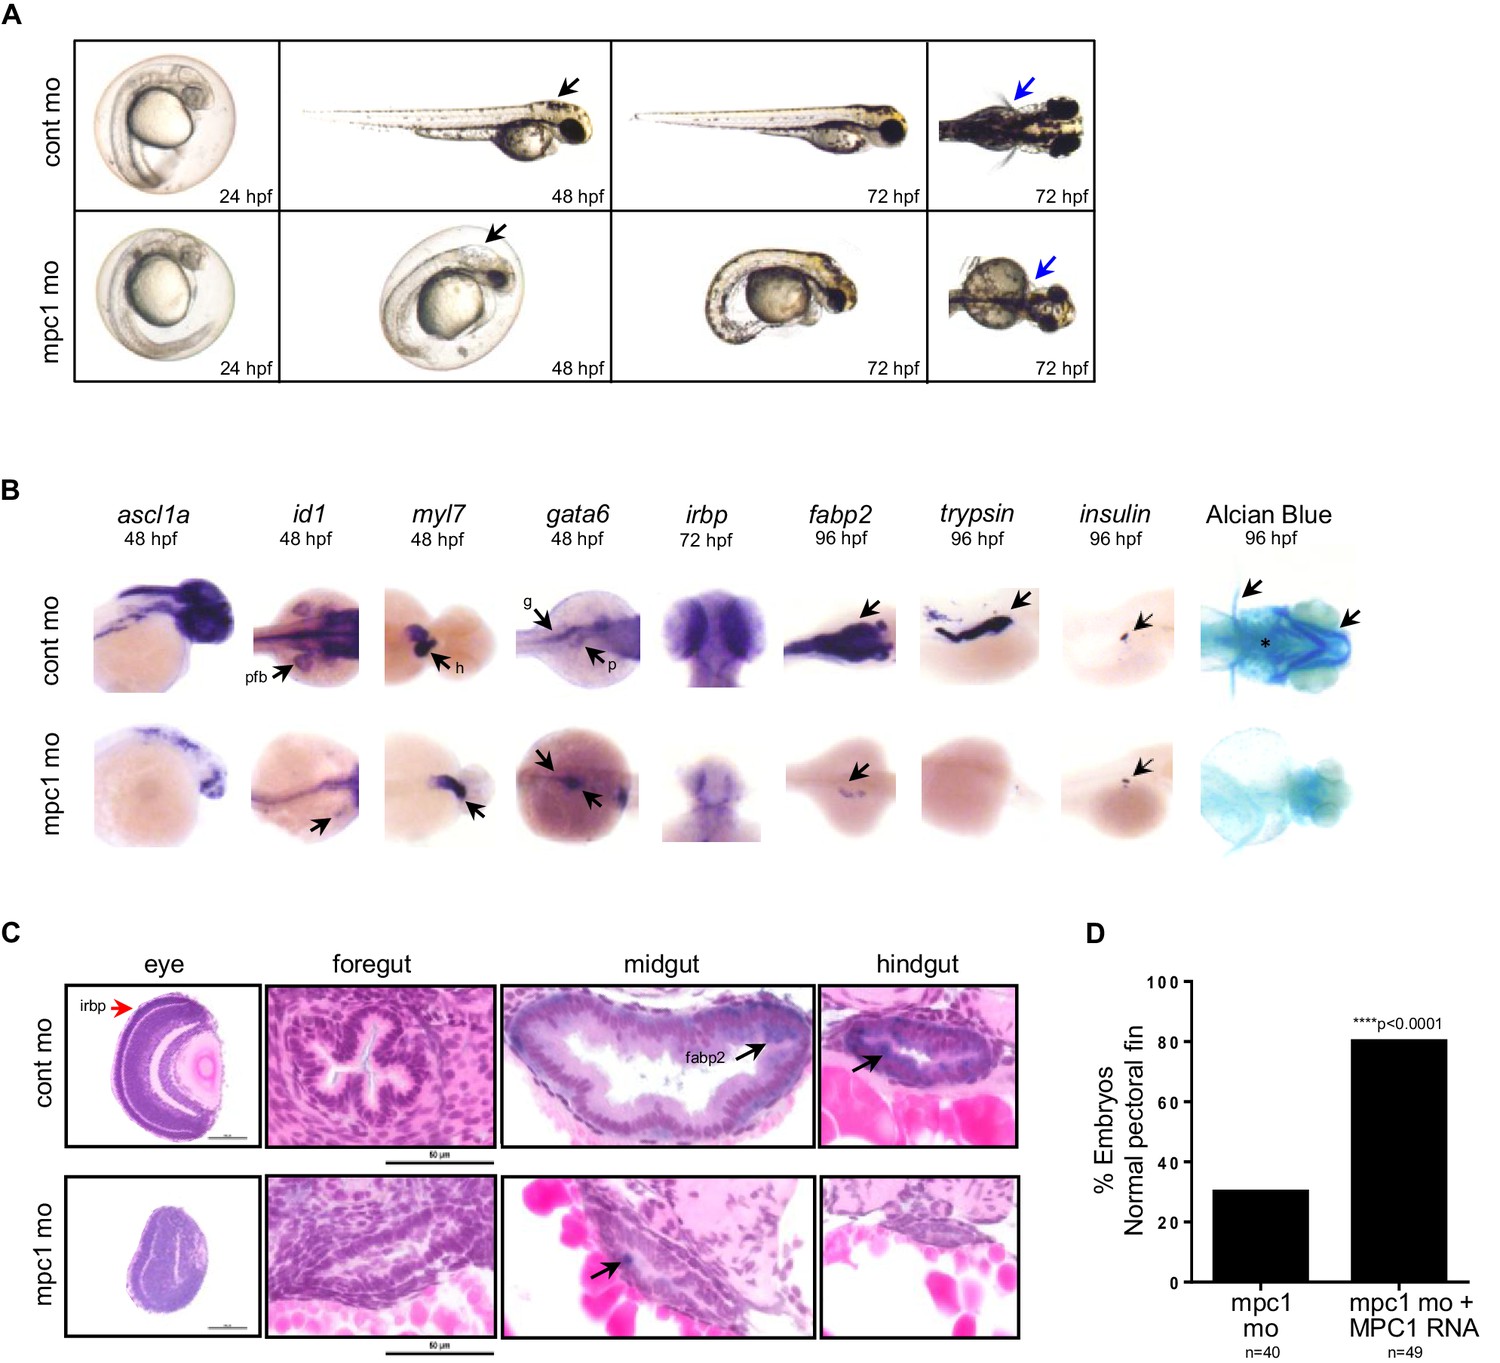
Knock down of mpc1 expression phenocopies loss of apc.
(A) Gross phenotype associated with mpc1 knock down. (B) Whole mount in situ hybridization analysis for organ-specific markers in mpc1 mo. Alcian blue staining revealed improper cartilage development (*) and confirmed loss of pectoral fins in mpc1 mo. pectoral fin bud (pfb), heart (h), gut (g), pancreas (p). (C) Cross section of the eye and gut from control or mpc1 mo. Prior to sectioning, embryos were previously stained with eye and gut-specific markers, irbp (red arrow) and fabp2 (black arrow), respectively. (D) Co-injection with human MPC1 RNA led to increased percentage of mpc1 mo with normal pectoral fins as determined by in situ staining for idi1. Statistical significance was analyzed using Fisher’s exact test. See also Figure 2—figure supplements 1, 2.
Figure 2—figure supplement 1
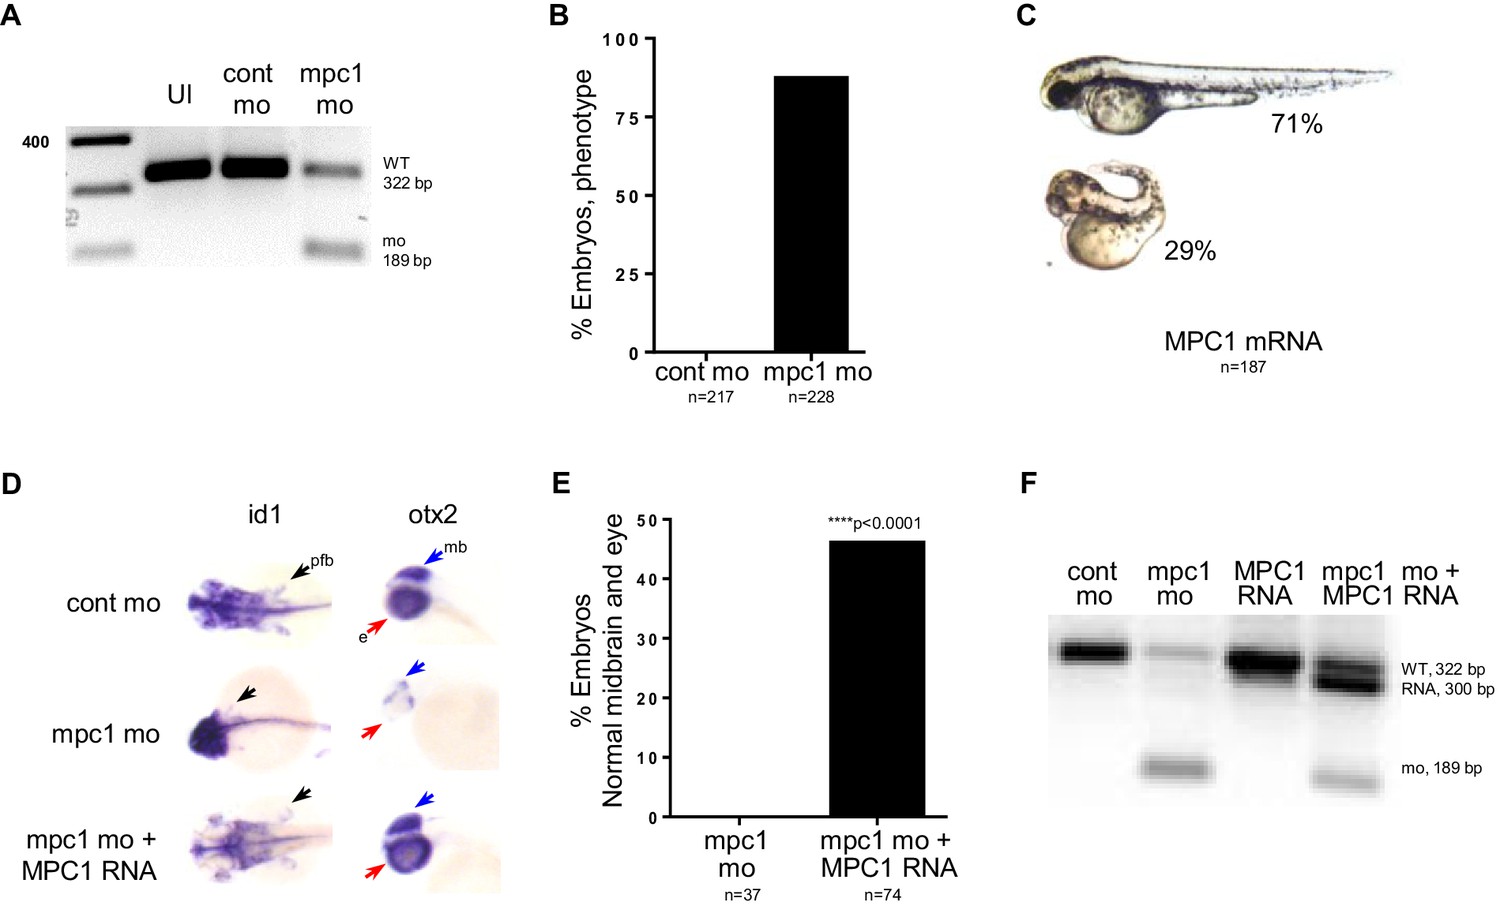
mpc1 morphant phenotype is rescued by human MPC1 RNA.
(A) PCR analysis amplifying mpc1 WT (322 bp) or morphant band (189 bp). Un-injected embryos (UI) served as a second control group. (B) Observed penetrance for mpc1 morpholino. (C) Observed phenotype for MPC1 mRNA overexpression in WT embryos. (D) Rescue of pectoral fins (pfb) and underdeveloped midbrain (mb) in 72 hpf mpc1 mo co-injected with human MPC1 RNA (mpc1 mo + MPC1 RNA) was determined by in situ hybridization for id1 and otx2, respectively. (E) Quantification of embryos with normal midbrain and eye development as measured by otx2 staining. Statistical significance was analyzed using Fisher’s exact test. (F) PCR analysis confirming presence of human MPC1 transcript (300 bp) in 48 hpf embryos.
Figure 2—figure supplement 2
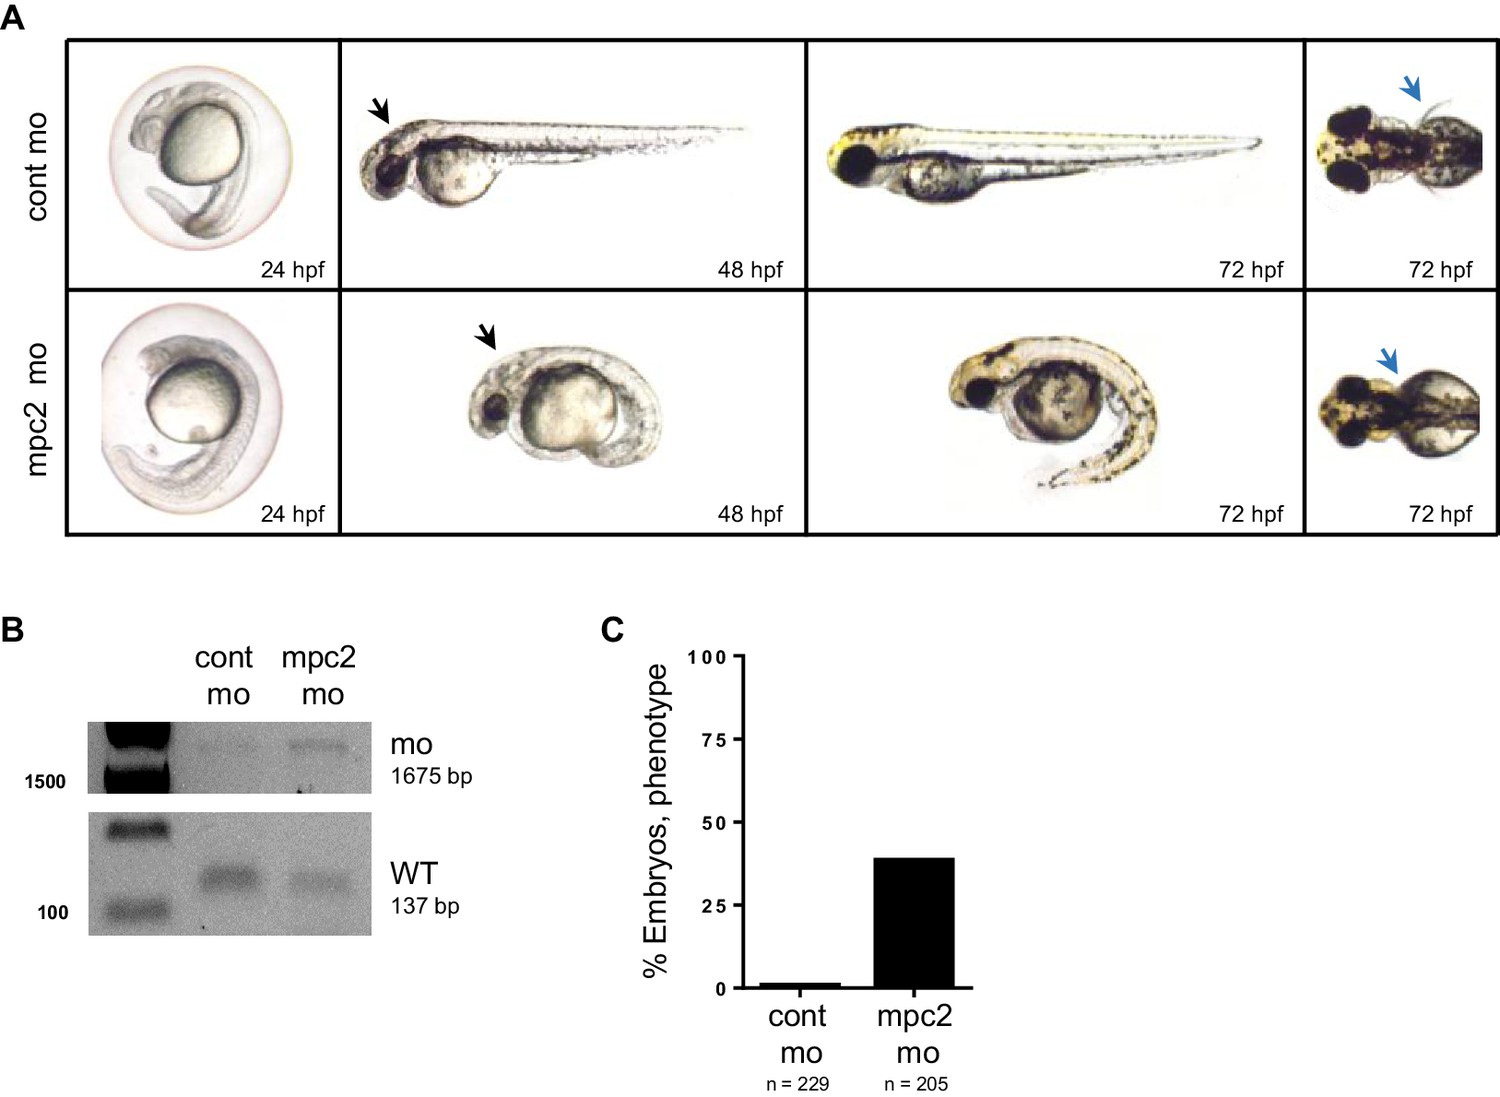
mpc2 morphants phenocopy loss of mpc1.
(A) Knockdown of mpc2 expression in WT embryos (mpc2 mo) resulted in phenotypes previously described for mpc1 morphants including enlarged hindbrain (black arrows), body deformities and absence of pectoral fins (blue arrows). (B) PCR analysis using primers specific for amplifying mpc2 WT (137 bp) or morphant band (1675 bp) confirmed knockdown of mpc2 expression in 48 hpf embryos. (C) Observed penetrance for mpc2 morpholino.
Figure 3
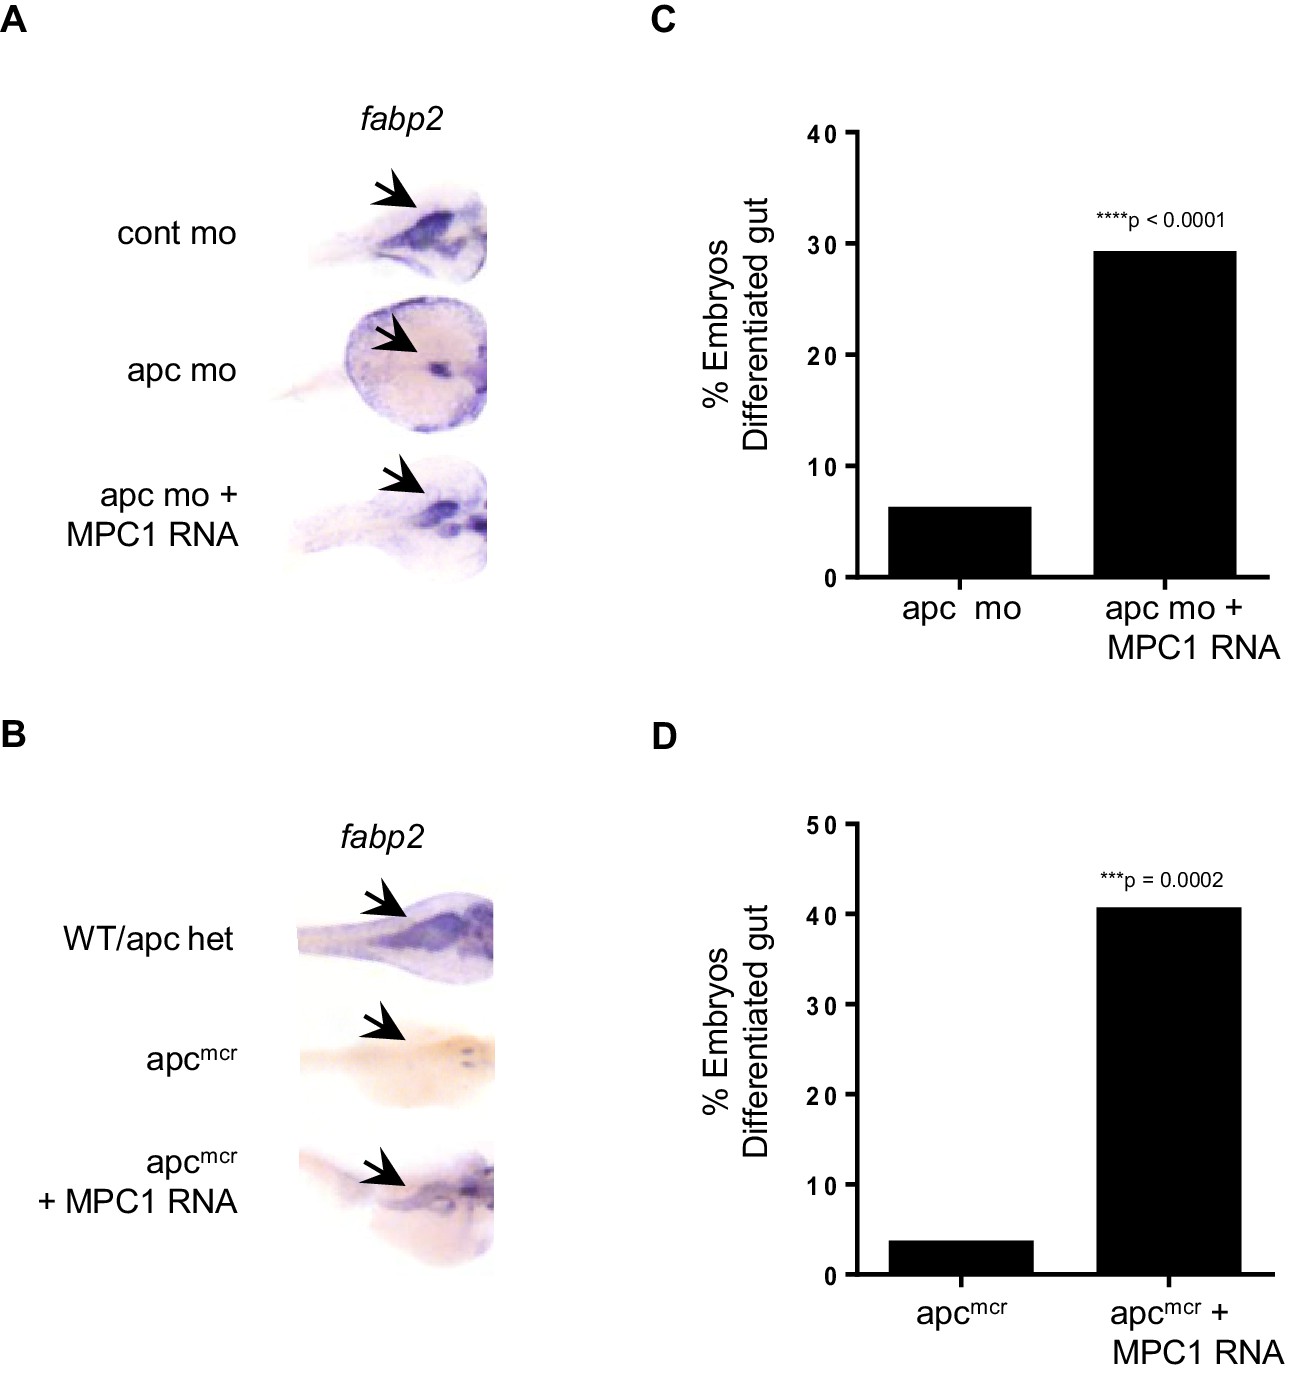
MPC1 rescues gut phenotype of apc mo and apcmcr.
(A,B) In situ hybridization for fabp2, in 72 hpf WT embryos injected with cont mo, apc mo or both apc mo and human MPC1 RNA (apc mo + MPC1 RNA) (A). In situ hybridization for fabp2 in 72 hpf apc WT, apcmcr or apcmcr injected with human MPC1 mRNA (apcmcr + MPC1 RNA) (B). (C,D) Quantification of injected embryos with differentiated gut as determined by fabp2 staining. Statistical significance was analyzed using Fisher’s exact test.
Figure 4 with 2 supplements
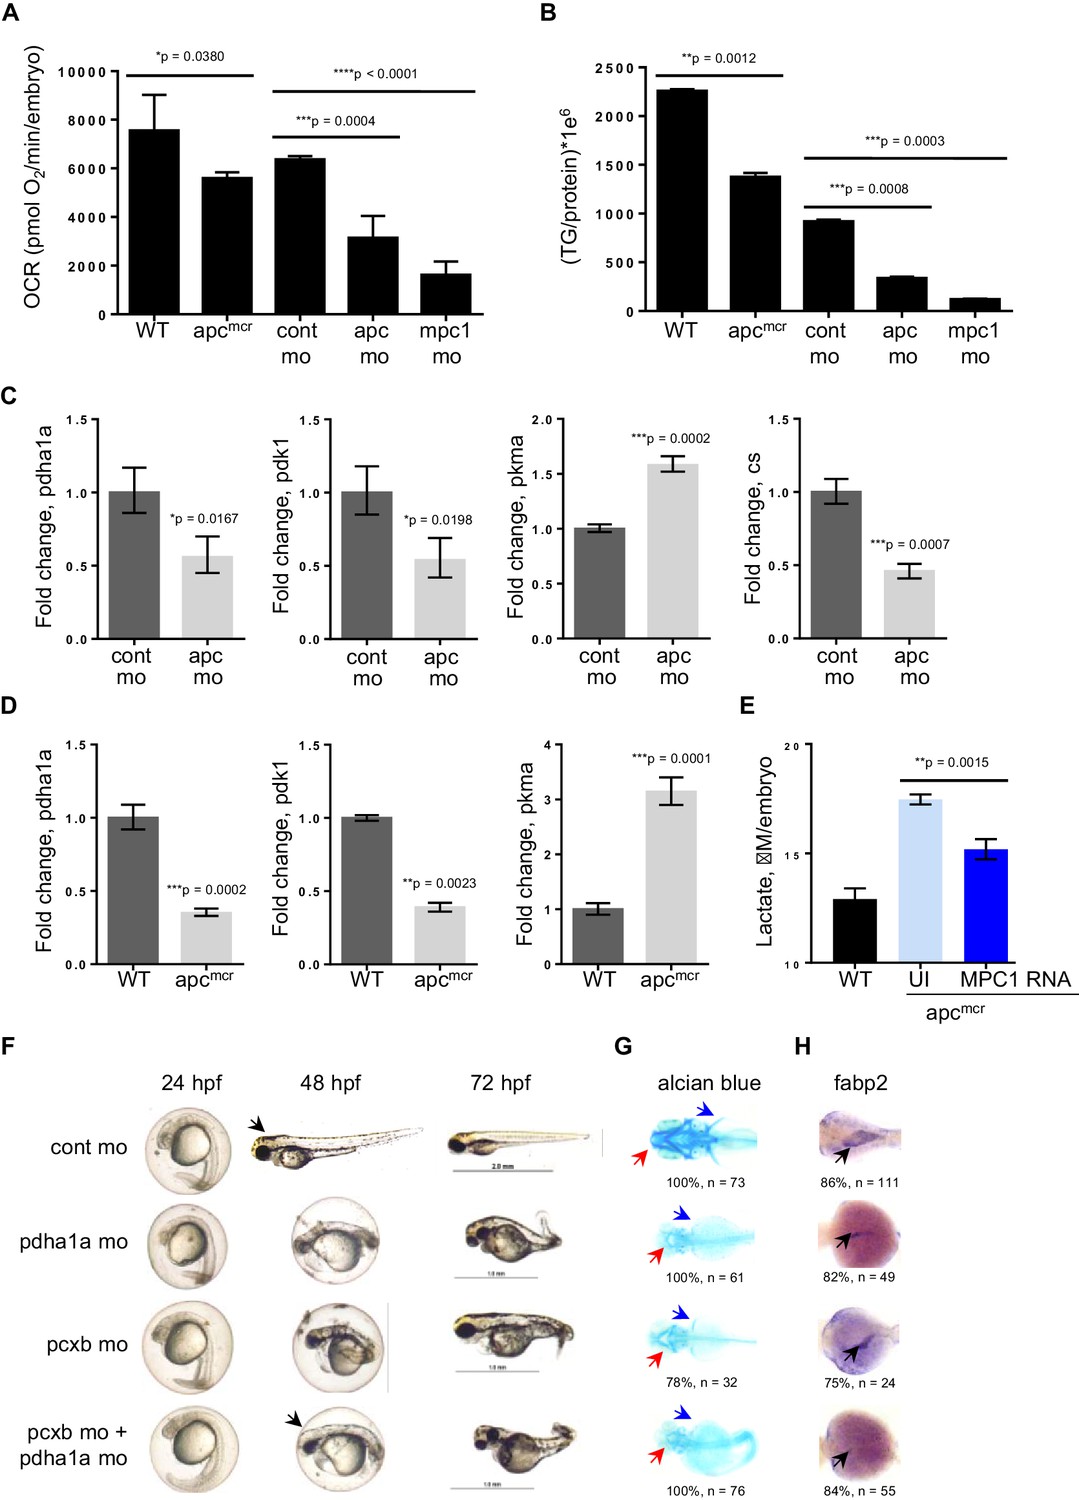
Knock down of mpc1 or apc leads to altered mitochondrial respiration and pyruvate metabolism.
(A) Mitochondrial respiration was evaluated by measuring oxygen consumption rates (OCR) in 72 hpf embryos. (B) Triglyceride (TG) levels were determined in lysates prepared from 72 hpf embryos using a colorimetric assay. (C,D) Quantitative RT-PCR analysis of enzymes involved in pyruvate metabolism in apc mo and (C) apcmcr (D) embryos. pyruvate dehydrogenase alpha 1a (pdha1a); pyruvate dehydrogenase kinase, isozyme 1 (pdk1); pyruvate kinase, muscle, a (pkma); citrate synthase (cs). (E) Lactate levels in apc wild type (WT), un-injected apcmcr (UI) or apcmcr embryos injected with human MPC1 mRNA (MPC1 RNA). For figures A–E, values represent mean ± SD. Graph shown above is representative of at least three independent experiments. Statistical significance was analyzed using unpaired t-test. (F,G,H) Gross phenotype (F), alcian blue staining (G) and in situ hybridization for fabp2 (H) in pdha1a, pcxb, and pcxb + pdha1a mo. pcxb (pyruvate carboxylase b). See also Figure 4—figure supplements 1, 2.
-
Figure 4—source data 1
Mean and standard deviation values for Figure 4A,B,E; fold change calculations for Figure 4C,D.
- https://doi.org/10.7554/eLife.22706.011
Figure 4—figure supplement 1
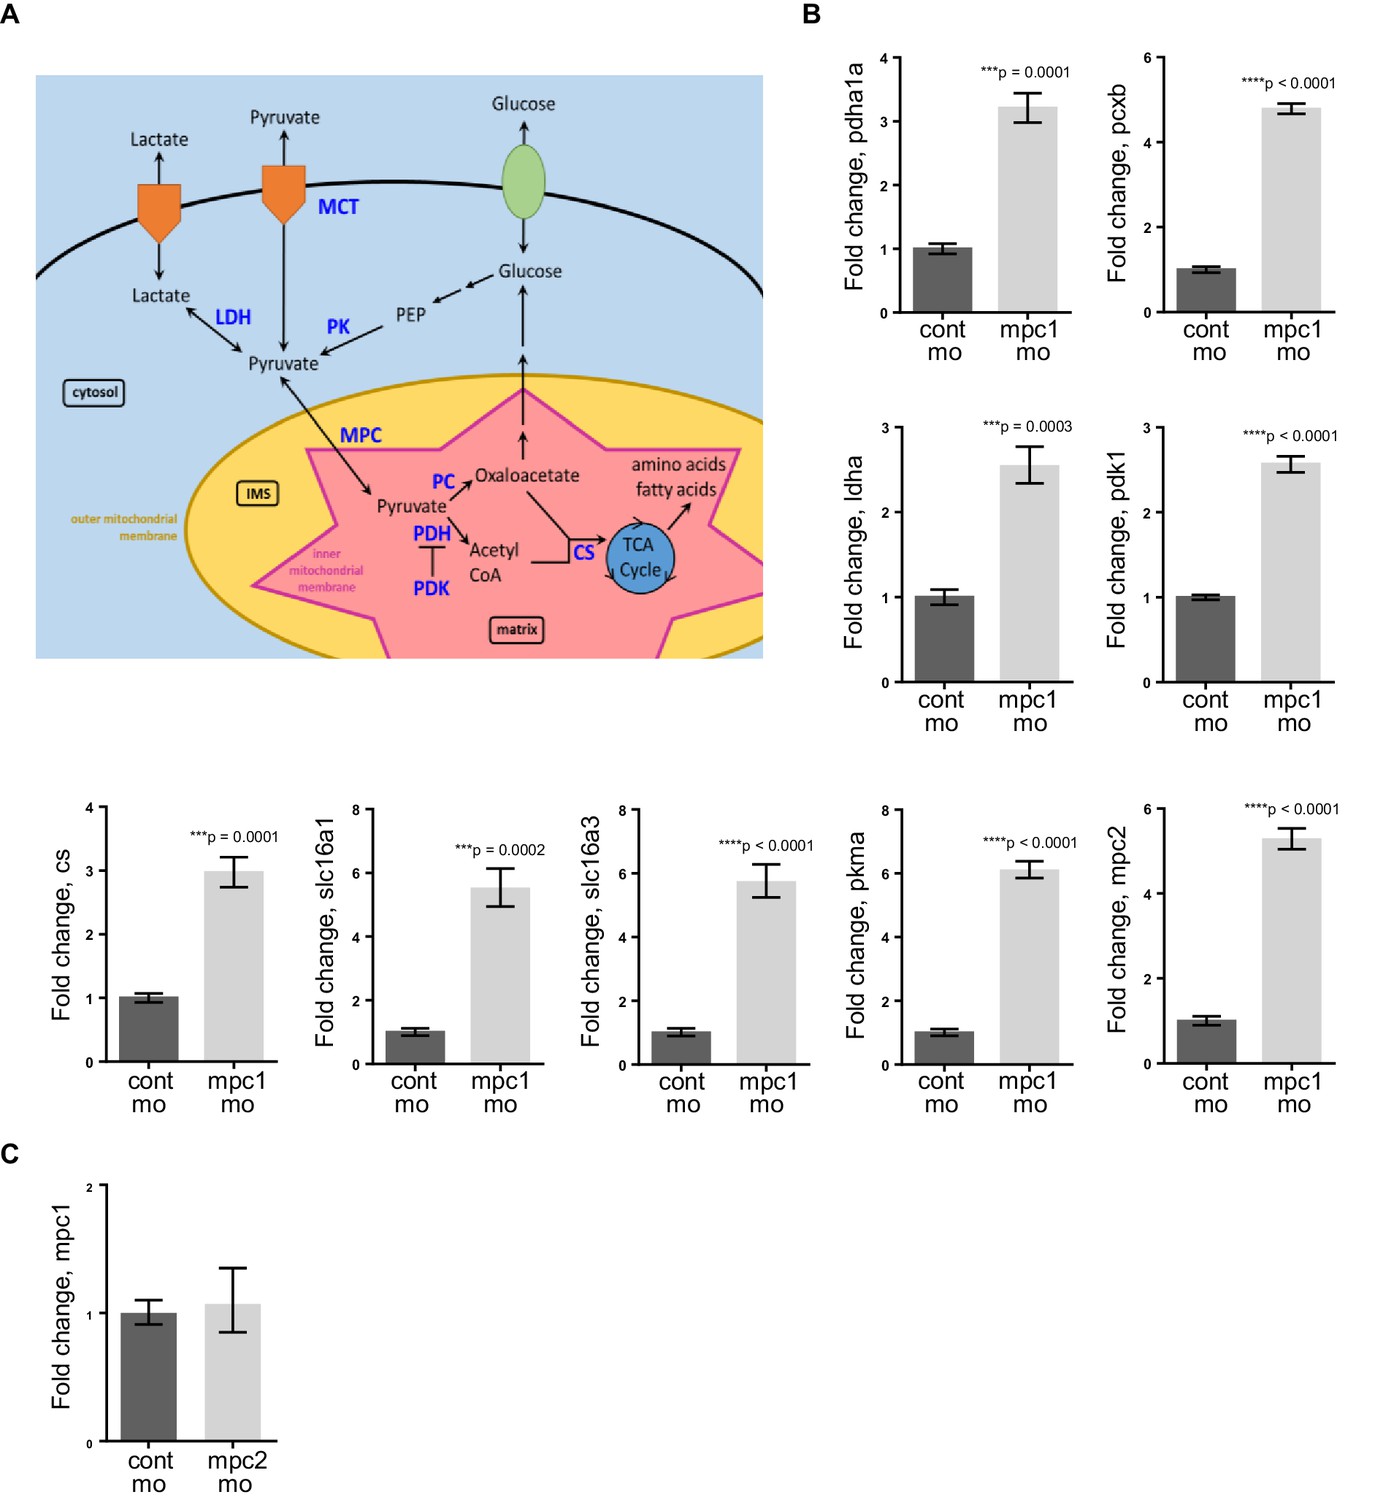
Knockdown of mpc1 leads to dysregulated pyruvate metabolism.
(A) A simplified scheme showing key enzymes (in blue) involved in pyruvate transport and metabolism (adapted from Schell and Rutter [2013]). (B) Quantitative RT-PCR analysis of pyruvate metabolism enzymes in mpc1 mo. (C) Quantitative RT-PCR analysis of mpc1 in mpc2 mo. For B–C, values represent mean ± SD. Graph shown above is representative of at least three independent experiments. Statistical significance was analyzed using unpaired t-test. pyruvate dehydrogenase alpha 1a (pdha1a); pyruvate carboxylase b (pcxb); lactate dehydrogenase A4 (ldha); pyruvate dehydrogenase kinase, isozyme 1 (pdk1); citrate synthase (cs); solute carrier family 16, member 1 (slc16a1); solute carrier family 16, member 3 (slc16a3); pyruvate kinase, muscle, a (pkma); mitochondrial pyruvate carrier 2 (mpc2).
-
Figure 4—figure supplement 1—source data 1
Fold change calculations for Figure 4—figure supplement 1B,C.
- https://doi.org/10.7554/eLife.22706.013
Figure 4—figure supplement 2
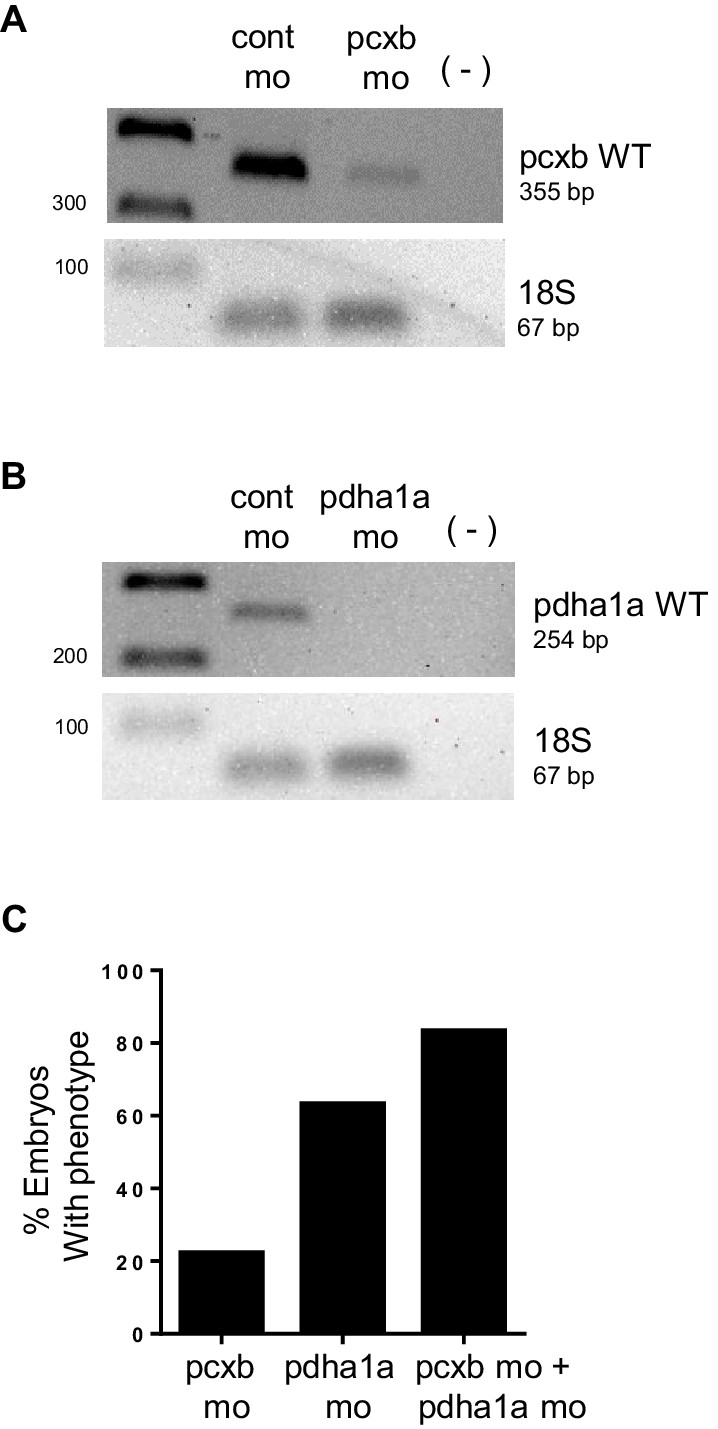
PCR analysis confirming knockdown of pdha1a, pcxb.
(A,B) cDNA from 48 hpf embryos injected with cont mo, pcxb mo or pdha1a mo was used to amplify a band corresponding to pcxb WT (355 bp) (A) or pdha1a WT (254 bp) (B). A negative control with no reverse transcriptase (-) was also included. Amplification of 18s served as control for input cDNA (67 bp). (C) Microinjection of WT embryos with pdha1a morpholino (pdha1a mo) resulted in a higher penetrance compared to pcxb morpholino (pcxb mo). Co-injection of both morpholinos gave the highest percentage of embryos with phenotype (pcxb mo + pdha1a mo).
Figure 5
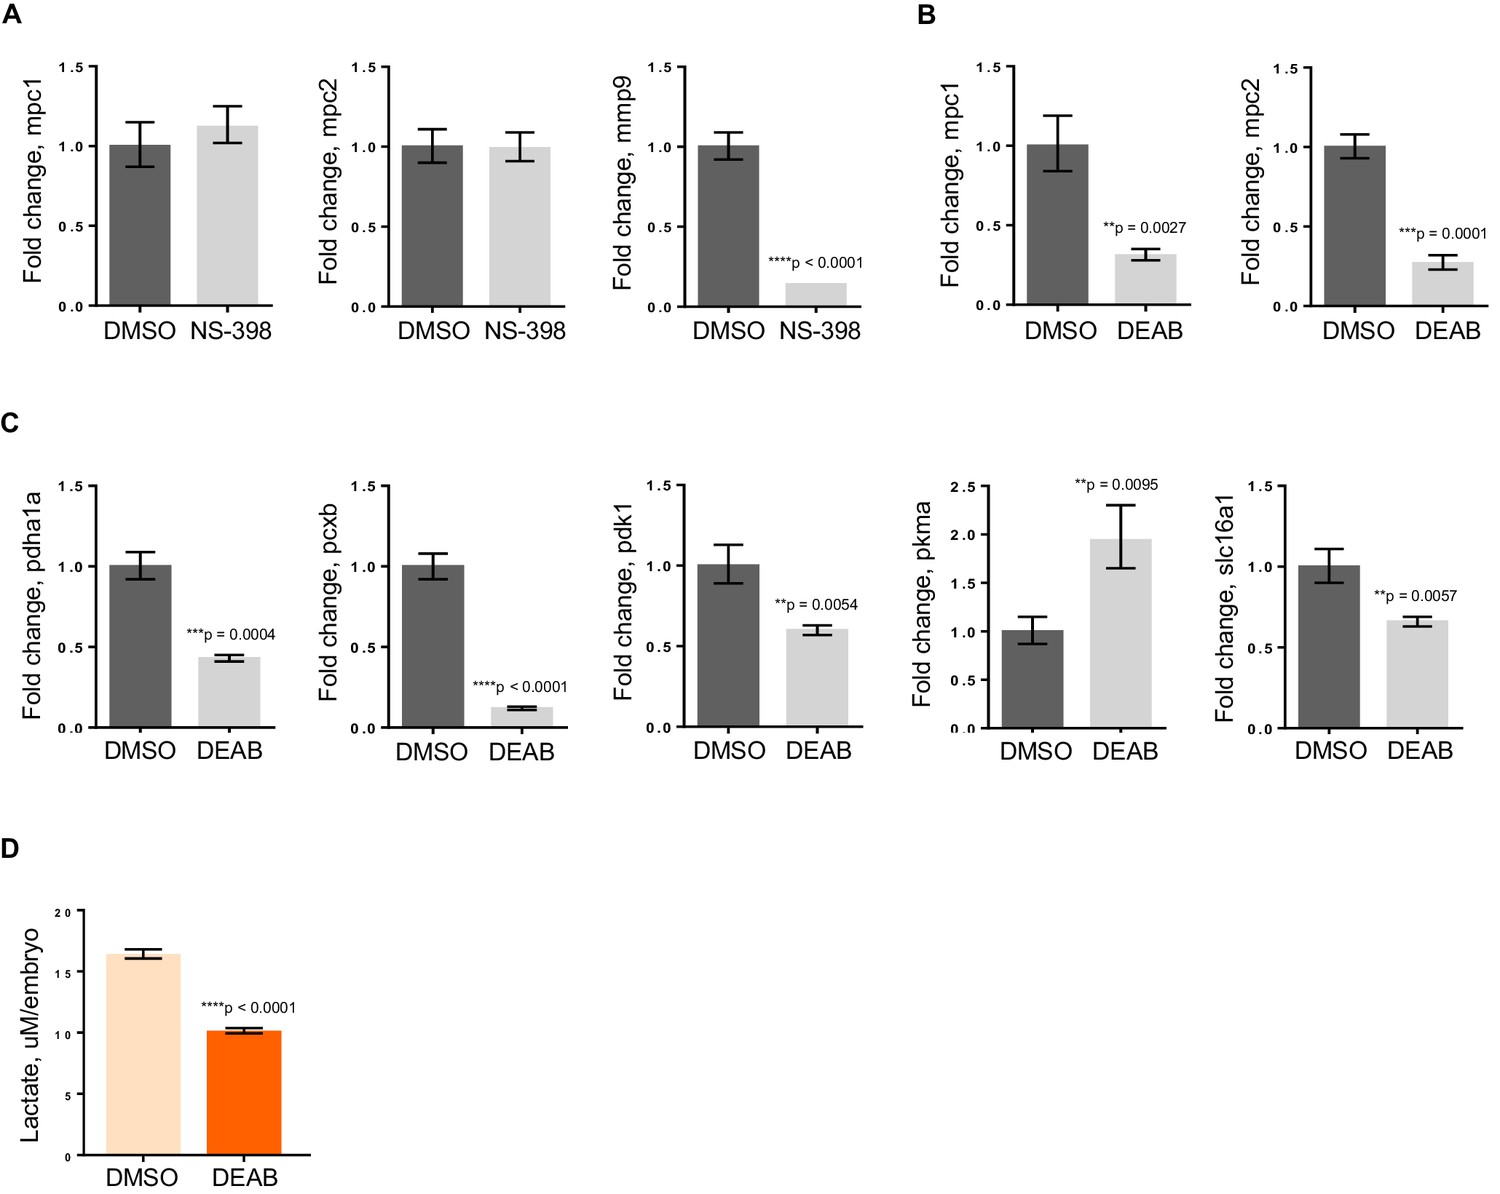
RA deficiency results in dysregulated pyruvate metabolism that is independent of Wnt pathway.
(A) apc mo treated either with DMSO control or 10 uM NS-398 were analyzed by qRT-PCR to determine expression levels of mpc1, mpc2 and mmp9. (B,C) WT embryos treated with either DMSO control or 5 uM DEAB were analyzed by qRT-PCR to determine expression levels of enzymes involved in pyruvate metabolism. (D) Lactate levels in 72 hpf WT embryos treated with either DMSO or 5 uM DEAB. For figures A–D, values represent mean ± SD. Graph shown above is representative of 3 independent experiments. Statistical significance was analyzed using unpaired t-test. matrix metallopeptidase 9 (mmp9); solute carrier family 16, member 1 (slc16a1)..
-
Figure 5—source data 1
Fold change calculations for Figure 5A,B,C; mean and standard deviation values for Figure 5D.
- https://doi.org/10.7554/eLife.22706.016
Figure 6 with 1 supplement
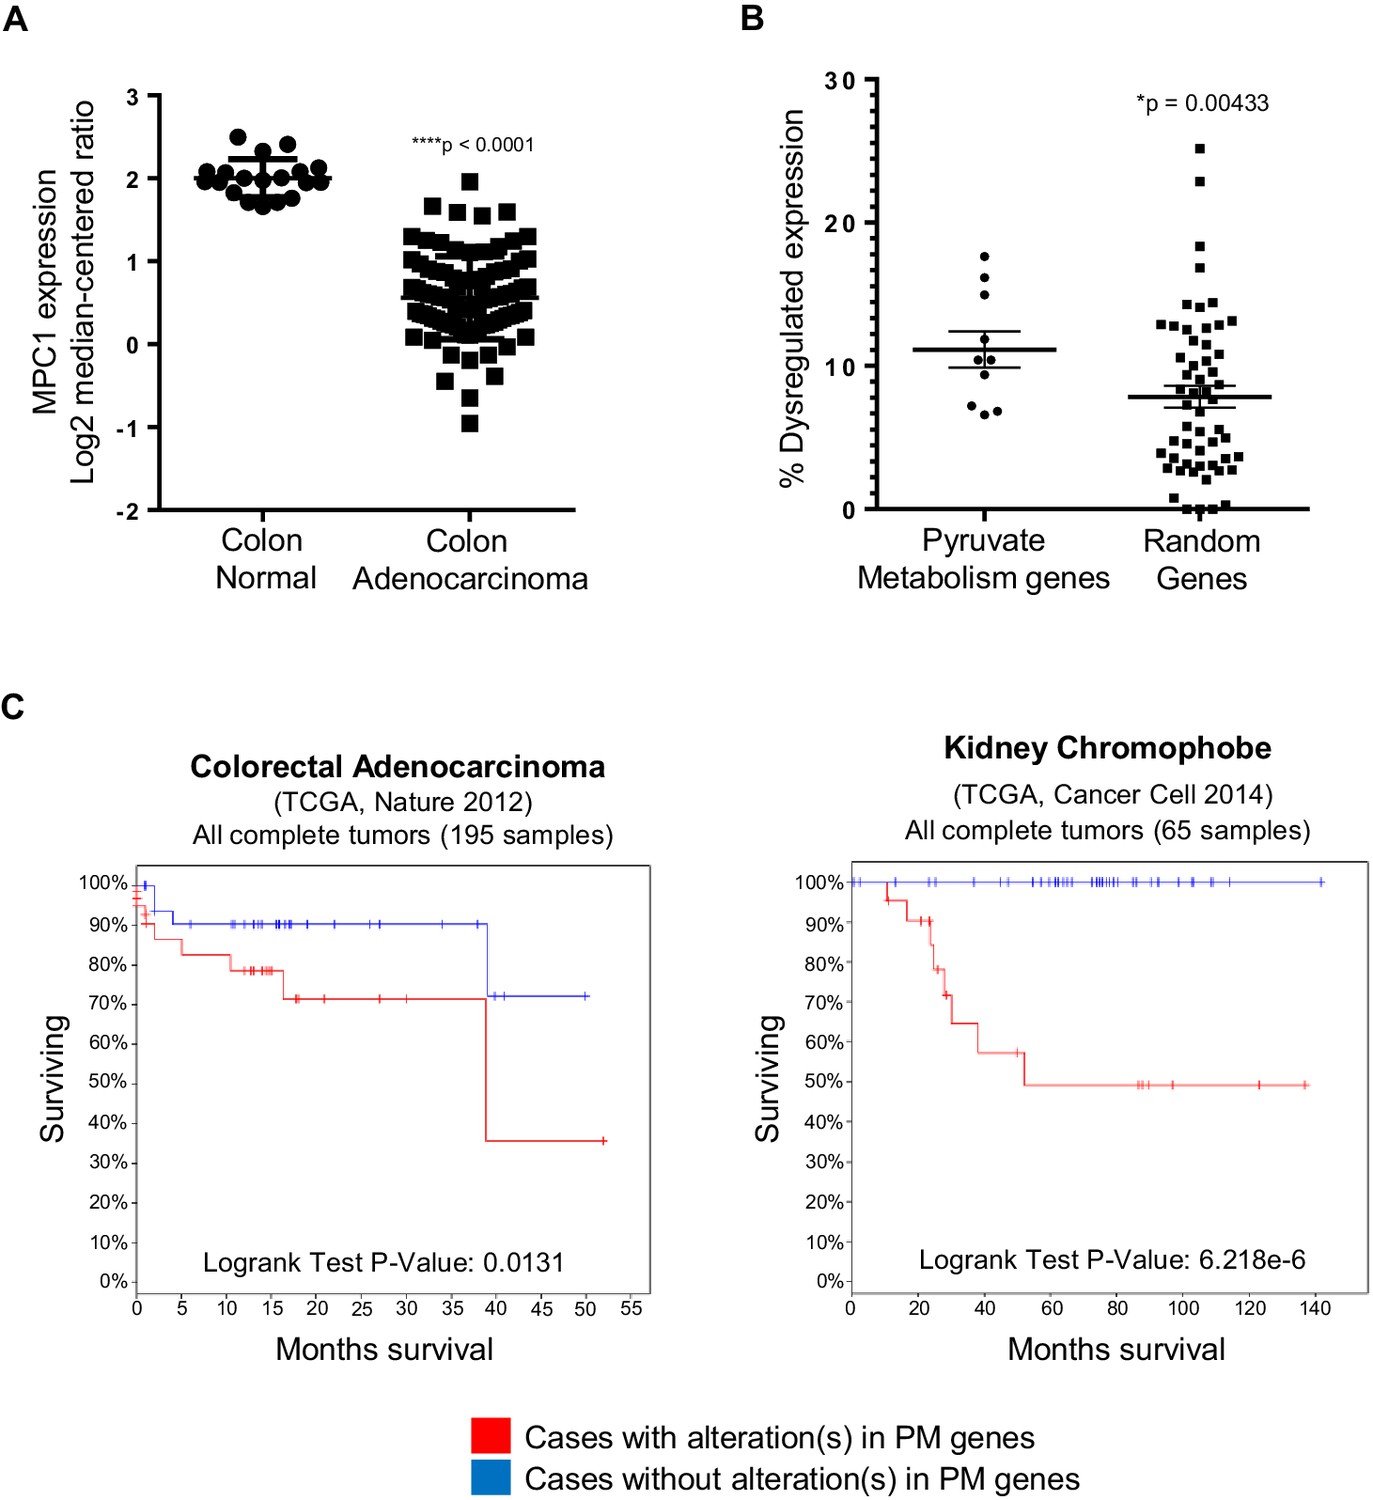
In silico analyses of APC and pyruvate metabolism gene alterations in cancer.
(A) MPC1 expression levels in TCGA normal colon and colon adenocarcinoma samples harboring truncating mutations in APC upstream of codon 1600. Statistical significance was analyzed using Mann Whitney test. (B) ONCOMINE database was analyzed for gene expression alterations in pyruvate metabolism genes in all cancer types. A control group composed of Uniprot random genes was used for comparison. Graph shows percentage of up- and downregulated genes with respect to the total unique analyses for each gene tested for all cancer groups. Statistical significance was analyzed using Mann Whitney test. (C) cBioportal analysis to estimate Kaplan-Meier overall survival of TCGA colorectal adenocarcinoma and kidney chromophobe patients with or without alterations in pyruvate metabolism (PM) genes. For B–C, pyruvate metabolism genes used in meta-analyses: MPC1, MPC2, CS, PDK1, PDHA1, PC, PKLR, LDHA, SLC16A1, GYS1. See also Figure 6—figure supplement 1, Supplementary files 1, 2.
Figure 6—figure supplement 1
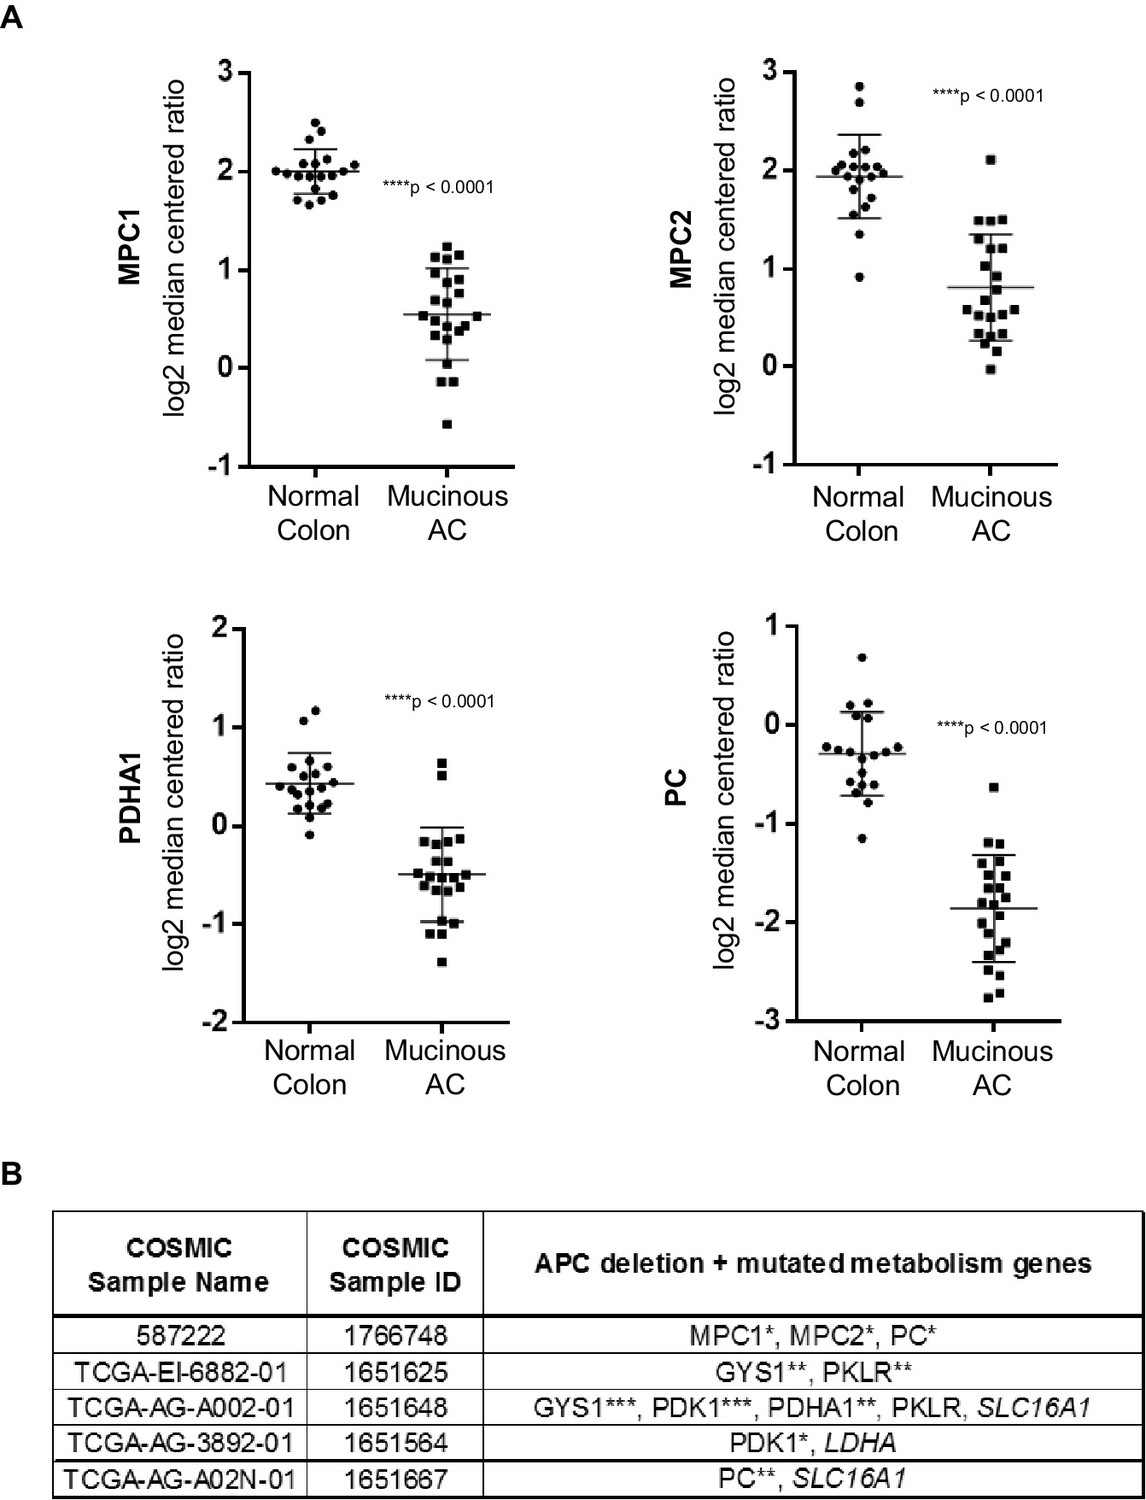
Pyruvate metabolism genes are mutated in human colon carcinomas.
(A) Gene expression levels of pyruvate metabolism genes in TCGA normal colon and colon mucinous adenocarcinoma (MA). Statistical significance was analyzed using Mann Whitney test. (B) Colon carcinomas harboring APC mutations were identified from the COSMIC database. Of the 35 samples that were found, five had multiple mutations in pyruvate metabolism genes that are predicted to be at least possibly damaging based on Polyphen2 in silico protein analysis. (***) – deletion; Polyphen2 prediction: (**) – probably damaging, (*) – possibly damaging, (italics) – benign.
Additional files
-
Supplementary file 1
Raw data for oncomine analyses of pyruvate metabolism and random gene dataset expression percent total dysregulation (plotted in Figure 6B).
- https://doi.org/10.7554/eLife.22706.019
-
Supplementary file 2
Overall survival kaplan-meier estimate of pyruvate metabolism geneset alterations using cBioportal (sorted by lowest to highest LogRank Test P-Value).
- https://doi.org/10.7554/eLife.22706.020
-
Supplementary file 3
List of morpholinos.
- https://doi.org/10.7554/eLife.22706.021
-
Supplementary file 4
List of PCR primers.
- https://doi.org/10.7554/eLife.22706.022
-
Supplementary file 5
List of qRT-PCR primers.
- https://doi.org/10.7554/eLife.22706.023
Download links
A two-part list of links to download the article, or parts of the article, in various formats.
Downloads (link to download the article as PDF)
Open citations (links to open the citations from this article in various online reference manager services)
Cite this article (links to download the citations from this article in formats compatible with various reference manager tools)
A metabolic switch controls intestinal differentiation downstream of Adenomatous polyposis coli (APC)
eLife 6:e22706.
https://doi.org/10.7554/eLife.22706


