An alternative splicing switch shapes neurexin repertoires in principal neurons versus interneurons in the mouse hippocampus
- University of Basel, Switzerland
Figures
Figure 1 with 2 supplements
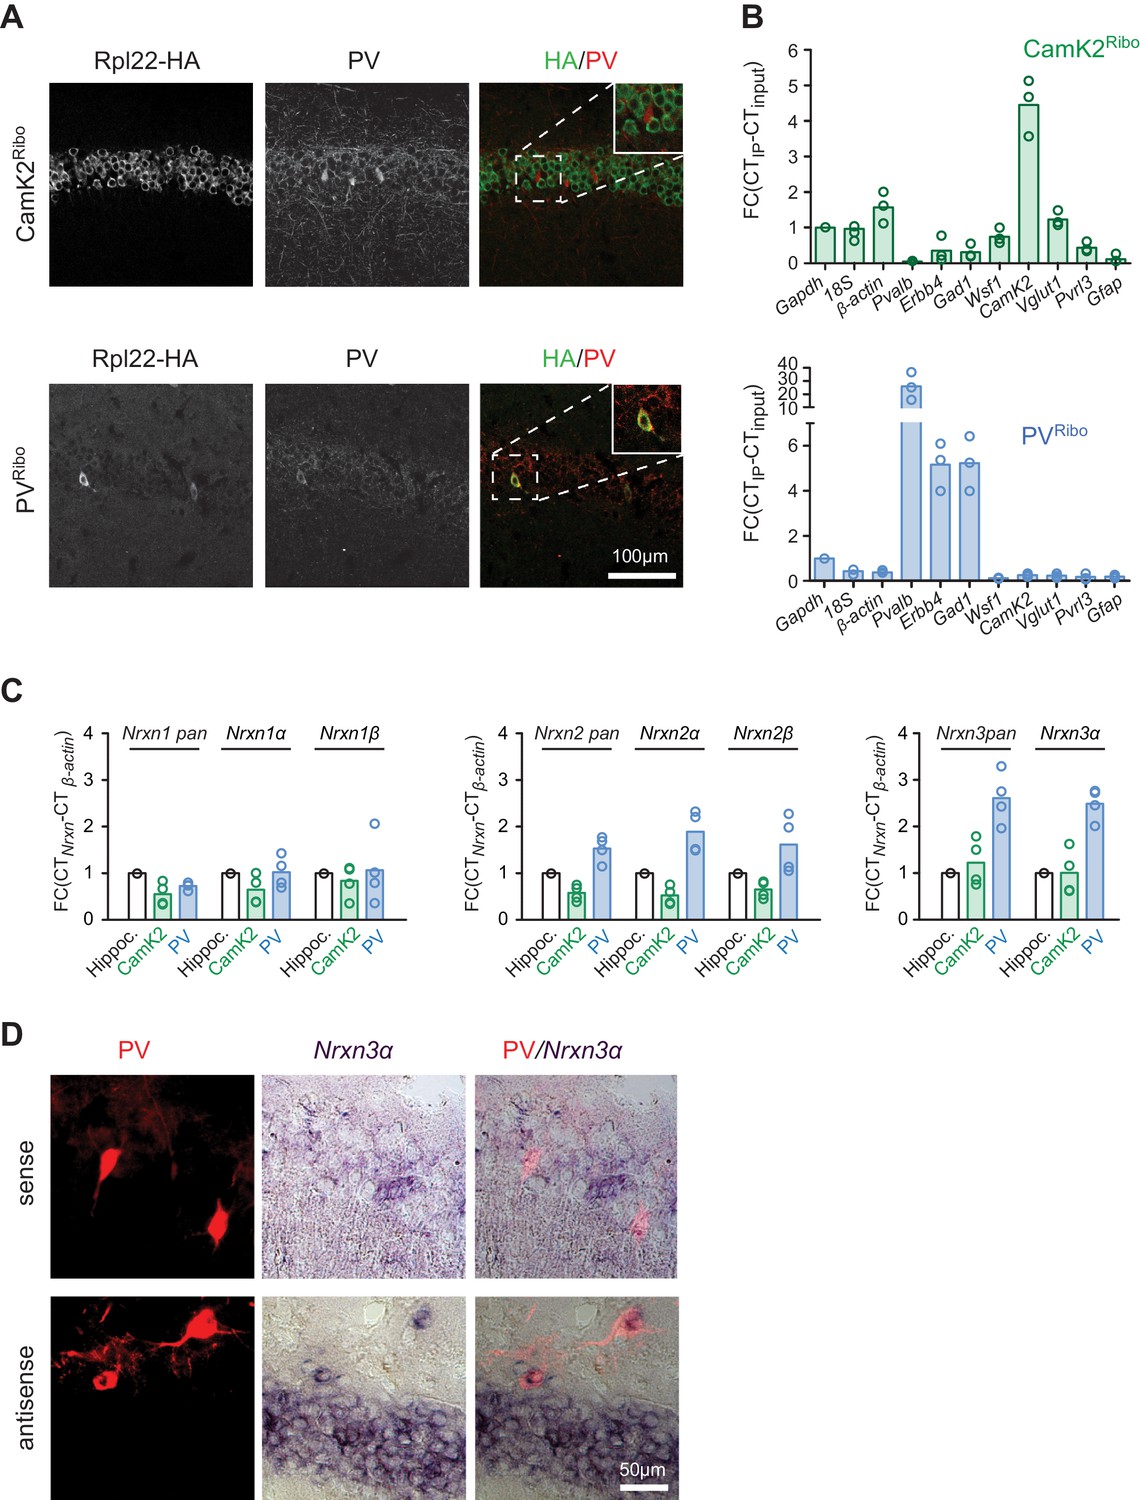
Neurexin transcripts are highly expressed in PV+ interneurons.
(A) Conditional expression of Rpl22-HA in pyramidal cells (CamK2Ribo) and fast-spiking interneurons (PVRibo) in mouse hippocampus (postnatal day 28). Immunoreactivity for epitope-tagged Rpl22 (anti-HA, green in merge), anti-PV (red in merge) is shown. Inset in merge shows an enlargement of the boxed area. (B) Purification of cell type-specific polysome-associated transcripts by RiboTrap affinity purification. Transcript levels were assessed by real-time qPCR for general markers of glutamatergic neurons (Vglut1, CamK2), markers of CA1 pyramidal cells (Wsf1), CA3 (Pvrl3), common GABAergic marker (Gad1), and fast-spiking markers (Pvalb and Erbb4). Enrichment in the immunoisolate (IP) was calculated relative to the input and was normalized to Gapdh (n = 3 independent mRNA preparations). (C) Expression of Nrxn1,2,3 transcripts in PV+ and CamK2+ cells was examined by real-time qPCR. Transcript levels in each preparation were normalized to the level of β-actin transcripts and enrichment in the immunoisolate (IP) was calculated relative to the input levels in total hippocampus (n = 4 independent mRNA preparations). Neurexin three beta transcripts were not reliably detectable with our assays in the hippocampus due to low expression (see Figure 1—figure supplement 1C for further information). (D) Expression of Nrxn3α in PV+ cells in CA1 (postnatal day 21) revealed by dual labeling with in situ hybridization using Nrxn3α probes and immunostaining using antibody against RFP in mice where PV+ cells are genetically marked by cre-dependent expression of red fluorescent protein (Pvalbcre::Ai9Tom).
Figure 1—figure supplement 1
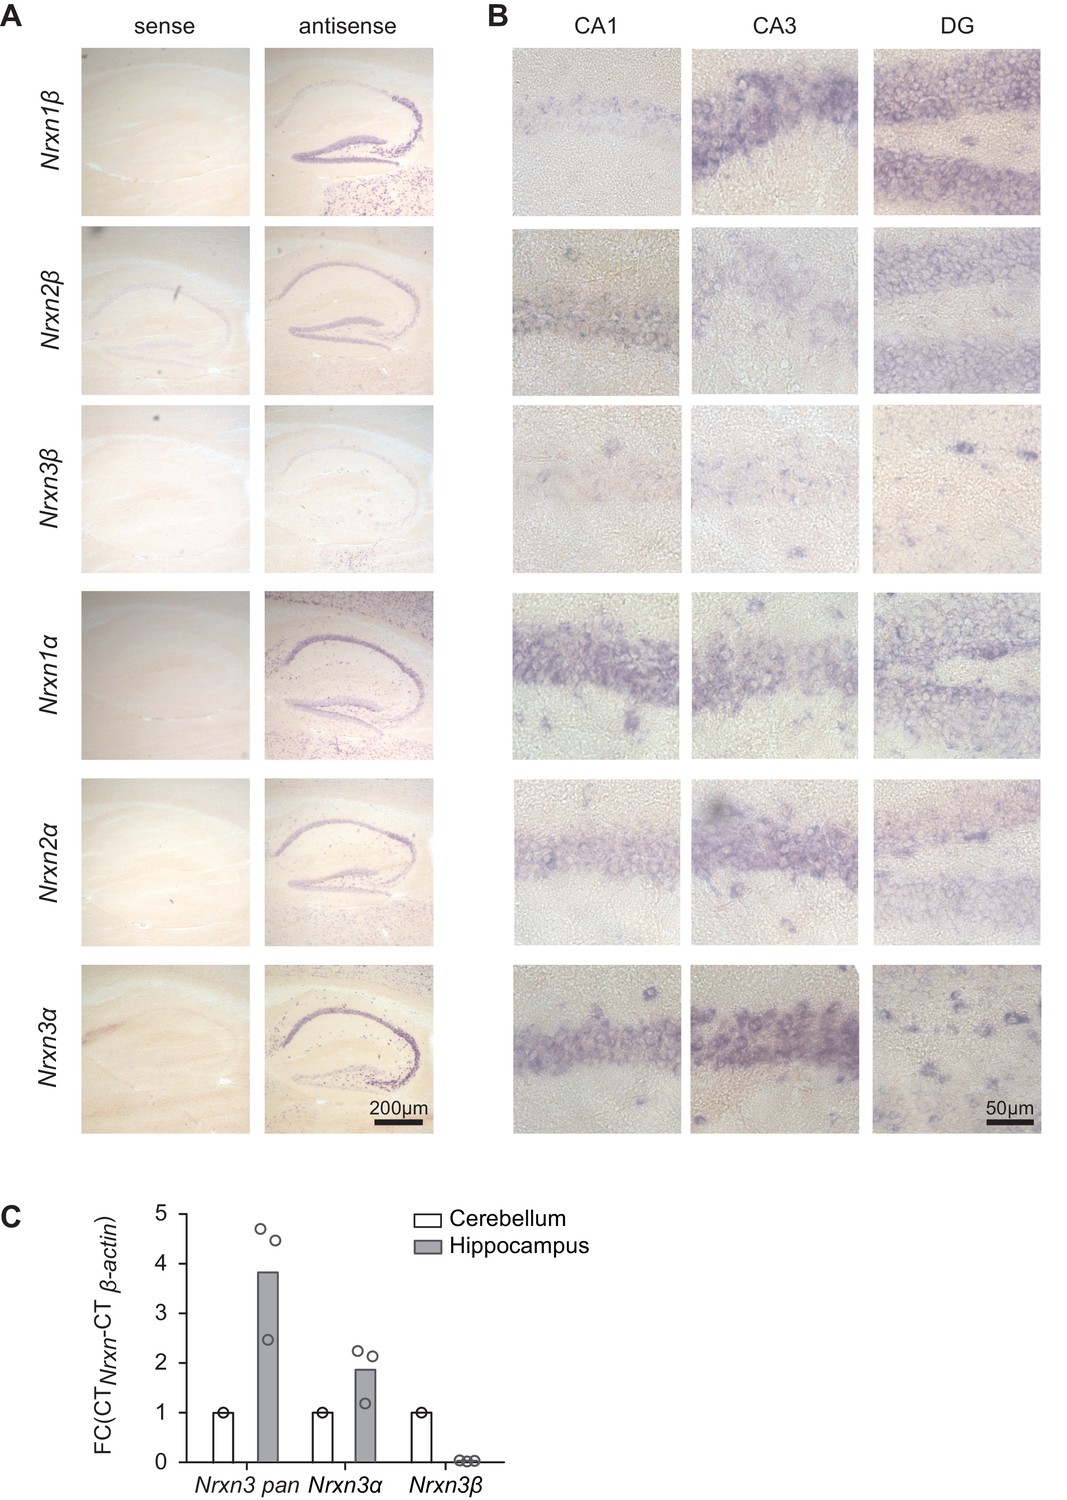
Detection of primary neurexin transcripts by in situ hybridization.
(A) In situ hybridization on mouse hippocampal tissue (postnatal day 21–30) with probes directed against the six primary neurexin transcripts (antisense and sense controls). (B) Enlarged fields of area CA1, CA3 and dentate gyrus (DG). (C) Expression of Nrxn3 transcripts in cerebellum and hippocampus was examined by real-time qPCR. Transcript levels in each region were normalized to the level of β-actin transcripts. Fold change values of cerebellum were set as1 as reference (n = 3 mice).
Figure 1—figure supplement 2
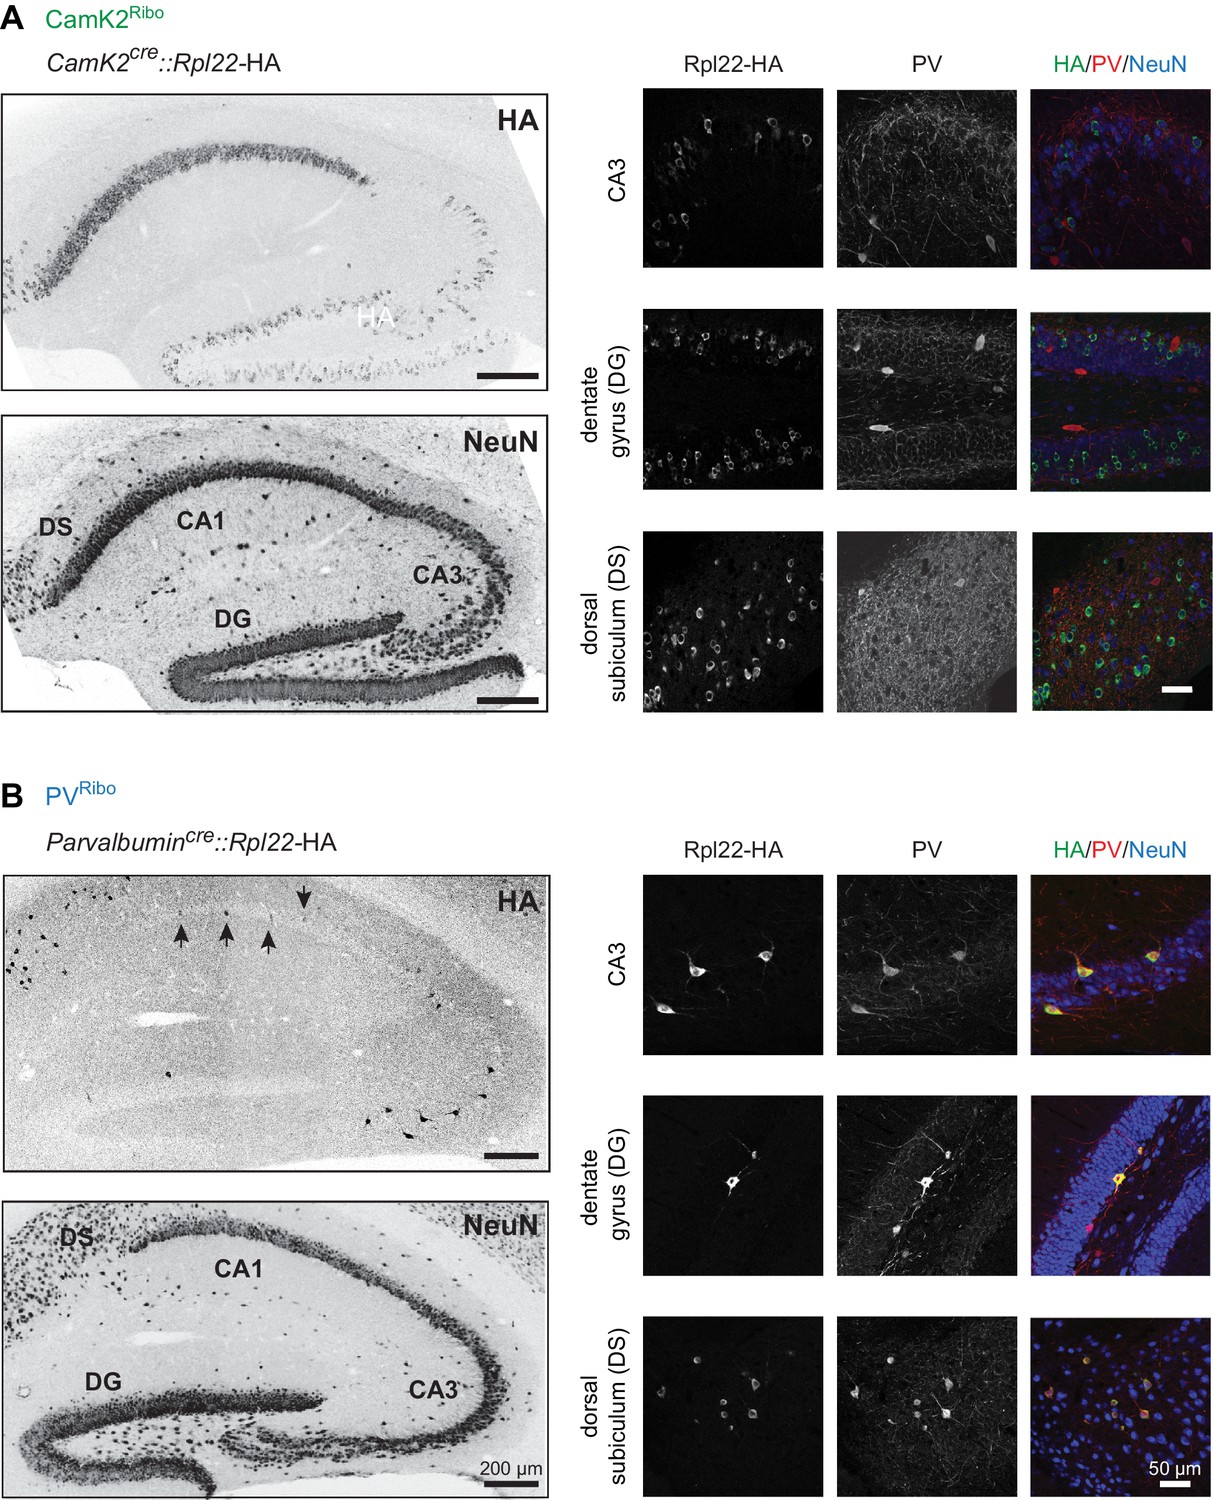
Conditional Rpl22-HA expression in mouse hippocampus.
(A) HA-tagged Rpl22, conditionally expressed in CamK2cre::Rpl22-HA (CamK2Ribo) or (B) Parvalbumincre: :Rpl22-HA (PVRibo) mice, was detected with anti-HA antibodies (green). PV-expressing cells are marked with anti-PV antibodies (red) and hippocampal architecture is revealed with anti-NeuN antibodies (blue; mouse hippocampus, age postnatal age 25, area CA3, dentate gyrus, DG and dorsal subiculum, DS). Note that CamK2cre-dependent recombination of the Rpl22-HA allele in CA3 and DG is sparse. The arrows in the PVRibo panel represent PV+ cells which express HA in CA1.
Figure 2 with 2 supplements
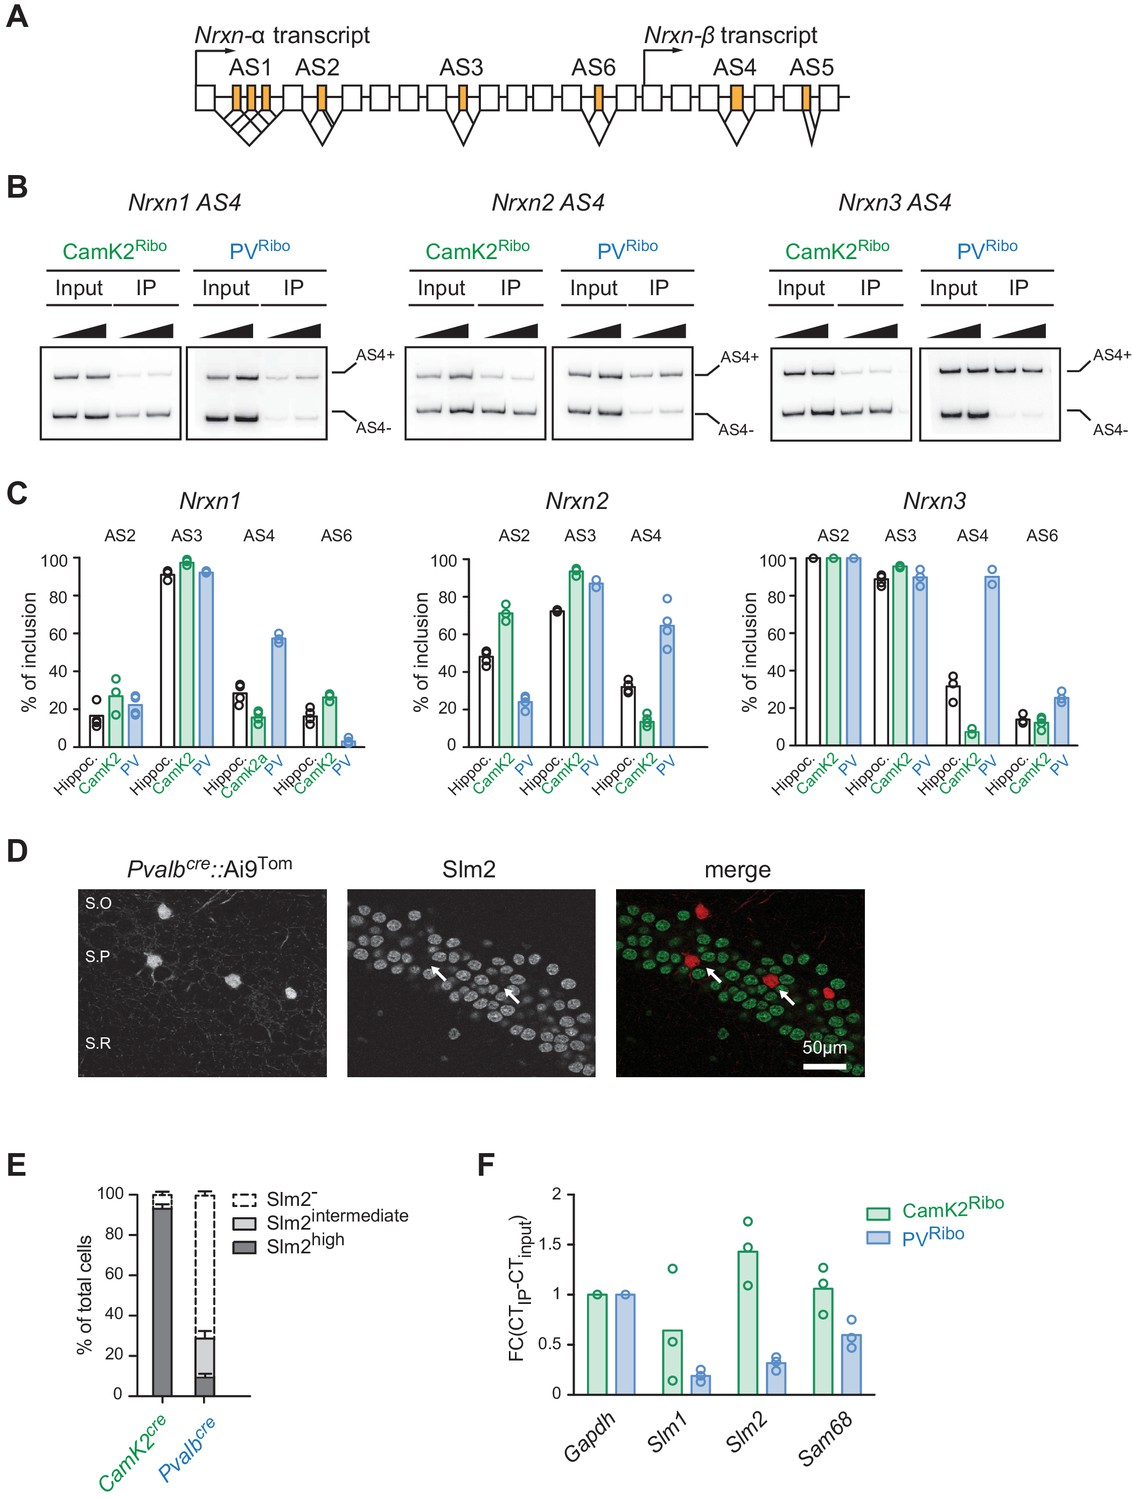
Cell type-specific alternative splicing.
(A) Schematic illustrating exon-intron structure of the Nrxn gene (example based on mouse Nrxn1). Alternatively spliced segments are numbered (AS1-6) and alternative exons are highlighted in orange, constitutive exons in white. (B) Analysis of alternative splicing pattern in total hippocampus (input), Camk2Ribo and PVRibo preparations. Radioactive PCR amplifications for Nrxn1,2,3 AS4. For each sample two PCR reactions with increasing cDNA input are shown. (C) Quantifications of alternative exon insertion rates at alternatively spliced segments (AS) 2,3,4, and six in Nrxn1,2,3 transcripts for total hippocampus (input), CamK2Ribo and PVRibo preparations. The insertion rates were measured by radioactive PCR with limiting cycle numbers. Raw data for the radioactive PCR amplifications are shown in Figure 2—figure supplement 1 (n= 3-4 independent mRNA preparations). (D) Expression of Slm2 in PV+ cells in mouse hippocampus (postnatal day 25–30) was examined using Pvalbcre::Ai9Tom mice. Dual immunohistochemistry on vibratome sections reveals high Slm2 expression in hippocampal pyramidal cells but no detectable expression in the majority of PV+ cells in and adjacent to the stratum pyramidale (S.O: stratum oriens, S.P: statrum pyramidale, S.R: stratum radiatum). (E) Quantification of the percentage of CamK2Ribo and Pvalbcre::Ai9Tom positive cells that show specific Slm2 immunoreactivity. (n = 5 mice for CamK2Ribo with a total of 2312 cells and five mice for Pvalbcre::Ai9Tom with a total of 244 cells, mean + SEM). (F) mRNA expression of STAR-family RNA-binding proteins was assessed by real-time qPCR in CamK2Ribo and PVRibo mRNA preparations (n = 3 independent mRNA preparations).
Figure 2—figure supplement 1
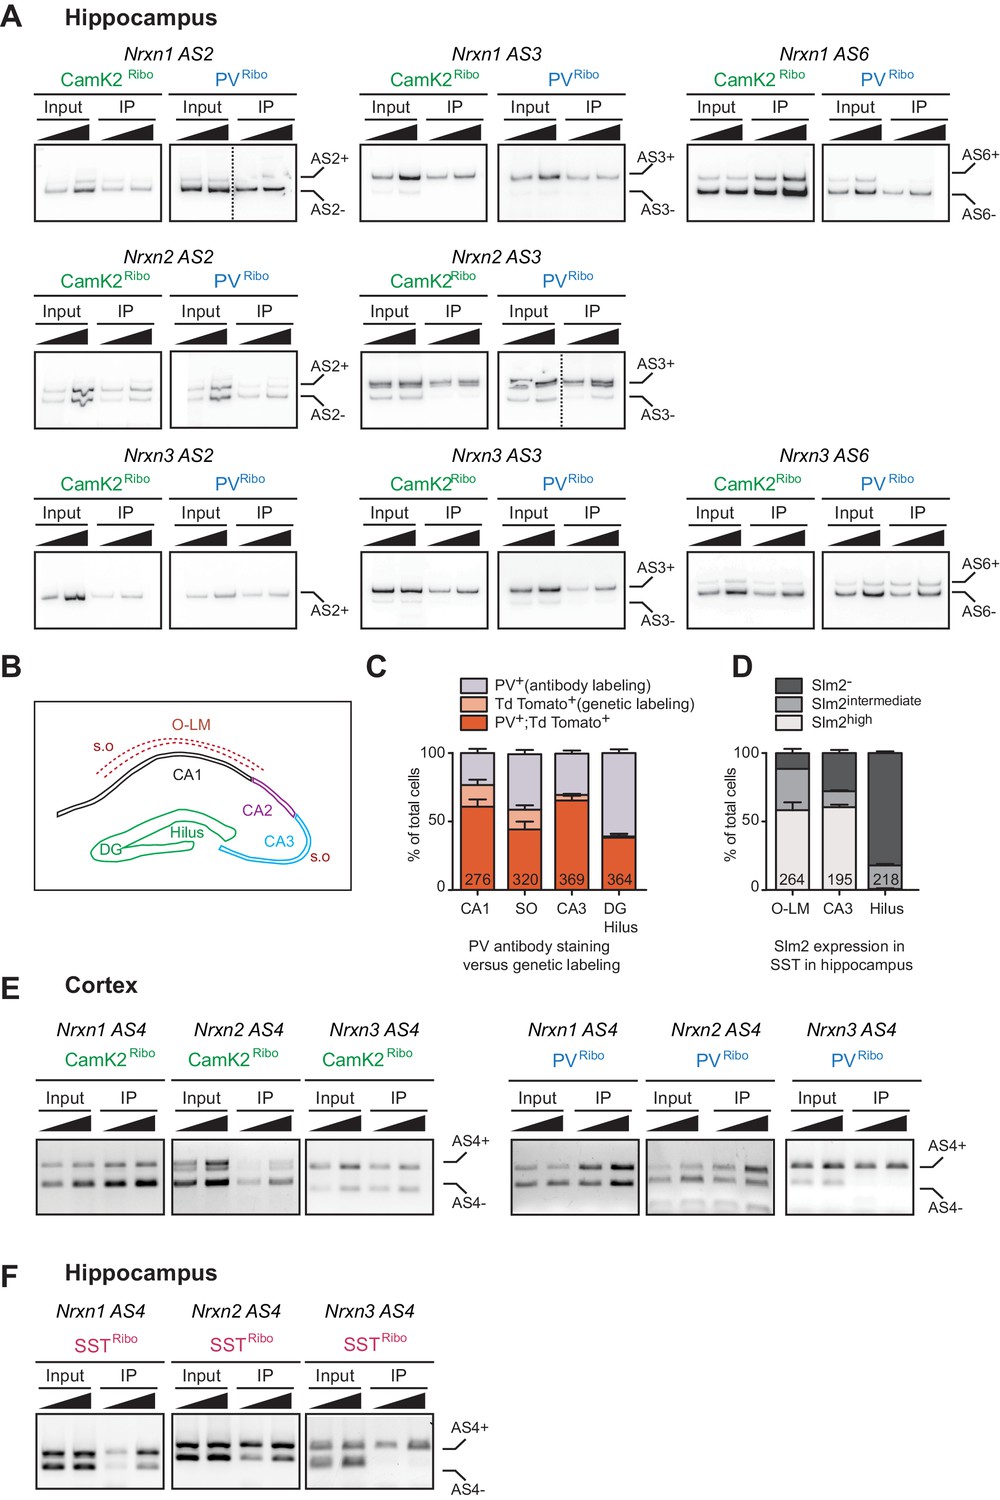
Assessment of alternative exon incorporation rates by radioactive PCR.
(A) Neurexin alternative exon incorporation rates in total hippocampus (input) versus CamK2Ribo and PVRibo immunoisolations (IP). Insertion rates were measured by radioactive PCR with limiting cycle numbers. Amplification products for two different cDNA amounts are shown for each sample. Note that for Nrxn3 AS2, single band PCR represents Nrxn3 AS2+ isoform (determined by the PCR band size). Dotted lines represent two independent experiments that were combined. (B) Schematic representation of the different hippocampal areas (S.O: stratum oriens, O-LM: oriens-lacunosum moleculare,DG: dentate gyrus). (C) Quantification of number of Pvalbcre::Ai9Tom positive cells which show PV immunoreactivity and/or which are genetically labelled with Td Tomato (n = 5 mice. The total number of cells is indicated in the graph bars, mean + SEM). (D) Quantification of number of Somatostatincre::Ai9Tom positive cells which show specific Slm2 immunoreactivity (n = 5 mice. The total number of cells is indicated in the graph bars, mean + SEM). (E) Neurexin alternative exon incorporation rates at AS4 determined for CamK2Ribo and PVRibo mRNA isolations in the neocortex by standard PCR amplification. (F) Neurexin alternative exon incorporation rates at AS4 determined for SSTRibo mRNA isolations from hippocampus analyzed by standard PCR amplification (Somatostatincre::Rpl22-HA).
Figure 2—figure supplement 2
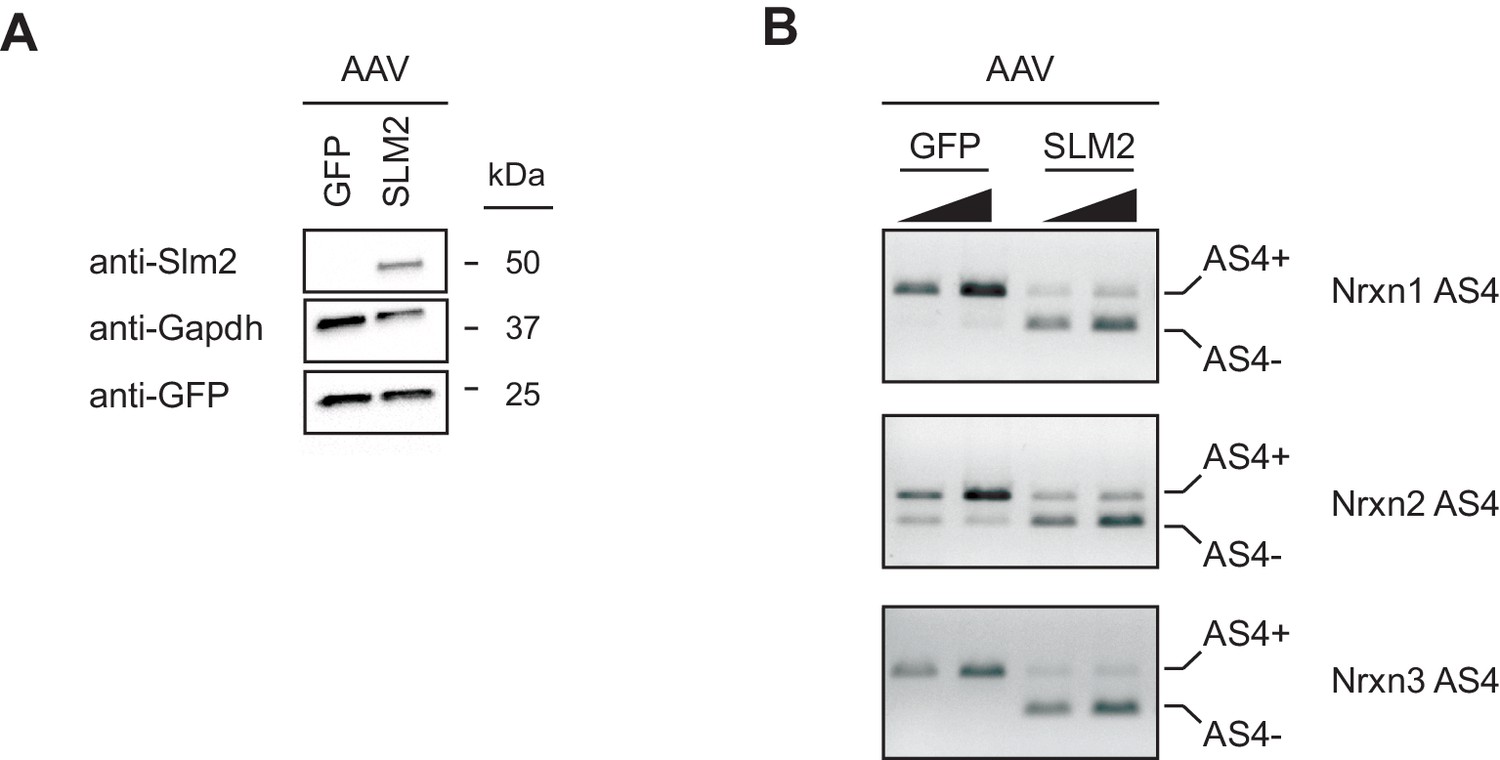
Ectopic expression of Slm2 is sufficient to drive expression of Nrx AS4- isoforms.
(A) Detection of Slm2 level in cerebellar granule cells infected with AAV-GFP or AAV-Slm2-2A-Venus YFP by Western blotting analysis. Cerebellar granule cells do not express Slm2. The cultures were infected at day in vitro three and the samples were harvested at day in vitro 14. (B) The presence of Slm2 in cerebellar granule cells cultures induces the expression of Neurexin AS4- isoforms. The alternative exon incorporation choice is revealed by standard PCR amplification. For each sample two PCR reactions with increasing cDNA input are shown.
Figure 3 with 1 supplement
Regulation of Nrx3 interaction by AS4- splice insertions.
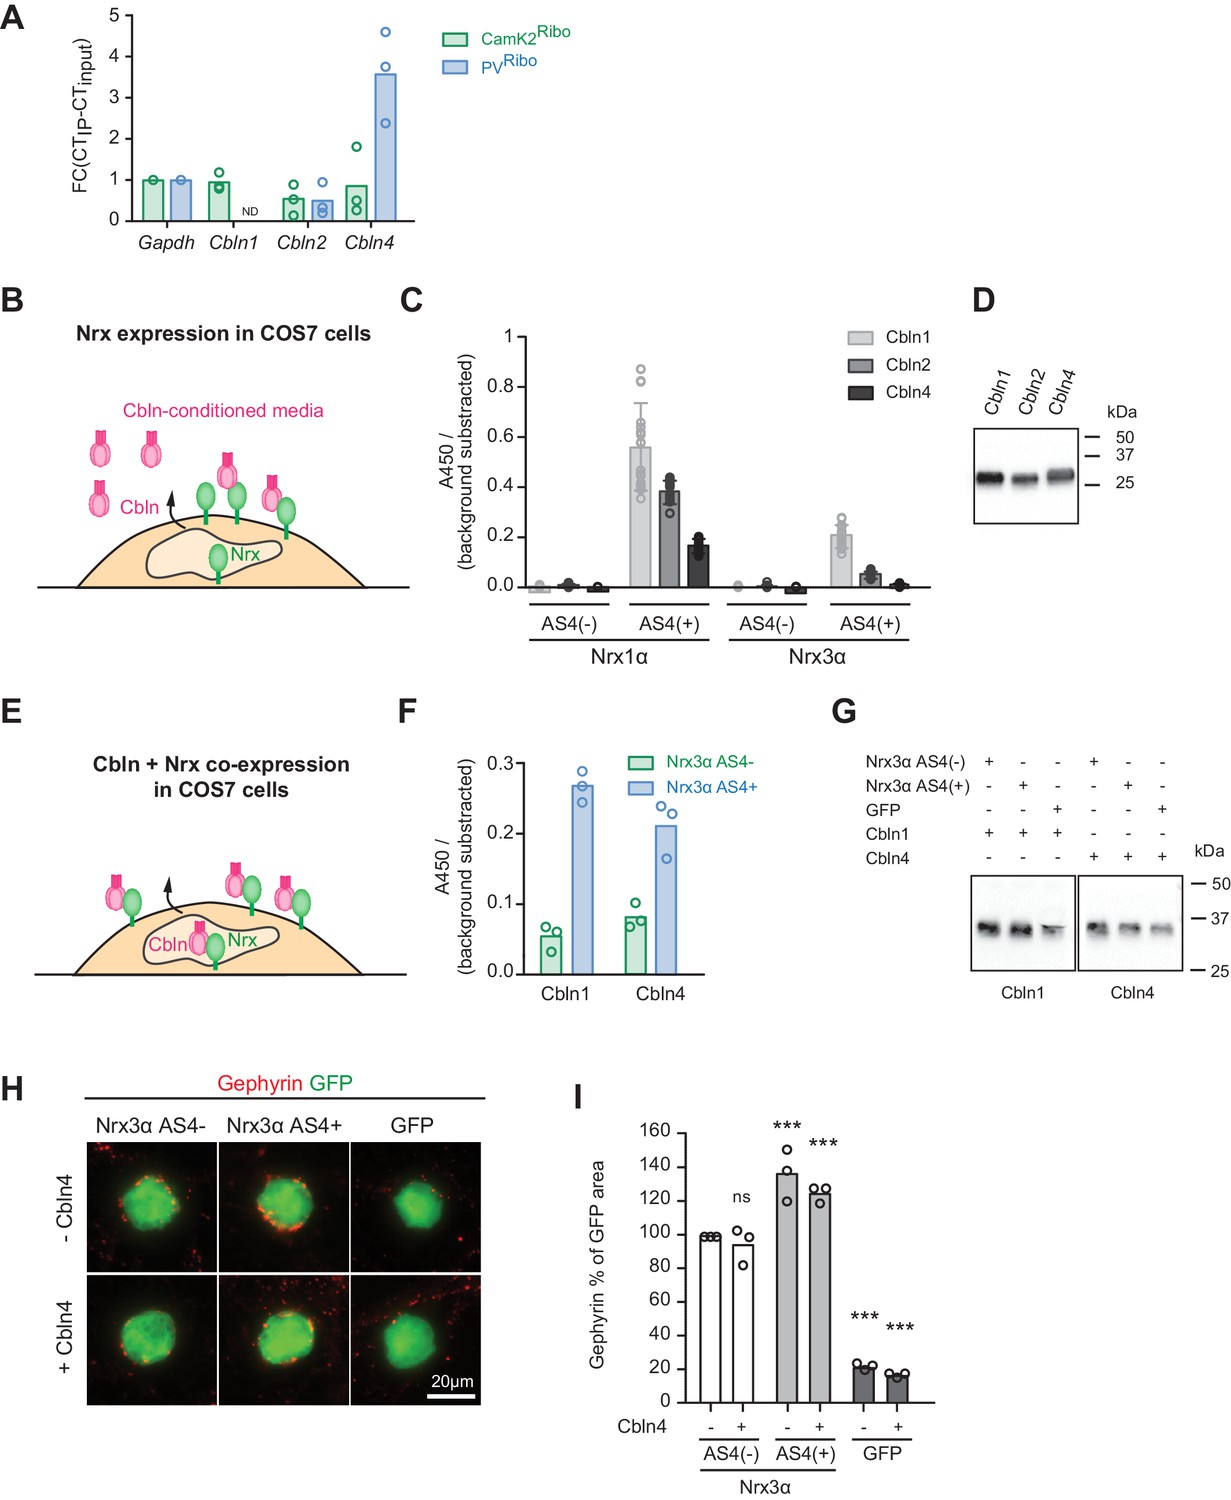
(A) Cbln1, 2, 3 and 4 mRNA expression level was assessed by real-time qPCR in CamK2Ribo and PVRibo preparations from mouse hippocampus. Transcript enrichment in the immunoisolate (IP) was calculated relative to the transcript level in the total hippocampus (input) and was normalized to Gapdh (n = 3 independent mRNA preparations). Note that Cbln1 mRNA could not be detected in the PVRibo mRNA preparation. ND: not detected. (B) Schematic for experimental setup: binding of Cbln1,2,4 proteins to COS7 cells expressing Nrx. Conditioned media containing V5-epitope-tagged Cbln proteins were applied to neurexin expressing cells and binding was determined using a HRP-mediated colorimetric reaction (see methods for details). (C) Quantification of Cbln-Nrx surface binding signals. The background was substrated from the signal. Single dots in the graph represent value of single well measurements (n = 20 measurements per condition, mean ± SD). (D) Expression level of V5-epitope tagged Cbln1, 2 and 4 in conditioned media from COS7 cells was probed by Western blotting analysis with anti-V5 antibodies. (E) Schematic for experimental setup: cell surface accumulation of Cbln1 or Cbln4 that were co-expressed with Nrx3α AS4 with or without splice insert in COS7 cells. The binding was determined using a HRP-mediated colorimetric reaction (see methods for details). (F) Quantification of cell surface accumulation of Cbln-Nrx. Signals were background subtracted and quantified from three independent experiments (n = 3 independent cell cultures). (G) Expression of myc-epitope tagged Cbln1 and 4 was probed by Western blotting. (H) Heterologous cell assays comparing synaptogenic activities of Nrx3 splice variants in presence and absence of Cbln4. HEK293 cells co-expressing Cbln4 with Nrx3α (with or without AS4 insertion) or GFP were introduced into cultures of hippocampal neurons and inhibitory postsynaptic structures were visualized by immunostaining with anti-gephyrin antibodies (red). (I) The density of gephyrin-positive structures, relative to the HEK293 cell area (GFP-positive) was quantified (n = 3 independent cultures,with ≥39 and 20 cells analyzed per condition for Nrx and GFP, respectively, mean ± SEM, Dunnet’s multiple comparison test, ***p<0.001, **p<0.01, *p<0.05, [ns] not significant).
Figure 3—figure supplement 1
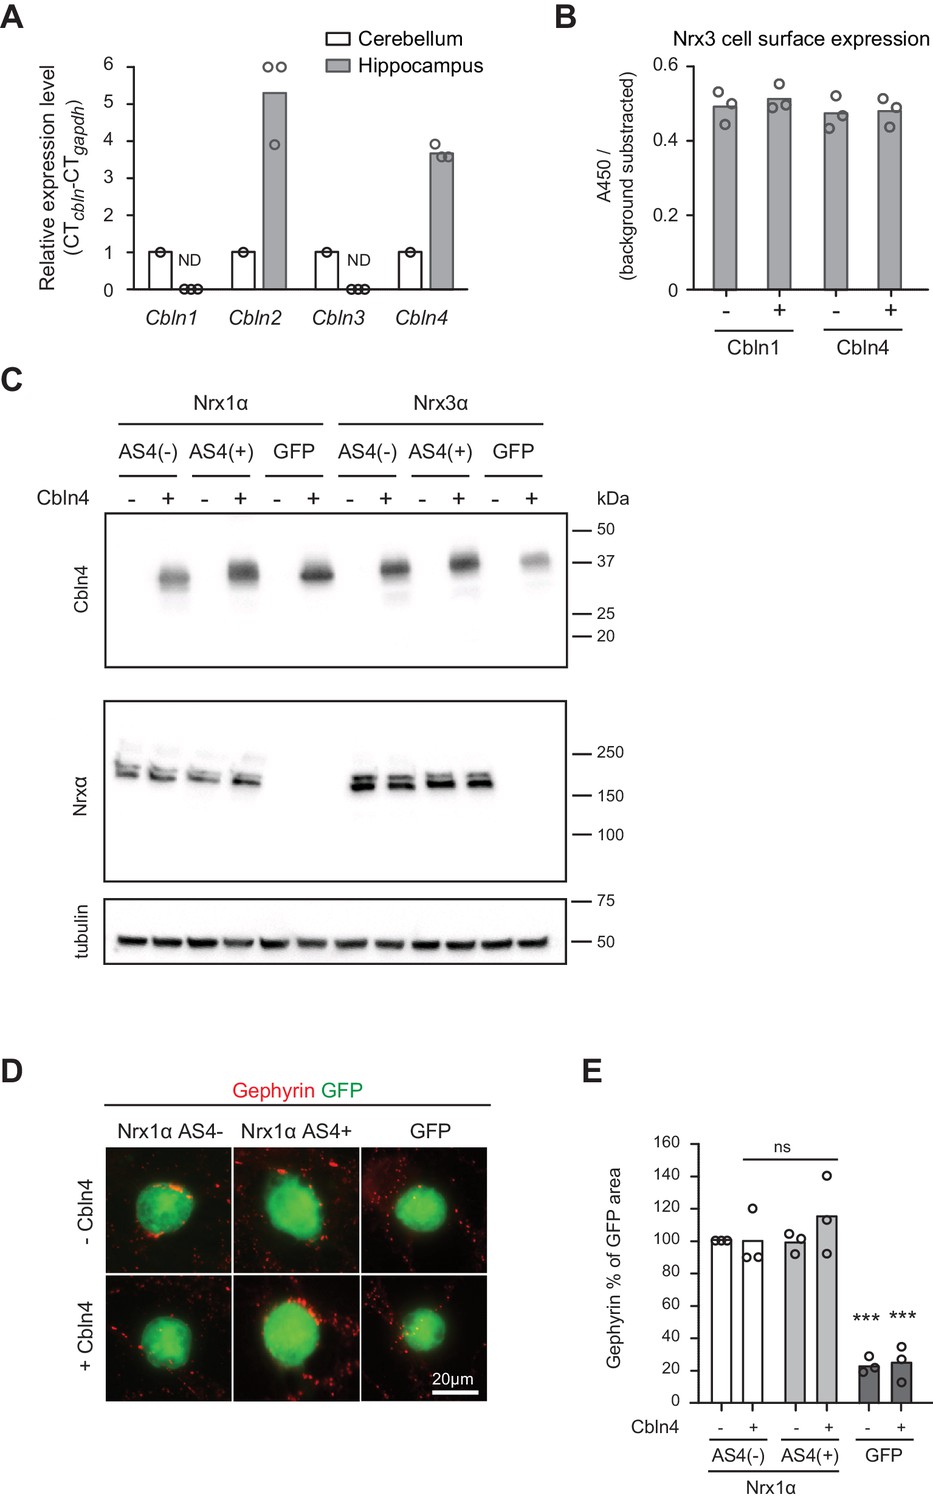
Additional assays for Cbln expression and function.
(A) Expression of Cbln1-4 transcripts in cerebellum and hippocampus was examined by real-time qPCR. Transcript levels in each region were normalized to the level of Gapdh transcripts. Expression values for the cerebellum were set to one as reference (n = 3 mice), ND: not detected. (B) Quantification of Nrx3 expression level in the cell surface accumulation assay in which Nrx3 is co-expressed with Cbln1 or 4 (relates to Figure 3E–G). The signal was measured using a HRP-mediated colorimetric reaction and background substracted. Single dots represent means of duplicates of 3 independent experiments (n = 3 experiments). (C) Expression level of His-tagged Cbln4 and HA-tagged Nrx1α or Nrx3α in heterologous cell assays determined by Western blotting analysis (relates to Figure 3H,I and Figure 3—figure supplement 1D,E). (D) Heterologous cell assays comparing synaptogenic activities of Nrx1 splice variants in presence and absence of Cbln4. HEK293 cells co-expressing Cbln4 with Nrx1α (with or without AS4 insertion) or GFP were introduced into cultures of hippocampal neurons and inhibitory postsynaptic structures were visualized with anti-gephyrin (red). (E) The density of gephyrin-positive structures, relative to the HEK293 cell area (GFP-positive) was quantified (n = 3 independent cultures, measurements are derived from ≥20 cells by per condition for Nrx and GFP respectively, mean ± SEM, Dunnet’s multiple comparison test, ***p<0.001, **p<0.01, *p<0.05,, [ns] not significant).
Figure 4 with 1 supplement

Genetic ablation of Nrxn3 AS4 insertion in mice.
(A) Targeting strategy for conditional ablation of Nrxn3 AS4 insertion (Nrxn3ex21ΔPV conditional knock-out). See Experimental Procedures for details. (B) Analysis of Nrxn1,2 and 3 AS4 mRNA in control and in Nrxn3ex21Δ (n = 3 mice for each genotype, mean+SEM, unpaired t-test p<0.0001). (C) Selected Reaction Monitoring MS/MS transitions for an endogenous AS4-specific peptide detected in wild-type and Nrxn3Δex21 knock-out forebrain extracts. Synaptic proteins were enriched in Triton X-100-insoluble fractions from adult mice. The colored lines show signal intensities for several transitions derived from the same peptide. (D) Expression level of Nrx using pan-Nrx antibodies on Triton X-100-insoluble fractions from control (CTRL), Nrxn3ex21Δ knock-out (KO) and Nrxn3ex21Δ/+ heterozygous (HET) mice was determined by Western blotting. (E) Immunolabelling of PV+ interneurons in the CA1 region of hippocampus of control and and Nrxn1/3ex21ΔPV PV conditional double knock-out. PV+ interneurons were identified using anti-PV (magenta in overlay) and Hoechst (green in overlay, to counterstain cell nuclei). Quantifications of PV+ cell density in CA1 per 100 mm2 at postnatal day 24–26. Single dots in the graph represent means of PV+ cells per animal (n = 4 mice for each genotype, mean).
Figure 4—figure supplement 1
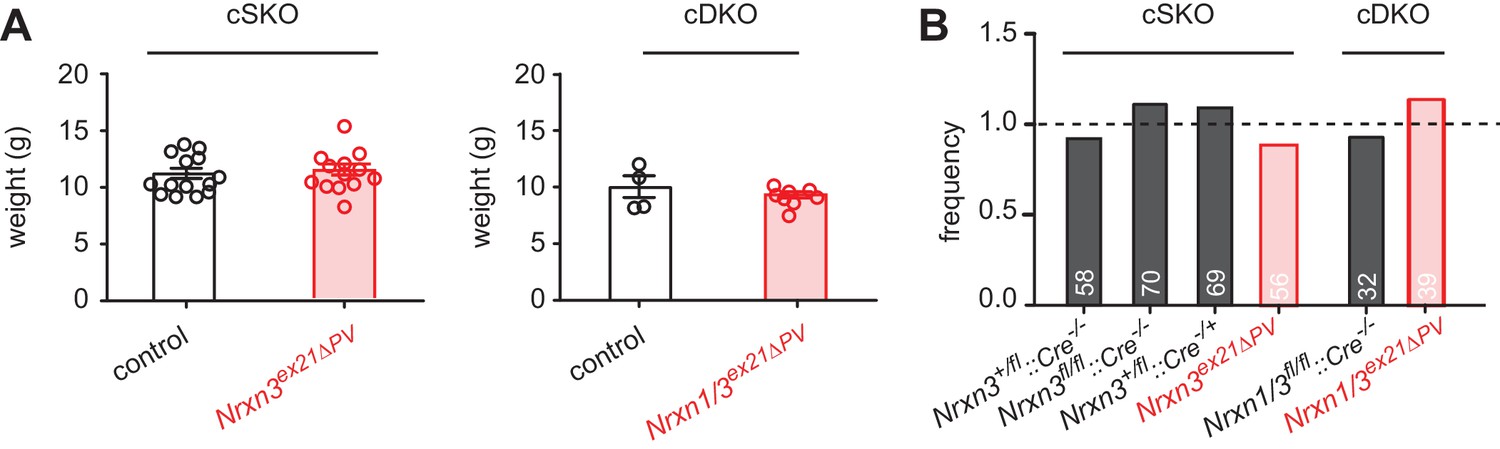
Analysis of weight and Mendelian frequencies in Nrxn3ex21ΔPV and Nrxn1/3ex21ΔPV conditional knock-out mice.
(A) Weight of control (cre negative) and conditional single (Nrxn3ex21ΔPV, cSKO) and conditional double knock-out mice (Nrxn1/3ex21ΔPV, cDKO) at postnatal day 25. Each dot represents a single animal, mean ± SEM. (B) Single and double conditional knock-out mice are born at Mendelian frequencies (expected frequency was set to 1, for Nrxn three conditional knock-out: 253 mice from 40 independent litters. For Nrxn1/3 conditional knock-out 71 mice from 10 independent litters).
Figure 5 with 2 supplements
Analysis of PV+ specific Nrxn1/3ex21ΔPV conditional knock-out mice.
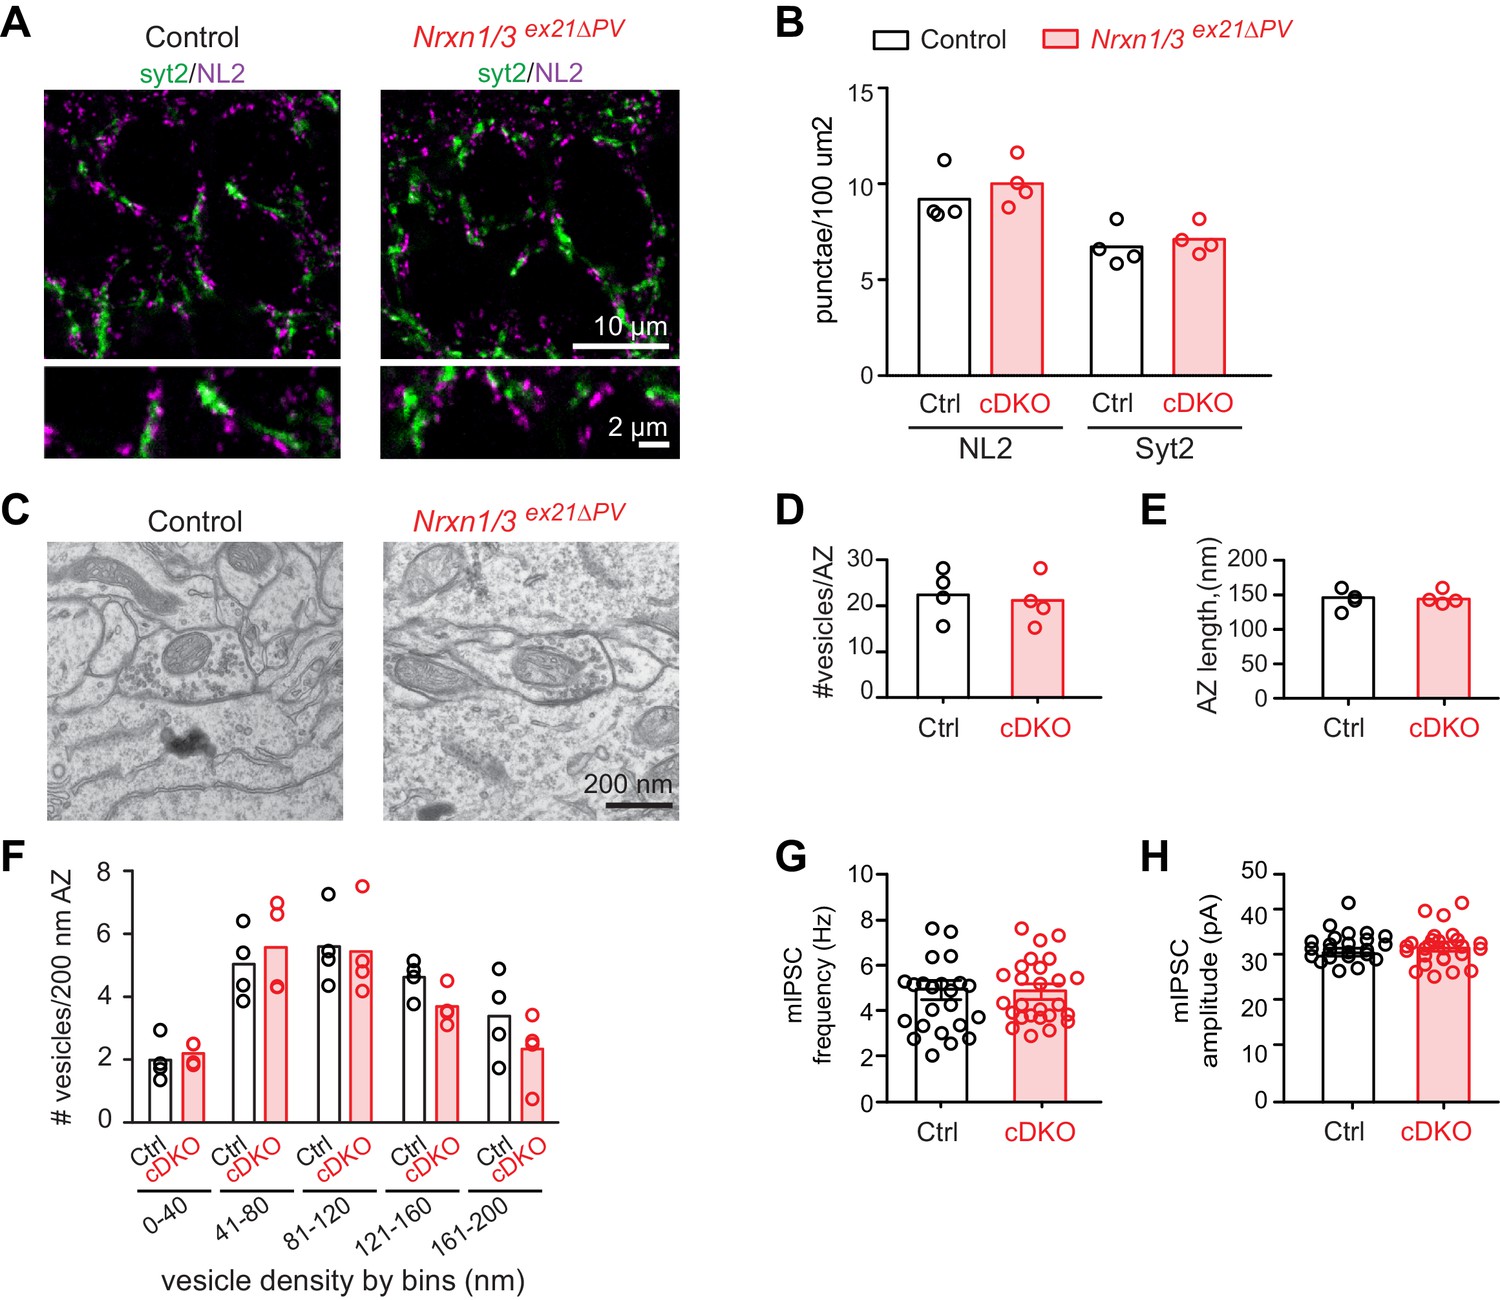
(A) The density of perisomatic GABAergic synapses in stratum pyramidale in CA1 of control and Nrxn1/3ex21ΔPV PV conditional double knock-out (cDKO) mice was examined by immunohistochemistry with anti-Neuroligin2 (NL2, in magenta) and anti-Synaptotagmin2 (Syt2, in green) antibodies at postnatal day 24–26. Note that Syt2 immuno-reactivity is specific for presynaptic terminals of PV+ cell synapses whereas NL2 is a common postsynaptic marker for most GABAergic synapses. Thus, only a fraction of NL2 puncta is apposed to Syt2-positive terminals. (B) The density of NL2 and Syt2 puncta per 100 μm2 of cell body area was quantified. Single dots in the graph represent means of respective synapse markers per animal (n = 4 mice per genotype). (C) Ultrastructure of inhibitory synapses in CA1 stratum pyramidale of littermate controls and Nrxn1/3ex21ΔPV mice. Presumptive PV+ cell perisomatic termini were identified by the presence of large mitochondria in the synapses apposed on the membrane of the soma and by their morphology (Takács et al., 2015). (D) Average vesicle numbers per active zone and (E) average active zone length in nm. Single dots in the graph represent means per animal (n = 4 mice for each genotype, ≥76 synapses). (F) Average number of vesicles located in 40 nm bins with increasing distance from the active zone normalized to 200 nm active zone length. Single dots in the graph represent means per animal (n = 4 mice for each genotype, ≥76 synapses). (G) mIPSC frequency and (H) amplitude in control and Nrxn1/3 ex21ΔPV mice. The recordings were performed in parallel with littermate controls. Single dots in the graph represent single cells (n = 3 control and 4 Nrxn1/3ex21ΔPV mice, mean ± SEM).
Figure 5—figure supplement 1

Analysis of PV+ specific Nrxn3ex21ΔPV single conditional knock-out mice.
(A) The density of perisomatic GABAergic synapses in stratum pyramidale CA1 of control and single Nrxn1/3ex21 PV conditional knock-out mice (cSKO) was examined by immunohistochemistry with anti-Neuroligin2 (NL2, in magenta) and anti-Synaptotagmin2 (Syt2, in green) antibodies at postnatal day 24–26. Note that Syt2 immuno-reactivity is specific for presynaptic terminals of PV+ cell synapses whereas NL2 is a common postsynaptic marker for most GABAergic synapses. Thus, only a fraction of NL2 puncta is apposed to Syt2-positive terminals. (B) The density of NL2 and Syt2 puncta per 100 μm2 of cell body area was quantified. Single dots in the graph represent means of respective synapse marker per animal (n = 6 mice for control and five mice for Nrxn3ex21ΔPV). (C) Ultrastructure of inhibitory synapse in CA1 stratum pyramidale of littermate controls and Nrxn3ex21ΔPV mice. Presumptive PV+ cell perisomatic termini were identified by the presence of large mitochondria in the synapses apposed on the membrane of the soma and by their morphology (Takács et al., 2015). (D) Average vesicle numbers per active zone and (E) average active zone length in nm. Single dots in the graph represent means per animal (n = 4 mice for each genotype, ≥146 synapses). (F) Average number of vesicles located in 40 nm bins with increasing distance from the active zone normalized to 200 nm active zone length. Single dots in the graph represent means per animals (n = 4 mice for each genotype, ≥146 synapses). (G) mIPSC frequency and (H) amplitude in control and Nrxn3 ex21ΔPV mice. The recordings were performed in parallel with littermate controls. Single dots in the graph represent single cells (n = 7 control and seven conditional knock-out mice, mean ± SEM).
Figure 5—figure supplement 2
Quantification of PV+ synaptic termini on PV somata in the hippocampus.
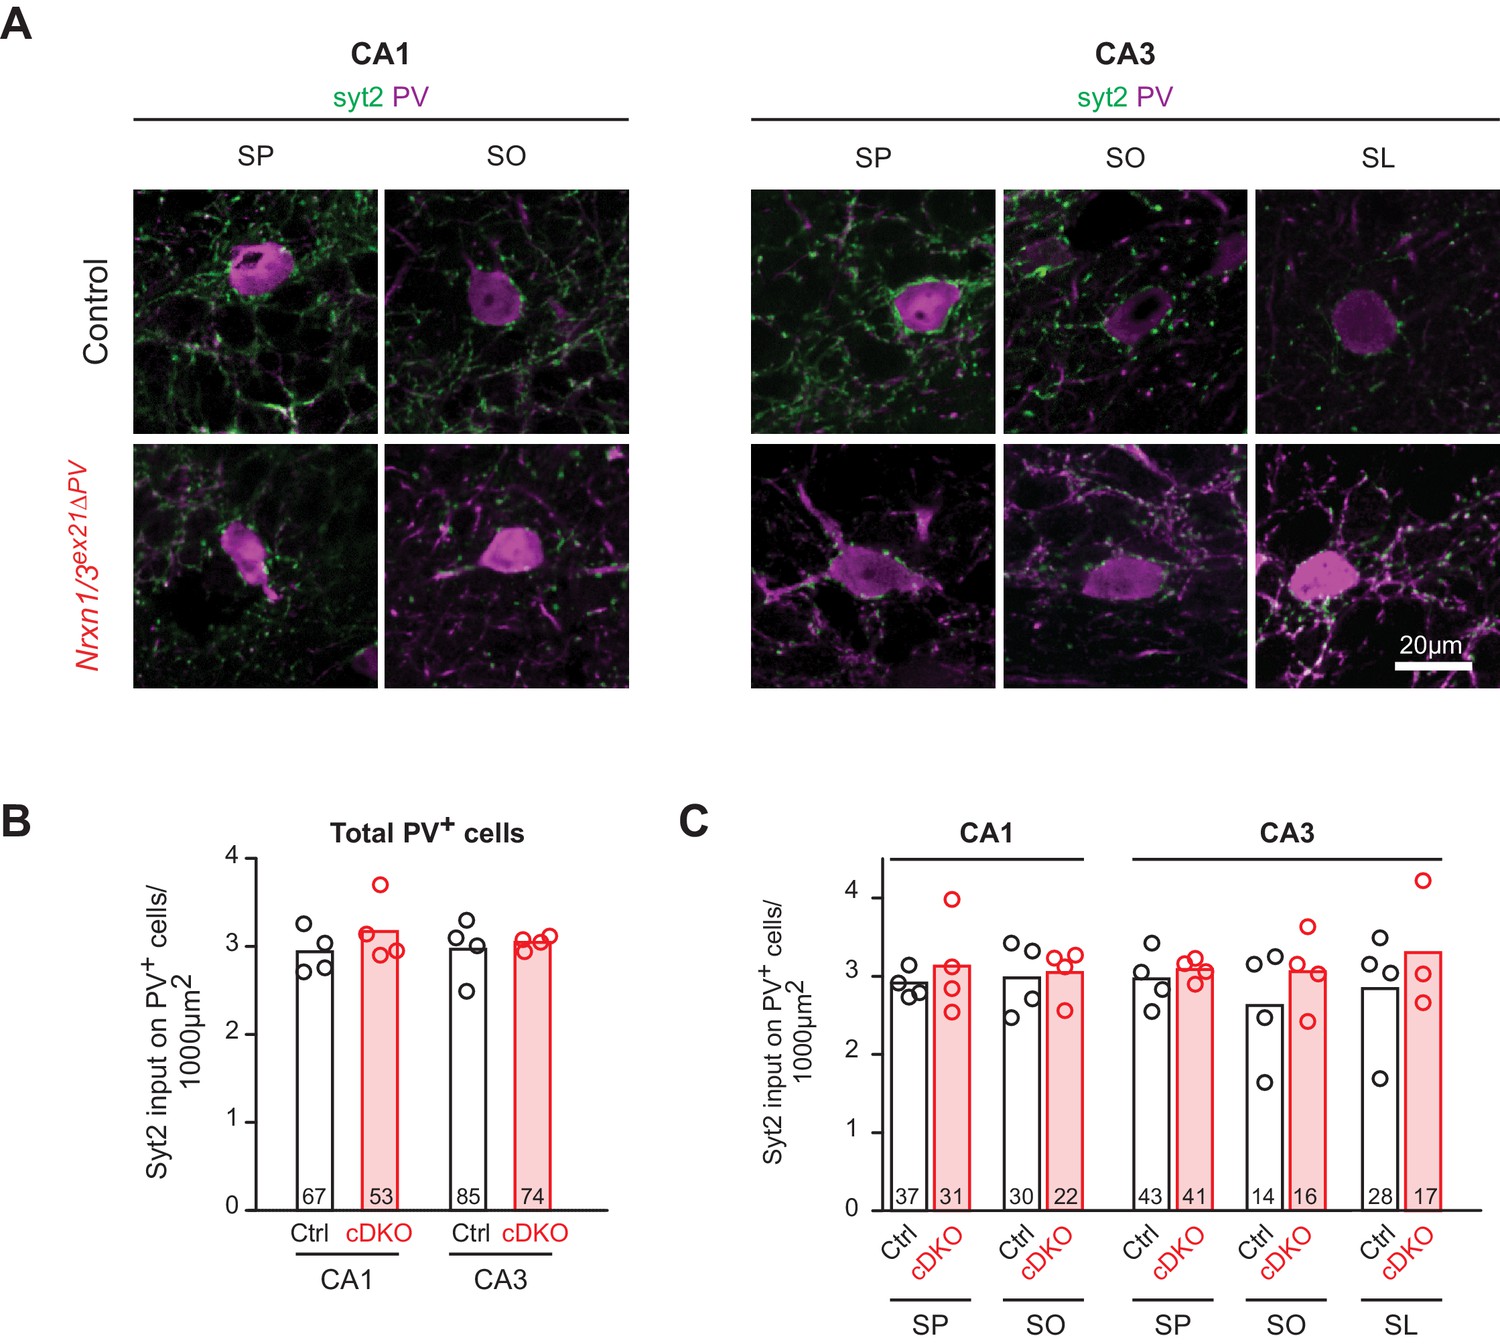
(A) The density of PV+ synaptic inputs onto somata of PV+ cell in control and Nrxn1/3ex21 PV+ cell specific knock-out mice was examined by immunohistochemistry with anti-Synaptotagmin2 (Syt2, in green) and anti-PV (in magenta) antibodies at postnatal day 24–26 in the CA1 and CA3. Moreover PV+ interneurons were also classified according to their laminar position (SP: stratum pyramidale, SO: stratum oriens, SL: stratum lucidum, mean). (B) Quantification of Syt2 inputs onto somata of PV+ interneurons in CA1 or CA3. Single dots represent means per animals (n = 4 mice for control and Nrxn1/3ex21 mice, the total number of PV+ interneurons is indicated in the graph bars, mean). (C) Quantification of Syt2 inputs onto same PV+ interneurons soma as in (B) which here are grouped according to their laminar position in the CA1 or CA3. Single dots represent means per animals (n = 4 mice for control and Nrxn1/3ex21 mice, the total number of PV+ interneurons is indicated in the graph bars, mean).
Figure 6
Analysis of PV hippocampal network activity in Nrxn1/3ex21ΔPV conditional knock-out mice.
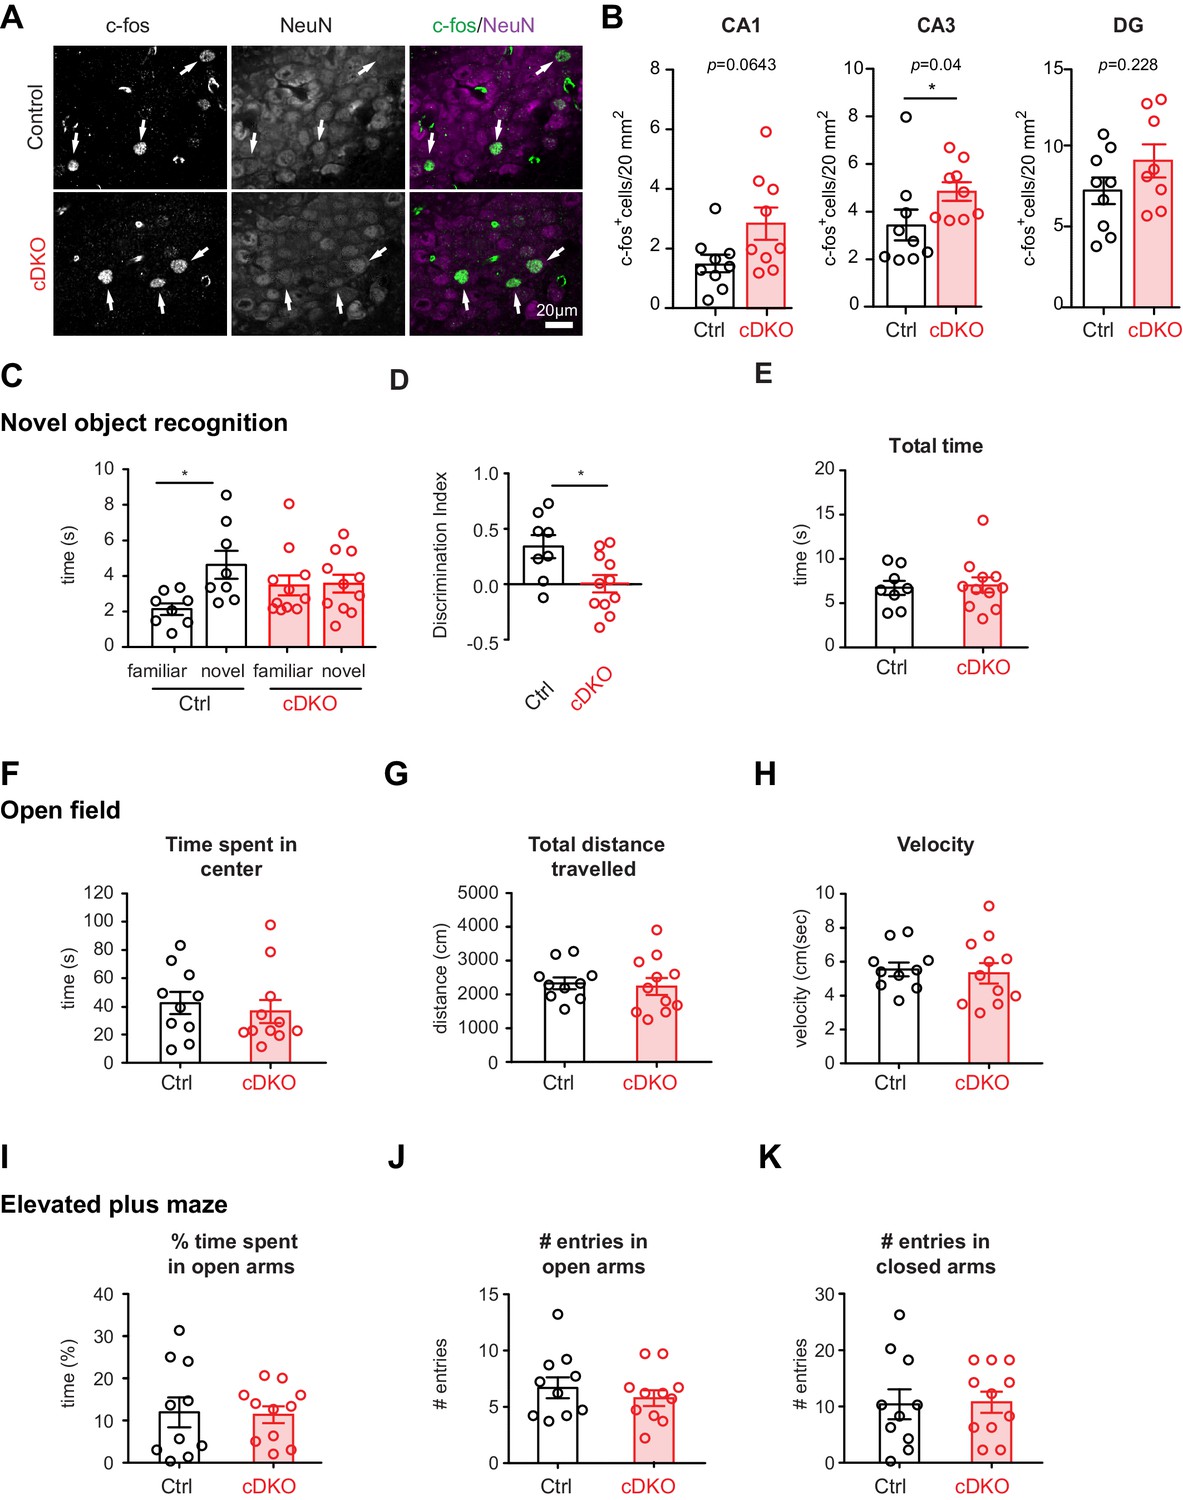
(A) Density of c-fos+ cells per 20 mm2 in control and Nrxn1/3ex21ΔPV mice in the CA3 region. c-fos+ cells (green in overlay) co-localize with neuron-specific marker NeuN (magenta in overlay). Arrows indicate examples for c-fos+ neurons. (B) Quantification of control and Nrxn1/3ex21ΔPV c-fos+ neurons in CA1, CA3 and DG regions. Single dots in the graph represent mean per animal (n = 9 for control and Nrxn1/3 ex21ΔPV mice, mean ± SEM, Mann Whitney test, ***p<0.001, **p<0.01, *p<0.05). (C) Novel object recognition test. Exploration time for familiar versus novel objects. Single dots in the graph represent single animals (n = 8 control and 11 Nrxn1/3 ex21ΔPV mice, mean ± SEM, Mann Whitney test, p=0.0086, ***p<0.001, **p<0.01, *p<0.05). (D) Discrimination index for familiar versus novel object for the same animals as in (C) (mean ± SEM, Mann Whitney test, p=0.285, ***p<0.001, **p<0.01, *p<0.05). (E) Nrxn1/3ex21ΔPV mice do not differ in the total object exploration time in the object recognition assay. Single dots in the graph represent single animals (mean ± SEM). (F–H) Locomotor activity of Nrxn1/3ex21ΔPV mice in open field. Mice were allowed to explore a square arena (50 cm x 50 cm x 25 cm) for 7 min. (F) The time in center, (G) the total distance traveled and (H) velocity are quantified. Single dots in the graph represent single animals (n = 10 control and 11 Nrxn1/3 ex21ΔPV mice, mean ± SEM). (I–K) In the elevated plus maze Nrxn1/3 ex21ΔPV show similar behavior as cre-negative littermate control mice. Single dots in the graph represent single animals (n = 10 control and 11 Nrxn1/3 ex21ΔPV mice, mean ± SEM).
Tables
Table 1
Commercially available gene expression assays for Gapdh, Nrxn1,2,3 (Applied Biosystems).
| Gapdh | Mm99999915g1 |
|---|---|
| Nrxn1 pan | Mm00660298_m1 |
| Nrxn2 pan | Mm01236851_m1 |
| Nrxn3 pan | Mm00553213_m1 |
Table 2
Custom gene expression assays from TIB Molbio (Berlin).
| Nrxn one alpha-F | 5'- CAG CAC AAC CTG CCA AGA −3' |
|---|---|
| Nrxn one alpha-R | 5'- GTC CCA GGG TCA TTG CAG A −3' |
| Probe Nrxn1 alpha | 6FAM-TGG GCC ACT GAA GGA AGT CAT GCT–BBQ |
| Nrxn one beta-F | 5'- CCT GGC CCT GAT CTG GAT AGT −3' |
| Nrxn one beta-R | 5'- TTG TCC CAG CGT GTC CG −3' |
| Probe Nrxn1 beta | 6FAM-CTG AAT GAT GCT TGC TGC TGC CA -BBQ |
| Nrxn two alpha-F | 5'- CAC CAC CTG CAC CGA AGA G −3' |
| Nrxn two alpha-R | 5'- CCG GAG GCA CTG TCC ACT-3’ |
| Probe Nrxn2 alpha | 6FAM- CCC CCT TCC CGA AGA TGT ATG TGG TCC -BBQ |
| Nrxn two beta-F | 5'- GTG CCC ATC GCC ATC AA −3' |
| Nrxn 2beta-R | 5'- TTG GAG GCG TTC ATT ATC AGT GTT −3' |
| Probe Nrxn2 beta | 6FAM- CCC CCT TCC CGA AGA TGT ATG TGG TCC -BBQ |
| Nrxn three alpha-F | 5'- CTG TGA CTGCTC CAT GAC ATC ATA TT −3' |
| Nrxn three alpha-R | 5'- CA GAG CGT GTG CTG GGT CT-3' |
| Probe three alpha | 6FAM- CGC TTT TCC CAA AGA TGT ATG TTG CAC CA -BBQ |
| Nrxn three beta-F | 5'- AAG CAC CAC TCT GTG CCT ATT TCT −3' |
| Nrxn three beta-R | 5'- CCA GGG GCG CTG TCA AT-3' |
| Probe Nrxn3 beta | 6FAM- CGC TTT TCC CAA AGA TGT ATG TTG CAC CA -BBQ |
Table 3
DNA Oligonucleotides used with SYBR Green-based real-time PCR.
| CamK2-F | 5'- GAG GAA CTG GGA AAG GGA G −3' |
|---|---|
| CamK2-R | 5'- GGT AAC CTA CCT CTG GCT G −3' |
| Cbln2 -F | 5’- AGA CAA ACT ATC CAG GTC AGC −3’ |
| Cbln2-R | 5’- CCT GGT AAC ATC CTG GTC TC −3’ |
| Cbln4-F | 5- TTTGATCAGATCCTGGTTAACG −3’ |
| Cbln4-R | 5- ACTATATTCCTTTCCTCGGT −3’ |
| Erbb4-F | 5'- ATC CCT GTG GCT ATA AAG ATC C −3' |
| Erbb4-R | 5'- CAT GAT CAG AGC CTC ATC CA −3' |
| Gfap-F | 5'- CTC GTG TGG ATT TGG AGA G −3' |
| Gfap-R | 5'- AGT TCT CGA ACT TCC TCC T −3’ |
| Gad1-F | 5'- GTA CTT CCC AGA AGT GAA GAC −3' |
| Gad1-R | 5'- GAA TAG TGA CTG TGT TCT GAG G −3' |
| Pvrl3-F | 5'- GTG ACT GTG TTA GTT GAA CCC −3' |
| Pvrl3-R | 5'- TGC TAC TGT CTC ATT CCC TC −3' |
| Pvalb-F | 5'- CATTGAGGAGGATGAGCTG −3‘ |
| Pvalb -R | 5'- AGTGGAGAATTCTTCAACCC −3’ |
| Vglut1-F | 5'- ACC CTG TTA CGA AGT TTA ACA C −3' |
| Vglut1-R | 5'- CAG GTA GAA GGT CCA GCT G −3' |
| Sam68-F | 5'- GGG AAG GGT TCA ATG AGA GA −3’ |
| Sam68-R | 5'- AAT GGG CAT ATT TGG GGT CT −3’ |
| Slm1-F | 5'- GAC CAA GAG GAA ACT CCT TGA A −3’ |
| Slm 1 R | 5'- GGC ATG ACT CAT CCG TGA ATA −3’ |
| Slm2-F | 5'- GGT CCG CGT GGC AAT TC-3’ |
| Slm2-R | 5'- CAT CCG GGC ATA TGC TTC T-3’ |
| Wsf1-F | 5'- CATCATTCCCACCAACCTG −3' |
| Wsf1-R | 5'- TAC TTC ACC ACC TTC TGG C −3' |
Table 4
DNA Oligonucleotides used for radioactive semi-quantitative and standard PCR.
| Nrxn1 AS2-F | 5'- tgg gat cag ggg cct ttg aag ca-3' |
|---|---|
| Nrxn1 AS2-R | 5'- gaa ggt cgg ctg tgc tgg gg −3' |
| Nrxn2 AS2-F | 5'- gca cga cgt ccg ggt tac cc-3' |
| Nrxn2 AS2-R | 5'- ggt cgg ctg tgt tgg ggc tg −3 |
| Nrxn3 AS2-F | 5'- tcc ggg gcc ttt gag gcc at-3' |
| Nrxn3 AS2-R | 5'- gcg gta ctt ggg ctt cca cca-3’ |
| Nrxn1 AS3-F | 5'- tgg agc tag atg cag gac gtg tga a −3' |
| Nrxn1 AS3-R | 5'- ttc ctc gcc gaa cca cac gc −3' |
| Nrxn2 AS3-F | 5' – ccc act cgc atg cac acg ga −3' |
| Nrxn2 AS3-R | 5'- tgc ccc gca aac agt gtc tcg −3' |
| Nrxn3 AS3-F | 5'- tgt cac agc gag cct atg ggc −3' |
| Nrxn3 AS3-R | 5'- tct ccg cac tac ccg gac gg −3' |
| Nrxn1 AS4-F | 5'- ctg gcc agt tat cga acg ct −3' |
| Nrxn1 AS4-R | 5'- gcg atg ttg gca tcg ttc tc −3' |
| Nrxn2 AS4-F | 5'- caa cga gag gta ccc ggc −3' |
| Nrxn2 AS4-R | 5'- tac tag ccg tag gtg gcc tt −3 |
| Nrxn3 AS4-F | 5'- cca gga atg ggg gaa atg ct −3' |
| Nrxn3 AS4-R | 5'- ttg tcc ttt cct ccg atg gc −3’ |
| Nrxn1 AS6-F | 5'- ctg gcc agt tat cga acg ct −3' |
| Nrxn1 AS6-R | 5'- gcg atg ttg gca tcg ttc tc −3' |
| Nrxn1 AS6-F | 5'- ctg gcc agt tat cga acg ct −3' |
| Nrxn1 AS6-R | 5'- gcg atg ttg gca tcg ttc tc −3' |
Download links
A two-part list of links to download the article, or parts of the article, in various formats.
Downloads (link to download the article as PDF)
Open citations (links to open the citations from this article in various online reference manager services)
Cite this article (links to download the citations from this article in formats compatible with various reference manager tools)
An alternative splicing switch shapes neurexin repertoires in principal neurons versus interneurons in the mouse hippocampus
eLife 5:e22757.
https://doi.org/10.7554/eLife.22757


